Abstract
In the process of power transformer risk assessment, the loss degree index is difficult to accurately quantify due to the influence of uncertain factors, leading to the deviation of risk judgment. A power transformer risk assessment method based on the three-parameter interval grey number decision-making is proposed. Firstly, the fault probability of the transformer is quantified based on the condition evaluation results. Secondly, considering the uncertainty of DG output and load, the Nataf transform and Cholesky decomposition were used to eliminate the correlation of random variables, and a three-point estimation method combined with a DC cut load model was introduced to calculate the probability distribution of the loss degree caused by the transformer fault. Finally, the origin moment of each order was obtained based on the calculation formula of risk value, and the risk probability distribution was obtained through the Cornish–Fisher series expanding. The decision method of the three-parameter interval grey number distance measure was used to judge the risk grade of the equipment. The results show that the proposed method fully considers the influence of uncertainty on equipment risk judgment, can realize the full use of the equipment risk value interval number to judge the risk, and avoids the decision-making defects of the traditional certain risk quantification method. Meanwhile, the influence of different factors on the risk evaluation results is in line with the actual operation condition of the transformer. The results also verify the effectiveness and accuracy of the proposed method, which provides a new judgment idea for power grid equipment risk quantitative assessment.
1. Introduction
With a high proportion of new energy access [1,2], the strong uncertainty and volatility of the power grid will lead to more extreme and drastic operating conditions for power equipment, and higher requirements are put forward for the safe and reliable operation of power equipment [3,4,5]. However, the power transformer is one of the key pieces of equipment in the power grid. How to accurately and effectively evaluate its risk grade not only provides a basis for the selection of equipment maintenance strategy but also has important significance for maintaining the stable operation of the system.
At present, the research on risk assessment methods for power transformers mainly focuses on certain decision-making methods, with the equipment fault probability as the main index. For example, based on fault tree analysis, a risk assessment model of the power transformer was constructed, and the overall risk of the equipment is obtained mainly from the probability of occurrence of each component. However, the risk factors considered are too individual, and cannot fully reflect the actual risk influence condition of the equipment [6,7]. A risk assessment model based on a health index was established and the influence of transformer fault on power grid economy and reliability is considered, but ignoring the influence of uncertain factors on the calculation of cutting load loss may lead to a high final quantified risk result [8]. A proportional risk model of aging load and healthy weather was proposed, which reflects the influence of different risk factors on the probability of equipment fault, but only judges the risk based on a single fault probability index, ignoring the loss of equipment fault [9]. Considering the problems existing in the traditional evaluation of the transformer risk index (TRI), a practical risk assessment method for power transformer groups was proposed, but the result factor is only calculated quantitatively according to relevant standards, which cannot reflect the influence of uncertain factors on the consequences caused by transformer fault [10]. The impact of the correlation between wind power and photovoltaic power generation on the operation risk of the outgoing transformer is considered and the risk is reduced by adjusting the correlation coefficient, but only the impact on the risk of equipment operation is considered and its consequences are ignored [11]. According to the guidelines, each risk index is calculated quantitatively and then the risk value of the transformer is obtained, but the influence of the power grid operation loss caused by equipment fault on the risk judgment is not considered [12]. The comprehensive risk assessment model of transformers was established to improve the accuracy and efficiency of evaluation, but the quantitative risk assessment is carried out only from the indexes of defect severity and fault probability, ignoring the deviation of equipment risk judgment caused by the influence of uncertain factors on operation loss and the value of the equipment itself [13]. A three-grade risk assessment model was constructed, but only the overall defect grade of the transformer is obtained according to the health index quantified by each grade model to represent the equipment risk condition [14]. The application of cloud theory to the transformer risk assessment method makes full use of the cloud model and can transform qualitative concepts into quantitative performance, but it is quantified to obtain the risk value represented by a certain value and then evaluate its grade [15,16,17]. The above methods rarely consider the influence of power grid operation loss caused by equipment fault on risk judgment and use a highly subjective certain decision-making method to evaluate the risk of power transformers. However, the loss of power grid operation is affected by uncertain factors, and the research on loss quantification is not deep enough. Therefore, in order to accurately characterize the risk of power transformers affected by the uncertainty index, it is necessary to further study, based on equipment fault probability, how to consider the operating loss and effectively and reasonably calculate the risk probability distribution and grade assessment of power transformers.
Given the shortcoming of the current methods, this paper studies transformer risk assessment based on [18]. Three-parameter interval gray number decision-making judgment is introduced into the risk assessment method for power transformers considering uncertainty and is compared with the traditional certain risk quantitative assessment method, which realizes the full use of the equipment risk value interval number to judge the risk and avoids the decision-making defects of the certain risk quantification method. The influence of different factors on the risk assessment results is in line with the actual operation condition of the transformer. Case analysis shows that the proposed method is effective and accurate, which provides a new judgment idea for power grid equipment risk quantitative assessment.
The structure of this paper is as follows: The risk assessment framework is constructed in Section 2. Quantification of risk indexes is studied in Section 3. The probability distribution of loss degree is calculated based on three-point estimation and the DC cutting load model in Section 4. The risk assessment method based on three-parameter interval grey number decision-making is studied in Section 5. The effectiveness and accuracy of the method are proven in Section 6. Conclusions are stated in Section 7.
2. Risk Assessment Framework
2.1. Transformer Risk Index
Risk refers to the uncertainty of future conditions and consequences, and the definition of risk varies slightly in different research fields. Referring to relevant literature and guidelines [6,7,8,9,10], it can be seen that equipment risk assessment refers to the quantitative analysis of fault probability based on the results of equipment condition and fault consequence (loss degree × equipment importance degree). It is a process of assessing the risks that equipment may face and cause and determining the corresponding risk grade of equipment. That is, the risk assessment model is mainly composed of two sub-models: the equipment fault probability model and the fault consequence model.
Considering the comprehensiveness of the risk index, the applicability of risk quantification, and the impact of uncertainty on operation loss, this paper determines the fault probability of equipment P, the importance degree of equipment E, and the loss degree Loss as the risk index of the system of this evaluation. The concrete evaluation index model is shown in Figure 1. The equipment risk value R can be expressed as:
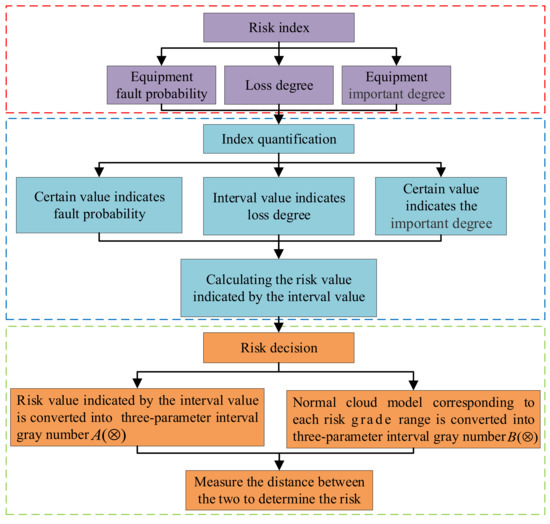
Figure 1.
Evaluation index model.
2.2. Classification of Transformer Risk Grades
At present, there is no unified standard for the classification of transformer risk grades. According to the existing research and guidelines [13,14,15,16,17], the transformer risk grade is divided into five grades—that is, , or low , normal , medium , large N4, major N5, respectively. To take into account the randomness and fuzziness at the boundary of risk grades, the normal cloud model is used to represent the risk ranges of each grade.
2.3. Cloud Matter-Element Model
The cloud matter-element model refers to replacing the v of matter-element R = (N, c, v) [19] with the normal cloud (Ex, En, He) [20], which is the obtained cloud matter-element model [21], as shown in Equation (2), where Ex is the expectation of the cloud, En is the cloud entropy, He is the super entropy, N is the research object, c is the object feature, and v is the feature value of c.
According to Equation (2), the goal of the cloud matter-element model is to solve the three digital characteristic values (Ex, En, He) of the cloud, where expectation Ex = cmax + cmin/2, super entropy He = En/10, and cloud entropy En is solved by the cloud entropy optimization algorithm [18,22]. The three parameters of the cloud model were determined, and the parameters of the transformer risk grade cloud model are shown in Table 1.

Table 1.
Normal cloud model parameters of transformer risk grades.
3. Quantification of Risk Index
3.1. Equipment Fault Probability
- (1)
- Normalize the proximity degree of each condition grade of the transformer. At this point, the value range of the transformer health index is [0, 100], and the calculation formula is as follows:where k is the number of grades and dk is the proximity degree of each condition grade.
- (2)
- Transform the transformer condition assessment vector information into the corresponding health index value [23]:where Dm is the condition evaluation vector and Dm (Zn) is the proximity degree of evaluation vector support for each grade.
- (3)
- The equipment health index is converted into equipment fault probability [24]; the specific formula is as follows:
3.2. Equipment Importance Degree
The value of the equipment itself is used as the characterization of the importance of the equipment, and according to the influence of different voltage grades and capacities of transformers, the value range is 1~10 to quantify the importance of equipment E, as shown in Table 2.
Table 2.
Different voltage grades and capacities corresponding to the reference value of equipment importance E.
3.3. Loss Degree
Taking into account the influence of wind power output and load uncertainty on power grid operation, the degree of loss is analyzed and quantified from the perspective of the power grid cutting load caused by equipment fault. In order to simplify the calculation of the cutting load, the DC cutting load model is adopted, and the specific formula is as follows:
Power balance constraint:
Unit operation constraint:
Cutting load constraint:
Line transmission power constraint:
where ND is the number of load nodes, is the cutting load of each node, and is the total cutting load of the system; the meanings of other variables can be found in [8].
When the cutting load is certain, the loss degree caused by transformer fault is:
where θ is the risk value of the unit load and θ = China’s GDP in a certain year/electricity consumption in the corresponding year. In this paper, China’s GDP in 2020 was CNY 101,598.62 billion and its electricity consumption was CNY 75,110 billion kWh, so θ = 13,527 RMB/(MWh).
Considering the uncertainty of wind power output and load fluctuation, a probabilistic power flow model based on three-point estimation is introduced to calculate the probability distribution of the loss degree.
4. Probability Distribution of Loss Degree Based on Three-Point Estimation Method
4.1. Uncertain Variables Model
4.1.1. Probabilistic Model of Load
It is generally assumed that load fluctuations follow normal distribution [25], and the probability density function (PDF) is shown in Equation (14):
where and represent the active power and reactive power of the load, respectively; and represent the mean values of the active and reactive power, respectively; and and represent the standard deviations of the active and reactive power, respectively.
4.1.2. Probabilistic Model of Wind Power Generation
Wind speed PDF follows Weibull distribution [26], which is as follows:
where v, k, and c represent wind speed, shape parameter, and scale parameter, respectively.
The relationship between the actual active power output of wind power and wind speed is shown in Equation (16):
where , , and represent cut-in wind speed, rated wind speed, and cut-out wind speed, respectively, and and represent the actual output power and rated power of wind power, respectively.
4.2. Correlation Processing
In the actual operating system, there is often a certain correlation of wind power between and load between, so it is not suitable to directly perform a probabilistic power flow calculation. To eliminate the correlation between random variables, the Nataf transform is used to map the input correlation non-normal random variables into independent standard normal random variables. The specific steps of correlation processing are as follows:
- (1)
- Supposing the input n correlation non-normal random variables are , the correlation coefficient matrix is and the corresponding element is , which can be made certain by Equation (17):where is the covariance of variables and , and and represent the standard deviations of variables and , respectively.
- (2)
- Supposing the independent standard random variables are Y and its correlation coefficient matrix and corresponding elements are represented by and respectively, variables X and Y satisfy the following conversion relation:where and represent the inverse distribution functions and the cumulative distribution functions of X, respectively. and satisfy the following formula:
The calculation using the above formula is too complicated, and the correlation coefficient between wind power is usually calculated by empirical formula [27].
- (3)
- The obtained is a positive definite matrix. By Cholesky decomposition can be obtained and the lower triangular matrix G can be obtained. The independent random variable is obtained by using .
4.3. Three-Point Estimation Method
Supposing the expectation and standard deviation of the random variable are represented by and respectively, three sampling points are selected to represent the expectation of and each point in the left and right field of expectation, denoted as . The expressions are as follows:
where is the position coefficient of the k sampling point of the random variable . The position coefficient and the weight coefficient can be expressed as
where is the skewness coefficient of —when is the larger, deviates greatly from the standard normal distribution; is the kurtosis coefficient—when is smaller, the value of is more concentrated near the expected value; and when , the distribution of is consistent with the steepness of the standard normal distribution. Because the standard normal distribution ; , can be obtained from Equation (21).
After determining the value of each sampling point and its corresponding weight coefficient, and because the expected value of the sampling point of each random variable has been included, n − 1 points are repeated, whereas the three-point estimation method has 3n sampling points and only 2n + 1 deterministic power flow calculation is required. Therefore, the system cutting load can be obtained by 2n + 1 deterministic DC power flow calculation and , and further obtain the probability distribution of loss degree.
5. Risk Assessment Method Based on Three-Parameter Interval Grey Number Decision-Making
5.1. Risk Probability Interval
After the equipment fault probability P, equipment importance E, and loss degree are certain, the risk value R can be obtained from Formula (1), and the l order origin moment of the output variable R can be made certain by Formula (22).
The origin moments of each order of the output variable R are calculated, and its probability density function (PDF) and the cumulative distribution function (CDF) are obtained by expanding the Cornish–Fisher series [28]:
where represents the inverse accumulative distribution function of , . The cumulative distribution F(z) of can be obtained by .
Since the transformer risk probability is given in the form of PDF and CDF, to fully consider the impact of uncertainty on risk judgment, the risk probability is expressed as an interval value—that is, R is represented by the corresponding interval of three sampling points: R = [,,]. The three-parameter interval grey number distance measure decision-making method is introduced to judge transformer risk grade by using this interval value.
5.2. Three-Parameter Interval Grey Number Decision-Making
The three-parameter interval grey number refers to the most likely value of the given grey number (center of gravity)—namely, the interval grey number [29] can be written as .
Assume that and are two three-parameters interval grey numbers, where are the most likely values, and are the possible lower limit values, and and are the possible upper limit values. The distance between A(⨂) and B(⨂) [30] is
where represents the risk preference of the decision-maker, . When , it indicates that the decision-maker is risk-averse (tends to use the left endpoint to measure the distance between gray numbers). When , it means that the decision-maker is risk-seeking (tends to use the right endpoint to measure the distance between gray numbers). When , it indicates that the decision-maker is risk-neutral (tends to comprehensively consider the endpoints on both sides to measure the distance between gray numbers). To fully consider the impact of the fluctuation of risk value on risk judgment caused by uncertainty, this paper takes .
Referring to the decision-making method of the three-parameter interval grey number distance measure, this paper uses expectation to represent the most likely value and represent the upper and lower limits of each point in the left and right fields of expectation, respectively. The steps are as follows: (1) Taking the interval corresponding to the three sampling points on the PDF obtained by Formula (23) as the three-parameter interval gray number , = R= [,,]; (2) according to the expression of A(⨂),the normal cloud model corresponding to each risk grade range is converted into a three-parameter interval gray number B(⨂), so ; and (3) the risk grade of the equipment is determined by measuring the distance d(A,B) between A(⨂) and B(⨂).
5.3. Risk Assessment Process
This paper proposes a power transformer risk assessment method based on three-parameter interval grey number decision-making, and the detailed assessment process is shown in Figure 2.
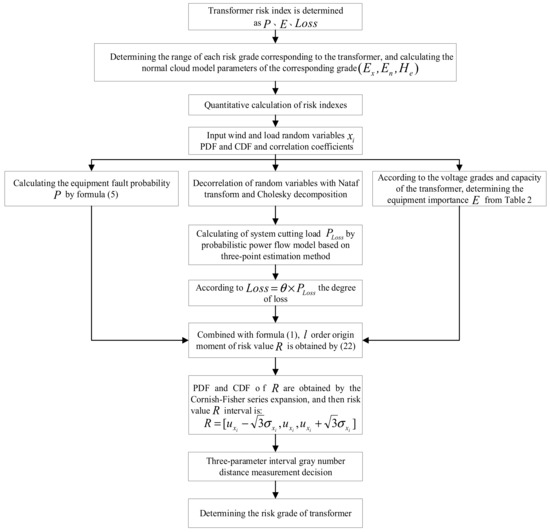
Figure 2.
Risk assessment process for a power transformer.
- (1)
- According to the existing research and relevant guidelines, the selection of equipment fault probability P, equipment importance E, and loss degree Loss are used as risk indexes in the paper, the transformer risk is divided into five grades (N1~N5), and the corresponding risk range of each grade is represented by the normal cloud model, as shown in Table 1.
- (2)
- The evaluation results based on [18] and the equipment fault probability P are calculated by Equations (3)~(6).
- (3)
- According to the voltage grades and capacity of the transformer, the equipment importance E was determined as shown in Table 2.
- (4)
- The PDF and CDF of random variable and their correlation coefficients are input, and the correlation of random variables is eliminated through the Nataf transformation and Cholesky decomposition.
- (5)
- The system cutting load is calculated by the probabilistic power flow model based on the three-point estimation method, the loss degree is determined by Formula (13), and the risk value R is obtained according to Formula (1).
- (6)
- According to Formula (22), the origin moments of each order of the output variable R is obtained, and then the PDF and CDF are obtained by the Cornish–Fisher series expansion—that is, = R = [,,] and .
- (7)
- The three-parameter interval gray number distance measurement formula is introduced as Formula (24), and the final risk grade of the transformer is judged by measuring the distance between A(⨂) and B(⨂).
6. Case Analysis
The effectiveness and accuracy of the proposed method were verified by taking an actual power system in a certain area as an example, and it was implemented based on MATLAB simulation software. The generator and load parameters are shown in Table 3 and Table 4, respectively; the total load of the system was 1188 MW; and the transformer parameters are shown in [18], as well as in Table 5. To simplify the system load, the load power factor of each node was assumed to be 0.75 and the correlation coefficient between loads was 0.8. Assuming that two wind turbines with an installed capacity of 100 MW and 80 MW were connected to nodes 11 and 13 of the system, respectively; their correlation coefficient was 0.7; and operation with a constant power factor was 1; the cut-in wind speed was 4 m/s, rated wind speed was 15 m/s, cut-out wind speed was 25 m/s, scale parameter was 1.8, and shape parameter was 7. The system structure diagram as in Figure 3, the numbers marked in Figure 3 represent the number of nodes in the system.
Table 3.
Generator node parameters.
Table 4.
Load node parameters.
Table 5.
Transformer parameters.
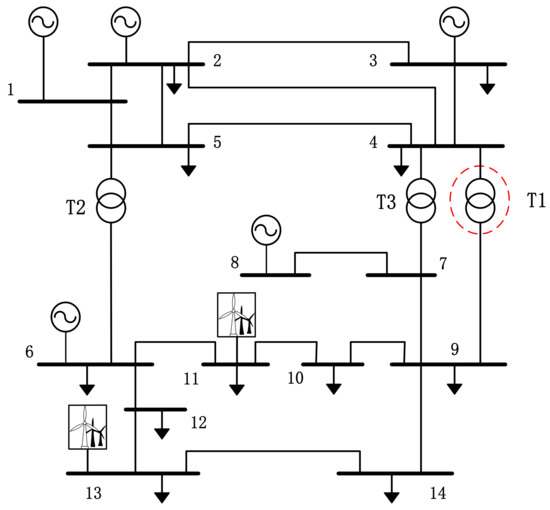
Figure 3.
System structure diagram.
6.1. Index Solution and Method Validation
Based on the condition evaluation results of Case 1 (Transformer 1) and Case 2 (Transformer 2) in [18] (as in Appendix A) and the transformer parameters in Table 5, the equipment fault probability and importance of the equipment could be obtained from Equations (3)–(6) and from Table 2, as shown in Table 6.
Table 6.
Transformer corresponding to equipment fault probability and importance.
Supposing Transformer 1 installation at T1, as in Figure 3 in the red dotted line part, the loss of power grid operation caused by the faulty exit of T1 was affected by wind power and load uncertainty, with the wind power probability model and load probability model characterizing the uncertainty and the introduction probability model of the three-point estimation method calculating the PDF and CDF of the system loss, as shown in Figure 4.
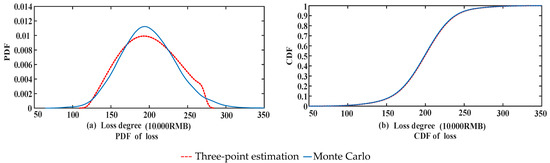
Figure 4.
PDF and CDF of loss degree caused by Transformer 1 fault.
To verify the accuracy of the algorithm, by contrast, the expectation and standard deviation of 20,000 Monte Carlo simulations (MCS) were used as the benchmark. The results are shown in Table 7.
Table 7.
Loss degree error comparison.
It can be seen from Figure 4 that the PDF of loss obtained by three-point estimation was basically consistent with Monte Carlo. It can be seen from Table 7 that the error between the three-point estimation and Monte Carlo was very small, but Monte Carlo calculation required 255.29 s, whereas the three-point estimation only needed 0.94 s, indicating that the algorithm met the accuracy and the calculation speed was far superior to Monte Carlo. Comparisons with Monte Carlo will not be discussed later.
The risk probability distribution of Transformer 1 can be obtained from Equation (23), as shown in Figure 5, so and , converting the normal cloud model corresponding to each risk grade range into a three-parameter interval gray number B(⨂), as shown in Table 8. The distance between A(⨂) and B(⨂) was measured by Equation (24) to judge the corresponding risk grade of the equipment. The evaluation results are shown in Table 9.
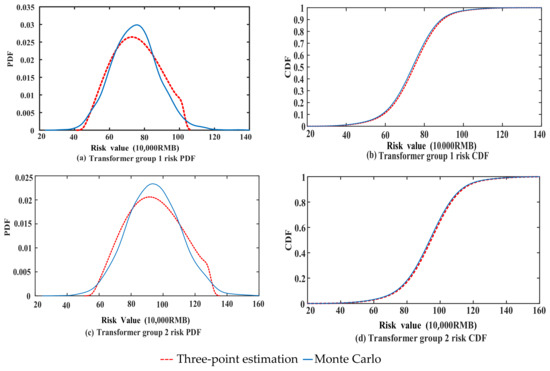
Figure 5.
PDF and CDF of Transformer 1 risk.
Table 8.
The grade normal cloud model corresponds to grey number of the three-parameter interval.
Table 9.
Evaluation results of three-parameter interval grey number decision-making.
Analysis of the first group of test results: The distance between three-parameter interval grey numbers A(⨂) and B(⨂) satisfied the relation , and judging from the grey number decision of the three-parameter interval, the transformer belongs to the medium-risk . The actual risk of the transformer is that the system was seriously affected, with high property loss—that is, medium risk.
Analysis of the second group of test results: The distance between three-parameter interval grey numbers A(⨂) and B(⨂) satisfied the relation , although the distance value of was the smallest, the distance value of was the second smallest, and it can be seen that the transformer had the tendency to transfer from medium-risk to large-risk , which should be large-risk on the whole. The actual risk of the transformer is that the system was seriously affected and the property loss was large—that is, large risk. In the two evaluations, the results are in line with the actual transformer risk, which verifies the effectiveness of the proposed method.
6.2. Analysis of Evaluation Measures
To illustrate the effectiveness and accuracy of the proposed method (represented by ③), it was compared with the certain risk assessment method (that is, quantitative assessment of risk without taking into account the impact of uncertainty on the loss of power grid operation, represented by ①), and uncertainty—but only the expectation of risk probability—was used to quantitatively assess risk (represented by ②) for comparative analysis. The assessment results of the different methods are shown in Table 10.
Table 10.
Comparison of the evaluation results of the different methods.
Analysis of the first group of test results: When using method ① to evaluate, the risk condition of the transformer was overestimated, resulting in a waste of equipment maintenance resources. Since the impact of uncertainty on the loss of power grid operation caused by transformer fault was not taken into account, the calculated loss was often larger than the loss caused by the actual fault of the equipment, the final quantified risk value was too high, and the risk judgment result was biased; when method ② was used to evaluate, the evaluation result was consistent with method ③.
Analysis of the second group of test results: When using method ② to evaluate, the tendency of the transformer risk to transfer to large risk was underestimated, which is not conducive to the arrangement of the maintenance sequence. Only the expectation of risk probability to certain quantitative was represented by the equipment risk condition—in essence, it is a certain risk quantification method that leads to deviations in its risk judgment. When using method ③ to evaluate, the risk value was based on the expectation, and each point in the left and right fields as the gray number A(⨂) of the three-parameter interval judged the risk—that is, it was represented by the interval corresponding to the three sampling points, comprehensively considering the influence of uncertainty on the fluctuation of the risk value and using the interval number to determine the risk grade, which made up for the deficiencies in method ① and method ②, and the obtained results were more in line with the actual condition of the equipment, which proves the effectiveness and accuracy of the proposed method.
In order to further verify the effectiveness and accuracy of the proposed method, a comparative analysis was conducted with the methods in [8,23], and the results are shown in Table 11.
Table 11.
Comparison of the evaluation results.
It can be seen from Table 11 that when the method of [8] was used to judge, the trend of transformer risk changes was overestimated in the first group of tests. Although this method takes into account the loss of power grid operation caused by equipment fault, it does not consider that the loss of power grid operation is affected by uncertain factors, resulting in the high loss obtained by quantification, which affects the final risk decision. When the method of [23] was used to judge, the trend of equipment risk changes was overestimated in both groups of tests. The quantitative calculation of losses in this method is affected by statistical data and expert experience, which have a great influence on the subjectivity, and the influence of uncertain factors in the system on its losses is ignored, resulting in a large change in the quantified loss, which in turn leads to a large change in the quantified risk value obtained from the two tests. When the proposed method in this paper was used to judge, the two evaluation results were more in line with the actual situation of the equipment, the influence of uncertainty on the risk judgment was fully considered, and the risk was represented by the interval value, which realized the use of the equipment risk value interval to determine the risk, which avoids the defects of the certain decision-making methods in [8,23], fully considers the influence of uncertain factors on the risk determination of the transformer, and is more suitable for risk decision-making under the actual operating environment of the equipment, thus verifying the effectiveness and accuracy of the proposed method.
6.3. Analysis of Influence Factors
The influence of each factor on the judgment of the risk results were analyzed in terms of four aspects: equipment fault probability, equipment importance, loss degree, and wind power access position.
- (1)
- To discuss the influence of different failure probabilities of the equipment on the evaluation results, the evaluation results obtained from the two groups of data for Transformer 1 in Table 6 corresponding to different fault probabilities were analyzed, as shown in Table 12.
Table 12. Comparison of the evaluation results of different fault probabilities.
It can be seen from Table 12 that the fault probabilities corresponding to the two groups of test data for the same transformer were different, resulting in a large difference in the risk assessment results, indicating that different fault probability has a greater impact on the final risk judgment.
- (2)
- To discuss the impact of different equipment importance on the evaluation results, the first group of data for Transformer 1 and the first group of data for Transformer 2 in Table 6 were used to analyze the evaluation results of different equipment importance degrees, as shown in Table 13.
Table 13. Comparison of the evaluation results of different equipment importance.
It can be seen from Table 13 that the evaluation results corresponding to the importance of different equipment varied greatly, indicating that the importance of different equipment has a greater impact on the final risk judgment when the difference in fault probability of different equipment is small.
- (3)
- To discuss the impact of different operating loss degrees on the risk, the evaluation results corresponding to T2 fault and T1 fault of Transformer 1 were analyzed, as shown in Table 14.
Table 14. Comparison of the evaluation results at different fault positions.
It can be seen from Table 14 that the evaluation results at the T2 fault position and at the T1 fault position were consistent, but the risk value of the T2 fault was significantly greater than that of the T1 fault—that is, the degree of system loss was more serious under the condition of the same equipment fault probability and equipment importance, indicating that the impact of the equipment fault at different positions on the system is different to some extent.
It can be seen from Figure 3 of the system structure that when the equipment fault was at T2, it obviously had a greater impact on the system than when the equipment fault was at T1, which indicates that the method considers that equipment fault at different positions has different impacts on the system, which is consistent with the actual situation of the system.
- (4)
- The influence of different access positions of wind turbines on the evaluation results were discussed and the evaluation results corresponding to wind turbine access system nodes 5 and 9, nodes 11 and 9, and nodes 11 and 13 when the fault was at T1 were analyzed, as shown in Table 15.
Table 15. Comparison of evaluation results of different wind turbines access positions.
It can be seen from Table 15 that the risk evaluation results of the first group of Transformer 1 in different access wind turbines were consistent, but when the wind turbines access nodes 5 and 9 and nodes 11 and 9 were compared to access nodes 11 and 13 in the equipment fault probability and importance under the same conditions, the corresponding losses decreased, having a certain influence on different access positions on the system loss. In the second group of Transformer 1, the risk evaluation results of connected wind turbines at nodes 5 and 9 and nodes 11 and 9 were completely inconsistent with those at nodes 11 and 13, indicating that different connected positions of the wind turbines have a great influence on equipment risk judgment. It can also be seen from the table that although the risk evaluation results obtained by connecting the wind turbines at nodes 5 and 9 and nodes 11 and 9 in the two evaluations were consistent, the change in risk interval value was still affected to some extent.
Case analysis shows that the proposed method fully considers the influence of uncertain factors on the risk determination of the transformer and is more suitable for risk decision-making under the actual operating environment of the equipment. The obtained evaluation results are in line with the actual situation of the transformer, which verifies the effectiveness and accuracy of the proposed method.
7. Conclusions
Given that the risk assessment method of power transformers mainly focuses on the certain decision-making method with the equipment fault probability as the main index, and that the lack of consideration of the influence of the power grid operation loss due to uncertainty leads to the deviation of its risk judgment, a power transformer risk assessment method based on the three-parameter interval gray number decision-making was proposed, and the calculation and analysis were carried out in MATLAB simulation software. The following conclusions can be obtained:
1. Considering that the loss degree is influenced by uncertain factors, the probabilistic power flow model based on the three-point estimation method calculates loss degree probability distribution and uses the interval numbers to characterize its uncertainty, which avoids the deviation of risk judgment caused by the difficulty of the accurate quantification of the loss degree index.
2. The three-parameter interval gray number decision-making is introduced into the risk assessment of power transformers considering uncertainty, which realizes the full use of the equipment risk value interval number to determine the risk and avoids the decision-making defects of the traditional certain risk quantification method.
3. The influence of different factors on the risk assessment results is discussed, which is in line with the actual operation condition of the transformer.
To sum up, compared with traditional certain quantitative risk assessment methods, the proposed method can effectively and accurately evaluate the transformer risk condition, which provides a new judgment idea for power grid equipment quantitative risk assessment.
The proposed method in this paper considers the influence of uncertainty on the risk judgment of the transformer, but only the loss degree of the three risk indexes is characterized by interval number, whereas other indexes are still quantified by certain values. How to reasonably convert equipment fault probability and equipment importance into interval numbers and judge the risk of the transformer according to the interval numbers of the three indexes still needs to be studied further.
Author Contributions
Formal analysis, H.Y.; investigation, W.X. and K.X.; supervision, Y.Y. and X.Y.; methodology, X.Z. and L.X. All authors have read and agreed to the published version of the manuscript.
Funding
This work was supported by National Natural Science Foundation of China (NSFC) (52067004). This work was supported by Science and Technology Foundation of Guizhou Province ([2019]1128, [2019]1058).
Conflicts of Interest
The authors declare no conflict of interest.
Appendix A
Table A1.
Case 1 (Transformer 1) and Case 2 (Transformer 2) in [18].
Table A1.
Case 1 (Transformer 1) and Case 2 (Transformer 2) in [18].
| Test Object | Test Group | Condition Grade | Evaluation Result | ||||
|---|---|---|---|---|---|---|---|
| H1 | H2 | H3 | H4 | H5 | |||
| Transformer 1 | First group | 0.8203 | 0.8779 | 0.8380 | 0.7033 | 0.6819 | Overall attention condition |
| Second group | 0.6968 | 0.7342 | 0.7522 | 0.9176 | 0.7857 | Abnormal condition | |
| Transformer 2 | First group | 0.7998 | 0.8512 | 0.8655 | 0.7327 | 0.6987 | Attentional condition |
| Second group | 0.7058 | 0.7330 | 0.8067 | 0.8104 | 0.8091 | Abnormal condition | |
References
- Du, W.; Bi, J.; Wang, T.; Wang, H. Impact of grid connection of large-scale wind farms on power system small-signal angular stability. CSEE J. Power Energy Syst. 2015, 1, 83–89. [Google Scholar] [CrossRef]
- Shu, Y.; Tang, Y. Analysis and recommendations for the adaptability of China’s power system security and stability relevant standards. CSEE J. Power Energy Syst. 2017, 3, 334–339. [Google Scholar] [CrossRef]
- Soni, R.; Mehta, B. Review on asset management of power transformer by diagnosing incipient faults and faults identification using various testing methodologies. Eng. Fail. Anal. 2021, 128, 105634. [Google Scholar] [CrossRef]
- Murugan, R.; Ramasamy, R. Understanding the power transformer component failures for health index-based maintenance planning in electric utilities. Eng. Fail. Anal. 2019, 96, 274–288. [Google Scholar] [CrossRef]
- Islam, M.M.; Lee, G.; Hettiwatte, S.N. A review of condition monitoring techniques and diagnostic tests for lifetime estimation of power transformers. Electr. Eng. 2018, 100, 581–605. [Google Scholar] [CrossRef]
- Chen, J.M.; Bi, T.S.; Sun, M. Study on quality risk assessment for power transformer based on fault tree analysis. In Proceedings of the 2016 China International Conference on Electricity Distribution (CICED), Xi’an, China, 10–13 August 2016; pp. 1–4. [Google Scholar]
- Chen, J.; Li, Y.; Zhao, H.; Wu, L.; Wei, F.; Qin, X. Study on risk assessment for power transformer. In Proceedings of the 2016 IEEE International Conference on Power System Technology (POWERCON), Wollongong, Australia, 28 September–1 October 2016; pp. 1–4. [Google Scholar]
- Lin, D.; Xu, Y.Y.; Liang, Y.; Li, Y.; Liu, N.; Zhang, G.J. A risk assessment method of transformer considering the economy and reliability of power network. In Proceedings of the 2017 1st International Conference on Electrical Materials and Power Equipment (ICEMPE), Xi’an, China, 14–17 May 2017; pp. 594–597. [Google Scholar]
- He, D.; Zhang, Y.; Guo, C.; Zhang, J.; Liu, H.; Duan, Y. Failure probability model of transmission and transformation equipment for risk assessment. In Proceedings of the 2016 IEEE Power and Energy Society General Meeting (PESGM), Boston, MA, USA, 17–21 July 2016; pp. 1–5. [Google Scholar]
- Andrés, A.; Quote, R.; Gómez, H.D.; Molina, J.D.; Moreno, G. A Practical method for risk assessment in power transformer fleets. DYAN 2017, 84, 11–18. [Google Scholar]
- Chen, Q.; Xiong, X.; Xiao, C.; He, L.; Pu, Y.; Chen, H. The Probabilistic Assessment of Outgoing Transformer Operation Risk Considering the Correlation Between Wind Power and Photovoltaic. In Proceedings of the 2019 IEEE Sustainable Power and Energy Conference (iSPEC), Beijing, China, 21–23 November 2019; pp. 1785–1790. [Google Scholar]
- Suwanasri, T.; Suwanasri, C.; Phadungthin, R. Risk Assessment Based on Condition and Importance Criteria for Power Transformer in Thailand Transmission Network. IEEJ Trans. Electr. Electron. Eng. 2015, 10, 18–27. [Google Scholar] [CrossRef]
- Taengko, K.; Damrongkulkamjorn, P. Risk assessment for power transformers in PEA substations using health index. In Proceedings of the 2013 10th International Conference on Electrical Engineering/Electronics, Computer, Telecommunications and Information Technology, Krabi, Thailand, 15–17 May 2013; pp. 1–6. [Google Scholar]
- Liu, H.; Wang, Z.; Wang, X. Transformer risk assessment model under condition based maintenance. In Proceedings of the 2017 IEEE 2nd Information Technology, Networking, Electronic and Automation Control Conference (ITNEC), Chengdu, China, 15–17 December 2017; pp. 1–5. [Google Scholar]
- Wang, Y.; Zhao, X.; Bian, J.; Liao, R.; Yang, L. Cloud model-based risk assessment of power transformer. In Proceedings of the 2012 International Conference on High Voltage Engineering and Application, Shanghai, China, 17–20 September 2012; pp. 544–547. [Google Scholar]
- Xiong, W.; Zhang, H.; Xie, Z.; Han, X.; Lin, X. Risk assessment of power transformer potential fault based on cloud theory and entropy weight methods. Electr. Power Autom. Equip. 2018, 38, 125–130. [Google Scholar]
- Bian, J.; Sun, X.; Yang, S.; Wang, M. Risk Assessment and Working-out of Maintenance Strategy for Power Transformer Based on Cloud Model. High Volt. Eng. 2015, 41, 3342–3347. [Google Scholar]
- Yu, H.; Yuan, W.; Wang, M.; Zhang, H.; Xiong, W.; Yuan, X.; Zou, X. Comprehensive Condition Assessment of Power Transformer Based on Asymmetric Nearness Degree Evidence Cloud Matter-element Model. Power Syst. Technol. 2021, 45, 3706–3713. [Google Scholar]
- Wang, M. A novel extension method for transformer fault diagnosis. IEEE Trans. Power Deliv. 2003, 18, 164–169. [Google Scholar] [CrossRef] [Green Version]
- Bagheri, M.; Zollanvari, A.; Nezhivenko, S. Transformer Fault Condition Prognosis Using Vibration Signals Over Cloud Environment. IEEE Access 2018, 6, 9862–9874. [Google Scholar] [CrossRef]
- Yu, H.; Yu, Y.; Wang, M.; Xiong, W.; Yuan, X.; Zou, X. A Power Transformer Condition Assessment Method Based on Fuzzy Nearness Degree and Improved Cloud Matter-element Model. In Proceedings of the 2021 IEEE 4th International Electrical and Energy Conference (CIEEC), Wuhan, China, 28–30 May 2021; pp. 1–6. [Google Scholar]
- Dong, J.; Wang, D.; Liu, D.; Ainiwaer, P.; Nie, L. Operation health assessment of power market based on improved matter-element extension cloud model. Sustainability 2019, 11, 5470. [Google Scholar] [CrossRef] [Green Version]
- Dong, M.; Zheng, H.; Zhang, Y.; Shi, K.; Yao, S.; Kou, X.; Ding, G.; Guo, L. A Novel Maintenance Decision Making Model of Power Transformers Based on Reliability and Economy Assessment. IEEE Access 2019, 7, 28778–28790. [Google Scholar] [CrossRef]
- Yang, H.; Zhe, Z.; Yin, X.; Han, J.; Yong, W.; Chen, G. A Novel Short-Term Maintenance Strategy for Power Transmission and Transformation Equipment Based on Risk-Cost-Analysis. Energies 2017, 10, 1865. [Google Scholar] [CrossRef] [Green Version]
- Xia, S.; Luo, X.; Chan, K.W.; Zhou, M.; Li, G. Probabilistic Transient Stability Constrained Optimal Power Flow for Power Systems With Multiple Correlated Uncertain Wind Generations. IEEE Trans. Sustain. Energy 2016, 7, 1133–1144. [Google Scholar] [CrossRef]
- Huang, D.; Li, H.; Cai, G.; Huang, N.; Yu, N.; Huang, Z. An Efficient Probabilistic Approach Based on Area Grey Incidence Decision Making for Optimal Distributed Generation Planning. IEEE Access 2019, 7, 93175–93186. [Google Scholar] [CrossRef]
- Liu, P.L.; Kiureghian, A.D. Multivariate distribution models with prescribed marginals and covariances. Probabilistic Eng. Mech. 1986, 1, 105–112. [Google Scholar] [CrossRef]
- Fan, M.; Vittal, V.; Heydt, G.T.; Ayyanar, R. Probabilistic Power Flow Studies for Transmission Systems With Photovoltaic Generation Using Cumulants. IEEE Trans. Power Syst. 2012, 27, 2251–2261. [Google Scholar] [CrossRef]
- Luo, D.; Mao, W.; Sun, H. Grey dominance-based rough set approach to decision system with three-parameter interval grey number. In Proceedings of the 2016 IEEE International Conference on Systems, Man, and Cybernetics (SMC), Budapest, Hungary, 9–12 October 2016; pp. 965–970. [Google Scholar]
- Li, Y.; Niu, Y.; Wang, W.; Li, B. Grey-incidence clustering decision-making method with three-parameter interval grey number based on regret theory. In Proceedings of the 2017 International Conference on Grey Systems and Intelligent Services (GSIS), Stockholm, Sweden, 8–11 August 2017; pp. 211–218. [Google Scholar]
Publisher’s Note: MDPI stays neutral with regard to jurisdictional claims in published maps and institutional affiliations. |
© 2022 by the authors. Licensee MDPI, Basel, Switzerland. This article is an open access article distributed under the terms and conditions of the Creative Commons Attribution (CC BY) license (https://creativecommons.org/licenses/by/4.0/).