1. Introduction
Since 2019, the COVID-19 virus has spread globally and is having a large impact on every industry and on people’s lives due to its unpredictable nature. With COVID-19, internet activity has become almost routine and people spend more time at home. In particular, the logistics industry is showing a markedly different pattern compared with before COVID-19. Due to the change in the logistics industry, the parcel shipping market has exponentially increased, and fast delivery services are operating. As a result, it is logistically difficult for supplies and circulation to meet the urban demand, especially in metropolitan areas. In fact, Korea’s parcel shipping volume amounted to 3.37 billion parcels in 2020, which represented a growth rate of about 140% compared to 2012. The number of individual parcel service that were used also increased, with a frequency of 9.74 per person per month in 2020, which represented an increase of 56.5% from compared 2019, before COVID-19. In particular, about 70% of the parcel shipping volume is concentrated in metropolitan areas. This is associated with an increase in the entry of freight vehicles into the metropolitan area, and social and environmental costs, such as traffic congestion and environmental pollution, are also increasing. Therefore, there is an urgent need to introduce a new urban logistics system to handle the increasing parcel shipping volume and to respond to the increasing number of freight vehicles in cities.
As the parcel delivery market is rapidly growing around the world, research into the development of new logistics transport systems is being actively conducted to respond to the logistics demand and to build an eco-friendly system.
Xu, Y. et al. analyzed the quantitative relationship between system implementation and urban logistics performance under the metro-based urban logistics system (M-ULS) to respond to parcel shipping services in the post COVID-19 era [
1]. Kikuta, J. et al. proposed a new urban logistics system that combined an existing freight vehicle with an urban subway system to efficiently transport goods from the suburbs to metropolitan areas. As a result, these authors conducted a pilot project and verified the effectiveness of the new urban logistics system [
2]. Cochrane, K. et al. presented a strategy to transport freight using public transportation, and the possibility of a new public freight transportation system was verified three times using the Delphi method [
3]. Zhao, L. et al. pointed out that urban logistics systems mainly relied on land transportation and incurred problems, such as traffic congestion, environmental problems, and delivery delays. In order to solve this problem, this research proposed a ULS using an urban subway for fast, one-day delivery during times when the urban subway was not congested [
4].
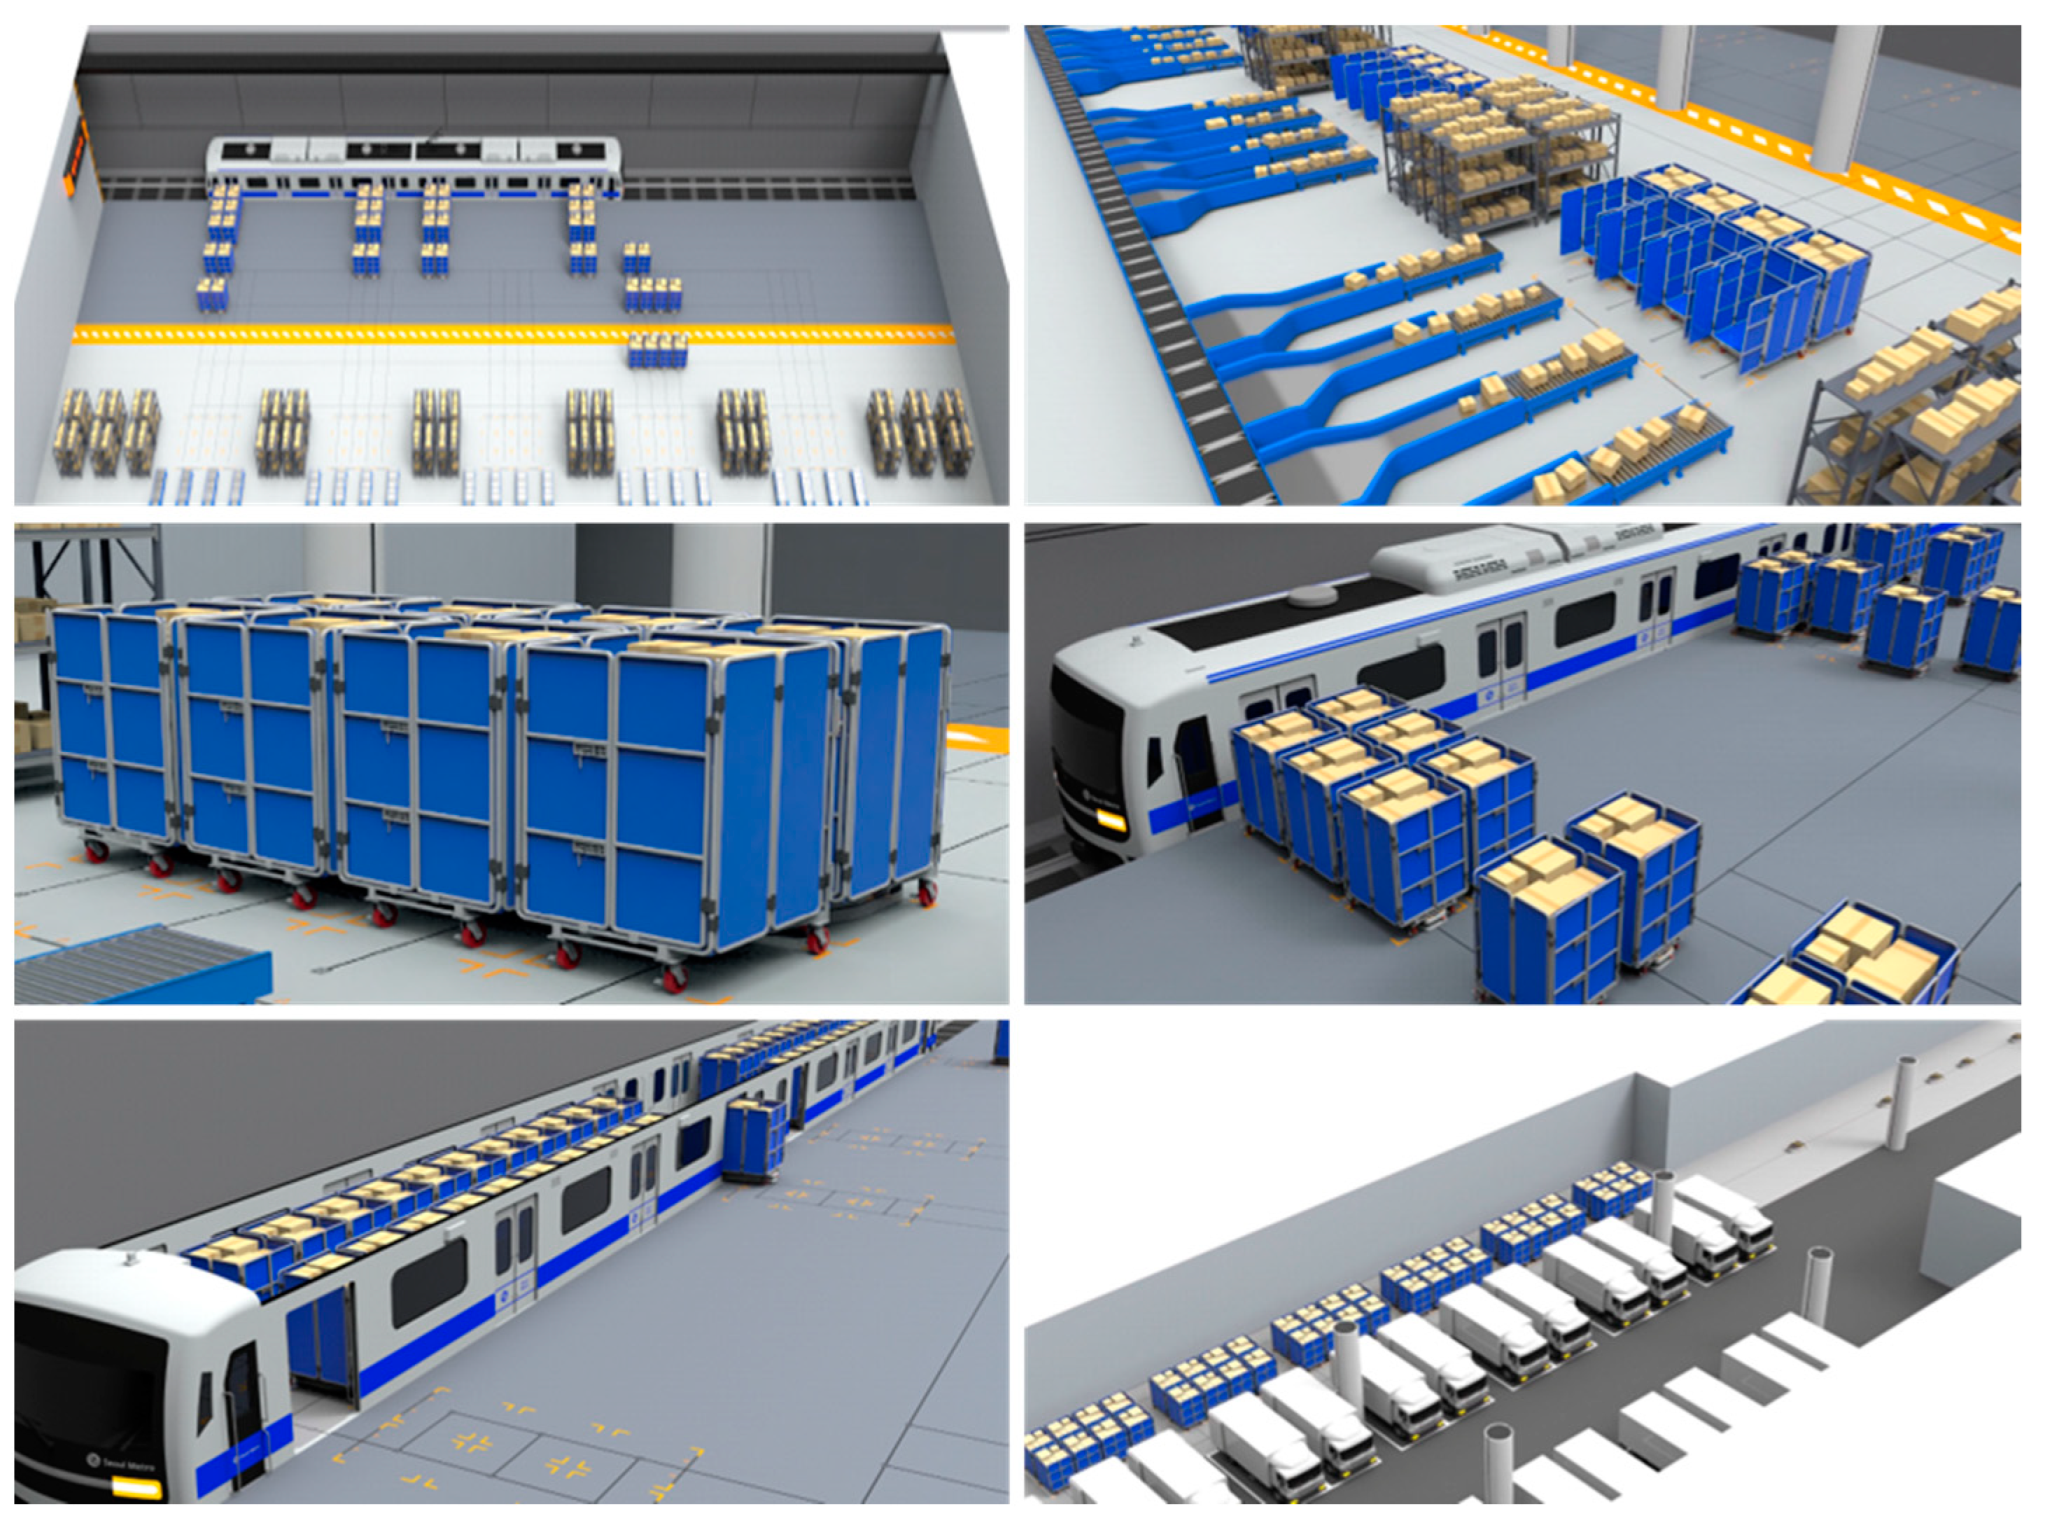
As in the above studies, a city logistics system using an underground system are already widely known as an eco-friendly and sustainable means of freight transportation, and efforts to build a freight transportation system using the underground space are continuing. Therefore, as shown in
Figure 1. This research focused on a metro-based ULS as an environmentally-friendly, punctual, and mass-transportation option for parcel delivery.
As shown in
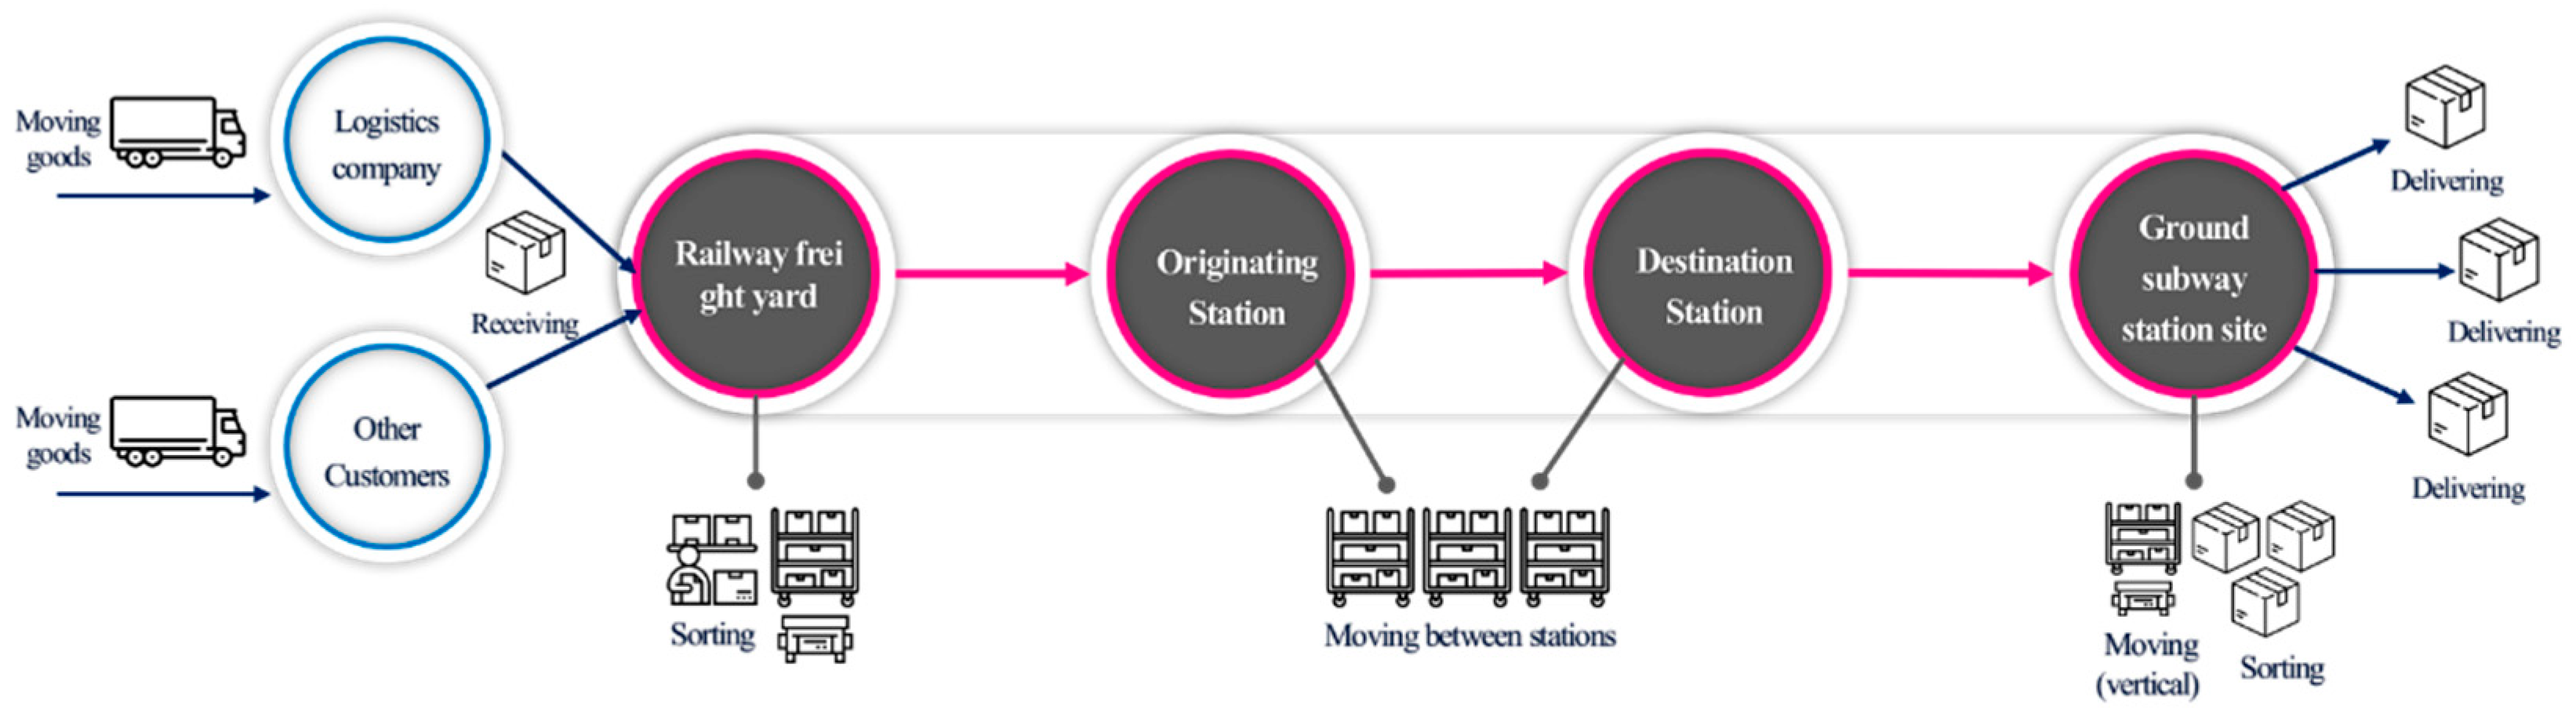
Figure 2, the operation procedure of a ULS starts at the railway freight yard. After the cargo is received, the parcel boxes are sorted and stored within the railway freight yard for an extended period. After that, the sorted parcel boxes are loaded into the subway freight carriages and then moved between the urban subway stations. Parcel boxes arriving at the designated station are moved to the ground subway station site to be sorted using a vertical transfer device, and after re-sorting for last-mile delivery, the final delivery was performed.
According to the above operation scenario, parcel boxes pass through several locations as they are moved, and as the location changes, the person in charge of the freight transportation continuously changes. Therefore, it is believed that detecting and classifying damaged parcel boxes can not only speed up the response to the damage, but also clarify responsibility.
Table 1 shows the places where it is necessary to check whether or not parcels are damaged by using the operation scenario procedure. In detail, the point where the location of the box is changed and the place where the responsibility is changed are designated as checkpoints to detect and classify parcel boxes.
2. Related Research
In this study, we intended to conduct an experiment to classify damaged parcels based on the checkpoints at places where the recognition and classification of parcels should be detected in, as shown in
Table 1, under ULS.
Research to detect and classify an object’s quality using a convolutional neural network is being applied in various fields. Research on the classification of parcel boxes is relatively new, and there are no published studies to directly compare our results to. A large amount of research has been conducted on the quality of fruit, road damage, waste classification, and disease. Bird, J.J. et al. performed an experiment to distinguish defects in lemons using VGG16, and classified healthy and unhealthy lemons with an accuracy of 88.75% [
5]. Velasco, J. et al. performed a study to classify seven skin diseases using the MobileNet algorithm, with an accuracy of 94.4% [
6]. Maeda, H. et al. conducted a study using Inception V2 and MobileNet to classify road damage into eight types using road surface images taken while driving a vehicle, and showed an accuracy of 77% [
7]. Wang, L. et al. performed an experiment to classify damaged ceilings in large-span structures using CNN. This study aimed to overcome the limitations of operator-based on-site inspection. As a result, classifying two types of damaged ceilings had an accuracy of 86.22% [
8]. Zhang, Q. et al. proposed a waste image classification using DenseNet 169 to improve the efficiency and accuracy of waste sorting and treatment by conducting a study to classify waste into five categories, with an accuracy of 82.8% [
9]. Dilshad, S. et al. conducted a study to detect and classify COVID-19 using MobileNet using chest X-ray images, which had an accuracy of 96.33% [
10]. Prasetvo E. et al. conducted an experiment to classify the freshness of fish by detecting fish eyes and applying bottleneck and expansion to MobileNet, finding an accuracy of 99.36% [
11].
Table 2 shows that the existing image classification research was mainly conducted with the binary classification of objects, and the image classification model was different according to the purpose and utilization of image classification. In this study, an experiment was conducted to classify normal and damaged parcel boxes using MobileNet. MobileNet was chosen as it uses a relatively small amount of disk space by using a small number of computations and parameters compared to other models. Therefore, in order to be applied to ULS in the future, the MobileNet model, which is lightweight, efficient and quick, was selected as the basic model [
12].
The remainder of this paper is structured as follows:
Section 1 investigates the research background of classifying damaged parcel boxes using a convolutional neural network (CNN) under an underground logistics system (ULS). As a result of analyzing literature reviews, there were no published works related to the classification of parcel boxes using CNN that we could directly compare to this research.
Section 2 introduces the CNN model, MobileNet algorithm to classify damaged parcel boxes in a ULS procedure.
Section 3 examines the construction and framework of the data environment as a basis for the experiment.
Section 4 explores how the MobileNet algorithm is applied to classify damaged parcel boxes, and a classification experiment is conducted. Finally,
Section 5 presents the conclusions and avenues for future research.
3. Methodology
This section consists of the concept of convolutional neural networks (CNN), MobileNet and the architecture of classification tasks, and briefly introduces the MobileNet, CNN, presenting the architecture and flowcharts of MobileNet for classifying parcel boxes.
3.1. Concept of CNN
Object recognition, classification and detection are chiefly conducted using a CNN algorithm based on deep-learning [
13]. A typical CNN algorithm consists of three different layers stacked together: a convolutional layer, pooling layer, and fully connected layer [
14]. A convolutional layer is used to extract image features and automatically learn the representations of image features. It performs a 3D convolution with several kernels and a given step size to produce feature maps from the input image [
15]. Compared to other neural networks of a similar type, CNN has much fewer parameters and connections. Therefore, it is more efficient to train a CNN model, which has an excellent performance. CNN algorithms vary with regard to building convolutional and pooling layers and training a neural network [
16].
A convolutional layer multiplies the elements corresponding to each input channel while moving the weight filter at regular intervals. Then, the result of adding those values is sequentially stored in the output. The mathematical expression for this convolution process can be defined as Equation (1) [
17]:
where
Ο is output,
K is filter,
F is input, and
i and
j represent the horizontal and vertical lengths of the filter, respectively. In addition,
x and
y represent the horizontal and vertical lengths of input and output, respectively,
c represents the input channel and
n is the output channel.
The general structure of the CNN matches a part of the input image rather than the whole image, as shown in
Figure 3, and a 3 × 3 grid is used to extract features. After the convolution process is complete, the max pooling is called to shrink the image stack. Window size is defined for max pooling. Then, the window is filtered across all of the images, and the max pooling reduces the dimension of each functional map. The normalization process of CNN is generally performed by a rectified linear unit (ReLU). This ReLU process increases the non-linearity property of the model. A fully connected layer, which is the next-performing layer, can be observed in the CNN and is called the classifier [
12].
3.2. MobileNet Algorithm
The traditional CNN is proven to have an excellent performance in the image recognition field, but it requires a lot of computation to learn and test the algorithm. Therefore, a high-performance GPU and large memory is essential. In order to solve this problem, MobileNet, which is one of the methods of changing the convolution filter, was proposed. MobileNet was developed by Google and has the advantage of a fast execution time because it is optimized for a small size, and is ideal for operating in mobile devices or devices with limited resources [
16].
MobileNet consists of a neural network that uses depthwise separable convolution from the existing convolution. Depthwise separable convolution is a concept for factoring an existing convolution and it consists of two steps: depthwise convolution, which filters the convolution, and pointwise convolution, which performs summation processing. Depthwise convolution performs a single-filter operation processing for each channel for all channels of input data, and then outputs the result. Pointwise convolution is composed of a 1 × 1 convolution, and it is summed and printed out through depthwise convolution [
18]. The result of depthwise separable convolution, based on RGB images with a 3 × 3 filter and a movement interval of 1, can be defined as Equations (2) and (3) [
17]:
where
is the output of the depthwise convolution,
Κ is the single filter of the depthwise convolution and
F represents the input.
O is the output of the pointwise convolution,
represents the filter of the 1 × 1 convolution. In the case that the traditional 3 × 3 convolution is changed to a depthwise separable convolution, the amount of computation is reduced by about eight to nine times [
18].
Figure 4 shows the general architecture of MobileNet, which consists of a total of 28 layers. The first layer in the architecture consists of 3 × 3 convolutions and is used for lightweight filtering that applies a single convolutional filter per input channel. The second layer consists of a 1 × 1 convolution, also called a pointwise convolution. The rectified linear unit (ReLU), called the activation function, has a faster computation speed and higher accuracy than the existing sigmoid function. The ReLU function is used in each convolutional layer [
19].
3.3. Architecture of MobileNet for Classification of Parcel Boxes
In order to recognize the damaged parcel boxes under ULS, architecture research is conducted using CNN MobileNet.
Figure 5 shows a flow chart for classification of parcel boxes using MobileNet. MobileNet has the advantage of being faster than other image classification models because it approaches each response channel with a separate filter [
20]. For accurate classification of parcel boxes, two convolutional layers are composed in the MobileNet algorithm. One layer is a depthwise convolution that can apply a single-input convolution at once in the filter stage, and the other layer is a pointwise convolution that can perform a linear combination output for the depthwise convolution. By placing the batch normalization and ReLU layers after each convolutional layer, it is possible to reduce the computational cost by allowing the classification to be performed faster than a general CNN model through downscaling of the model size and simplification [
21].
3.4. Dataset of Materials and Method
The experiment for the recognition and classification of damaged parcel boxes used in this paper was performed by Google, as shown in
Table 3. Google Colaboratory (Colab) is built to perform cloud-based deep learning works based on Jupyter notebooks. Colab is useful in the field of computer vision, and it has the advantage of being able to use 12 GB of RAM and GPU, such as Tesla T4, which has similar specifications to GeForce GTX 1080.
For the recognition and classification of parcel boxes, the dataset was divided into three groups: training, validation, and testing. For the experiment, a 4882-image dataset was collected and was divided into normal and damaged boxes. The collected images were classified into training, validation, and test sets in a ratio of 8:1:1 for the two classes in a randomized manner. Part of the image data was collected through web crawling because there was a limit to collecting images of parcel boxes in large quantities.
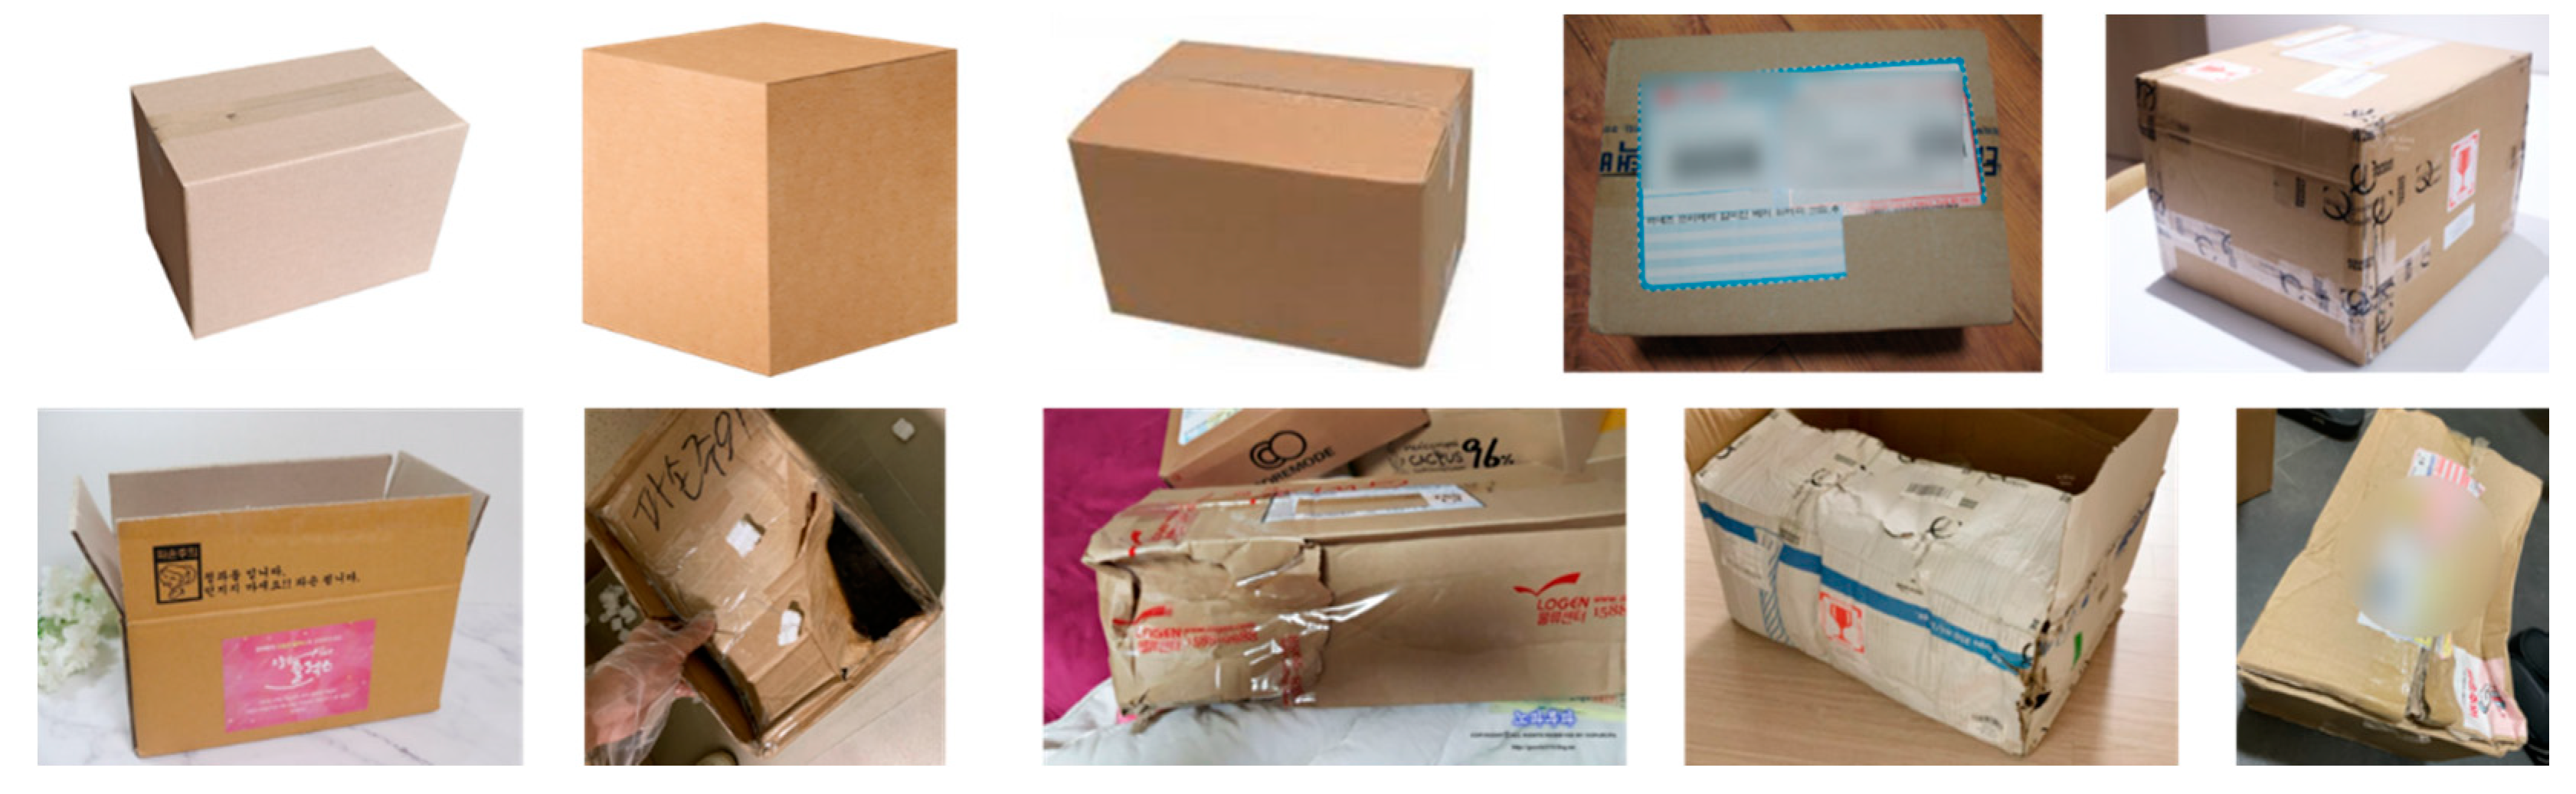
Figure 6 shows two classes of labeled image: (a) normal parcel boxes and (b) damaged parcel boxes. To prevent overfitting, cross-validation was performed in the training process. The detailed experimental environment of the training, validation and test datasets consisted of 3906 training data, 488 validation data, and 488 test data divided into two labels, as shown in
Table 4.
3.5. Framework of Experiments
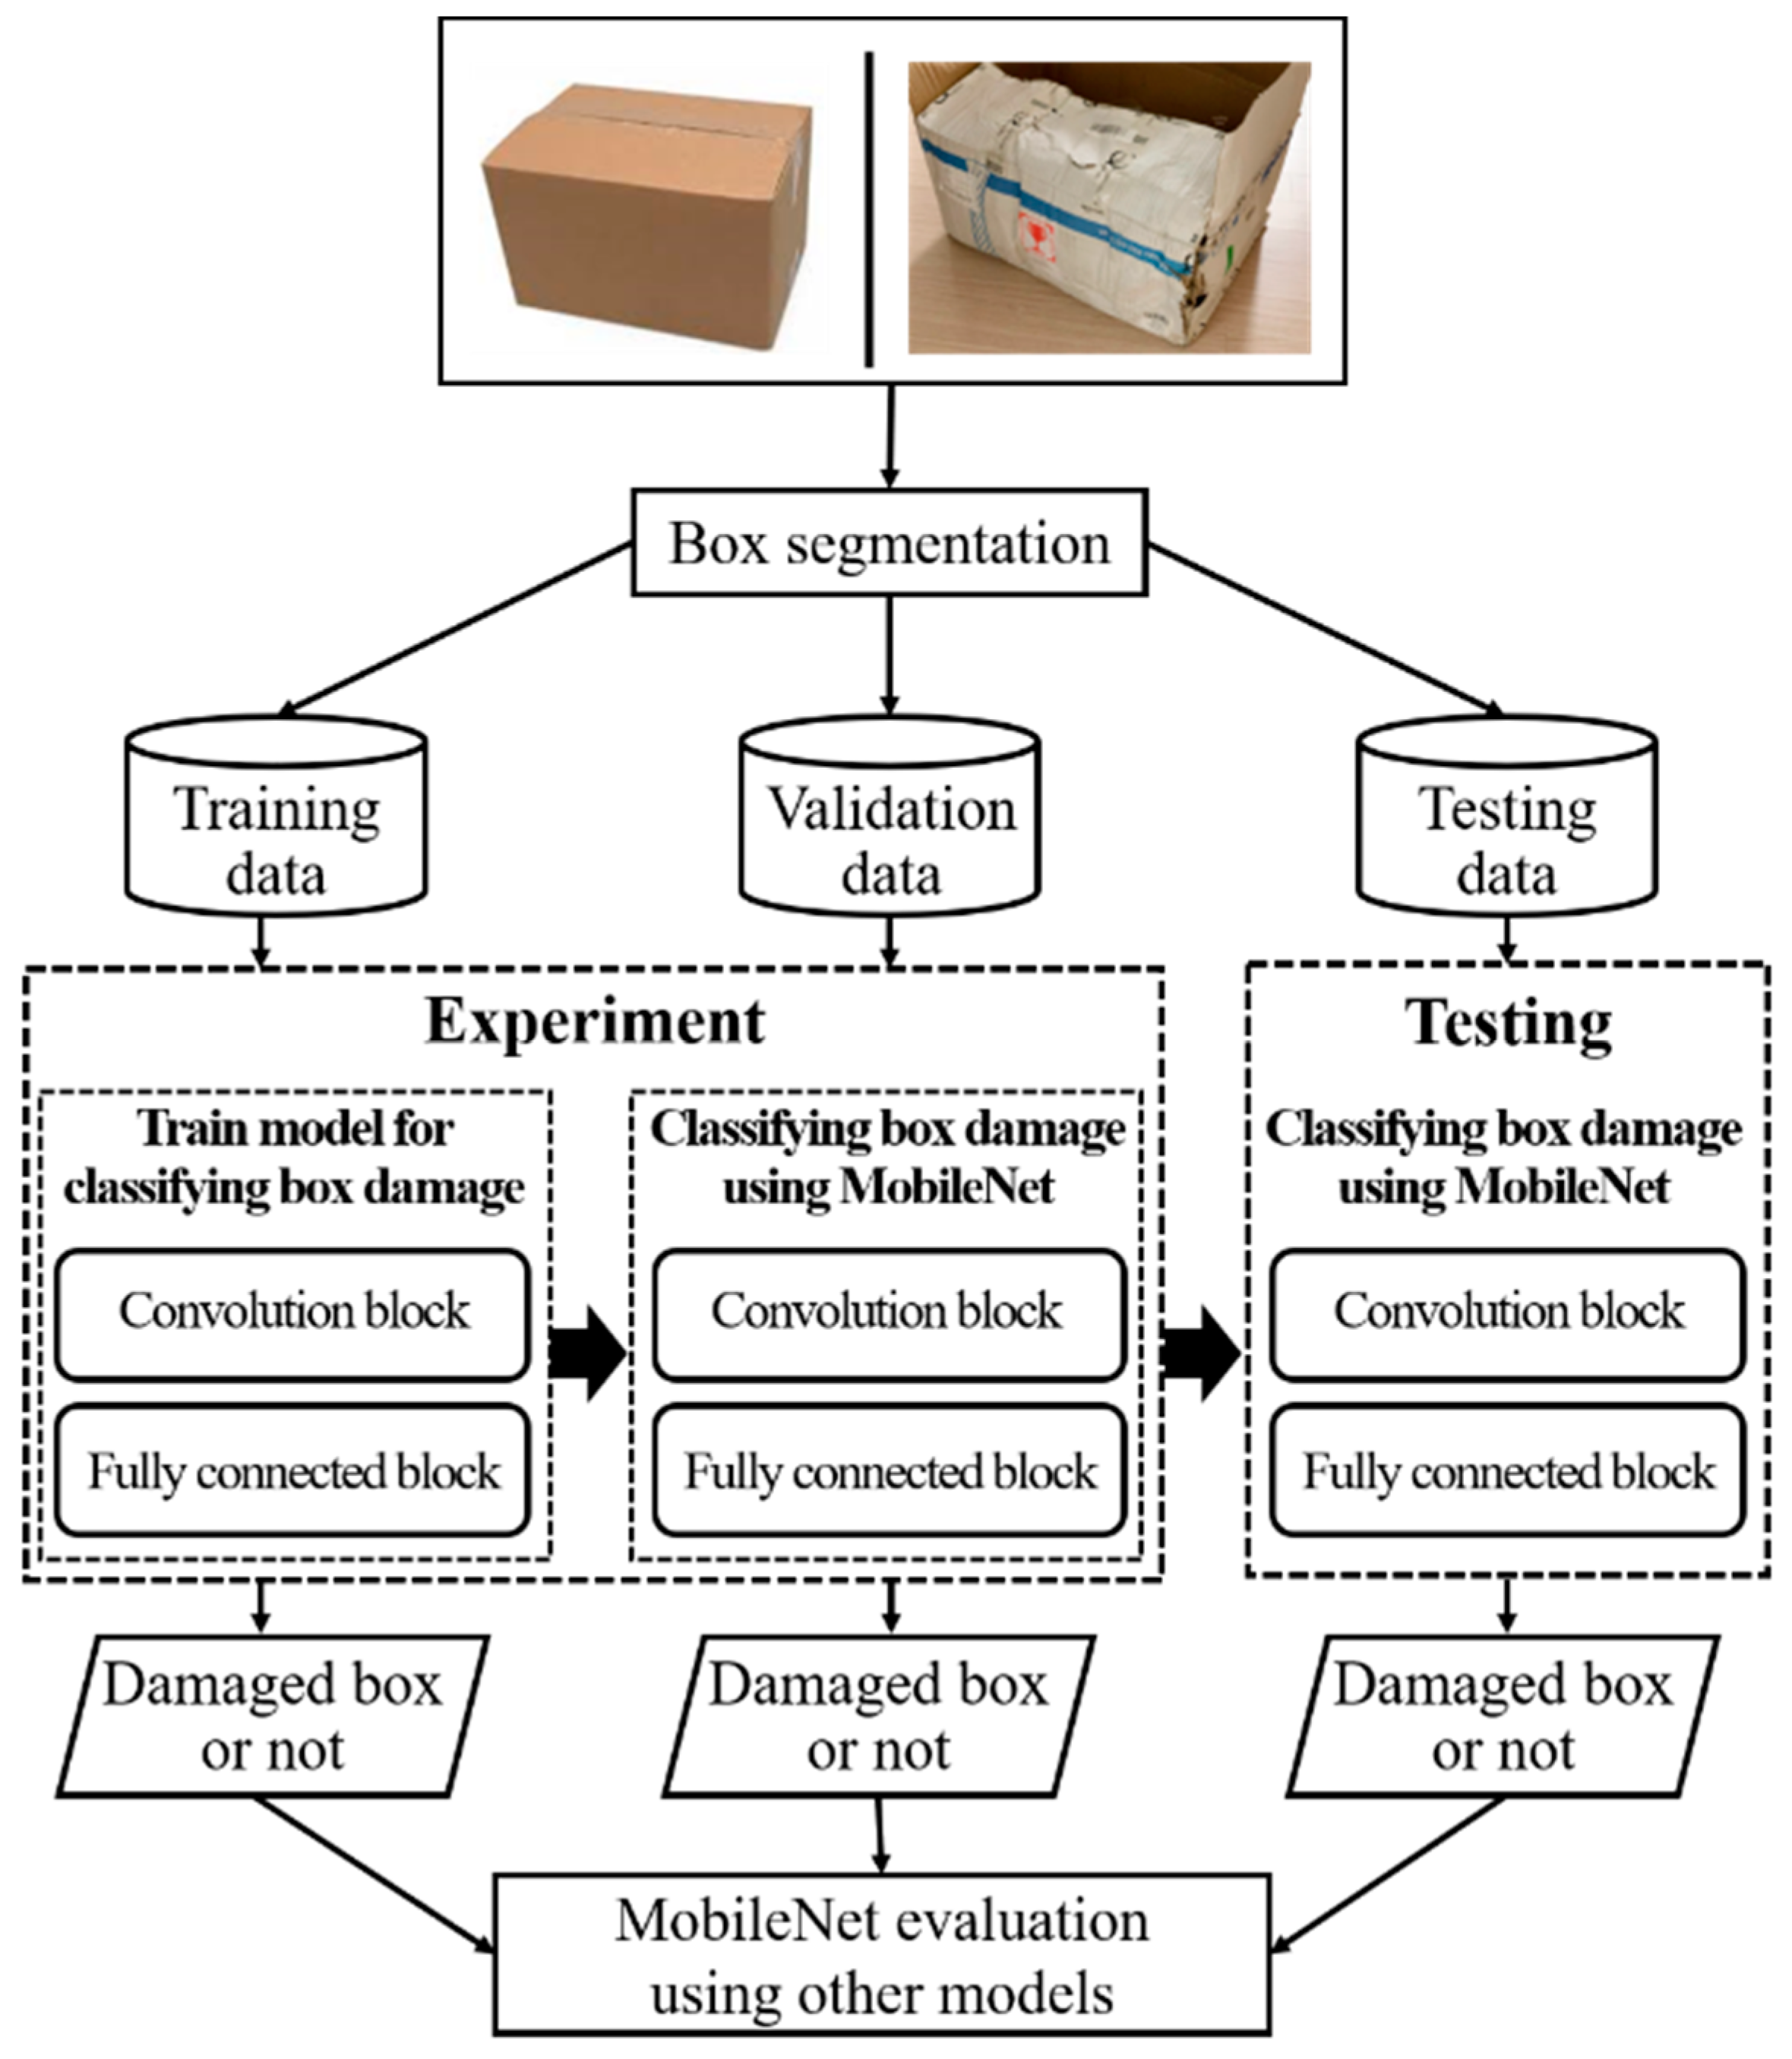
The MobileNet framework for classifying the damage of boxes starts with segmentation, as shown in
Figure 7. The parcel box images are trained and validated using MobileNet in the experimental part, and the trained model is then used to classify the test data in the testing part.
The testing part is necessary because it is important in the reliability process for classifying images not seen during the experiment session [
21]. Furthermore, this study evaluated and verified the classification results from data using other CNN models.
4. Experiments and Results
4.1. Experimental Setup and Training
During the experimental process, data were modified and trained using machining data and fine-tuning strategies to classify damaged parcel boxes. Various combinations of parameters, such as the number of frozen convolutional layers, the number of fully connected layers, the dropout rate, learning rate, and epochs, were modified, and optimal parameters were applied to the training experiment. After training, the parameters of the successful models were saved for testing, as shown
Figure 8. In order to maintain better performances of the models, the number of fully connected layers was kept the same in all models as much as possible.
Table 5 shows the number of parameters for layers after computation, as MobileNet architecture are applied to layers in consecutive order. In the first row, multi-adds and parameters are presented for the full convolutional layer with input ‘F’ of size 14 × 14 × 512, and a filter ‘K’ of size 3 × 3 × 512 × 512. The second row shows the multi-adds and parameters of the depthwise separable convolutional layer.
4.2. Results of the Experiments
As described in this section, we evaluated the performance of the MobileNet by calculating the prediction accuracy and loss for damaged parcel box classification using CNN MobileNet, and the results are shown in
Figure 9. The performance of the model was calculated using statistical measures such as precision, accuracy, F-score and recall. Each model was trained for 33 epochs.
The test results showed that the maximum training accuracy and validation accuracy were 82% and 87.7%, respectively, at the 25th and 22nd epochs. The training accuracy was shown to be stable after the 22nd epoch. From these results, it can be considered that the training of MobileNet was sufficiently accomplished. The image classification results using MobileNet showed a test prediction accuracy, sensitivity and specificity of 84.6%, 82% and 88.54%, respectively.
4.3. Experimental Comparisons
In order to compare the experimental results, we conducted an experiment using MobileNet, VGG16 and ResNet50, which are representative CNN algorithms, to classify whether the delivery box was damaged. In the case of the VGG16 and Resnet50 models, the classification accuracy could be higher than MobileNet, as shown in
Table 5, but the disk space and parameter values occupied were significantly higher. Therefore, the experiments using VGG16 and Resnet50 take a relatively long time to test.
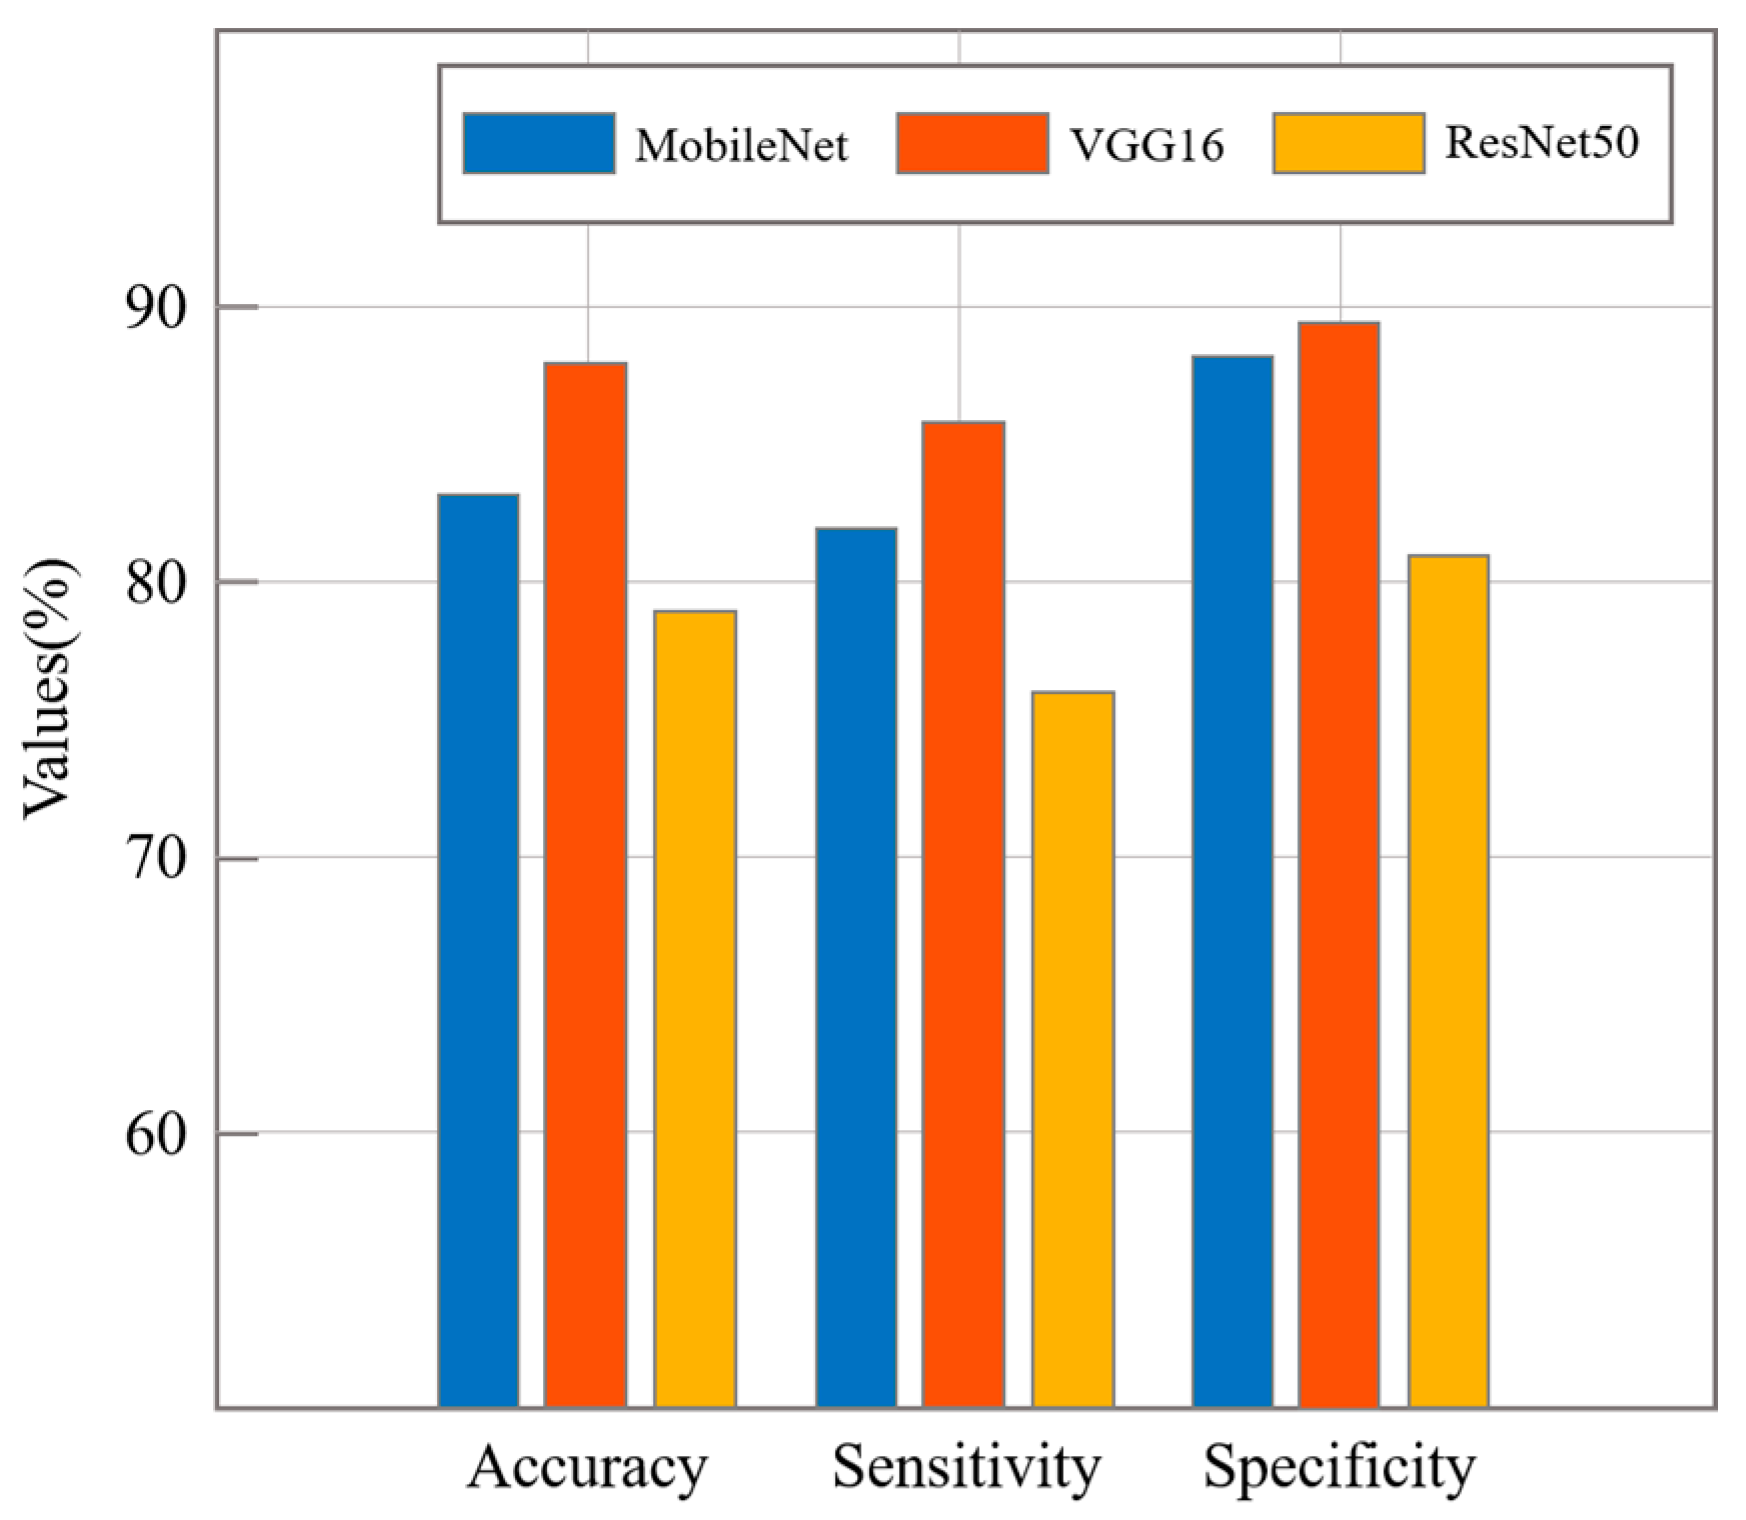
The learning of VGG16 and Resnet50 was performed under the same conditions as MobileNet, and the results of the classification experiment for each algorithm are presented in
Table 6. As a result of testing with 488 images, VGG16 showed the highest performance among the three models in prediction accuracy, sensitivity and specificity of 88.3%, 86.3% and 88.7%, respectively, as shown in
Figure 10. In the case of ResNet50, the performances in prediction accuracy, sensitivity and specificity were 79.7%, 76.5% and 81.5%, respectively. The prediction accuracy showed the highest performance for VGG16, followed by MobileNet, and it showed the lowest performance for ResNet50.
In conclusion, when performing experiments for binary image classification, such as the classification of damaged parcel boxes, it was considered appropriate to use MobileNet, which shows a relatively high performance versus time compared to other complex models as shown in
Table 7.
5. Conclusions and Future Work
This paper introduces a ULS concept to reduce freight cars and handle freight volume using subways in metropolitan areas. After checking the point where the parcel boxes could be damaged based on a ULS, research was conducted using deep learning to detect whether the parcel boxes were damaged. Parcel boxes are susceptible to damage, which reduces product quality and negatively affects customer satisfaction. Therefore, inspection procedures for parcel boxes are needed to efficiently detect and classify the defects of parcel boxes before they are delivered to customers. As a way to solve this problem, we conducted an experiment to classify normal parcel boxes and damaged boxes using computerized methods under a ULS procedure. For image classification, Google Colaboratory notebook was used and 4882 data images were collected for the experiment. The experiment was performed using the MobileNet algorithm, which used less disk space and fewer parameters than other models. Regarding the architecture of MobileNet, multi-adds and parameters were presented as 460 and 2.65, respectively, for the fully convolutional layer which has an input ‘F’ of size 14 × 14 × 512 and a filter ‘K’ of size 3 × 3 × 512 × 512. The multi-adds and parameters of the depthwise convolutional layer were 53 and 0.35, respectively. A MobileNet classification architecture of parcel boxes was trained and tested, with an accuracy, recall and specificity of 84.6%, 82% and 88.54%, respectively, for the testing set. Since the image dataset of parcel boxes is relatively new, there are no published studies to compare our results to. Therefore, to validate the usefulness of the MobileNet algorithm, verification experiments were performed under the same conditions using other algorithms, VGG16 and ResNet50. As a result of these verification experiments, the accuracy of was 86.3% in the VGG16 algorithm, which was better than the other image classification models. However, the testing time of the VGG16 also took longer than MobileNet and ResNet50. Therefore, the results show that, although the accuracy of MobileNet is 84.6%, which is relatively lower than VGG16, its testing time was seven times faster than VGG16 algorithm. In conclusion, MobileNet has a relatively better performance than other image classification models with regard to test time. The contribution of this paper is twofold. Firstly, this study presents the concept of a ULS, and a search is currently being conducted to apply the proposed ULS to metropolitan areas. Secondly, this paper proposed a method to detect damaged parcel boxes using MobileNet, and this will be helpful for classification of damaged parcel boxes under ULS. Future studies that focus on a breakage-type classification of parcel boxes (contamination, leakage and damage) should be conducted. Another study could be conducted to track the location of detected parcel boxes in real time and to determine whether they are damaged or not.
Author Contributions
Conceptualization, M.K. and Y.K. (Youngmin Kim); methodology, Y.K. (Youngmin Kim); software, M.K.; validation, Y.K. (Youngmin Kim); resources, J.K.; writing—original draft preparation, M.K.; writing—review and editing, Y.K. (Youngmin Kim), Y.K. (Yongjang Kwon) and J.K.; supervision, Y.K. (Yongjang Kwon); project administration, Y.K. (Yongjang Kwon) and J.K.; funding acquisition, J.K. All authors have read and agreed to the published version of the manuscript.
Funding
This work was supported by the Ministry of Land, Infrastructure and Transport and Korea Agency for Infrastructure Technology Advancement (22HCLP-C163194-02).
Institutional Review Board Statement
Not applicable.
Informed Consent Statement
Not applicable.
Acknowledgments
The authors would like to thank the participants who volunteered to participate in this experiment.
Conflicts of Interest
The authors declare no conflict of interest.
Abbreviation
The following abbreviations are used in this paper:
| ULS | Urban Logistics System |
| CNN | Convolutional Neural Network |
| ReLU | Rectified Linear Unit |
| Conv. | Convolutional |
| Colab | Colaboratory |
| Math symbols | |
| F | Input |
| O | Output |
| K | Filter |
| Output of depthwise convolution |
| Filter of 1 × 1 convolution |
| i | Horizontal length of the filter |
| j | Vertical length of the filter |
| x | Horizontal length of input and output |
| y | Vertical length of input and output |
| c | Input channel |
| n | Output channel |
References
- Xu, Y.; Dong, J.; Ren, R.; Yang, K.; Chen, Z. The impact of metro-based underground logistics system on city logistics performance under COVID-19 epidemic: A case study of Wuhan, China. Transp. Policy 2021, 116, 81–95. [Google Scholar] [CrossRef] [PubMed]
- Kikuta, J.; Ito, T.; Tomiyama, I.; Yamamoto, S.; Yamada, T. New subway-integrated city logistics system. Procedia-Soc. Behav. Sci. 2021, 39, 476–489. [Google Scholar] [CrossRef] [Green Version]
- Cochrane, K.; Saxe, S.; Roorda, M.J.; Shalaby, A. Moving freight on public transit: Best practices, challenges, and opportunities. Int. J. Sustain. Transp. 2017, 11, 120–132. [Google Scholar] [CrossRef]
- Zhao, L.; Li, H.; Li, M.; Sun, Y.; Hu, Q.; Mao, S.; Xue, J. Location selection of intra-city distribution hubs in the metro-integrated logistics system. Tunn. Undergr. Space Technol. 2018, 80, 246–256. [Google Scholar] [CrossRef]
- Bird, J.J.; Barnes, C.M.; Manso, L.J.; Ekárt, A.; Faria, D.R. Fruit quality and defect image classification with conditional GAN data augmentation. Sci. Hortic. 2022, 293, 110684. [Google Scholar] [CrossRef]
- Velasco, J.; Pascion, C.; Alberio, J.W.; Apuang, J.; Cruz, J.S.; Gomez, M.A.; Jorda, R., Jr. A smartphone-based skin disease classification using mobilenet cnn. Int. J. Adv. Trends Comput. Sci. Eng. 2019, 8, 2632–2637. [Google Scholar] [CrossRef]
- Maeda, H.; Sekimoto, Y.; Seto, T.; Kashiyama, T.; Omata, H. Road damage detection and classification using deep neural networks with smartphone images. Comput.-Aided Civ. Infrastruct. Eng. 2018, 33, 1127–1141. [Google Scholar] [CrossRef]
- Wang, L.; Kawaguchi, K.I.; Wang, P. Damaged ceiling detection and localization in large-span structures using convolutional neural networks. Autom. Constr. 2020, 116, 103230. [Google Scholar] [CrossRef]
- Zhang, Q.; Yang, Q.; Zhang, X.; Bao, Q.; Su, J.; Liu, X. Waste image classification based on transfer learning and convolutional neural network. Waste Manag. 2021, 135, 150–157. [Google Scholar] [CrossRef] [PubMed]
- Dilshad, S.; Singh, N.; Atif, M.; Hanif, A.; Yaqub, N.; Farooq, W.A.; Masood, M.T. Automated image classification of chest X-rays of COVID-19 using deep transfer learning. Results Phys. 2021, 28, 104529. [Google Scholar] [CrossRef] [PubMed]
- Prasetyo, E.; Purbaningtyas, R.; Adityo, R.D.; Suciati, N.; Fatichah, C. Combining MobileNetV1 and Depthwise Separable Convolution Bottleneck with Expansion for Classifying the Freshness of Fish Eyes. Inf. Processing Agric. 2022, in press. [Google Scholar] [CrossRef]
- Gujjar, J.P.; Kumar, H.P.; Chiplunkar, N.N. Image classification and prediction using transfer learning in colab notebook. Glob. Transit. Proc. 2021, 2, 382–385. [Google Scholar] [CrossRef]
- Hwang, S.W.; Park, J.M.; Won, J.U.; Kwon, Y.J.; Km, Y.M. Object Detection for Cargo Unloading System Based on Fuzzy C Means. Comput. Mater. Contin. 2022, 71, 023295. [Google Scholar] [CrossRef]
- Qian, Y.; Dong, J.; Wang, W.; Tan, T. Deep learning for steganalysis via convolutional neural networks. Media Watermarking Secur. Forensics 2015, 9409, 171–180. [Google Scholar] [CrossRef]
- Lee, H.; Grosse, R.; Ranganath, R.; Ng, A.Y. Convolutional deep belief networks for scalable unsupervised learning of hierarchical representations. In Proceedings of the 26th Annual International Conference on Machine Learning, Montreal, QC, Canada, 14–18 June 2009; pp. 609–616. [Google Scholar] [CrossRef]
- Lee, S.H. Deep learning based face mask recognition for access control. J. Korea Acad.-Ind. Coop. Soc. 2020, 21, 395–400. [Google Scholar] [CrossRef]
- Wang, H.; Lu, F.; Tong, X.; Gao, X.; Wang, L.; Liao, Z. A model for detecting safety hazards in key electrical sites based on hybrid attention mechanisms and lightweight Mobilenet. Energy Rep. 2021, 7, 716–724. [Google Scholar] [CrossRef]
- Howard, A.G.; Zhu, M.; Chen, B.; Kalenichenko, D.; Wang, W.; Weyand, T.; Andreetto, M.; Adam, H. MobileNets: Efficient Convolutional Neural Networks for Mobile Vision Applications. Cornell University Library. arXiv 2017, arXiv:1704.04861. [Google Scholar]
- Krizhevsky, A.; Sutskever, I.; Hinton, G.E. Imagenet classification with deep convolutional neural networks. Adv. Neural Inf. Processing Syst. 2012, 25, 1097–1105. [Google Scholar] [CrossRef]
- Wu, T.Y.; Yeh, K.T.; Hsu, H.C.; Yang, C.K.; Tsai, M.J.; Kuo, Y.F. Identifying Fagaceae and Lauraceae species using leaf images and convolutional neural networks. Ecol. Inform. 2022, 68, 101513. [Google Scholar] [CrossRef]
- So, M.H.; Han, C.S.; Kim, H.Y. Defect Classification Algorithm of Fruits Using Modified MobileNet. J. Korea Inst. Inf. Technol. 2020, 18, 81–89. [Google Scholar] [CrossRef]
| Publisher’s Note: MDPI stays neutral with regard to jurisdictional claims in published maps and institutional affiliations. |
© 2022 by the authors. Licensee MDPI, Basel, Switzerland. This article is an open access article distributed under the terms and conditions of the Creative Commons Attribution (CC BY) license (https://creativecommons.org/licenses/by/4.0/).


