Article

Effect of Hemp Seed Oil Addition on the Rheological Properties of Dough and Bread

by
Sorina Ropciuc
*,
Laura Carmen Apostol
,
Cristina Damian
and
Ancuța Elena Prisacaru
*
Faculty of Food Engineering, Stefan cel Mare University, Universitatii Street 13, 720229 Suceava, Romania
*
Authors to whom correspondence should be addressed.
Appl. Sci. 2022, 12(6), 2764; https://doi.org/10.3390/app12062764
Submission received: 20 January 2022 / Revised: 3 March 2022 / Accepted: 5 March 2022 / Published: 8 March 2022

Abstract

:
The aim of the study was to determine the influence of hemp seed oil on the rheological properties of the dough and the properties of white and black wheat flour bread. In this work, the dough was obtained from wheat flour types 550, 650, and 1350 to which hemp seed oil was added in percentages ranging from 0–15% (flour-based). The empirical and fundamental rheological properties of the dough were characterization using an alveograph test and a rotational rheometer. The rheological properties determined by the alveograph test indicated a correlation between the dough extensibility index and the bread volume. The obtained results led to the conclusion that the addition of oil in the dough, at a maximum percentage of 15%, modifies rheological properties by decreasing the modulus of viscosity and elasticity. Textural properties were used to determine hardness, springiness, cohesiveness, and adhesiveness. The hardness and softness of the bread decreased as the percentage of added oil increased and the elasticity of the bread samples increased with the addition of more oil. Supplementing bread with oil has led to improved textural features and sensory scores. Generally, the best quality was obtained at the optimum usage level of 5–10% hemp oil.

1. Introduction

Bread is considered a staple food all over the world because of its nutritional value, its ability to be eaten with other foods, and its low price [1].
In the composition of bakery products, oil is an auxiliary component, but with an important functional and rheological role in the dough [2]. Adding a small amount of fat to yeast dough helps the gluten to spread, resulting in bread with a higher volume. Fats are used in bread making to improve gas retention in the dough and thereby increase its volume and softness, to lubricate, aerate, and help heat transference in the dough, imparting desirable texture [3]. The flow and deformation behavior of the dough is recognized as essential to the successful production of baked goods [4]. Since the doughs are viscoelastic, oscillating dynamic testing has been widely used in recent years to characterize the rheological properties of dough [5,6]. The amount of oil added is determined by the type of flour and the capacity of the proteins in the flour to bind these lipids during kneading [7]. The percentage of added oil should not exceed 5–10%.
The rheological properties of wheat flour dough, supplemented with different amounts of hemp seed oil, have been studied previously and it has been shown that water absorption decreased as the amount of oil added increased. Other authors who have studied the effect of adding flaxseed oil to wheat flour dough have reported increased water absorption and dough stability [8,9]. They reported that the use of ground flaxseed at a level of 10% significantly increased the volume of the bread, the specific volume of the bread, and delayed the aging of the bread.
The sensory qualities of baked bread, such as flavor, softness, volume, palatability, and appearance are improved, while oxidation reactions, staling, and moisture migration are reduced by the addition of oil to bread recipes [10].
The current trend in the industry is to introduce healthier fats into food products. As a result, a decrease in monounsaturated fatty acids (MUFA) are expected alongside an increase in polyunsaturated fatty acids (PUFAs) in consumer foods [11,12,13].
Hemp seed oil contains high concentrations of polyunsaturated fatty acids (PUFA) (70–90%) and is a good dietary source of essential fatty acids and linoleic acids [14,15]. Linoleic acid (50–70%) is the major fatty acid in seed oil. Hemp seed oil is considered healthy because of its desirable omega-6: omega-3 fatty acid ratio, 3:1. This value is considered optimal for human health, as it has a positive influence on health conditions through reducing the risk of cardiovascular diseases [16,17].
The main purpose of this research was to investigate the effects hemp seed oil had upon the rheological properties of dough obtained from wheat flour, with specific attention paid to three types of flour (550, 650, and 1350), as well as its effects upon the quality of the bread.

2. Materials and Methods

2.1. Materials

Wheat flour was bought from the local producer, Mopan S.A, and have with document’s verifying its quality. The following three types of flour were used: white flour (type 550), white flour (type 650), and black wheat flour (type 1350). Wheat flour was characterized according to ICC methods in terms of its composition as follows: Type 550, 14.0 g/100 g moisture; 0.55 g/100 g ash; 13.2 g/100 g protein; 31 g/100 g wet gluten. Wheat flour type 650, 14.5 g/100 g humidity; 0.65 g/100 g ash; 10.5 g/100 g protein, 27 g/100 g wet gluten. Wheat flour type 1350, 14.5 g/100 g humidity; 1.35 g/100 g ash; 10.5 g/100 g protein; 26 g/100 g wet gluten.
The results obtained were duplicated and expressed as average values. The hemp seed oil was purchased from a producer in Romania (Pronat SRL, Romania). The acidity of the oil at its time of use in the formulation of dough was 1.16 and the iodine number of hemp oil was 152 g/100 g. The percentage of hemp seed oil added was as follows: S0 control test–0%; sample 1–5%; sample 2–10%; sample 3–15%. A total of twelve bread samples were obtained for analysis.

2.2. Methods

2.2.1. Dough and Bread Preparation Method

The bread recipe was as follows: 250 g of wheat flour of each type: 550, 650, and 1350 in g of yeast was added, 3.75 g salt and hemp seed oil in percentages ranging from 0% to 15%. Water was added depending on the hydration capacity of the dough. The dough was kneaded using the Kitchen Aid Heavy Duty mixer by mixing until full dough development. After kneading, the dough was split, re-mixed, and fermented for 30 min at a temperature of 35 °C and 80% relative humidity using a fermentation cabinet Piron. When the fermentation was complete, the bread was baked in a Mistral TTR electric convection oven at 180–210 °C for 30 min.

2.2.2. Rheological Analysis

The rheological analysis of the dough was performed on a dynamic rheometer (HAAKE RheoWin Mars 40, Karlsruhe, Germany). All measurements were performed at a temperature of 20 °C, using rotor/plate geometry with a rotor diameter of 40 mm and a gap of 2 mm. A frequency range of 1–20 Hz and a temperature of 20 °C were used for the elastic modulus (G′) and the viscous modulus (G″). Frequency recovery tests were performed in the linear viscoelasticity range at a constant stress of 50 Pa. The whistle time was 60 s and the recovery stage was 180 s. The viscoelastic properties of the dough samples also appreciated under the influence of temperature. G’ modulus, “storage” or “elastic”, and G″ module, “loss” or “plastic”, were analyzed at temperatures between 20 °C–100 °C. The determination was made using plate-plate geometry, with a rotor diameter of 40 mm and a distance of 2 mm [18,19].
The empirical dough’s rheological properties were documented using an alveograph device (Chopin Technologies, type F4, Villeneuve-La-GarenneCedex, France). The following characteristics were defined: dough extensibility (mm) was indicated by the length of the alveogram curve (L), the maximum pressure (P) represented the peak height (mm), baking strength (W), index of swelling (G), and the configuration ratio of the alveograph curve (P/L). The alveograph test was done according to ICC 121, AACC 54–30A, and ISO 5530/4 approval with 14.0–14.5 g/100 g of moisture [20,21,22].

2.2.3. Evaluation of Bread Quality

Texture Analysis

The texture profile evaluation test aims to mimic the mastication process, which is run in the form of double compression cycles. Through this test, a number of properties relating to the bread’s texture can be evaluated, such as the following: hardness, springiness, cohesiveness, adhesiveness. The textural characteristics of the bread samples were determined using a texturometer device (TVT-6700, Perten Instruments) using a 45 mm cylindrical probe, which operates at a speed of 5.0 mm/s and a trigger force of 5 g. To highlight the textural parameters of the bread samples, they were cut into 50 mm high slices. Compression was performed up to a displacement equal to 75% of the sample height, with a pressing speed of 4 mm/s. The test parameters were as follows: 10.0 mm/s pre-test speed, 5.0 mm/s test speed, 5.0 mm/s post-test speed, and 40% strain. Thus, the device software has been programmed to record forces and displacements, as well as to calculate texture parameters. These analyses were conducted 2 h after baking [22,23,24,25,26].

Sensory Analysis

The 12 bread samples were proposed for sensory analysis to a group of 11 specially trained panelists; a selection of students from the Faculty of Food Engineering. This group evaluated the bread samples, giving grades from 1 (lowest intensity) to 5 (highest intensity), for the following sensory attributes: crust color, crumb pore uniformity (size of pores in section (small/big), crumb softness, specific aroma, and after-taste. The coded samples were offered to the tasters and the sensory evaluation was performed using the preference test. Additionally, overall acceptability was determined using a 9-point hedonic scale (from 9 = like extremely to 1 = dislike extremely). Differences were considered to be significantly different at a value of p < 0.05 [25,26].

Statistical Analysis

The obtained results were statistically analyzed using XLSTAT 2021, software (Addinsoft, NY, USA) for the one-way analysis of variance, followed by the Tukey test to determine the significant differences between means at p < 0.05.
PCA analysis enabled the multivariate distribution of the data sets obtained in determining the alveograph parameters (dough extensibility (L), the maximum pressure (P), baking strength (W), and swelling (G). The data sets were separated into quadrants indicating the strength of the links that are established between the analyzed characteristics. The greater the strength of the connections, the shorter the distance from the point of origin. This method was used to distribute rheological characteristics and to determine the correlations between rheological, textural, and sensory characteristics.
Rheological variables (dough extensibility, maximum pressure, baking strength, swelling, elastic modulus, and viscous modulus) and textural variables (hardness, springiness, cohesiveness, and adhesiveness) were correlated with sensory characteristics (crust color, crumb pore, crumb softness, specific aroma, and after-taste) and then ana-lyzed using the Matlab 2021b program (MathWorks, Natick, MA, USA).

3. Results and Discussion

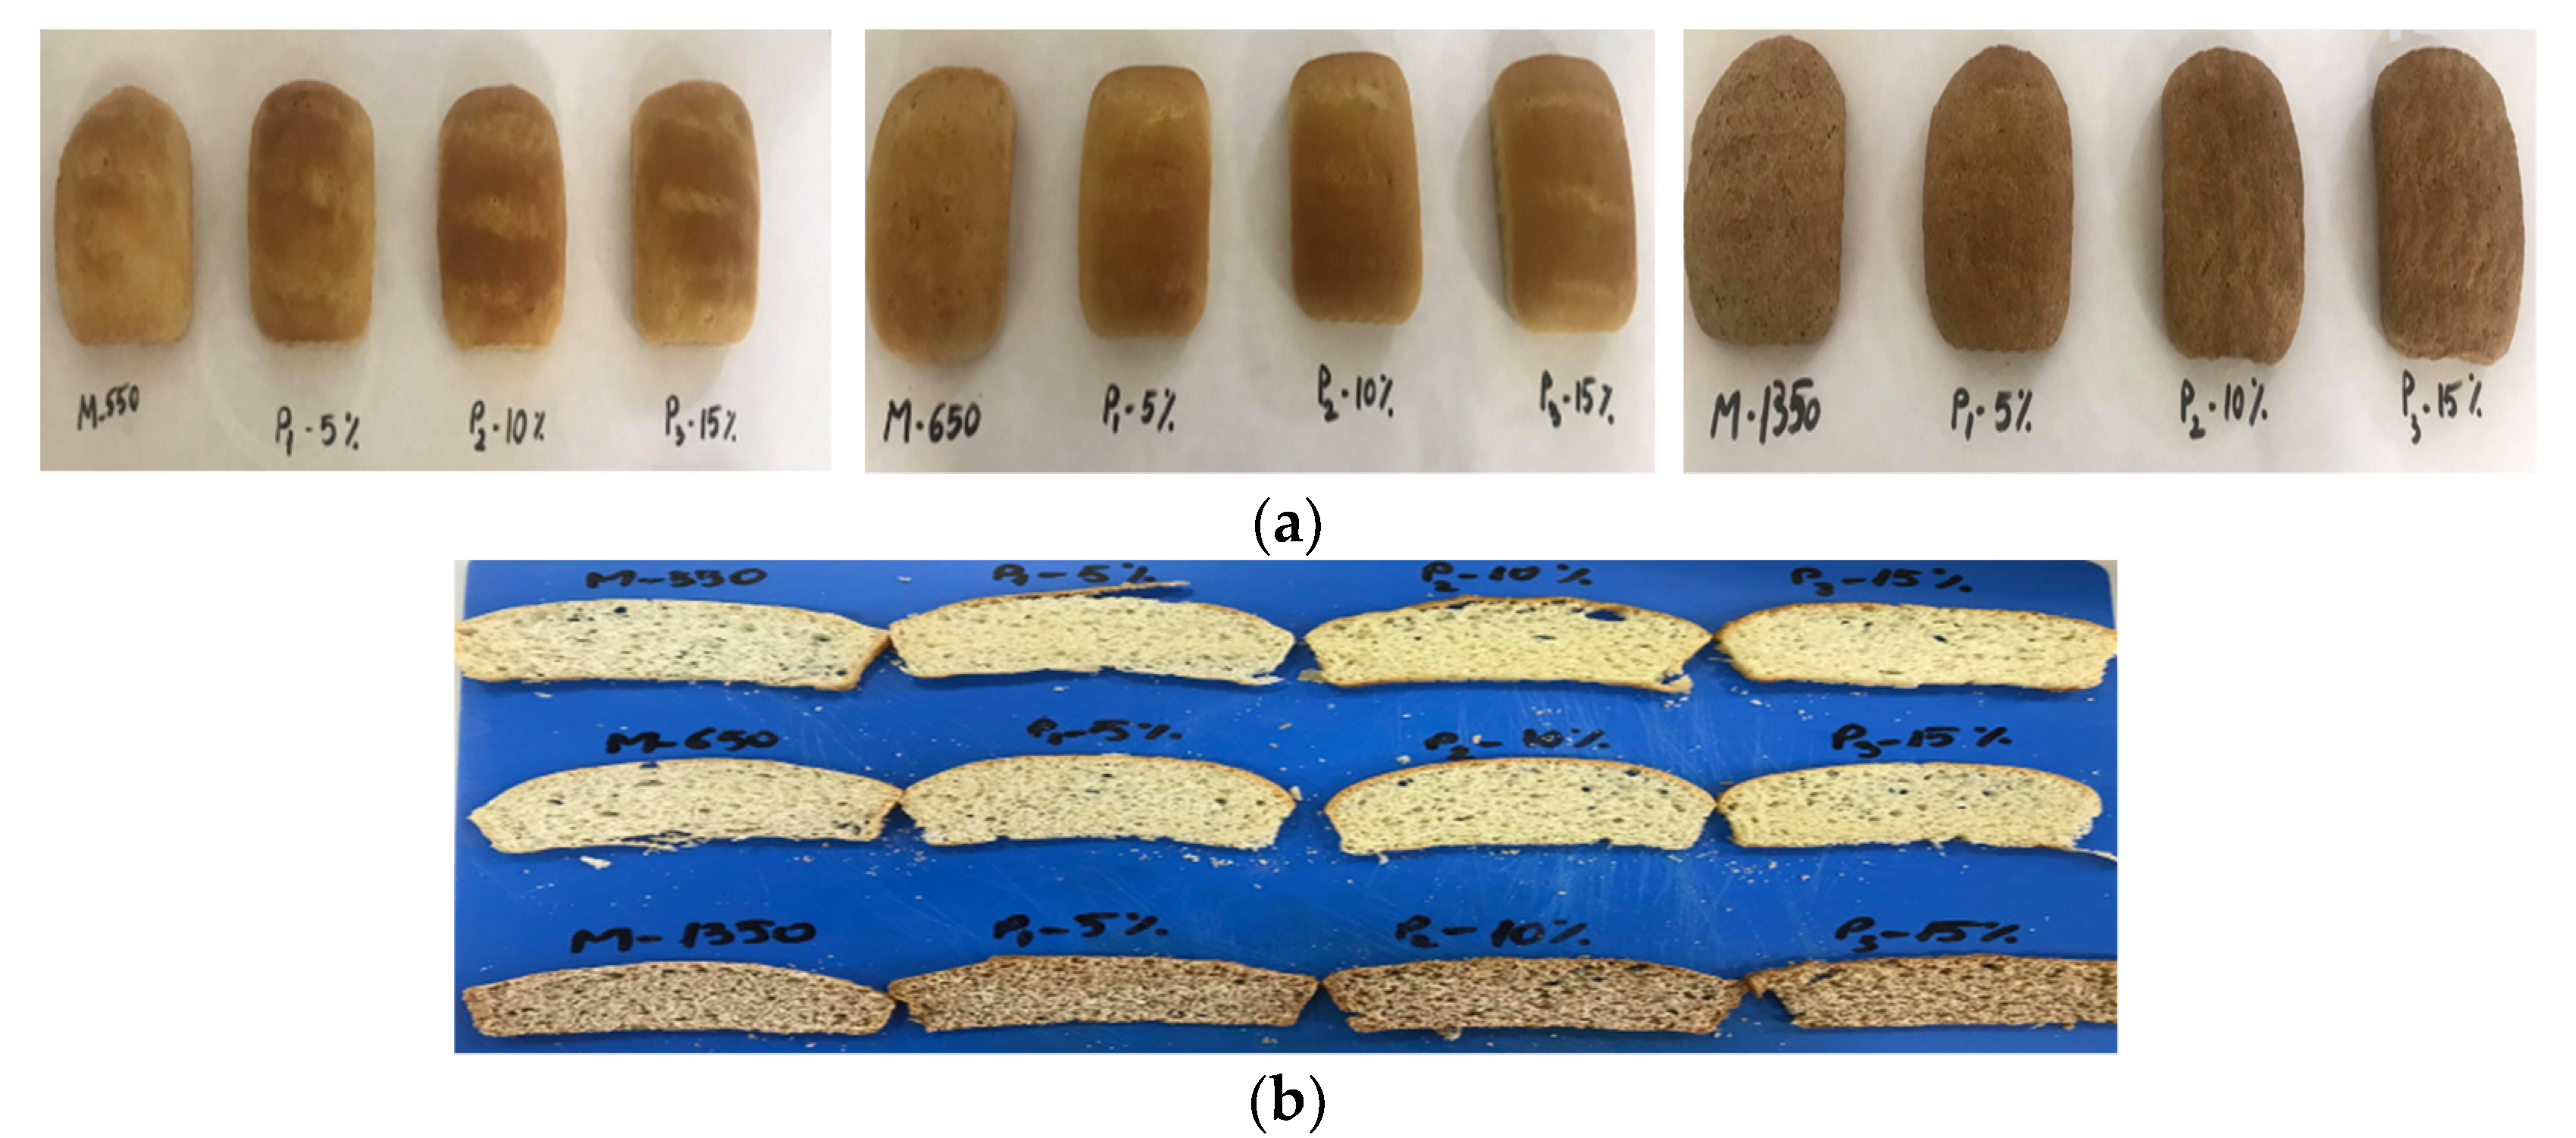
3.1. Results in Obtaining Bread Samples

A total of 12 bread samples (Figure 1a) were obtained using three types of flour (type 550, type 650, and type 1350) to which hemp seed oil was incorporated in kneading in percentages of 0%—Control, 5% (P1), 10% (P2), and 15% (P3). The samples in the section are presented in Figure 1b.

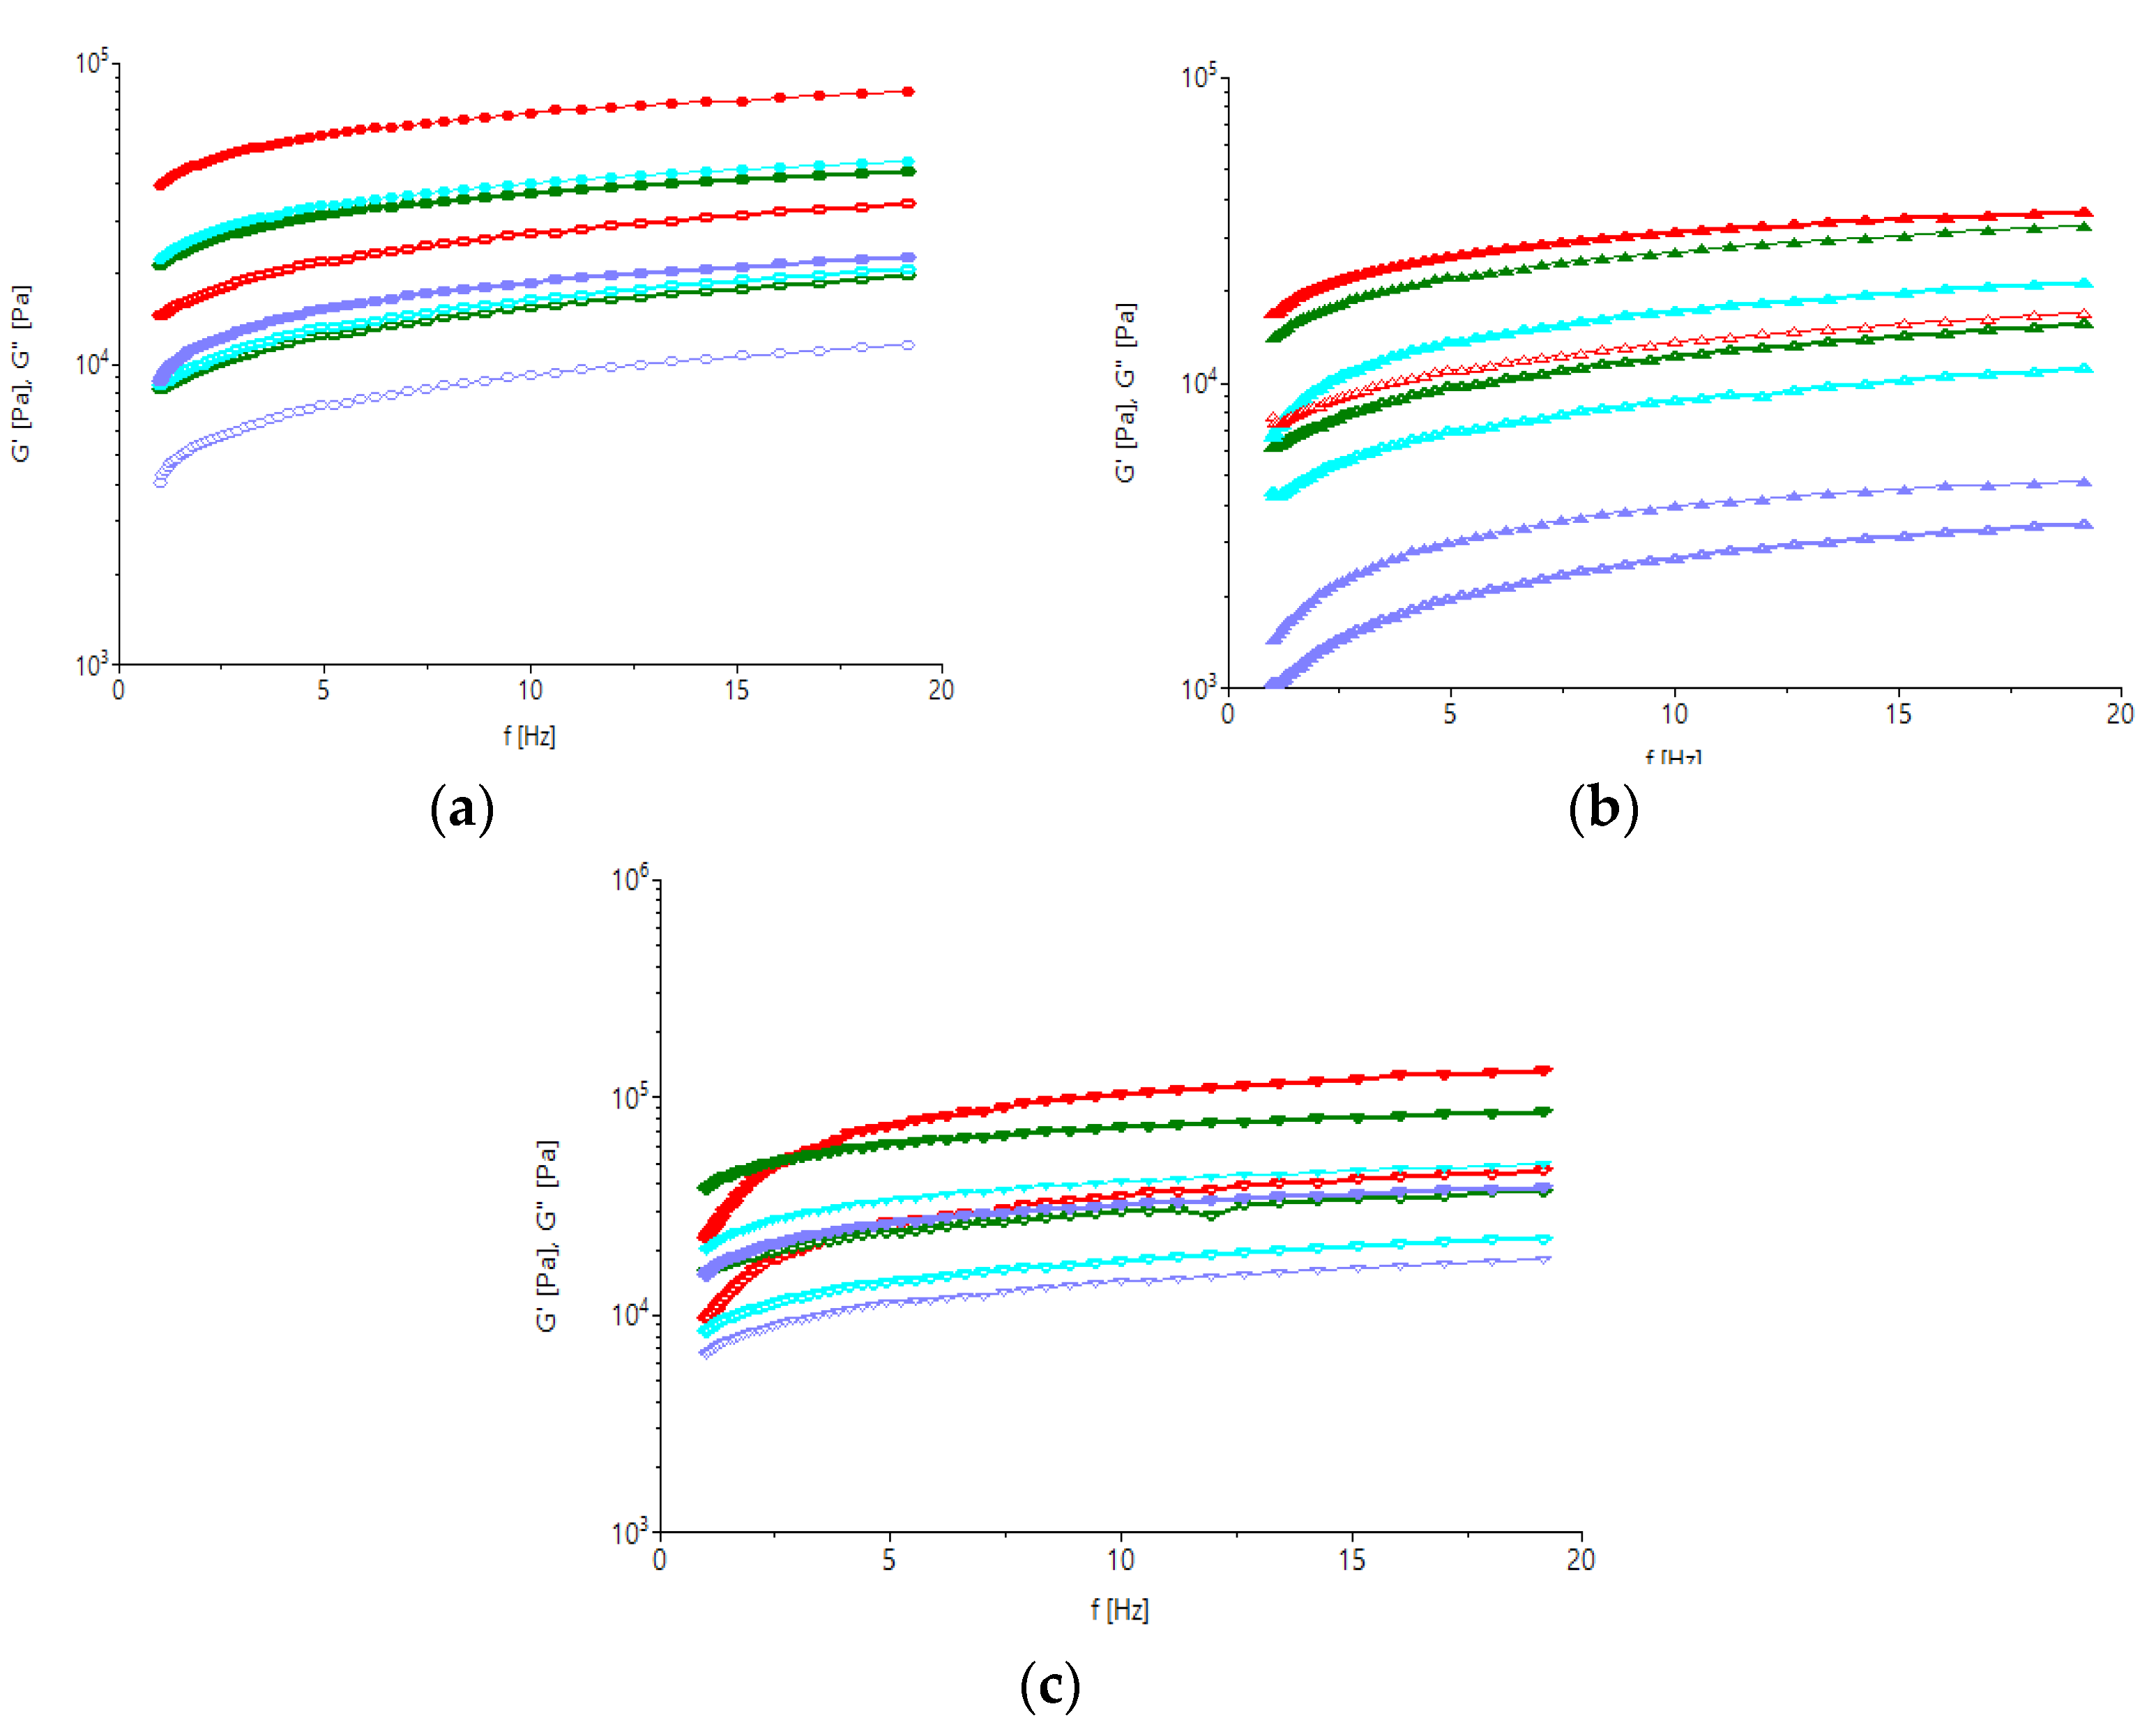
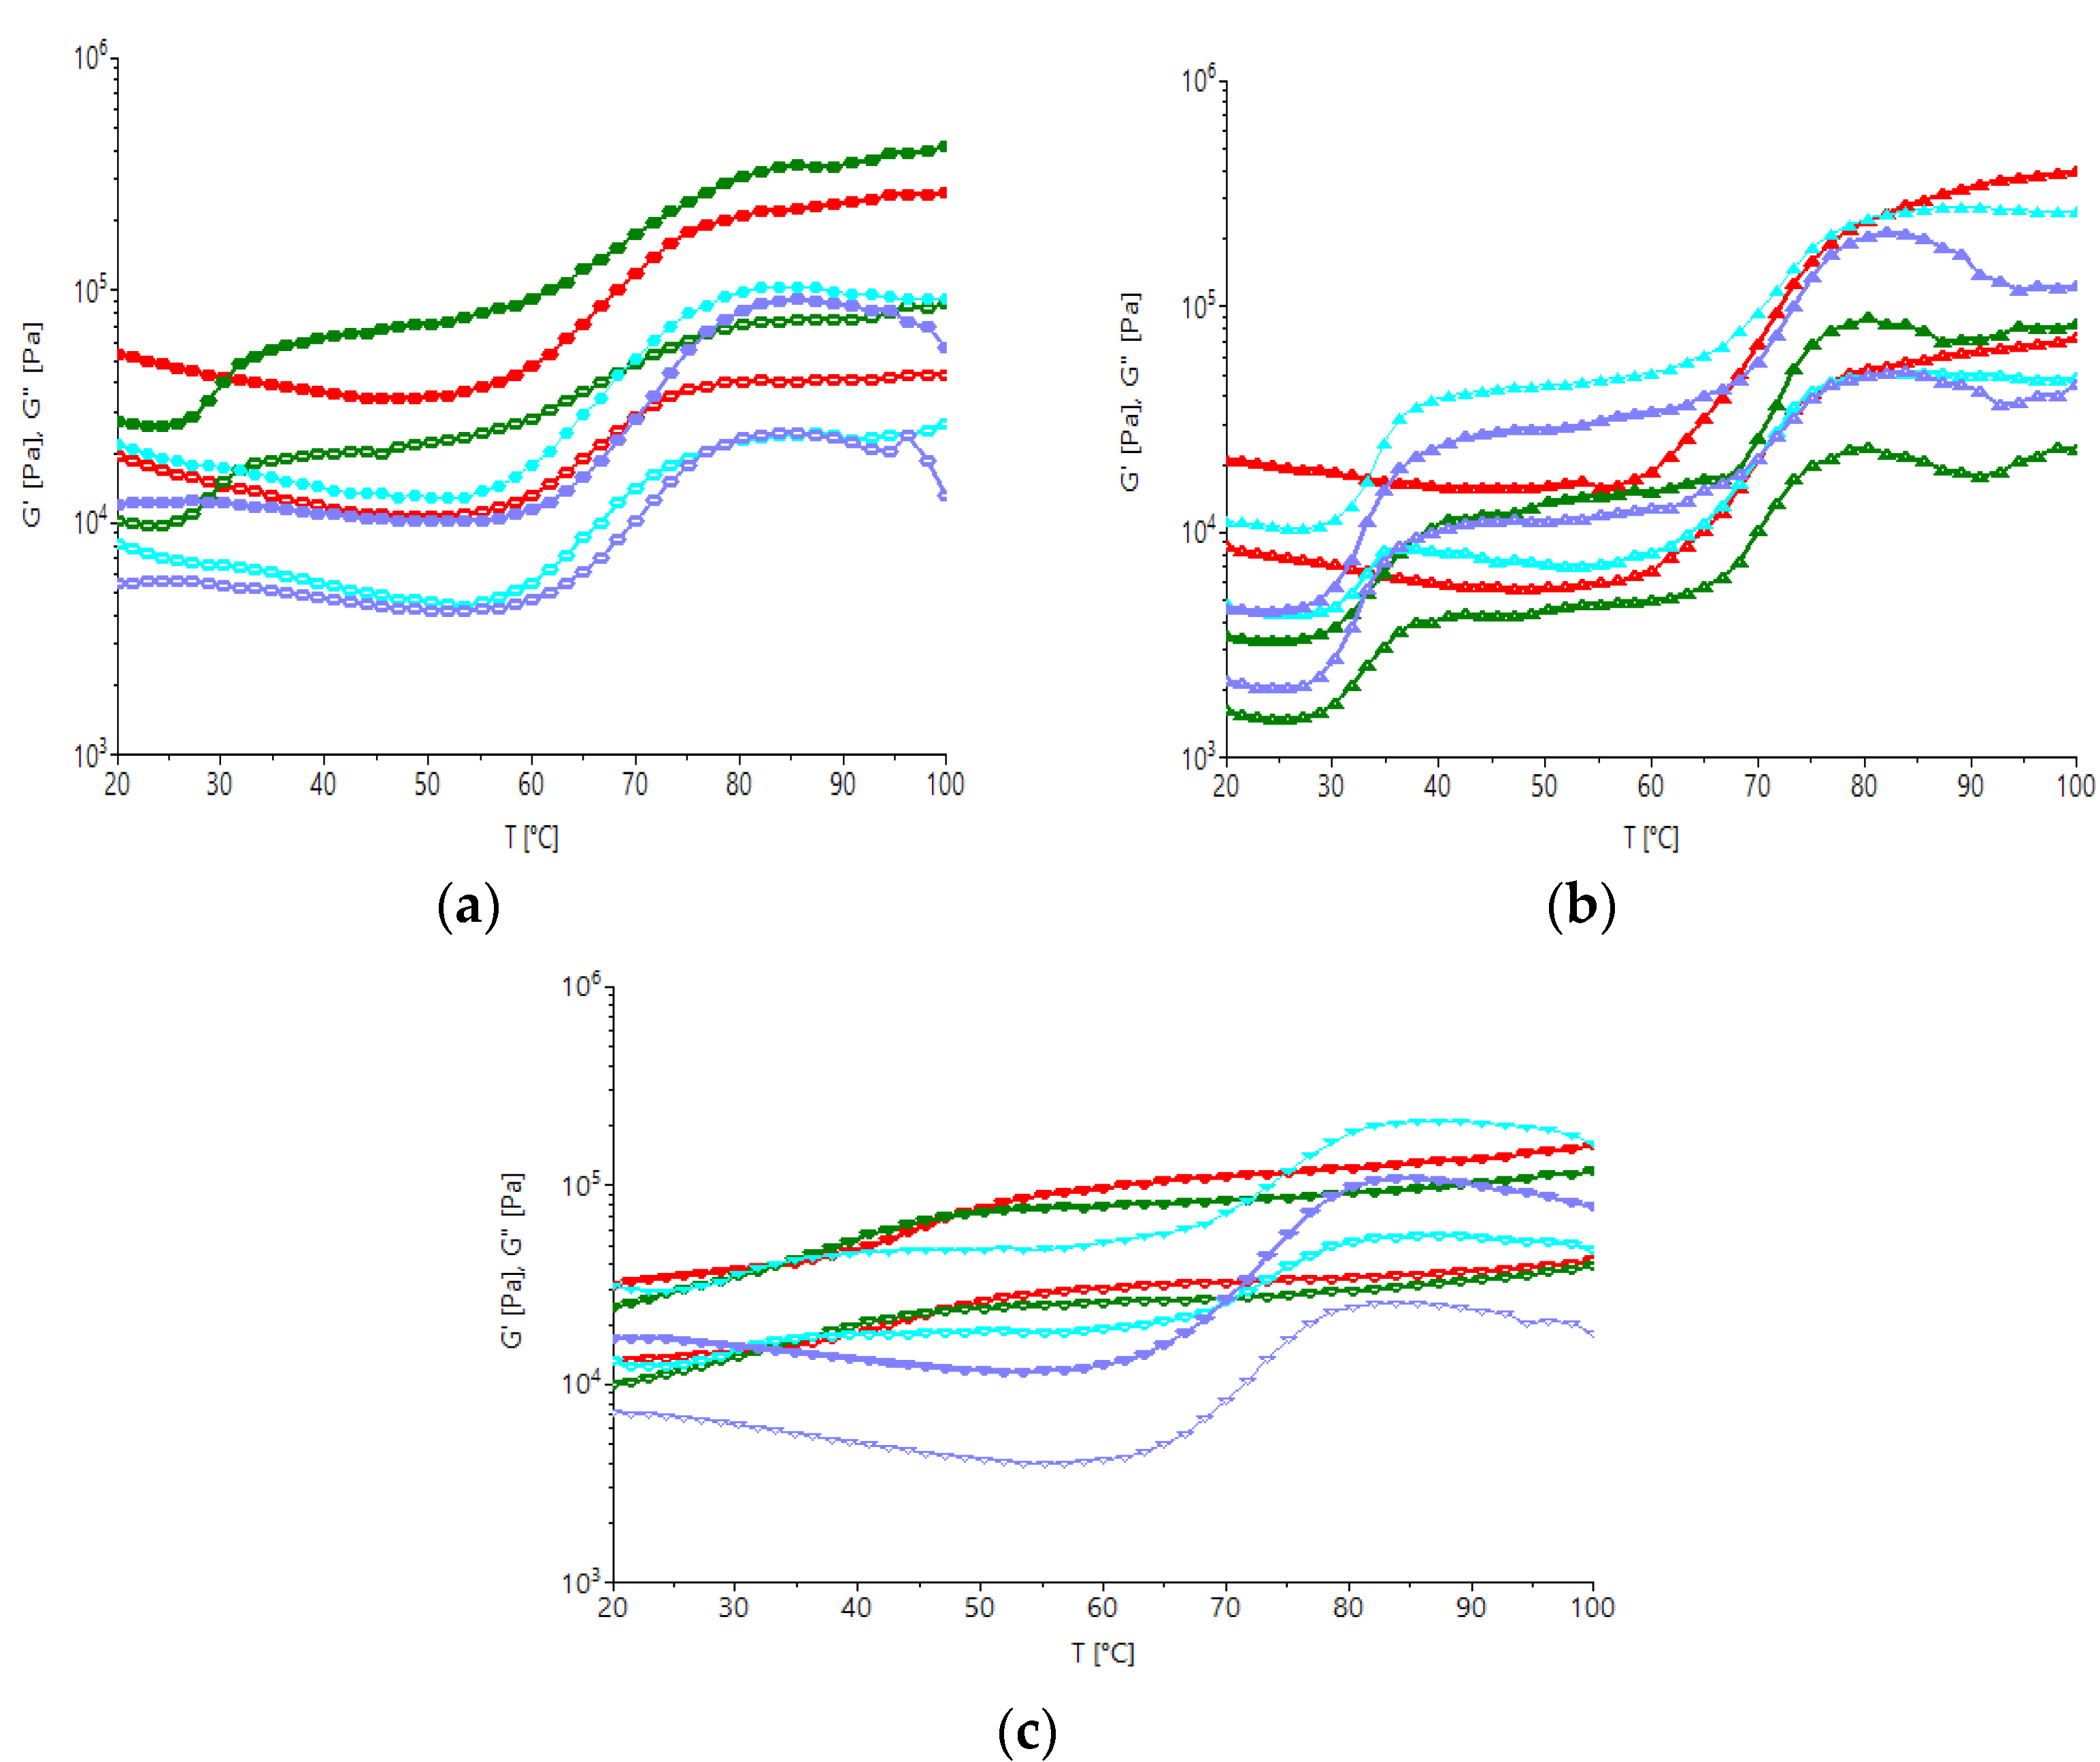
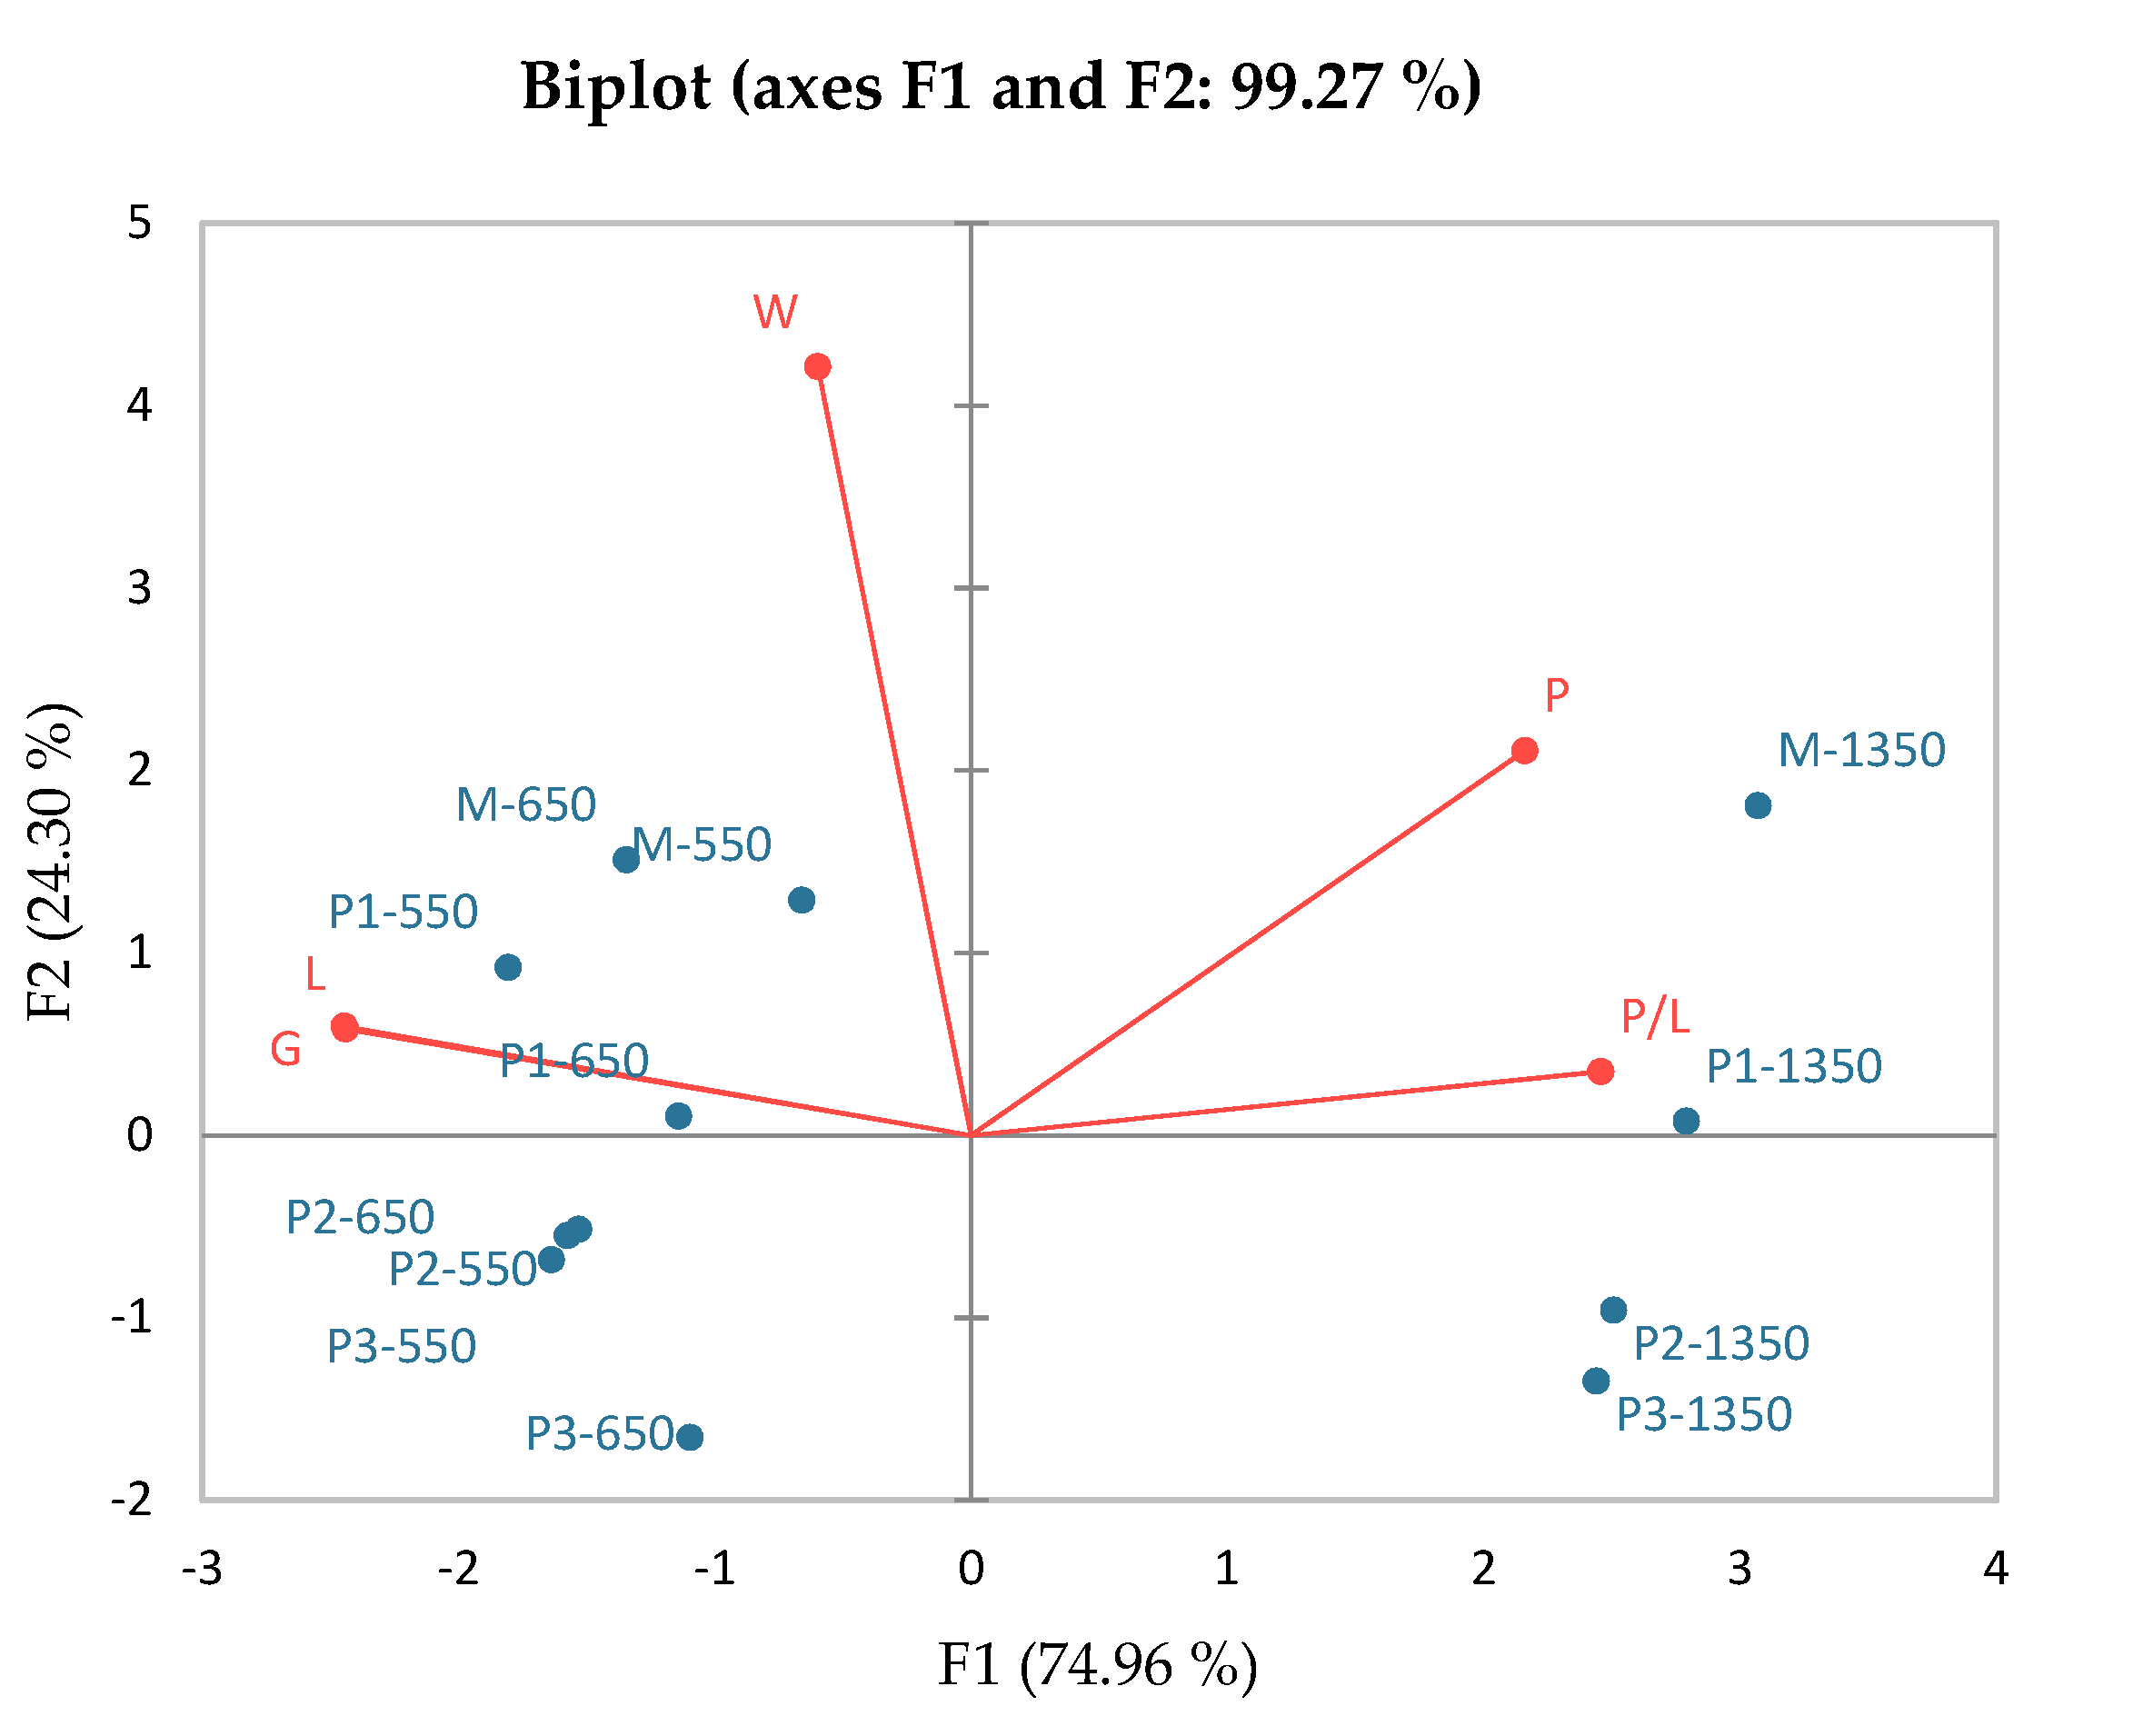
3.2. Rheological Analysis Results

Figure 2a shows the values of elastic and viscous modulus, depending on the frequency, for the dough obtained from white flour type 550 with different amounts of hemp seed oil. A visual inspection of the data suggests that all samples are dependent on the amount of oil added. The rheological properties of the 550-flour dough demonstrate the same linear decreasing tendency of both the elastic and viscous modes. Figure 2b describes the viscoelastic properties of the flour dough 650. A significant decrease in the elastic and viscous mode is observed with the addition of 15% hemp oil. This behavior can be attributed to the high protein content of white flour, but also to the size of the starch granules and the bonds that form between the starch and the incorporated oil. In general, the incorporation of oil into white flour dough decreases viscoelastic modules, G′ and G″, leading to lower values than the control dough [27,28].
Figure 2c describes the frequency and viscous modulus, depending on the frequency, for the dough obtained from black wheat flour (type 1350) with the addition of hemp seed oil. The same tendency to decrease the elasticity and viscosity of the dough is also noticeable in this dough sample. The decrease is more visible as the percentage of added oil increases. The loss modulus (G″) presents lower values than the storage modulus (G′) in all formulated dough samples, suggesting a more elastic than viscous characteristic in dough samples. This result influences the development of the dough during fermentation, increasing its capacity to retain fermentation gases and thus, increasing the elasticity of the bread crumb and volume [29,30].
Figure 3a–c describe the behavior of dough obtained from wheat flour with the addition of hemp seed oil in proportions of 0–15% under the influence of temperature variations. There has a tendency to increase the viscosity of the dough as the temperature increases. The flour dough sample 550 has the effect of increasing the viscous and elastic modulus by 5% and, by increasing the amount of oil, there is a considerable decrease in elastic and viscous behavior [31,32]. The dough obtained from 650 flour with the addition of hemp seed oil behaves differently due to the manner with which it reactions to temperature. The elastic modulus decreases significantly with a 5% addition of oil, especially when compared to the sample control, as well as with 10% and 15% oil additions.
The temperature ranges for starch gelatinization are lower for dough samples with higher oil additions. Figure 3c shows the behavior of the dough obtained from black flour (1350) under the influence of temperature. The G′ G″ modules show a linear trend for the control sample, compared to the dough sample which had an added percentage of 15% oil. The difference is significant between the two samples, this aspect will be observed in the results obtained when assessing the quality of the bread [33,34].
The alveograph data are shown in Table 1.
Analyzing the alveographic parameters highlights the bread’s extensibility and the effects of increasing the elasticity of the dough as the percentage of added oil increases. The characteristics were determined: the extensibility of the dough (mm) indicated by the length (L) of the alveogram curve, the maximum pressure (P) representing the peak height (mm), the baking strength (W), the swelling index (G), and the configuration ratio of alveograph curve (P/L). The swelling index (G) increases in all dough samples in proportion to the amount of oil added and the baking strength decreases inversely in proportion to the addition of oil [35,36]. The incorporation of oil decreases water absorption, the mixing tolerance, and the tenacity of the doughs, but increases extensibility. The incorporation of oil tends to reduce the extensibility of the doughs and the energy of deformation, measured with the alveograph which can cause problems in the use of the doughs or in the retention of gas during fermentation.
Figure 4 expresses the following through a three-dimensional graph: the distribution of swelling index, the extensibility of the dough, and the maximum pressure which describes the empirically determined rheological properties. A homogeneous distribution of the results obtained for the following characteristics was observed: the extensibility of the dough (L), the maximum pressure (P), and the swelling index (G). The values are evenly distributed because the 550 and 650 flour assortments have similar rheological behavior, with the exception of the 1350 flour, which has a different behavior both in the description of the dynamic rheology and in empirical determinations.
Principal Component Analysis (PCA) was applied to highlight the effects of adding oil to white and black flour with the alveograph determined rheological characteristics of the dough. The loads of the variables studied with regards to the first two main components, PC1 (74.96%) and PC2 (24.30%) (Figure 4) described 99.27% of the total variant. Figure 5 represents the distribution of the quality attributes determined by the alveograph determinations and the dough samples, with which they are in a significantly positive correlation. PC1 was associated with dough samples with 0–5% added oil with rheological characteristics (extensibility, baking strength, maximum pressure, and the configuration ratio of the alveograph curve). PC2 was associated with dough samples with additions of 10–15% of hemp seed oil. There is a good relationship between the extensibility and the swelling index in the control sample and the dough with an addition of 5% hemp seed oil. The samples with 10–15% were not associated with the analyzed rheological characteristics [37,38].
It can be seen that dough’s of 650 and 550 flour with a maximum of 5% added hemp oil had the best characteristics, having qualities such as high extensibility, swelling index and high resistance to baking. The 1350 flour doughs (control and P1) correlate with the maximum pressure.

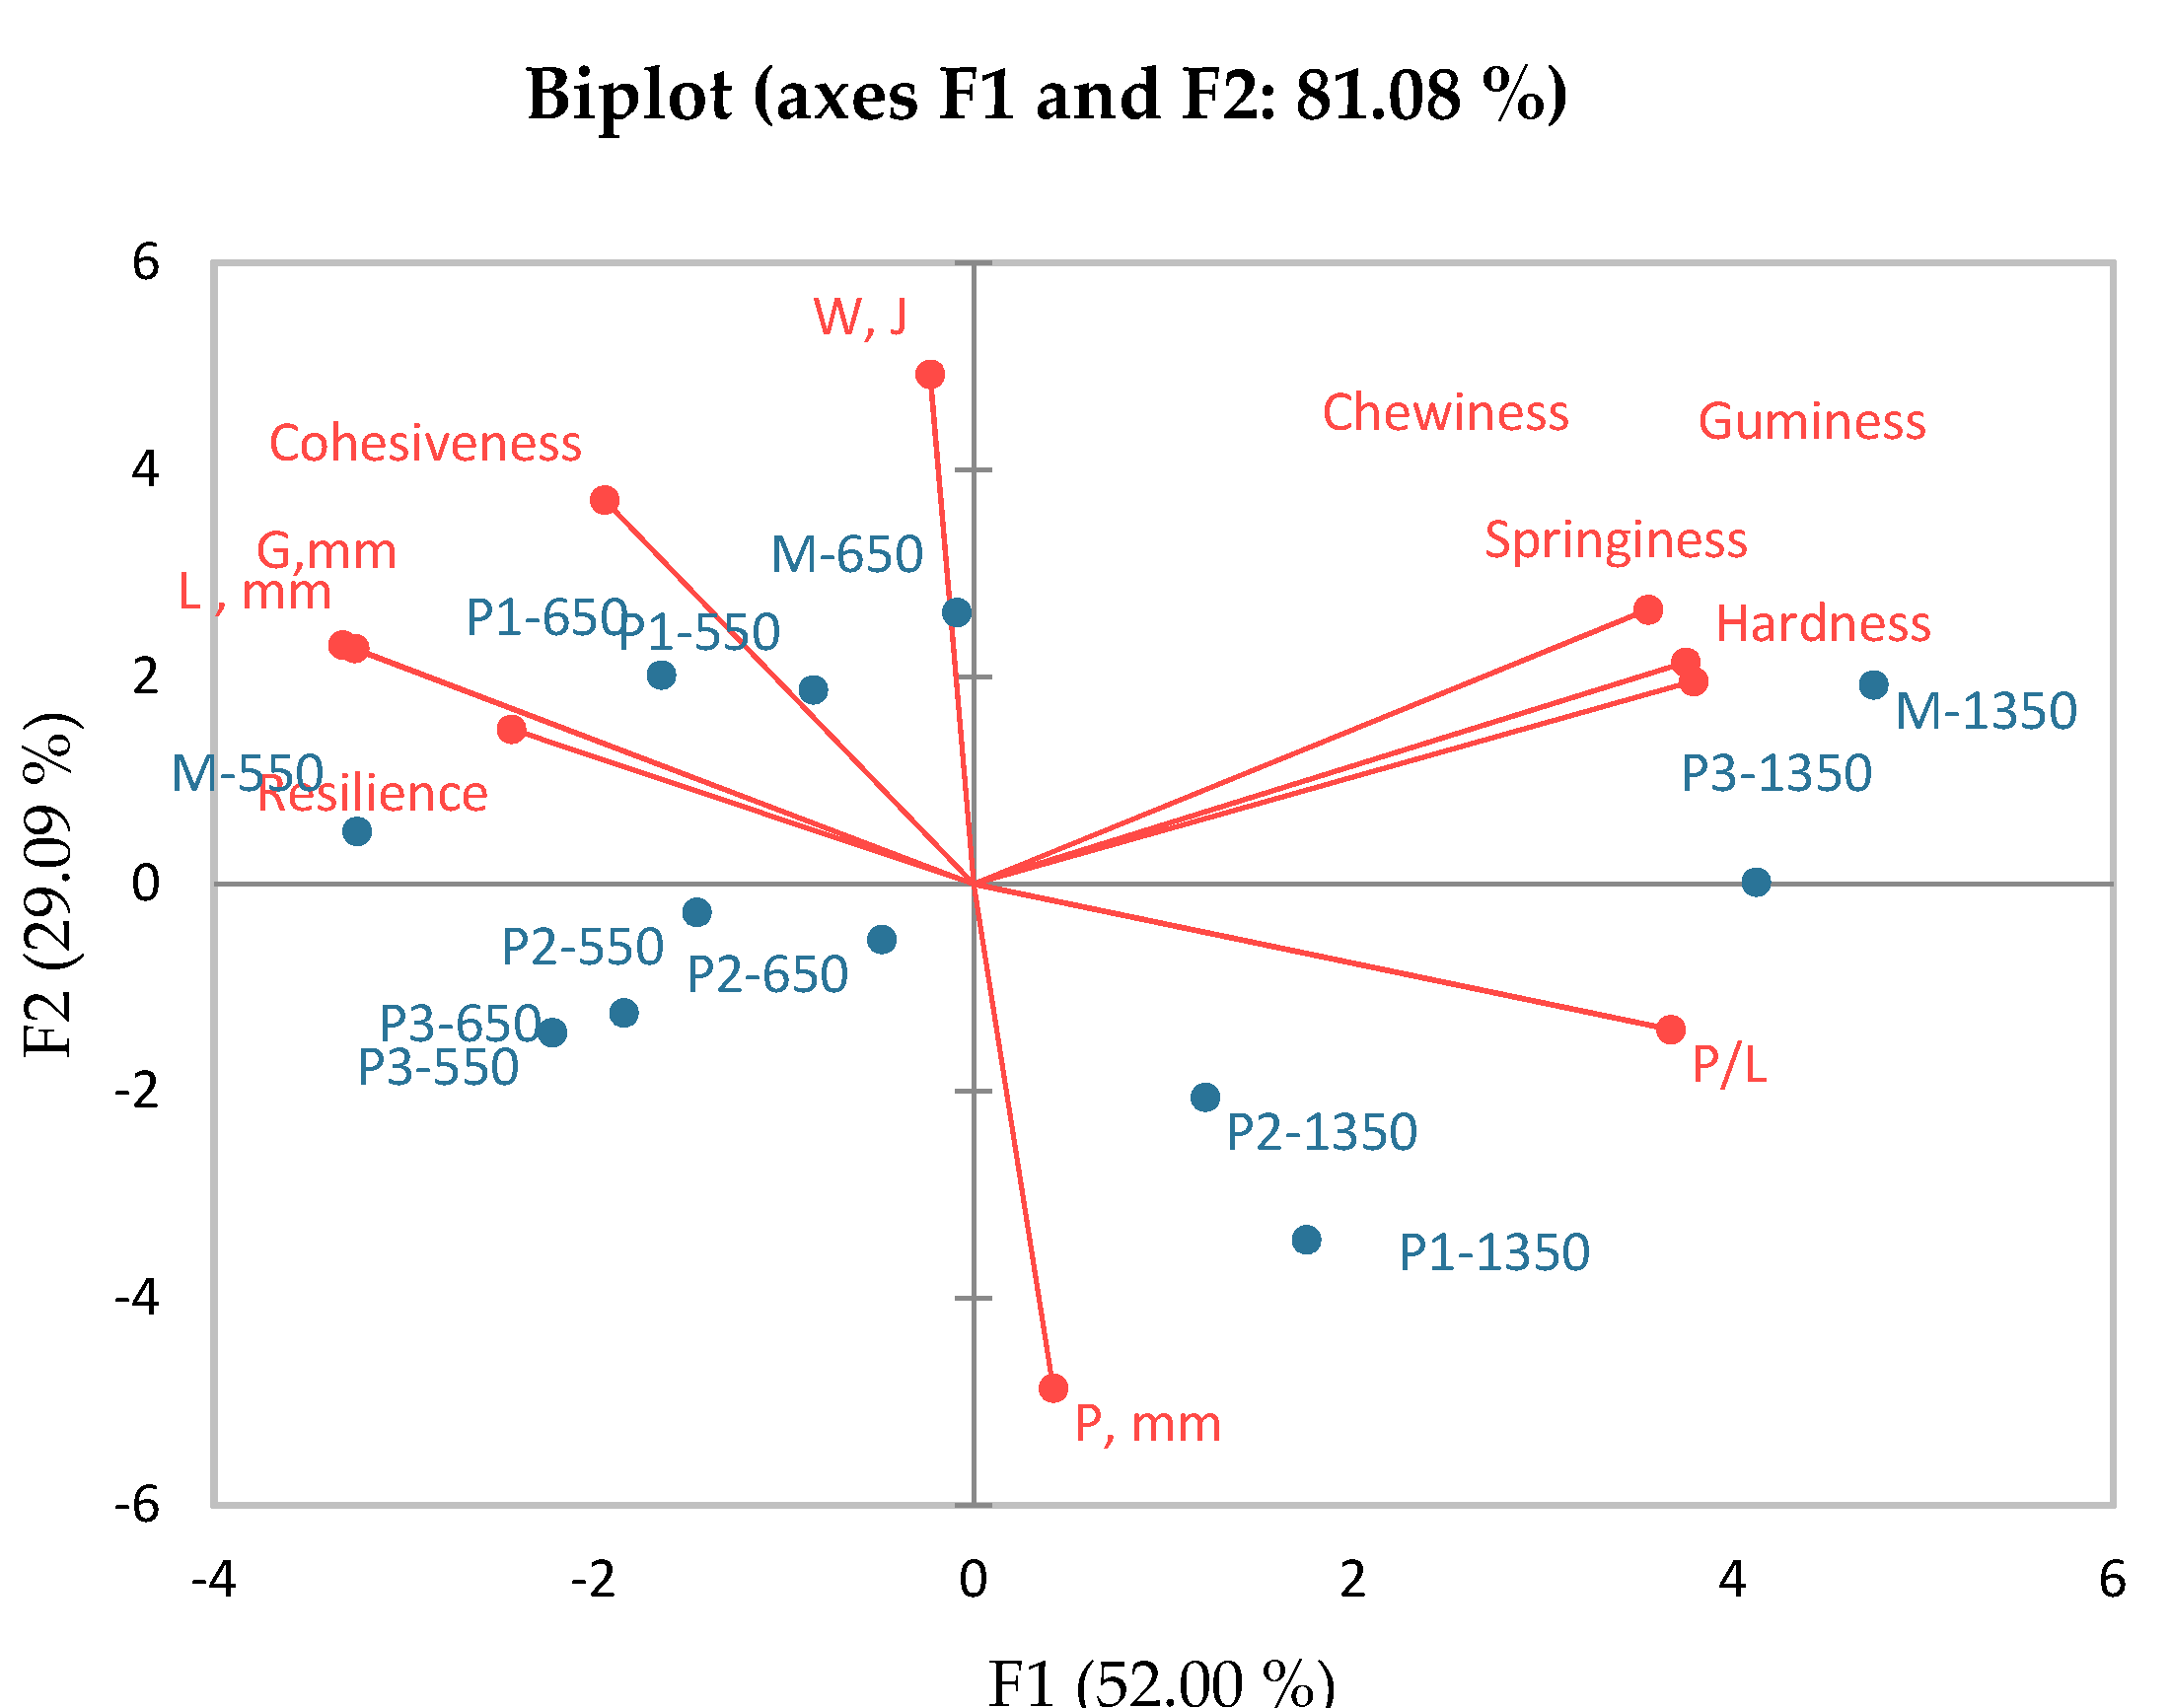
3.3. Evaluation of Bread Quality

The results regarding the analysis of the textural characteristics are presented in Table 2.
Determining the texture of white bread when supplemented with oil demonstrated that a decrease in hardness occurred when the amount of oil added amounted to 10%. When an oil percentage of 15% was added to the dough, it increased the hardness value for all resulting bread; both white and black flour samples [39,40]. This increase in hardness comes about during the process of changing the structure of the dough. The absorption of water in the starch granule is reduced, the proteins in the flour are covered with oil, and the gluten network is inhibited by the 15% addition of oil. The proteins’ glutenin and gliadin require water to combine and form gluten strands, which gives the dough its strength, stretchability, and ability to trap fermentation gasses, preventing them from rising. This increase in hardness when adding 15% oil also has a negative effect on the elasticity of the crumb. This value decreases proportionally with the increase in the percentage of incorporated oil. The fermentation of the dough is slower with the addition of high percentages of oil, which leads to an increase in the fermentation time, a decrease in the retention capacity of the fermentation gases, and finally, a reduction in the volume of the bread [41,42]. The gumminess of the crumb is correlated with the addition of oil to the bread samples. This characteristic is associated with chewability. Chewing properties (chewing time or number of chews) and the sensory perception of fat are attributes that the consumer does not like [43]. Comparable findings have been described by Puerta et al. (2020), and Jourdren, et al. (2016), correlating the perceived sensations to the appreciation of the textural characteristics of bread by panelists [44,45]. The recommendation for consumers is that the bread samples with high gumminess can be toasted before consumption.
The characteristics of the structure and texture of the bread were analyzed (Figure 6) to demonstrate the overall effect of the distribution of quality attributes. Two components accounted for 81% of the total variation in data; 29% and 52% of the variations found in main components 1 and 2, respectively. It is evident that the 650 and 550 flour bread samples correlate with the cohesiveness and extensibility properties of the dough. In the right quadrant are grouped bread samples obtained from 1350 flour, the control sample, and the sample with 15% oil that demonstrated increased hardness.
The graph represented in Figure 7 expresses the distribution of bread samples in relation to all quality attributes that described the fundamental rheological characteristics, empirical and textural characteristics. On axis 1, at the distance of origin, are the bread samples obtained from black flour (1350) with the addition of 10% and 15% hemp seed oil. On axis 2 are the white flour bread samples, type 650 and 550 (P3_550 and P3_550), which have a strong positive ratio. Observing distribution on the graph reveals significant correlations between samples P2_550 and P2_650. In conclusion, the addition of oil in the dough influences the rheological and textural properties, depending on the percentage added and the type of flour.

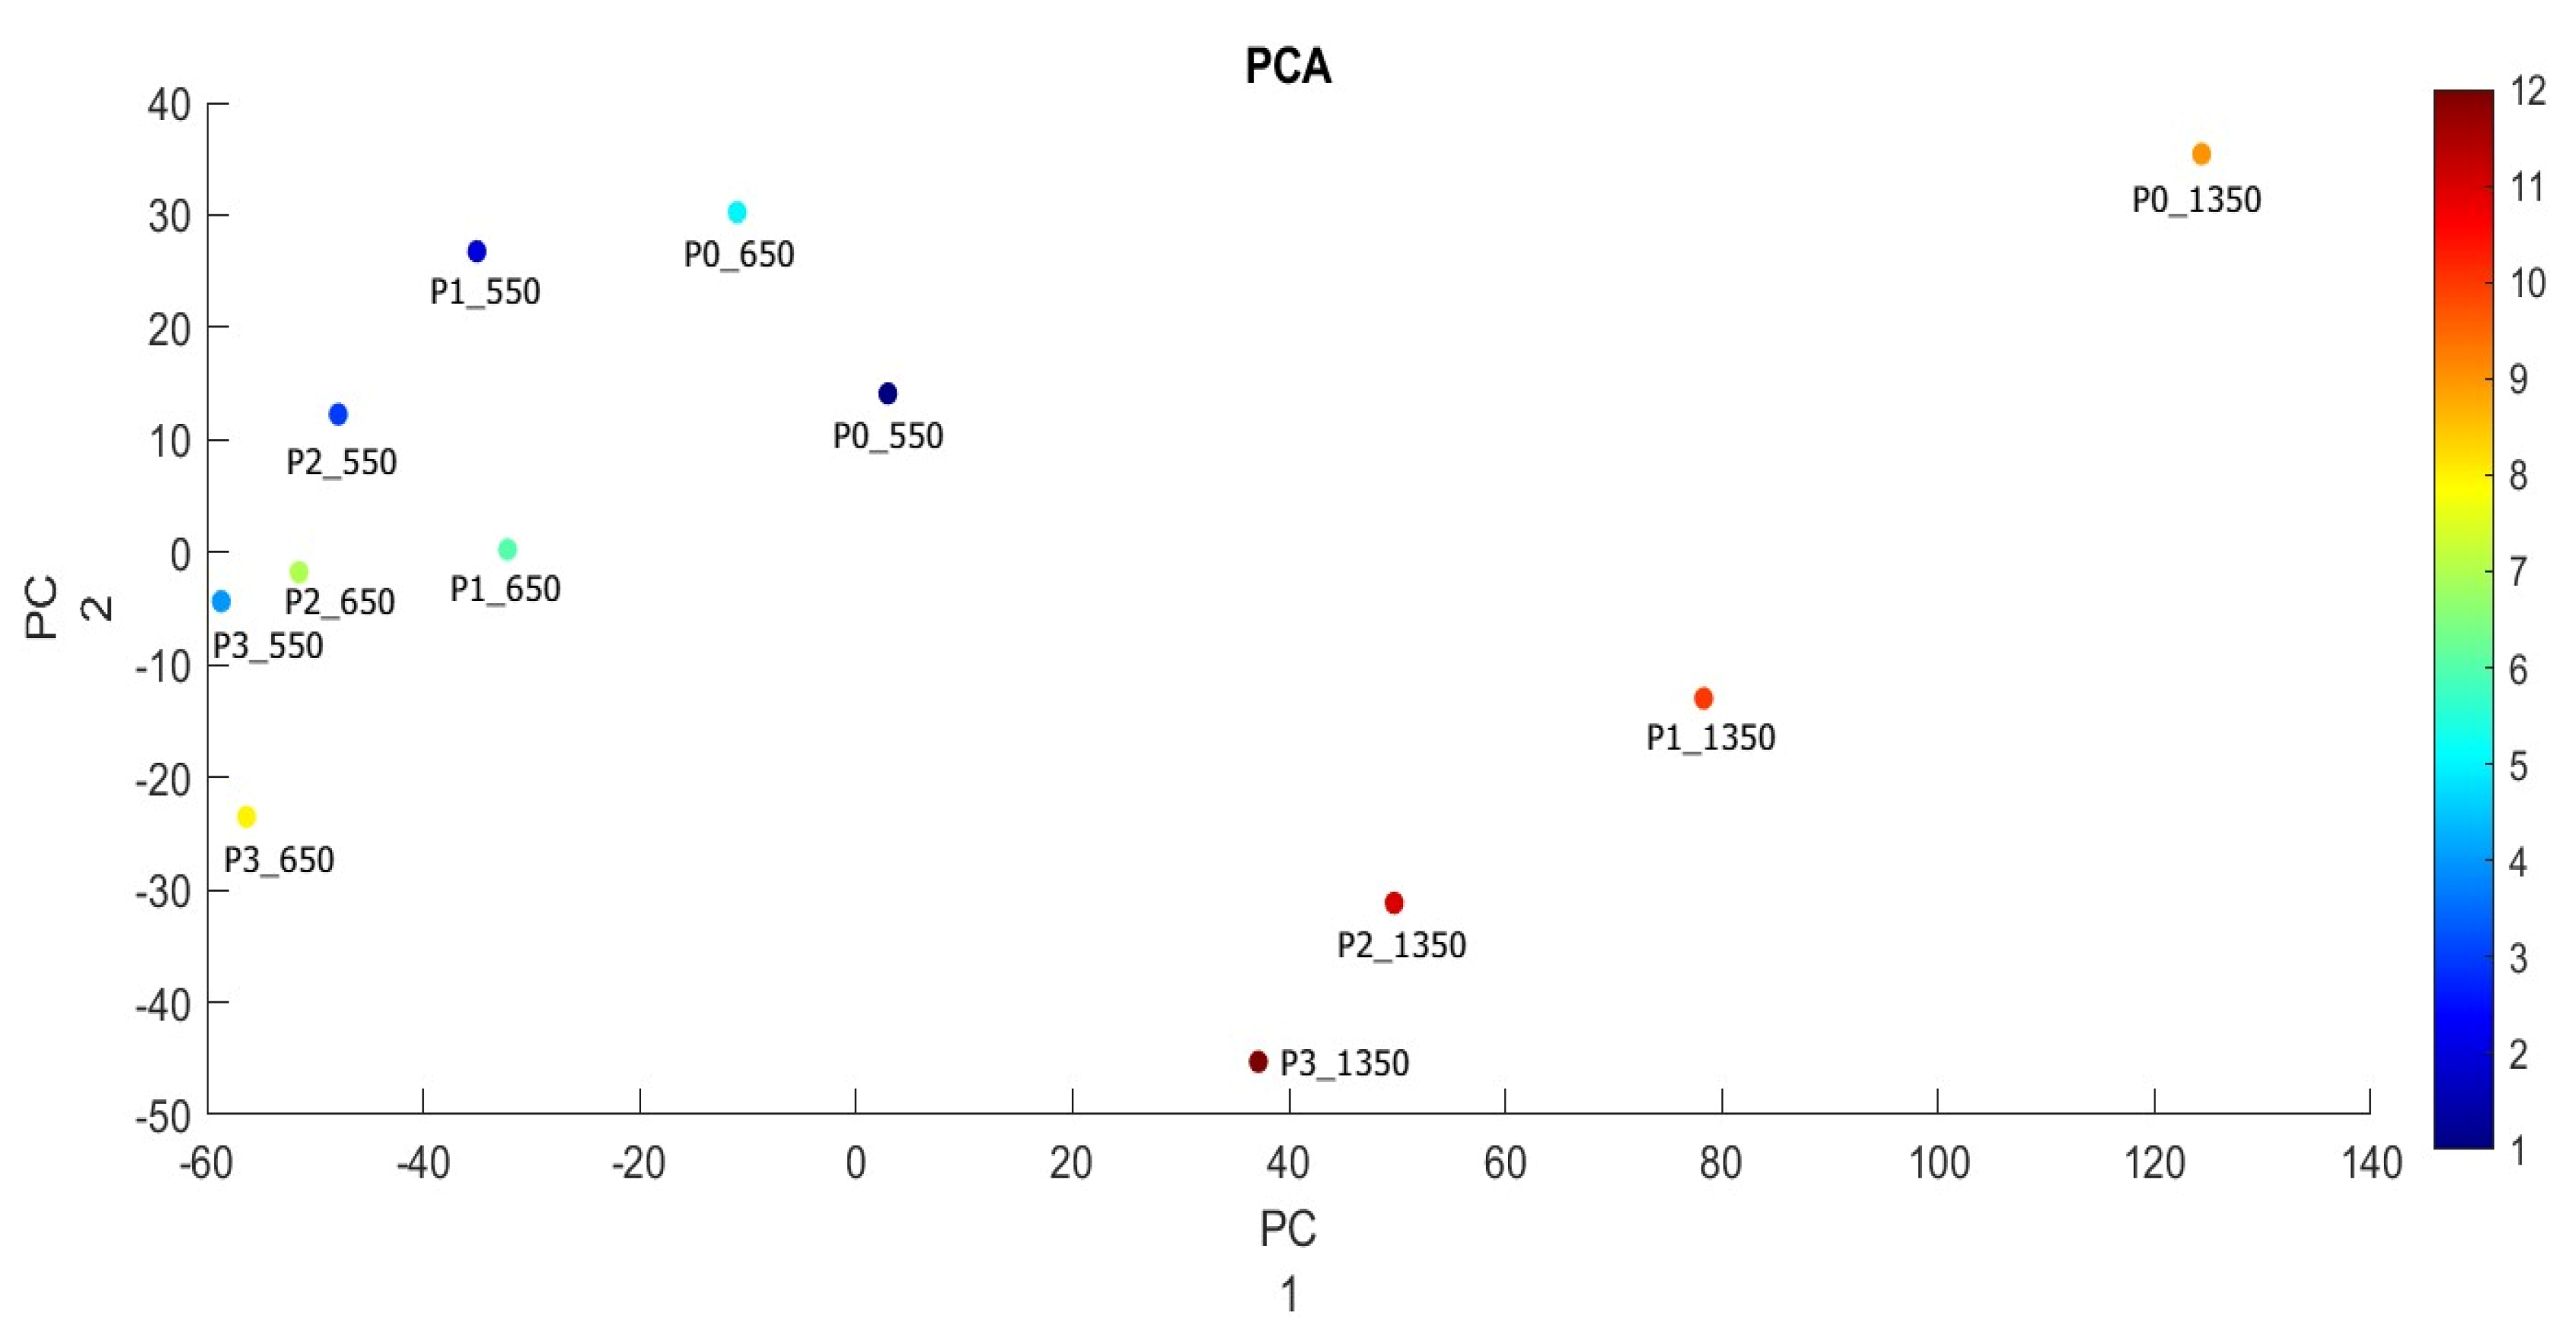
3.4. Evaluation of Sensory Quality of Bread

Sensory evaluation (Figure 8) of bread samples was performed 24 h after baking. The bread samples received up to 9 points regarding general acceptability with the following average scores: the bread samples with the addition of 5% hemp oil scored 7.66; samples with the addition of 10% hemp oil scored 8.20; samples with the addition of 15% scored 7.12. On average, the evaluators said, with regards to the addition of 5–15% hemp oil, “I like it very much” and “I like it moderately”. The evaluators appreciated the samples of black bread with the addition of 5% and 10% for its crumb pore and specific aroma. Although using hemp seed oil benefits is beneficial to bread quality, it cannot be used in excess of 10%, as, according to the evaluators’ ratings, this causes the taste to worsen. Related to this, is that other several studies have also evaluated consumer satisfaction with oils, such as sesame, chia, pumpkin, and flax, finding that 5–10% additions did not significantly alter sensory properties.

4. Conclusions

This study demonstrates the possibility of using hemp seed oil in the formulation of bread dough for both white and black bread.
Alveograph parameters were used to analyze and highlight the extensibility properties and the effect of increasing the elasticity of the dough as the percentage of added oil increases. The results indicate that the presence of hemp seed oil changes the rheological properties of the dough, increasing storage and loss values.
The loss modulus (G″) presents lower values than the storage modulus (G′) in all formulated dough samples, suggesting a more elastic than viscous characteristic in said dough samples.
The rheological properties of the dough have been improved, as have the textures in the samples obtained from black flour with the specification that the maximum oil addition is 10%. An increase in the hardness of the bread samples was noticed in bread with the addition of 15% hemp seed oil. The effect of incorporating oils in bread depends on the quantity added. In small amounts, it can be beneficial, while in larger quantities, they weaken the dough and have negative effects on the springiness. Therefore, depending on the flour type and the amount of oil added, the effects on the quality of bread may vary.

Author Contributions

Conceptualization, S.R., L.C.A. and C.D.; methodology, S.R. and A.E.P.; software, S.R.; validation, A.E.P., C.D. and L.C.A.; formal analysis, S.R. and A.E.P.; investigation, S.R. and L.C.A.; resources, A.E.P. and S.R.; data curation, S.R. and C.D.; writing—original draft preparation, A.E.P. and S.R.; writing—review and editing, S.R. and C.D.; visualization S.R. and L.C.A.; supervision, S.R.; funding acquisition, A.E.P. All authors have read and agreed to the published version of the manuscript.

Funding

This work was funded by Ministry of Research, Innovation and Digitalization within Program 1—Development of national research and development system, Subprogram 1.2—Institutional Performance—RDI excellence funding projects, under contract no. 10PFE/2021.

Institutional Review Board Statement

Not applicable.

Informed Consent Statement

Not applicable.

Data Availability Statement

Not applicable.

Conflicts of Interest

The authors declare no conflict of interest.

References

  1. Pareyt, B.; Finnie, S.M.; Putseys, J.A.; Delcour, J. Lipids in bread making: Sources, interactions, and impact on bread quality. J. Cereal Sci. 2011, 54, 266–279. [Google Scholar] [CrossRef]
  2. Manzocco, L.; Calligaris, S.; Da Pieve, S.; Marzona, S.; Nicoli, M.C. Effect of monoglyceride-oil–water gels on white bread properties. Food Res. Int. 2012, 49, 778–782. [Google Scholar] [CrossRef]
  3. Tarancón, P.; Salvador, A.; Sanz, T. Sunflower oil-watercellulose ether emulsions as trans-fatty acid-free fat replacers in biscuits: Texture and acceptability study. Food Bioprocess Technol. 2013, 6, 2389–2398. [Google Scholar] [CrossRef]
  4. Chin, N.L.; Rahman, R.A.; Hashim, D.M.; Kowng, S.Y. Palm Oil Shortening Effects on Baking Performance of White Bread. J. Food Process Eng. 2009, 33, 413–433. [Google Scholar] [CrossRef]
  5. Skrbic, B.; Filipčev, B. Nutritional and sensory evaluation of wheat breads supplemented with oleic-rich sunflower seed. Food Chem. 2008, 108, 119–129. [Google Scholar] [CrossRef]
  6. Rios, R.V.; Pessanha, M.D.F.; de Almeida, P.F.; Viana, C.L.; da Silva Lannes, S.C. Application of fats in some food products. Food Sci. Technol. 2014, 34, 3–15. [Google Scholar] [CrossRef] [Green Version]
  7. Osuna, M.B.; Romero, C.A.; Romero, A.M.; Judis, M.A.; Bertola, N.C. Proximal composition, sensorial properties and effect of ascorbic acid and α-tocopherol on oxidative stability of bread made with whole flours and vegetable oils. LWT 2018, 98, 54–61. [Google Scholar] [CrossRef] [Green Version]
  8. Leonard, W.; Zhang, P.; Ying, D.; Fang, Z. Hempseed in food industry: Nutritional value, health benefits, and industrial applications. Compr. Rev. Food Sci. Food Saf. 2019, 19, 282–308. [Google Scholar] [CrossRef] [Green Version]
  9. El-Adawy, T.A. Effect of sesame seed proteins supplementation on the nutritional, physical, chemical and sensory properties of wheat flour bread. Mater. Veg. 1995, 48, 311–326. [Google Scholar] [CrossRef]
  10. Austria, J.A.; Aliani, M.; Malcolmson, L.J.; Dibrov, E.; Blackwood, D.P.; Maddaford, T.G.; Guzman, R.; Pierce, G.N. Daily choices of functional foods supplemented with milled flaxseed by a patient population over one year. J. Funct. Foods 2016, 26, 772–780. [Google Scholar] [CrossRef]
  11. Montesano, D.; Blasi, F.; Simonetti, M.S.; Santini, A.; Cossignani, L. Chemical and Nutritional Characterization of Seed Oil from Cucurbita maxima L. (var. Berrettina) Pumpkin. Foods 2018, 7, 30. [Google Scholar] [CrossRef] [PubMed] [Green Version]
  12. Hyvärinen, H.K.; Pihlava, J.-M.; Hiidenhovi, J.A.; Hietaniemi, V.; Korhonen, A.H.J.T.; Ryhänen, E.-L. Effect of Processing and Storage on the Stability of Flaxseed Lignan Added to Bakery Products. J. Agric. Food Chem. 2005, 54, 48–53. [Google Scholar] [CrossRef] [PubMed]
  13. Gomez, M.; Ronda, F.; Blanco, C.; Caballero, P.A.; Apesteguía, A. Effect of dietary fibre on dough rheology and bread quality. Eur. Food Res. Technol. 2003, 216, 51–56. [Google Scholar] [CrossRef]
  14. Moreira, R.; Chenlo, F.; Torres, M. Effect of chia (Sativa hispanica L.) and hydrocolloids on the rheology of gluten-free doughs based on chestnut flour. LWT 2013, 50, 160–166. [Google Scholar] [CrossRef]
  15. Mansour, E.H.; Dworschák, E.; Pollhamer, Z.; Gergely, Á.; Hóvári, J. Pumplin and canola seed proteins and bread quality. Acta Aliment. 1999, 28, 59–70. [Google Scholar]
  16. Jourdren, S.; Panouillé, M.; Saint-Eve, A.; Déléris, I.; Forest, D.; Lejeune, P.; Souchon, I. Breakdown pathways during oral processing of different breads: Impact of crumb and crust structures. Food Funct. 2016, 7, 1446–1457. [Google Scholar] [CrossRef]
  17. Atudorei, D.; Atudorei, O.; Codină, G. Dough Rheological Properties, Microstructure and Bread Quality of Wheat-Germinated Bean Composite Flour. Foods 2021, 10, 1542. [Google Scholar] [CrossRef] [PubMed]
  18. Mironeasa, S.; Codină, G.G. Dough Rheological Behavior and Microstructure Characterization of Composite Dough with Wheat and Tomato Seed Flours. Foods 2019, 8, 626. [Google Scholar] [CrossRef] [Green Version]
  19. Mancebo, C.M.; Martínez, M.M.; Merino, C.; De La Hera, E.; Gómez, M. Effect of oil and shortening in rice bread quality: Relationship between dough rheology and quality characteristics. J. Texture Stud. 2017, 48, 597–606. [Google Scholar] [CrossRef] [PubMed]
  20. AACC International Method 54-30.02. Alveograph Method for Soft and Hard Wheat Flour. 1999. Available online: https://www.cerealsgrains.org/resources/Methods/Pages/54PhysicalDoughTests.aspx (accessed on 4 March 2022).
  21. De Lamo, B.; Gómez, M. Bread Enrichment with Oilseeds. A Review. Foods 2018, 7, 191. [Google Scholar] [CrossRef] [PubMed] [Green Version]
  22. Pojic, M.; Hadnadev, T.D.; Hadnaved, M.; Rakita, S.; Brlek, T. Bread supplimentation with hemp seed cake: A by-product of hemp oil processing. J. Food Qual. 2015, 38, 431–440. [Google Scholar] [CrossRef] [Green Version]
  23. Day, L.; Golding, M. Food Structure, Rheology, and Texture; Elsevier BV: Amsterdam, The Netherlands, 2016; pp. 125–129. [Google Scholar]
  24. Švec, I.; Hrušková, M. Crumb evaluation of bread with hemp products addition by means of image analysis. Acta Univ. Agric. Silvic. Mendel. Brun. 2013, 61, 1867–1872. [Google Scholar] [CrossRef] [Green Version]
  25. Rusu, I.; Mureşan, C.C.; Mureşan, A.E.; Mureşan, V.; Pop, C.R.; Chiş, M.S.; Man, S.M.; Filip, M.R.; Onica, B.-M.; Alexa, E.; et al. Hemp (Cannabis sativa L.) Flour-Based Wheat Bread as Fortified Bakery Product. Plants 2021, 10, 1558. [Google Scholar] [CrossRef] [PubMed]
  26. Apostol, L.; Belc, N.; Gaceu, L.; Oprea, O.B.; Popa, M.E. Sorghum Flour: A Valuable Ingredient for Bakery Industry? Appl. Sci. 2020, 10, 8597. [Google Scholar] [CrossRef]
  27. Slade, L.; Levine, H.; Finley, J.W. Protein-water interactions: Water as a plasticizer of gluten and other protein polymers. In Protein Quality and the Effects of Processing; CRC Press: Boca Raton, FL, USA, 1989; Volume 9, p. 124. [Google Scholar]
  28. Jarosław, K.; Lesław, J.; Witczak, M.; Ziobro, R. Effect of citrus fiber on the rheological properties of dough and quality of the gluten-free bread. Appl. Sci. 2020, 10, 6633. [Google Scholar]
  29. Menteş, Ö.; Bakkalbaşşi, E.; Ercan, R. Effect of the Use of Ground Flaxseed on Quality and Chemical Composition of Bread. Food Sci. Technol. Int. 2008, 14, 299–306. [Google Scholar] [CrossRef]
  30. Coelho, M.S.; Salas-Mellado, M.M. Effects of substituting chia (Salvia hispanica L.) flour or seeds for wheat flour on the quality of the bread. LWT Food Sci. Technol. 2015, 60, 729–736. [Google Scholar] [CrossRef] [Green Version]
  31. Costantini, L.; Lukšič, L.; Molinari, R.; Kreft, I.; Bonafaccia, G.; Manzi, L.; Merendino, N. Development of gluten-free bread using tartary buckwheat and chia flour rich in flavonoids and omega-3 fatty acids as ingredients. Food Chem. 2014, 165, 232–240. [Google Scholar] [CrossRef]
  32. Korus, J.; Witczak, M.; Ziobro, R.; Juszczak, L. Hemp (Cannabis sativa subsp. sativa) flour and protein preparation as natural nutrients and structure forming agents in starch based gluten-free bread. LWT 2017, 84, 143–150. [Google Scholar] [CrossRef]
  33. Romero-Lopez, M.R.; Osorio-Diaz, P.; Bello-Perez, L.A.; Tovar, J.; Bernardino-Nicanor, A. Fiber Concentrate from Orange (Citrus sinensis L.) Bagase: Characterization and Application as Bakery Product Ingredient. Int. J. Mol. Sci. 2011, 12, 2174–2186. [Google Scholar] [CrossRef] [Green Version]
  34. Melini, F.; Melini, V.; Luziatelli, F.; Ruzzi, M. Current and Forward-Looking Approaches to Technological and Nutritional Improvements of Gluten-Free Bread with Legume Flours: A Critical Review. Compr. Rev. Food Sci. Food Saf. 2017, 16, 1101–1122. [Google Scholar] [CrossRef] [PubMed]
  35. Codină, G.G.; Mironeasa, S. Use of response surface methodology to investigate the effects of brown and golden flaxseed on wheat flour doughmicrostructure and rheological properties. J. Food Sci. Technol.-Mysore 2016, 53, 4149–4158. [Google Scholar] [CrossRef] [PubMed] [Green Version]
  36. Coţovanu, I.; Mironeasa, S. Influence of Buckwheat Seed Fractions on Dough and Baking Performance of Wheat Bread. Agronomy 2022, 12, 137. [Google Scholar] [CrossRef]
  37. Gao, J.; Ong, J.J.-X.; Henry, J.; Zhou, W. Physical breakdown of bread and its impact on texture perception: A dynamic perspective. Food Qual. Prefer. 2017, 60, 96–104. [Google Scholar] [CrossRef]
  38. Purificación, G.S.; Igual, M.; Martínez-Monz, J. Physicochemical properties and consumer acceptance of bread enriched with alternative proteins. Foods 2020, 9, 933. [Google Scholar]
  39. Agyare, K.; Addo, K.; Xiong, Y.; Akoh, C. Effect of structured lipid on alveograph characteristics, baking and textural qualities of soft wheat flour. J. Cereal Sci. 2005, 42, 309–316. [Google Scholar] [CrossRef]
  40. Mao, Q.; Sun, Y.; Hou, J.; Yu, L.; Liu, Y.; Liu, C.; Xu, N. Relationships of Image Texture Properties with Chewing Activity and Mechanical Properties during Mastication of Bread. Int. J. Food Eng. 2016, 12, 311–321. [Google Scholar] [CrossRef]
  41. Van Eck, A.; Hardeman, N.; Karatza, N.; Fogliano, V.; Scholten, E.; Stieger, M. Oral processing behavior and dynamic sensory perception of composite foods: Toppings assist saliva in bolus formation. Food Qual. Prefer. 2019, 71, 497–509. [Google Scholar] [CrossRef] [Green Version]
  42. Gómez, A.; Ferrero, C.; Calvelo, A.; Añón, M.; Puppo, M. Effect of Mixing Time on Structural and Rheological Properties of Wheat Flour Dough for Breadmaking. Int. J. Food Prop. 2011, 14, 583–598. [Google Scholar] [CrossRef]
  43. Beikzadeh, S.; Shojaee-Aliabadi, S.; Dadkhodazade, E.; Sheidaei, Z.; Abedi, A.-S.; Mirmoghtadaie, L.; Hosseini, S.M. Comparison of Properties of Breads Enriched with Omega-3 Oil Encapsulated in β-Glucan and Saccharomyces cerevisiae Yeast Cells. Appl. Food Biotechnol. 2019, 1, 11–20. [Google Scholar]
  44. Puerta, P.; Laguna, L.; Villegas, B.; Rizo, A.; Fiszman, S.; Tarrega, A. Oral processing and dynamics of texture perception in commercial gluten-free breads. Food Res. Int. 2020, 134, 109233. [Google Scholar] [CrossRef] [PubMed]
  45. Jourdren, S.; Saint-Eve, A.; Panouillé, M.; Lejeune, P.; Déléris, I.; Souchon, I. Respective impact of bread structure and oral processing on dynamic texture perceptions through statistical multiblock analysis. Food Res. Int. 2016, 87, 142–151. [Google Scholar] [CrossRef] [PubMed]
Figure 1. (a) Bread samples obtained from the three types of flour (external appearance); (b) Section appearance of bread samples.
Applsci 12 02764 g001
Figure 2. (a) G′ G″ dough modulus (points) and power curves (lines) depending on frequency at 550 flour dough samples for four different added oil contents: 0% (red point), 5% (green point), 10% (blue point), and 15% (purple point); (b) G′ G″ dough modulus (triangle with tip up) and power curves (lines) depending on frequency at 650 flour dough samples for four different added oil contents: 0% (red triangle), 5% (green triangle), 10% (blue triangle), and 15% (purple triangle); (c) G′ G″ dough modulus (triangle with tip down) and power curves (lines) depending on frequency at 1350 flour dough samples for four different added oil contents: 0% (red triangle), 5% (green triangle), 10% (blue triangle), and 15% (purple triangle).
Applsci 12 02764 g002
Figure 3. (a) G′ G″ dough modulus (points) and power curves (lines) depending on temperature at 550 flour dough samples for four different amounts of added oil: 0% (red point), 5% (green point), 10% (blue point), and 15% (purple point); (b) G′ G″ dough modulus (triangle with tip up) and power curves (lines) depending on temperature at 650 flour dough samples for four different amounts of added oil: 0% (red triangle), 5% (green triangle), 10% (blue triangle), and 15% (purple triangle); (c) G′ G″ dough modulus (triangle with tip up) and power curves (lines) depending on temperature at 1350 flour dough samples for four different amounts of added oil: 0% (red triangle), 5% (green triangle), 10% (blue triangle), and 15% (purple triangle).
Applsci 12 02764 g003
Figure 4. Graphic representation of the main alveograph characteristics.
Applsci 12 02764 g004
Figure 5. Principal component analysis (PCA) graph showing the distribution of rheological variables for the dough samples analyzed.
Applsci 12 02764 g005
Figure 6. Analysis of the main components for the correlations between the bread samples and the rheological and textural characteristics.
Applsci 12 02764 g006
Figure 7. Graph of the distribution of bread samples in relation to the quality characteristics and the proportion of added hemp seed oil.
Applsci 12 02764 g007
Figure 8. Sensory properties of bread samples.
Applsci 12 02764 g008
Table 1. Results of alveographer characteristics for wheat flour with the addition of hemp seed oil.
SampleP, mmL, mmG, mmW, JP/L
M_55099 ± 0.01 a79 ± 0.02 a19.8 ± 0.02 a283 ± 0.02 c1.47 ± 0.01 a
P1_55089 ± 0.01 a110 ± 0.01 c23.3 ± 0.02 c262 ± 0.02 b1.81 ± 0.02 c
P2_550106 ± 0.02 b99 ± 0.01 ab22.1 ± 0.03 c179 ± 0.02 a1.70 ± 0.02 b
P3_550122 ± 0.02 c96 ± 0.01 b21.8 ± 0.01 b179 ± 0.01 a2.56 ± 0.02 d
M_650105 ± 0.01 b97 ± 0.02 c21.9 ± 0.01298 ± 0.01 c1.08 ± 0.02 c
P1_65095 ± 0.01 a86 ± 0.01 a20.6 ± 0.01221 ± 0.01 b0.94 ± 0.01 b
P2_650112 ± 0.01 c96 ± 0.01 b21.8 ± 0.02184 ± 0.01 a0.68 ± 0.03 a
P3_650120 ± 0.01 d79 ± 0.02 c19.8 ± 0.03122 ± 0.01 ab0.63 ± 0.02 a
M_1350102 ± 0.01 a27 ± 0.01 a11.6 ± 0.02271 ± 0.01 c8.0 ± 0.03 d
P1_1350108 ± 0.02 a24 ± 0.01 a10.9 ± 0.01183 ± 0.02 b7.13 ± 0.03 c
P2_1350117 ± 0.03 b22 ± 0.02 a10.4 ± 0.01135 ± 0.02 b6.27 ± 0.03 b
P3_1350128 ± 0.02 c21 ± 0.01 a10.2 ± 0.01116 ± 0.02 a6.05 ± 0.03 a
a–d Mean values in the same column (corresponding to the same parameters) indicated statistically significant differences (p < 0.05).
Table 2. Texture parameters of the bread samples with different percentages of hemp seed oil added.
SampleHardness
(N)
Springiness
(Adimensional)
Cohesiveness
(Adimensional)
Gumminess
(N)
Resilience
(Adimensional)
M_5506.95 ± 0.02 b3.86 ± 0.01 a0.9 ± 0.01 b6.28 ± 0.00 d2.3 ± 0.12 d
P1_5506.37 ± 0.03 b5.58 ± 0.02 b0.8 ± 0.02 a5.19 ± 0.00 b1.8 ± 0.11 a
P2_5505.36 ± 0.01 a8.42 ± 0.03 d0.8 ± 0.03 a4.14 ± 0.01 a2.3 ± 0.14 d
P3_5505.60 ± 0.02 c6.20 ± 0.02 c0.8 ± 0.03 a5.39 ± 0.01 c2.5 ± 0.02 d
M_6506.45 ± 0.02 b3.68 ± 0.03 a0.9 ± 0.03 c5.54 ± 0.00 c2.5 ± 0.01 b
P1_6506.31 ± 0.00 b4.83 ± 0.00 c0.9 ± 0.01 c5.76 ± 0.01 c3.0 ± 0.11 c
P2_6505.53 ± 0.02 a4.12 ± 0.01 b0.7 ± 0.01 a4.09 ± 0.01 a1.7 ± 0.10 a
P3_6506.21 ± 0.03 c3.67 ± 0.01 a0.8 ± 0.03 b5.09 ± 0.00 b2.7 ± 0.04 b
M_13509.35 ± 0.01 c2.95 ± 0.11 c0.8 ± 0.03 b7.52 ± 0.10 c1.9 ± 0.04 a b
P1_13509.01 ± 0.01 c2.74 ± 0.15 c0.8 ± 0.02 b6.85 ± 0.01 b1.7 ± 0.03 a
P2_13508.71 ± 0.02 b1.94 ± 0.21 b0.8 ± 0.03 b6.82 ± 0.01 b2.2 ± 0.03 b
P3_13508.99 ± 0.03 a1.86 ± 0.20 a0.7 ± 0.02 a6.41 ± 0.01 a1.6 ± 0.04 a
a–d Mean values in the same column (corresponding to the same parameters) indicate statistically differ significantly (p < 0.05).
Publisher’s Note: MDPI stays neutral with regard to jurisdictional claims in published maps and institutional affiliations.

