
On the Geochemistry of Major and Trace Elements Distribution in Sediments and Soils of Zarafshon River Valley, Western Tajikistan

 ,
,  ,
,  and
and
Abstract
:1. Introduction
2. Hypothesis and Research Objectives
3. Geological Setting
4. Materials and Methods
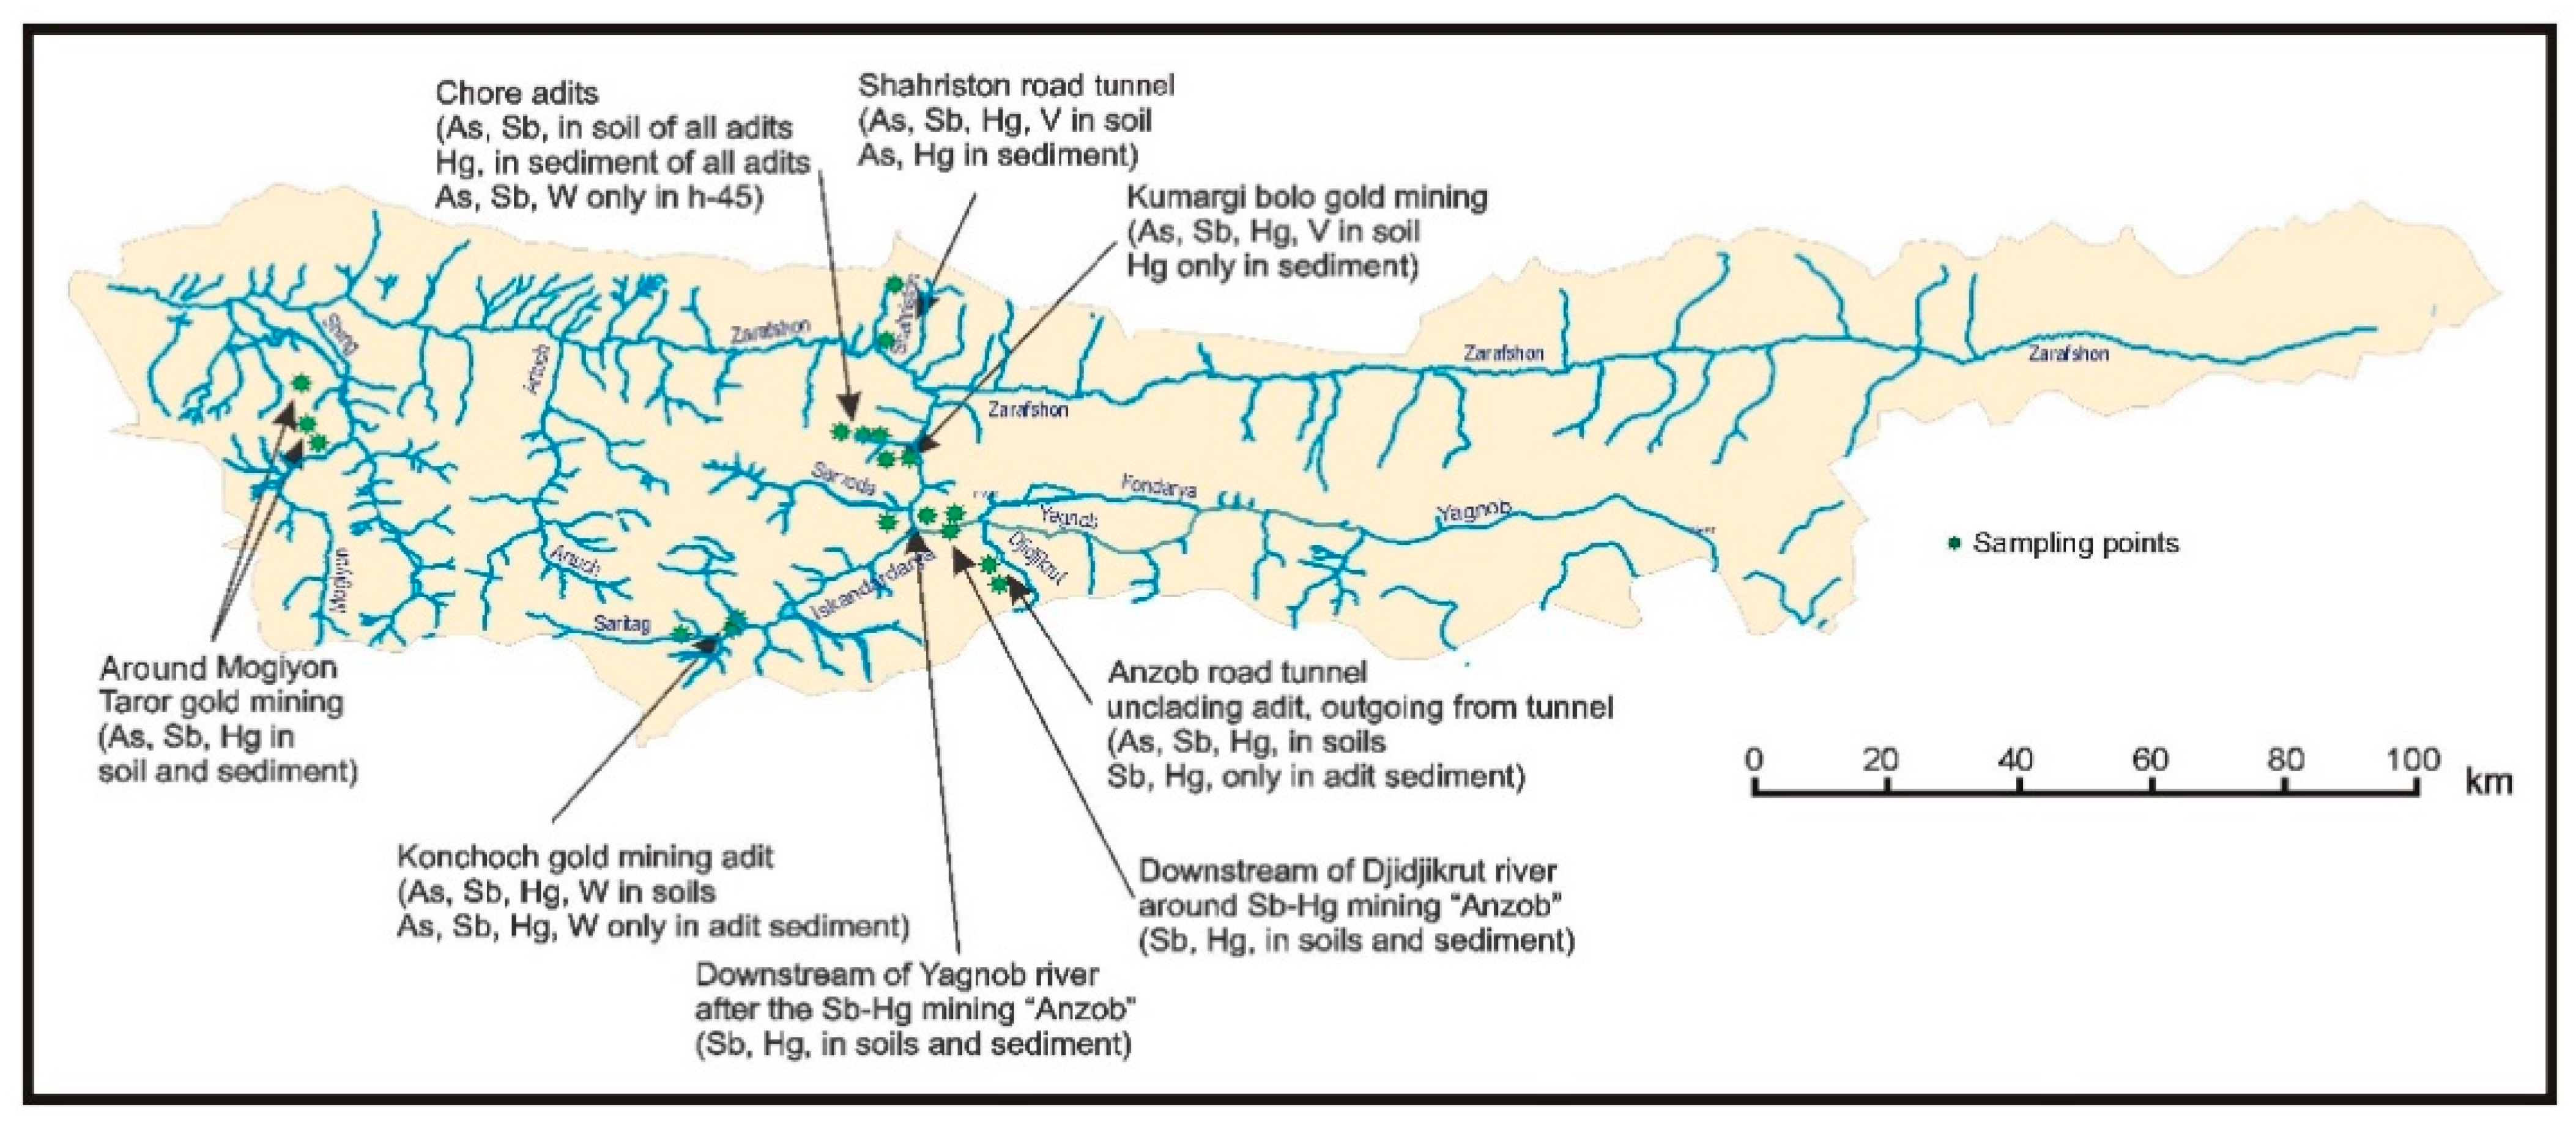
4.1. Sampling
4.2. Samples Preparation
4.3. INAA Measurements and Quality Control
5. Results and Discussion
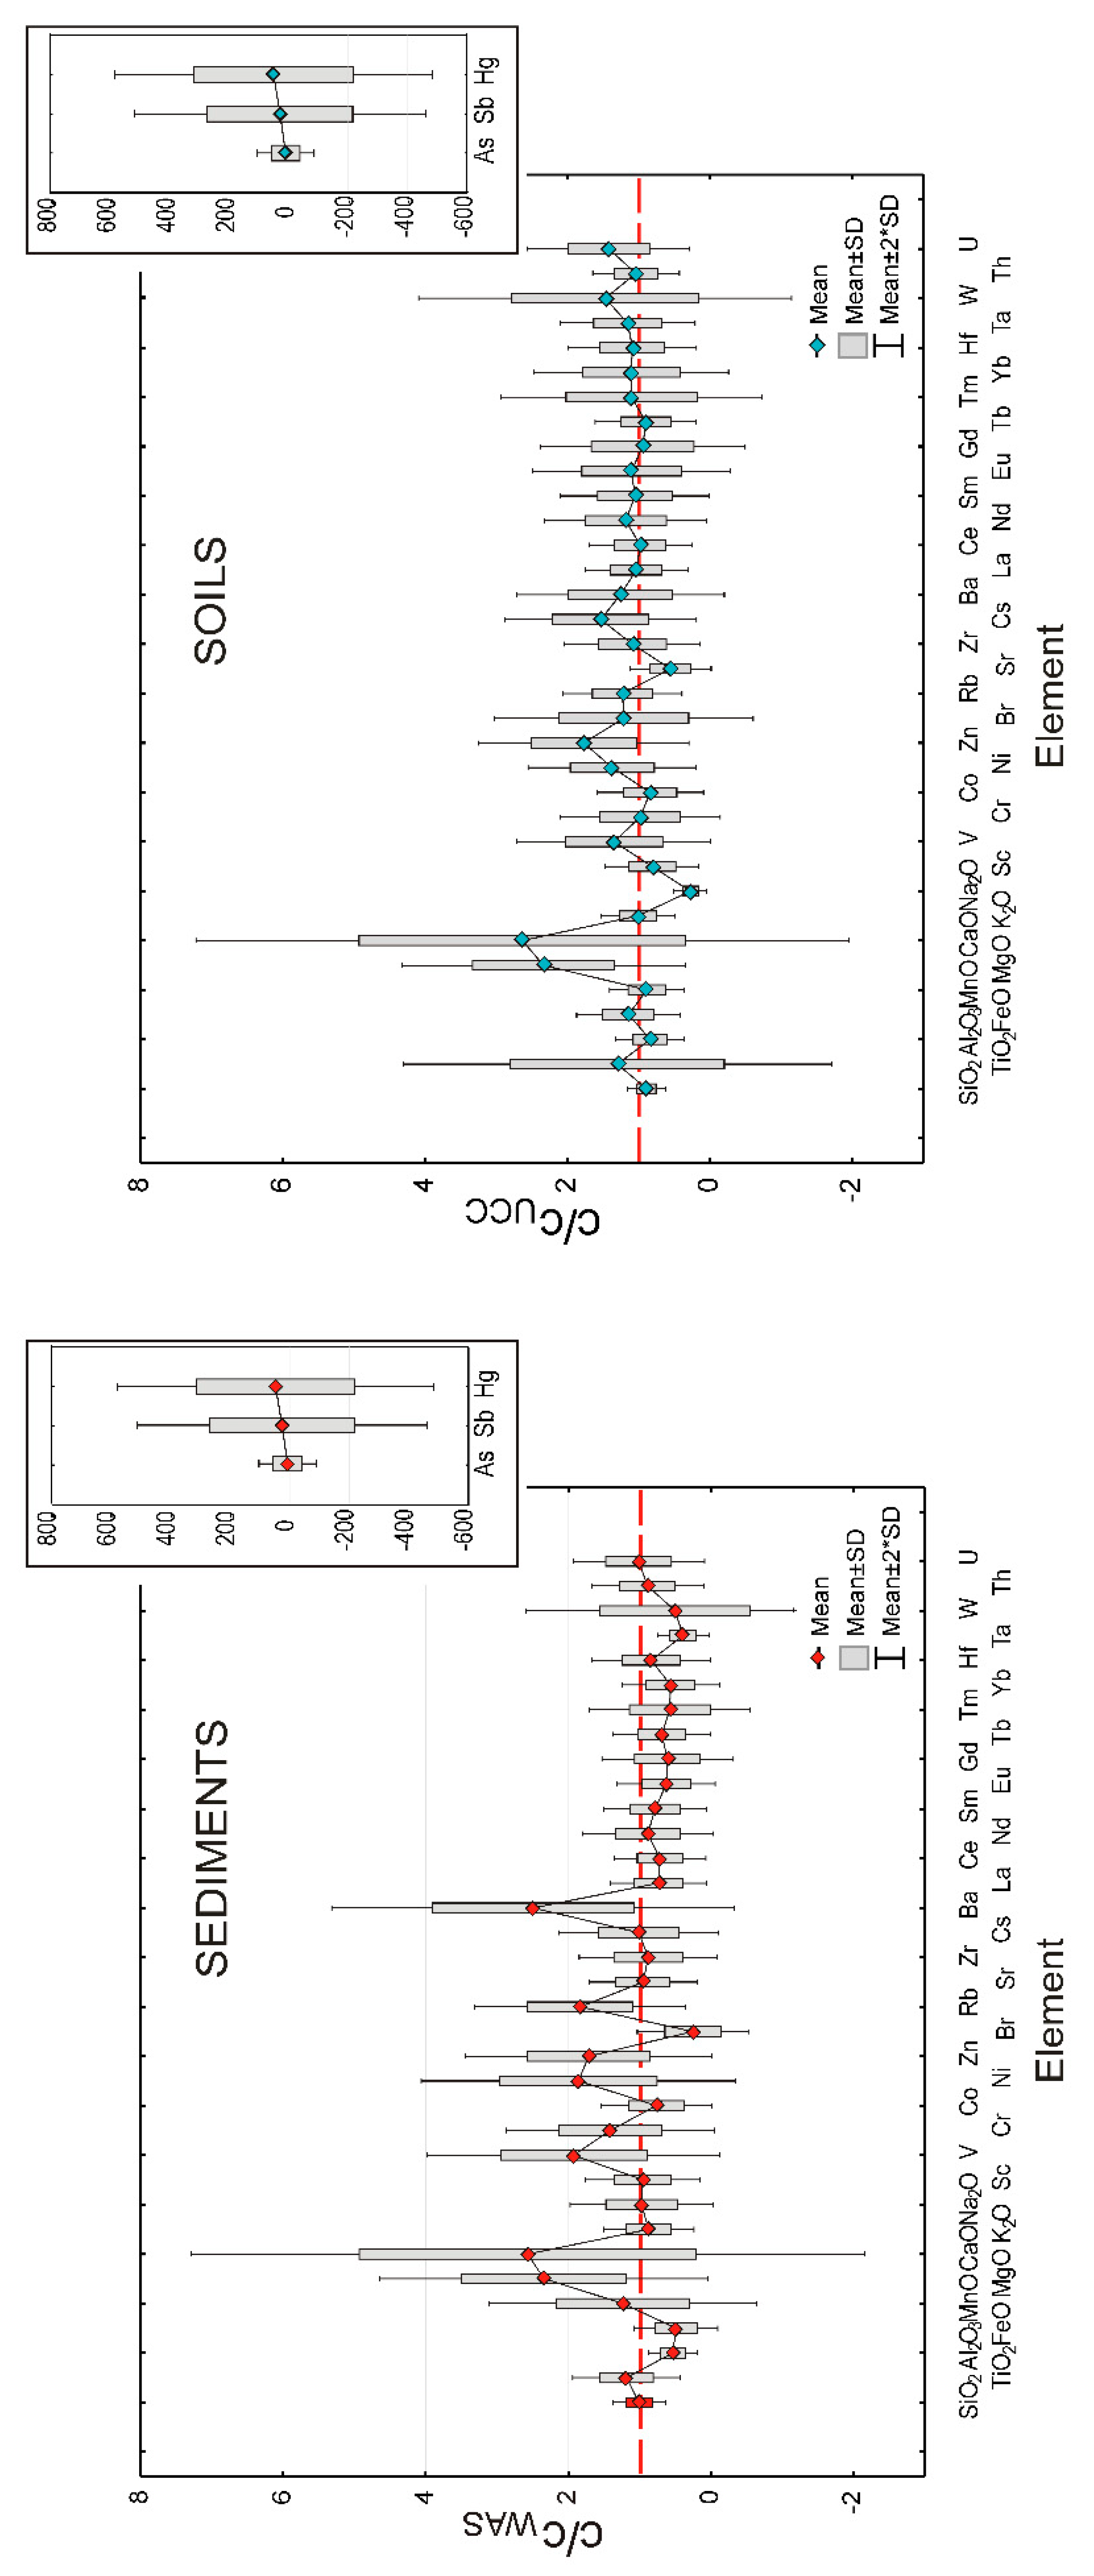
5.1. Major Elements
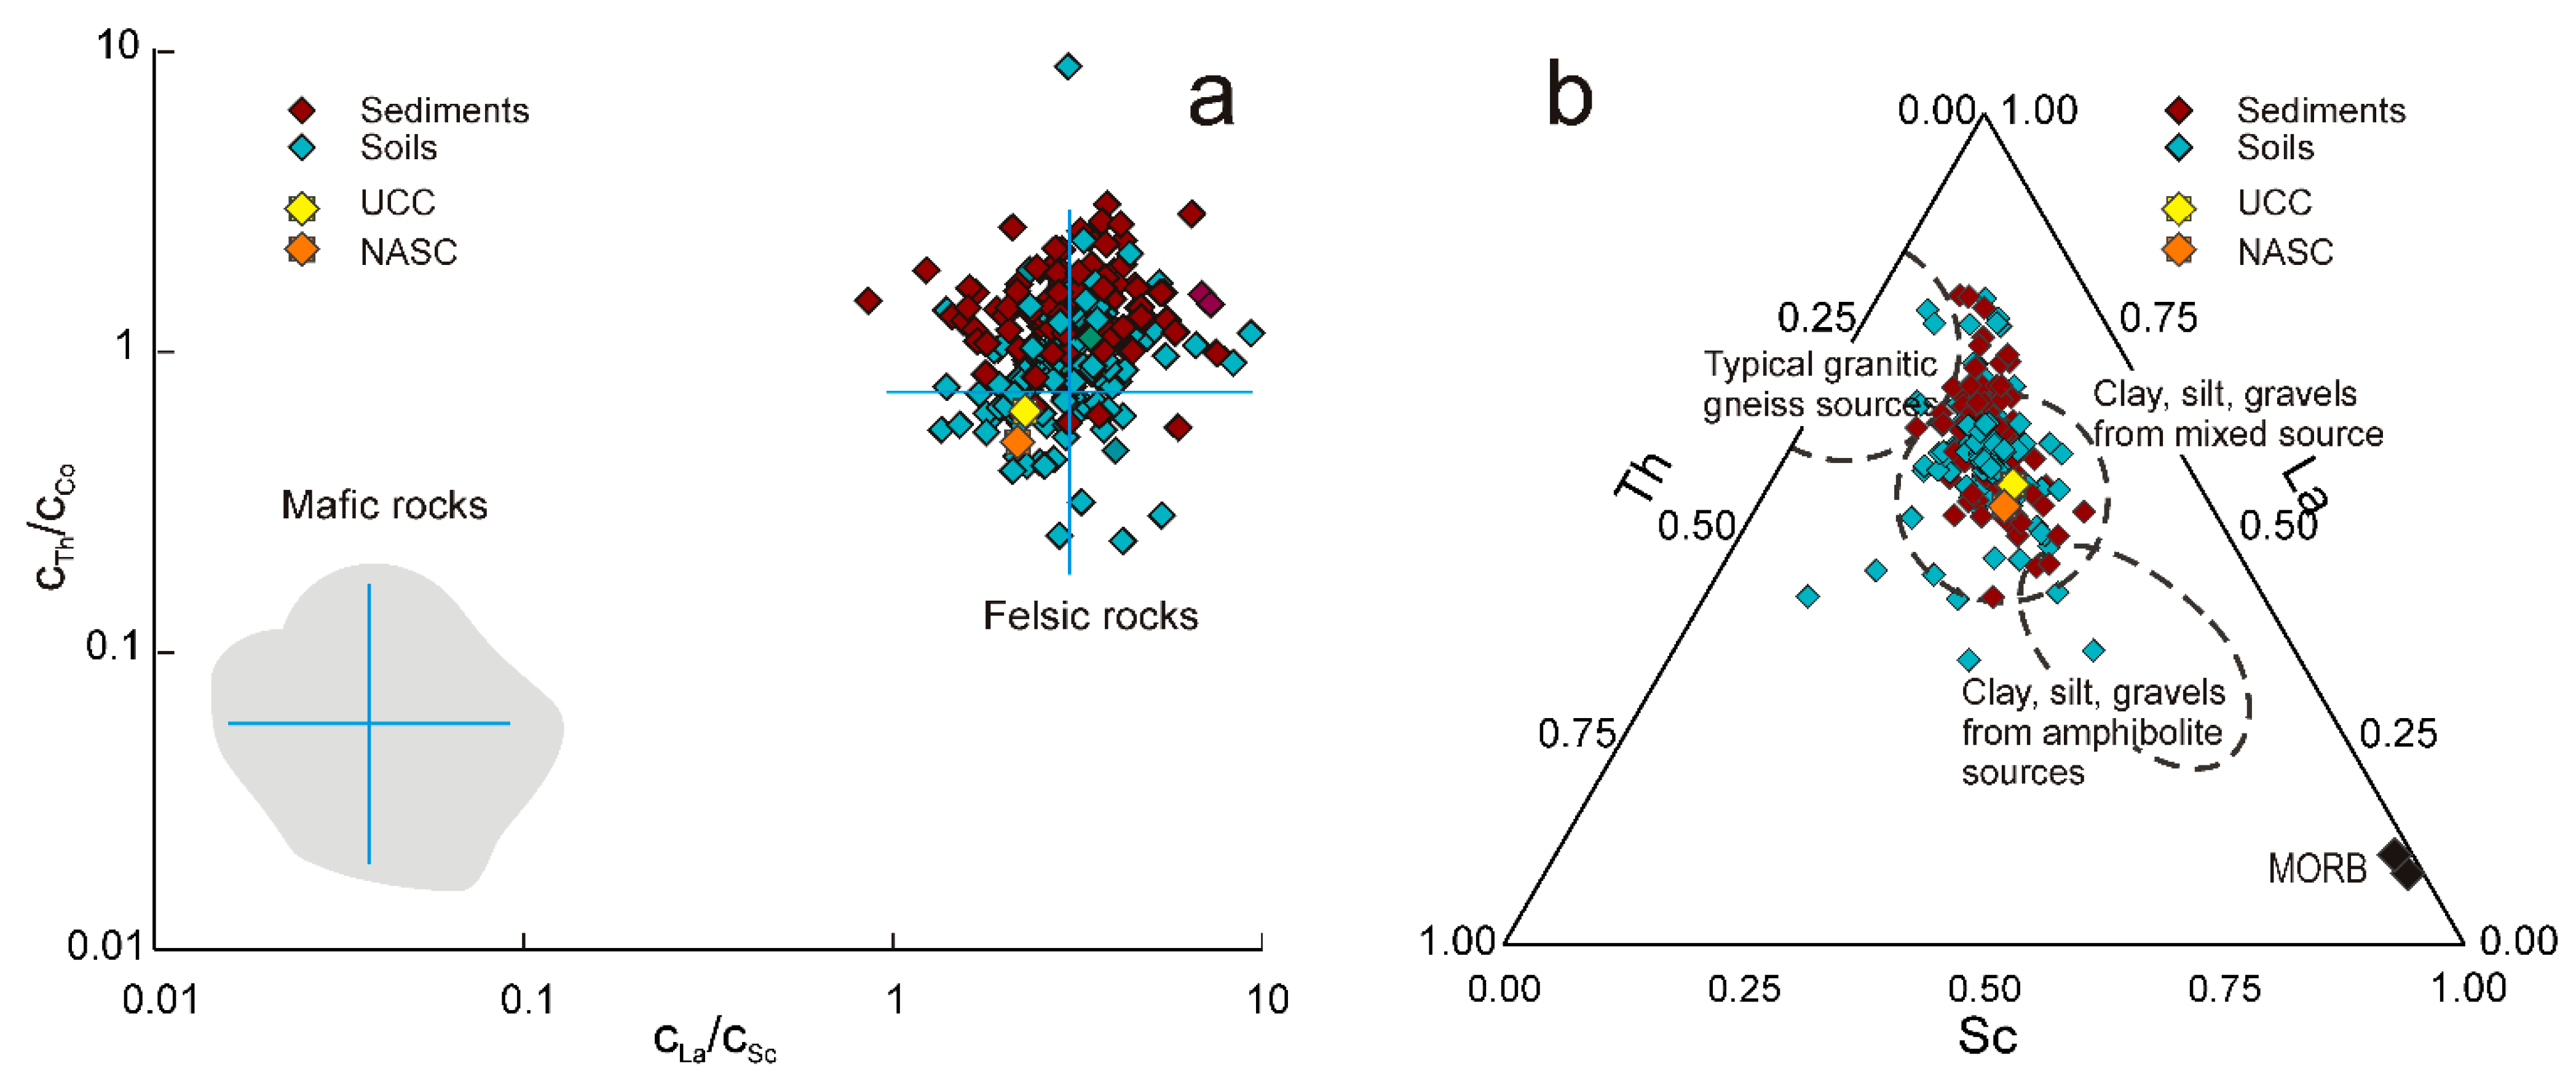
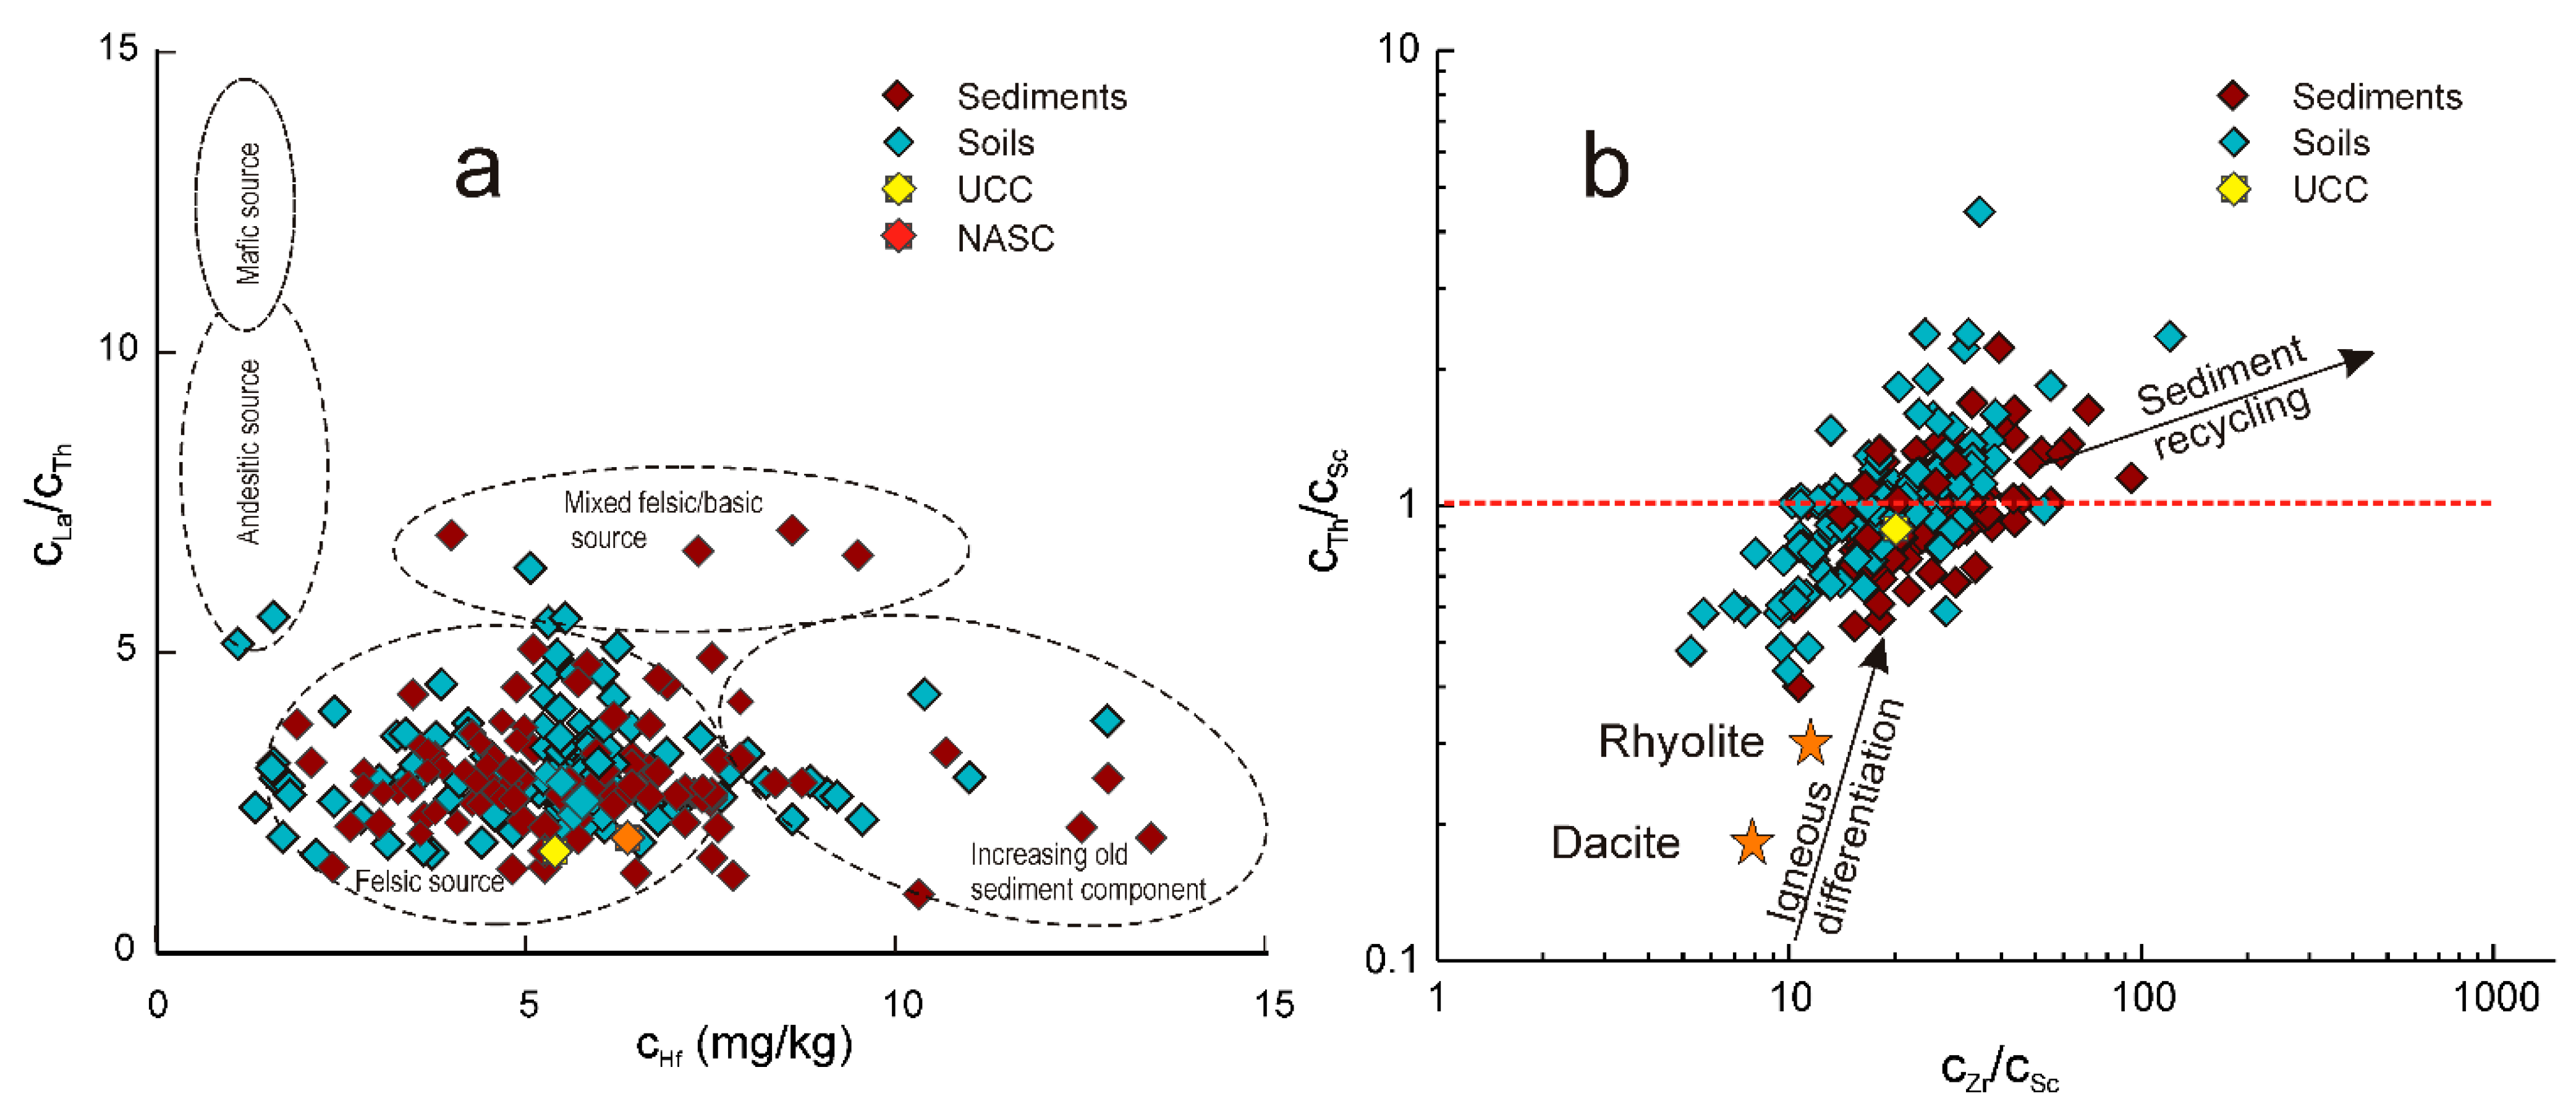
5.2. Trace Elements
6. Conclusions
Author Contributions
Funding
Institutional Review Board Statement
Informed Consent Statement
Data Availability Statement
Acknowledgments
Conflicts of Interest
Appendix A

| Sampling Point | Longitude | Latitude | Altitude (m) | Soil |
|---|---|---|---|---|
| Djidjikrut 1 | 39.109142 | 68.688389 | 2726 | Regosol |
| Anzob tunnel adits | 39.108853 | 68.687314 | 2703 | Regosol |
| Djidjikrut 2 | 39.126583 | 68.682944 | 2574 | Regosol |
| Djidjikrut 3 | 39.137944 | 68.663639 | 2444 | Regosol |
| Djidjikrut 4 | 39.146806 | 68.651778 | 2398 | Regosol |
| Djidjikrut 5 | 39.164528 | 68.641861 | 2318 | Regosol |
| Djidjikrut 6 (Anzob ore-mining combine) | 39.176333 | 68.627417 | 2252 | Regosol |
| Djidjikrut 7 (Anzob ore-mining combine) | 39.199528 | 68.633278 | 1742 | Regosol |
| Yagnob 1 | 39.217333 | 69.021111 | 2351 | Regosol |
| Yagnob 2 | 39.216806 | 68.919333 | 2215 | Regosol |
| Yagnob 3 | 39.172756 | 68.874414 | 2151 | Regosol |
| Yagnob 4 (before Anzob confluence} | 39.162083 | 68.845222 | 2090 | Regosol |
| Estuary of Anzob river to the Yagnob | 39.150304 | 68.850006 | 2144 | Regosol |
| Yagnob 5 (after Anzob confluence) | 39.189667 | 68.758722 | 2070 | Regosol |
| Yagnob 6 | 39.192972 | 68.693472 | 1888 | Regosol |
| Yagnob 7 | 39.199972 | 68.640139 | 1739 | Regosol |
| Yagnob 8 | 39.194278 | 68.598278 | 1706 | Regosol |
| Yagnob 9 | 39.187472 | 68.543444 | 1657 | Regosol |
| Saritag 1 | 39.028528 | 68.271278 | 2477 | Regosol |
| Saritag 2 | 39.056417 | 68.346444 | 2194 | Regosol |
| Konchoch | 39.042167 | 68.332750 | 2361 | Luvisol |
| Kanchoch mine adit | 39.039528 | 68.337889 | 2457 | Luvisol |
| Iskandardarya 1 | 39.101361 | 68.403583 | 2015 | Regosol |
| Iskandardarya 2 | 39.134028 | 68.453528 | 1820 | Regosol |
| Iskandardarya 3 (estuary of river) | 39.186556 | 68.534944 | 1658 | Regosol |
| Fondarya 1 | 39.196389 | 68.536028 | 1644 | Regosol |
| Alovdin Lake 1 | 39.237642 | 68.254278 | 2780 | Regosol |
| Alovdin Lake 2 | 39.237472 | 68.261083 | 2780 | Regosol |
| Sarvoda 1 | 39.250194 | 68.268889 | 2620 | Regosol |
| Sarvoda 2 | 39.262944 | 68.310917 | 2488 | Cambisol |
| Sarvoda 3 | 39.246278 | 68.355750 | 2358 | Cambisol |
| Sarvoda 4 | 39.252111 | 68.405083 | 2166 | Gleysol |
| Sarvoda 5 | 39.226611 | 68.441028 | 1958 | Gleisol |
| Sarvoda 6 | 39.223194 | 68.484611 | 1808 | Gleisol |
| Sarvoda 7—estuary of river | 39.219889 | 68.527639 | 1660 | Regosol |
| Fondarya 2 | 39.225167 | 68.530250 | 1626 | Regosol |
| Pete 1 (right tributary to Fondarya) | 39.248639 | 68.561778 | 1895 | Gleisol |
| Pete 2 (right tributary to Fondarya) | 39.249361 | 68.549889 | 1710 | Gleisol |
| Fondarya 3 | 39.258806 | 68.544000 | 1589 | Regosol |
| Kumargi Bolo 1 | 39.276861 | 68.573056 | 2029 | Regosol |
| Kumargi Bolo 2 | 39.275444 | 68.547583 | 1690 | Regosol |
| Chore 1—upper of river | 39.313639 | 68.479694 | 2148 | Regosol |
| Chore 2—adit | 39.308944 | 68.506194 | 1863 | Regosol |
| Chore 3—adit | 39.308639 | 68.514056 | 1753 | Regosol |
| Chore 4—adit | 39.308222 | 68.528694 | 1577 | Regosol |
| Chore 5—estuary of river | 39.306083 | 68.532917 | 1580 | Regosol |
| Fondarya 4 | 39.305528 | 68.533861 | 1580 | Cambisol |
| Fondarya 5 | 39.344750 | 68.554333 | 1466 | Cambisol |
| Kumargi poyon 1 | 39.325944 | 68.628389 | 3629 | Gleysol |
| Kumargi poyon 2 | 39.363167 | 68.602694 | 1782 | Gleysol |
| Kumargi poyon 3 | 39.363967 | 68.561083 | 1434 | Gleysol |
| Fondarya 6 | 39.380528 | 68.549556 | 1389 | Cambisol |
| Zarafshon 1 | 39.452667 | 70.426100 | 2732 | Regosol |
| Zarafshon 2 (Dihisor) | 39.426194 | 70.307583 | 2612 | Regosol |
| Zarafshon 3 (Dihisor) | 39.444472 | 70.189750 | 2517 | Regosol |
| Zarafshon 4 (Paldorak) | 39.457583 | 70.076194 | 2423 | Regosol |
| Zarafshon 5 (Paldorak) | 39.426417 | 69.963444 | 2330 | Regosol |
| Zarafshon 6 (Sabak) | 39.447639 | 69.841194 | 2272 | Regosol |
| Zarafshon 7 (Madrushkat) | 39.453167 | 69.723861 | 2267 | Regosol |
| Rovut– tributary to Zarafshon | 39.449194 | 69.676306 | 2242 | Regosol |
| Zarafshon 8 (Madrushkat) | 39.440358 | 69.601324 | 2158 | Regosol |
| Madrushkat– tributary to Zarafshon | 39.446944 | 69.563472 | 2123 | Regosol |
| Tributary 2—to Zarafshon (Isizi poyon) | 39.439889 | 69.542361 | 2075 | Regosol |
| Zarafshon 9 Isizi poyon) | 39.431222 | 69.483639 | 1999 | Regosol |
| Tributary 3—to Zarafshon (Isizi poyon) | 39.415750 | 69.418694 | 1985 | Regosol |
| Zarafshon 10 (Isizi poyon) | 39.413306 | 69.376833 | 1927 | Regosol |
| Zarafshon 11 (Pastigov) | 39.413833 | 69.269194 | 1919 | Regosol |
| Kallakhona–tributary to Zarafshon | 39.418194 | 69.264861 | 1913 | Regosol |
| Oburdon (Pastigov) | 39.425611 | 69.167250 | 1875 | Regosol |
| Zarafshon 12 (Pastigov) | 39.417056 | 69.156833 | 1820 | Regosol |
| Zarafshon 13 (Shamtuch) | 39.401222 | 69.060500 | 1742 | Regosol |
| Zarafshon 14 (Veshab) | 39.402833 | 68.954028 | 1660 | Regosol |
| Zarafshon 15 (Shavadki poyon) | 39.391472 | 68.853306 | 1619 | Regosol |
| Zarafshon 16 (Rarz) | 39.380639 | 68.773361 | 1508 | Regosol |
| Zarafshon 17 (Fatmev) | 39.385861 | 68.673861 | 1462 | Regosol |
| Zarafshon 18 (Sangiston) | 39.387250 | 68.570250 | 1405 | Regosol |
| Shahriston 1, tributary right site of tunnel | 39.520806 | 68.553389 | 2728 | Regosol |
| Shahriston 2, tributary left site of tunnel | 39.519972 | 68.554889 | 2744 | Regosol |
| Shahriston 3–estuary | 39.440583 | 68.541389 | 1682 | Luvisol |
| Zarafshon 19 | 39.419455 | 68.509311 | 1366 | Regosol |
| Zarafshon 20 | 39.439194 | 68.441583 | 1306 | Regosol |
| Zarafshon 21 | 39.439194 | 68.441583 | 1284 | Regosol |
| Zarafshon 22 | 39.440806 | 68.273250 | 1226 | Regosol |
| Zarafshon 23 | 39.443472 | 68.087750 | 1206 | Regosol |
| Artuch 1 (Alpine camp) | 39.274889 | 68.139167 | 2142 | Luvisol |
| Artuch 2 | 39.335278 | 68.087750 | 1573 | Luvisol |
| Artuch 3 | 39.397806 | 68.043250 | 1267 | Regosol |
| Zarafshon 24 | 39.471667 | 67.991833 | 1113 | Gleysol |
| Zarafshon 25 | 39.466472 | 67.887139 | 1072 | Gleysol |
| Obi Sara 1 | 39.379278 | 67.880028 | 1775 | Regosol |
| Obi Sara 2 | 39.415889 | 67.865639 | 1315 | Regosol |
| Obi Sara 3 | 39.468389 | 67.872833 | 1079 | Regosol |
| Zarafshon 26 | 39.497306 | 67.785056 | 1035 | Gleysol |
| Lake 1 (Khazorchashma) | 39.113250 | 67.855250 | 2393 | Regosol |
| Lake 2 (Marguzor) | 39.140972 | 67.859528 | 2106 | Regosol |
| Lake 3 | 39.166083 | 67.838972 | 1888 | Regosol |
| Lake 4 | 39.197278 | 67.819333 | 1811 | Regosol |
| Lake 5 | 39.203564 | 67.810650 | 1718 | Regosol |
| Lake 6 | 39.210056 | 67.805028 | 1701 | Regosol |
| Lake 7 | 39.220306 | 67.800806 | 1610 | Regosol |
| Shing 1 | 39.240806 | 67.798028 | 1565 | Regosol |
| Shing 2 | 39.273667 | 67.802778 | 1382 | Regosol |
| Shing 3 industrial zone | 39.306917 | 67.783778 | 1282 | Regosol |
| Mogiyon 1 | 39.112611 | 67.733639 | 2383 | Gleysol |
| Mogiyon 2 | 39.147750 | 67.737000 | 2144 | Gleysol |
| Mogiyon 3 | 39.215194 | 67.711944 | 1722 | Gleysol |
| Mogiyon 4 | 39.273722 | 67.688639 | 1474 | Gleysol |
| Mogiyon 5 | 39.315583 | 67.770167 | 1250 | Luviysol |
| Mogiyon 6 after junction with Shing river | 39.339583 | 67.770306 | 1222 | Regosol |
| Mogiyon 7 | 39.378778 | 67.759472 | 1180 | Regosol |
| Mogiyon 8 | 39.419444 | 67.766083 | 1099 | Regosol |
| Mogiyon 9 | 39.456556 | 67.735889 | 1041 | Regosol |
| Mogiyon 10 | 39.495083 | 67.711861 | 994 | Regosol |
| Zarafshon 27 | 39.502889 | 67.678861 | 981 | Regosol |
| Zarafshon 28 | 39.496728 | 67.552247 | 934 | Gleysol |
| Zarafshon 29 | 39.529500 | 67.433860 | 883 | Gleysol |
| Element | Certified (w%) | Measured (w%) | Element | Certified (mg/kg) | Measured (mg/kg) |
|---|---|---|---|---|---|
| Al | 7.37 | 7.11 ± 0.16 | Sb | 1.55 | 1.6 ± 0.06 |
| Ca | 1.91 | 1.99 ± 0.09 | Ba | 979 | 951 ± 29 |
| Fe | 3.36 | 3.45 ± 0.07 | Cr | 130 | 121 ± 9.2 |
| Mg | 1.46 | 1.38 ± 0.03 | Co | 12.8 | 13.6 ± 0.3 |
| K | 2.11 | 2.15 ± 0.06 | Mn | 529 | 546 ± 19 |
| Si | 30.3 | 30.95 ± 0.41 | Sr | 239 | 230 ± 8 |
| Na | 1.22 | 1.26 ± 0.03 | V | 110 | 121 ± 11 |
| Ti | 0.34 | 0.3 ± 0.01 | Zr | 195 | 201 ± 50 |
| Sediments | ||||||||
| SiO2 | TiO2 | Al2O3 | FeO | MnO2 | MgO | CaO | K2O | |
| TiO2 | −0.251 | |||||||
| Al2O3 | −0.302 | 0.840 | ||||||
| FeO | −0.340 | 0.758 | 0.819 | |||||
| MnO2 | −0.018 | 0.621 | 0.639 | 0.510 | ||||
| MgO | −0.804 | 0.381 | 0.357 | 0.382 | 0.013 | |||
| CaO | −0.752 | −0.195 | −0.184 | −0.153 | −0.191 | 0.577 | ||
| K2O | −0.155 | 0.612 | 0.627 | 0.728 | 0.392 | 0.268 | −0.260 | |
| Na2O | 0.204 | 0.419 | 0.410 | 0.276 | 0.313 | −0.066 | −0.435 | 0.262 |
| Soils | ||||||||
| SiO2 | TiO2 | Al2O3 | FeO | MnO2 | MgO | CaO | K2O | |
| TiO2 | −0.081 | |||||||
| Al2O3 | −0.119 | 0.645 | ||||||
| FeO | −0.291 | 0.445 | 0.348 | |||||
| MnO2 | −0.009 | 0.442 | 0.456 | 0.300 | ||||
| MgO | −0.671 | 0.062 | −0.035 | 0.153 | 0.022 | |||
| CaO | −0.668 | −0.436 | −0.527 | −0.123 | −0.356 | 0.463 | ||
| K2O | −0.213 | 0.543 | 0.626 | 0.459 | 0.255 | 0.108 | −0.276 | |
| Na2O | −0.081 | 0.536 | 0.403 | 0.422 | 0.378 | −0.011 | −0.268 | 0.431 |
References
- Prokhorov, A.M. Zarafshon (river in Central Asia). In Great Soviet Encyclopedia, 3rd ed.; Sovetskaya Encyclopaedia: Moscow, Russia, 1968–1978; Volume 30. (In Russian) [Google Scholar]
- Panjakent. Map of Panjakert. 1989. Available online: https://mapj42.narod.ru/map1/index016.html (accessed on 1 September 2021).
- Urgut. Map of Urgut. 1989. Available online: https://mapj42.narod.ru/map1/index015.html (accessed on 1 September 2021).
- Sadikov, A.S.; Mamarasulov, S.M.; Poslavskiy, V.V. Irrigation in Uzbekistan: Current State and Prospects of Irrigation Development in the Amu Darya River Basin; Fan: Tashkent, Uzbekistan, 1979; pp. 57–63. (In Russian) [Google Scholar]
- Geoportal. Mineral resources of the Republic of Tajikistan, Central Asia Geoportal. Available online: https://www.geoportal-tj.org/index.php/geology/deposits (accessed on 1 September 2021).
- Abdusamadzoda, D.; Abdushukurov, D.A.; Duliu, O.G.; Zinicovscaia, I. Assessment of the toxic metals pollution of soil and sediment in Zarafshon Valley, Northwest Tajikistan (Part II). Toxics 2020, 8, 113. [Google Scholar] [CrossRef]
- Bhatia, M.R.; Crook, K.A.W. Trace element characteristics of greywackes and tectonic setting discrimination of sedimentary basins. Contrib. Mineral. Petrol. 1986, 92, 181–193. [Google Scholar]
- Taylor, S.R.; McLennan, S.M. The Continental Crust: Its Composition and Evolution: An Examination of the Geochemical Record Preserved in Sedimentary Rocks; Blackwell Scientific Publications: Hoboken, NJ, USA, 1991; p. 312. ISBN 978-0632011483. [Google Scholar]
- McLennan, S.M.; Hemming, S.; McDaniel, D.K.; Hanson, G.N. Geochemical approaches to sedimentation, provenance and tectonics. In Processes Controlling the Composition of Clastic Sediments; Johnsson, M.J., Basu, A., Eds.; Geological Society of America: Washington, DC, USA, 1993; Volume 284, p. 285. [Google Scholar] [CrossRef] [Green Version]
- Armstrong-Altrin, J.S. Provenance of sands from Cazones, Acapulco, and Bahia Kino beaches, Mexico. Rev. Mex. Cienc. Geol. 2009, 26, 764–782. Available online: http://satori.geociencias.unam.mx/index.php/rmcg/article/view/346 (accessed on 30 July 2021).
- Bussan, D.; Harris, A.; Douvris, C. Monitoring of selected trace elements in sediments of heavily industrialized areas in Calcasieu Parish, Louisiana, United States by inductively coupled plasma-optical emission spectroscopy (ICP-OES). Microchem. J. 2019, 144, 51–55. [Google Scholar] [CrossRef]
- Belozertseva, I.A.; Milić, M.; Tošić, S.; Saljnikov, E. Environmental Pollution in the Vicinity of an Aluminium Smelter in Siberia. In Advances in Understanding Soil Degradation. Innovations in Landscape Research; Saljnikov, E., Mueller, L., Lavrishchev, A., Eulenstein, F., Eds.; Springer: Cham, Switzerland, 2022; pp. 379–402. [Google Scholar] [CrossRef]
- Badawy, W.M.; Sarhan, Y.; Duliu, O.G.; Kim, J.; El Samman, H.; Hussein, A.A.; Frontasyeva, M.; Shcheglov, A. Monitoring of air pollutants using plants and co-located soil—Egypt: Characteristics, pollution, and toxicity impact. Environ. Sci. Pollut. Res. 2021, 29, 21049–21066. [Google Scholar] [CrossRef] [PubMed]
- Ponge, J.-F. The soil as an ecosystem. Biol. Fertil. Soils 2015, 51, 645–648. [Google Scholar] [CrossRef]
- Zeisler, R.; Vajda, N.; Kennedy, G.; Lamaze, G.; Molnar, G.L. Activation analysis. In Handbook of Nuclear Chemistry, 2nd ed.; Vértes, A., Nagy, S., Klencsár, Z., Eds.; Springer: Berlin/Heidelberg, Germany, 2011; pp. 1555–1620. [Google Scholar] [CrossRef]
- Frontasyeva, M.V. Neutron activation analysis in the life sciences. Phys. Part. Nucl. 2011, 42, 332–378. [Google Scholar] [CrossRef]
- Rudnick, R.L.; Gao, S. Composition of the continental crust. In Treatise on Geochemistry; Holland, H.D., Turekian, K.K., Eds.; Elsevier-Pergamon: Amsterdam, The Netherlands, 2004; Volume 3, pp. 1–64. ISBN 978-0-08-098300-4. [Google Scholar]
- Gromet, L.P.; Haskin, L.Y.; Korotev, R.L.; Dymek, R.F. The North American shale composite: Its compilation, major and trace element characteristics. Geochim. Cosmochim. Acta 1984, 48, 2469–2482. [Google Scholar] [CrossRef]
- Savenko, V.S. Chemical composition of sediments load carried by rivers. Geochem. Int. 2007, 45, 816–824. [Google Scholar]
- Viers, J.; Dupre, B.; Gaillardet, G. Chemical composition of suspended sediments in World Rivers: New insights from a new database. Sci. Total Environ. 2009, 407, 853–868. [Google Scholar] [CrossRef]
- Farrance, I.; Frenkel, R. Uncertainty of Measurement: A Review of the Rules for Calculating Uncertainty Components through Functional Relationships. Clin. Biochem Rev. 2012, 33, 49–75. [Google Scholar] [PubMed]
- Leonov, M.G.; Rybin, A.K.; Batalev, V.Y.; Matyukov, V.E.; Shchelochkov, G.G. Tectonic Structure and Evolution of the Hissar–Alay Mountain Domain and the Pamirs. Geotectonics 2017, 51, 566–583. [Google Scholar] [CrossRef]
- Vinogradov, P.D. Information collection of All-Union Scientific Research Geological Institute. USSR 1961, 46, 192–207. (In Russian) [Google Scholar]
- Mamadvafoev, M.M.; Bakhtdavlatov, R.D.; Mirzoev, B.; Bakhronov, N. Farob ore field (Central Tajikistan): Geology and assessment of perspectives of industrial gold mineralisation. Proc. Acad. Sci. Rep. Tajikistan 2015, 58, 845–852. Available online: https://cyberleninka.ru/article/n/farobskoe-rudnoe-pole-tsentralnyy-tadzhikistan-geologiya-i-otsenka-perspektiv-promyshlennoy-zolotonosnosti (accessed on 30 July 2021). (In Russian).
- Vendrov, S.L.; Kalinin, G.P. Surface-water resources of the USSR: Their utilization and study. Sov. Geogr. 1960, 1, 35–49. [Google Scholar] [CrossRef]
- Sharygin, V.V.; Sokol, E.V.; Belakovskii, D.I. Fayalite-sekaninaite paralava from the Ravat coal fire (Central Tajikistan). Geol. Geophys. 2009, 50, 703–721. (In Russian) [Google Scholar] [CrossRef]
- Novikov, V.P.; Suprychev, V.V. The conditions of modern mineral formation in the process of underground combustion of coal at the Fan-Yagnob deposit. Mineral. Tajikistan 1986, 7, 91–104. [Google Scholar]
- Belakovski, D. Die Mineralien der brennenden Kohlefloeze von Ravat in Tadshikistan. Lapis 1990, 15, 21–26. (In German) [Google Scholar]
- Mirakov, M.A.; Fayziev, A.R.; Pautov, L.A. Native selenium in the products of underground fire of Fan-Yagnnob coal deposit (Central Tajikistan). Proc. Acad. Sci. Rep. Tajikistan 2017, 60, 456–460. Available online: https://cyberleninka.ru/article/n/samorodnyy-selen-v-produktah-podzemnogo-pozhara-fan-yagnobskogo-ugolnogo-mestorozhdeniya-tsentralnyy-tadzhikistan (accessed on 30 July 2021). (In Russian).
- Nasdala, L.; Pekov, I.V. Ravatite, C14H10, a new organic mineral species from Ravat, Tadzhikistan. Eur. J. Miner. 1993, 5, 699–705. [Google Scholar] [CrossRef]
- Madjidov, B.S. Organizational and Economic Substantiation of the Development of the Gold Mining Industry in the Region during the Formation of the Precious Metals Market: The Example of the Republic of Tajikistan. Ph.D. Thesis, Sergo Ordjonikidze Russian State University for Geological Prospecting, Moscow, Russia, 1985; p. 198. Available online: https://www.dslib.net/economika-xoziajstva/organizacionno-jekonomicheskoe-obosnovanie-razvitija-zolotodobyvajuwej-otrasli.html (accessed on 30 July 2021). (In Russian).
- Novojhilov, Y.I.; Gavrilov, A.M. Gold-Sulphide Deposits in Carbon-Terrigenous Layers; Publish house of Central Scientific Research Geological Prospecting Institute of Nonferrous and Precious Metals: Moscow, Russia, 1999; p. 174. (In Russian) [Google Scholar]
- Fayziev, F.A.; Fayziev, A.R.; Kayumarsi, M. On the silver mineralization of Central Tajikistan. Bull. Ural. State Min. Univ. 2017, 4, 18–22. (In Russian) [Google Scholar] [CrossRef] [Green Version]
- Blokhina, N.A. Mineralogy, Geochemistry and Formation Conditions of Gold Sulfide Deposits in the Formation of Magnesian Skarns (Central Tajikistan); Danish Press: Dushanbe, Tajikistan, 1984; p. 277. (In Russian) [Google Scholar]
- Solikhov, M.M.; Aksenov, A.V.; Vasiliev, A.A.; Karimov, M.A.; Rahmanov, O.B. Search for optimal processing technology for Taror deposit refractory gold ores (Republic of Tajikistan). Proc. Irkutsk. State Tech. Univ. 2018, 22, 182–192. (In Russian) [Google Scholar] [CrossRef]
- Abdusamadzoda, D.; Abdushukurov, D.A.; Duliu, O.G.; Zinicovscaia, I.; Nekhoroshkov, P.S. Major and Trace Elements in Sediments and Soils of the Zerafshon Area, North-West Tajikistan. Available online: https://data.mendeley.com/drafts/vj24br7gnt (accessed on 30 July 2021).
- Pavlov, S.S.; Dmitriev, A.Y.; Frontasyeva, M.V. Automation system for neutron activation analysis at the reactor IBR-2, Frank Laboratory of Neutron Physics, Joint Institute for Nuclear Research, Dubna, Russia. J. Radioanal. Nucl. Chem. 2016, 309, 27–38. [Google Scholar] [CrossRef] [Green Version]
- Zinicovscaia, I.; Duliu, O.G.; Culicov, O.A.; Frontasyeva, M.V.; Rodica, S. Major and trace elements distribution in Moldavian soils. Rom. Rep. Phys. 2018, 70, 701. [Google Scholar]
- Strakhov, N.M. Principles of Lithogenesis, 3rd ed.; Tomkeieff, S.I., Hemingway, J.E., Eds.; Springer: Boston, MA, USA, 1995; p. 245. [Google Scholar] [CrossRef]
- Wang, W.; Chen, F.; Hu, R.; Chu, Y.; Yang, Y.Z. Provenance and tectonic setting of Neoproterozoic sedimentary sequences in the South China Block: Evidence from detrital zircon ages and Hf-eNd isotopes. Int. J. Earth Sci. 2012, 101, 1723–1744. [Google Scholar] [CrossRef]
- Marshak, S. Essentials of Geology, 6th ed.; W.W. Norton & Company: New York, NY, USA, 2019; ISBN 978-0393667523. [Google Scholar]
- Norman, J.C.; Haskin, L.A. The geochemistry of Sc: A comparison to the rare earths and Fe. Geochim. Cosmochim. Acta 1968, 32, 93–108. [Google Scholar] [CrossRef]
- Armstrong, A.J.S.; Nagarajan, R.; Madhavaraju, J.; Nagarajan, R.; Madhavaraju, J.; Rosalez, H.L.; Lee, Y.I.; Balaram, V.; Cruz, M.A.; Avila, G.R. Geochemistry of the Jurassic and Upper Cretaceous shales from the Molango Region, Hidalgo, eastern Mexico: Implications for source-area weathering, provenance, and tectonic setting. Comp. Ren. Geosci. 2013, 45, 185–202. [Google Scholar] [CrossRef] [Green Version]
- Cullers, R.L. Implications of elemental concentrations for provenance, redox conditions, and metamorphic studies of shales and limestones near Pueblo, CO, USA. Chem. Geol. 2002, 191, 305–327. [Google Scholar] [CrossRef]
- Floyd, P.A.; Leveridge, B.E. Tectonic environment of the Devonian Gramscatho basin, south Cornwall: Frame-work mode and geochemical evidence from turbiditic sandstones. J. Geol. Soc. 1987, 144, 531. [Google Scholar] [CrossRef]
- Lee, Y.I. Geochemistry of shales of the Upper Cretaceous Hayang Group, SE Korea: Implications for provenance and source weathering at an active continental margin. Sedim. Geol. 2009, 215, 1–12. [Google Scholar] [CrossRef]
- Nagarajan, R.; Armstrong-Altrin, J.S.; Kessler, F.L.; Hidalgo-Moral, E.L.; Dodge-Wan, D.; Nur, I.T. Provenance and tectonic setting of Miocene siliciclastic sediments, Sibuti Formation, northwestern Borneo. Arab. J. Geosci. 2015, 8, 8549–8565. [Google Scholar] [CrossRef]
- McLennan, S.M.; Hemming, S.; McDaniel, D.K.; Hanson, G.N. Geochemical Approaches to Sedimentation, Provenance, and Tectonics; Special paper; Geological Society of America: Boulder, CO, USA, 1993; Volume 284, p. 20. [Google Scholar]
- McLennan, S.M. Rare Earth Elements in sedimentary rocks: Influence of provenance and sedimentary processes. In Geochemistry and Mineralogy of Rare Earth Elements; Lipin, B.R., McKay, G.A., Eds.; Mineralogical Society of America, de Gruyter: Berlin, Germany, 2018; Volume 21, pp. 169–200. [Google Scholar] [CrossRef]
- McLennan, S.M. Lanthanide Rare Earths. In Encyclopedia of Geochemistry. Encyclopedia of Earth Sciences Series; White, W., Ed.; Springer: Cham, Switzerland, 2018. [Google Scholar] [CrossRef]
- Allison, G.; Dalton, C.A.; Langmuir, C.H.; Su, Y. The mean composition of ocean ridge basalts. Geoch. Geoph. Geosys. 2013, 14, 489–518. [Google Scholar] [CrossRef] [Green Version]
- Arevako, R.; McDonough, W.F. Chemical variations and regional diversity observed in MORB. Chem. Geol. 2010, 271, 70–85. [Google Scholar] [CrossRef]
- McDonough, W.F.; Sun, S.-s. The composition of the Earth. Chem. Geol. 1995, 120, 223–253. [Google Scholar] [CrossRef]


| Element | Sediment | CSU | Soils | CSU | UCC | NASC | PAAS | SMWR | AWSS |
|---|---|---|---|---|---|---|---|---|---|
| SiO2 | 62.75 | 12.65 | 59.39 | 9.7 | 66.62 | 64.48 | 62.8 | 54.76 | 54.34 |
| TiO2 | 0.62 | 0.22 | 0.83 | 1.06 | 0.64 | 0.72 | 1 | 0.65 | 0.73 |
| Al2O3 | 9.9 | 3.52 | 12.92 | 4.07 | 15.4 | 16.9 | 2.2 | 16.31 | 16.48 |
| FeO | 3.79 | 2.5 | 5.78 | 2.01 | 5.04 | 5.7 | 18.9 | 6.47 | 7.47 |
| MnO2 | 0.07 | 0.07 | 0.09 | 0.03 | 0.1 | 0.06 | 0.11 | 0.15 | 0.22 |
| MgO | 6.32 | 3.42 | 5.8 | 2.72 | 2.48 | 2.85 | --- | 2.39 | 2.09 |
| CaO | 10.59 | 10.71 | 9.46 | 9.06 | 3.59 | 3.56 | 1.3 | 3.64 | 3.62 |
| K2O | 2.4 | 0.99 | 2.83 | 0.79 | 2.8 | 3.99 | 3.7 | 2.59 | 2.04 |
| Na2O | 1.4 | 0.79 | 0.9 | 0.41 | 3.27 | 1.15 | 1.2 | 1.11 | 0.96 |
| Sc | 9.6 | 4 | 11 | 5 | 14 | 15 | 16 | 14 | 18 |
| V | 101 | 56 | 254 | 1500 | 97 | --- | --- | 120 | 129 |
| Cr | 71 | 40 | 90 | 57 | 92 | 124 | 110 | 85 | 130 |
| Co | 11.5 | 6.4 | 14.5 | 7.1 | 17.3 | --- | --- | 19 | 22.5 |
| Ni | 46 | 32 | 65 | 31 | 47 | 58 | 55 | 50 | 74 |
| Zn | 102 | 57 | 119 | 54 | 67 | --- | ---- | 130 | 208 |
| As | 63 | 254 | 84 | 600 | 4.8 | 28.4 | --- | 14 | 36.3 |
| Br | 2.6 | 4.3 | 1.9 | 1.6 | 1.6 | 0.9 | --- | 9 | 21.5 |
| Rb | 92 | 41 | 103 | 39 | 84 | 126 | 160 | 77.0 | 79 |
| Sr | 143 | 63 | 177 | 100 | 320 | 142 | 200 | 150.0 | 187 |
| Zr | 220 | 133 | 210 | 101 | 193 | 200 | 210 | 150.0 | 160 |
| Sb | 59 | 560 | 38 | 270 | 0.4 | --- | --- | 1.4 | 2.2 |
| Cs | 4.5 | 570 | 7.5 | 3.6 | 4.9 | 5.2 | 15 | 5.2 | 6.3 |
| Ba | 724 | 450 | 784 | 500 | 624 | 636 | 650 | 500 | 522 |
| La | 28 | 14 | 32 | 12 | 31 | 31 | 38.2 | 32 | 37 |
| Ce | 53 | 26 | 61 | 25 | 63 | 67 | 79.6 | 68 | 73.6 |
| Nd | 27 | 15 | 32 | 17 | 27 | 27 | 33.9 | 29 | 32.2 |
| Sm | 5 | 2.5 | 6.3 | 3.4 | 4.7 | 5.6 | 5.6 | 5.8 | 6.1 |
| Eu | 0.9 | 0.6 | 1.1 | 0.8 | 1 | 1.2 | 1.1 | 1.4 | 1.3 |
| Gd | 3.9 | 3.3 | 2.9 | 2.4 | 4 | --- | 4.7 | 5.6 | 5.3 |
| Tb | 0.7 | 0.3 | 1 | 0.4 | 0.7 | 0.9 | 0.8 | 0.8 | 0.8 |
| Tm | 0.3 | 0.3 | 0.5 | 0.5 | 0.3 | --- | 0.4 | 0.4 | 0.4 |
| Yb | 1.9 | 1.2 | 2.2 | 1.5 | 2 | 3.1 | 2.8 | 2.5 | 2.1 |
| Hf | 5.5 | 3 | 5.8 | 2.6 | 5.3 | 6.3 | --- | 4.4 | 4 |
| Ta | 0.8 | 0.4 | 1 | 0.5 | 0.9 | 1.12 | 14.6 | 0.9 | 1.3 |
| W | 2.5 | 5.7 | 2.8 | 2.7 | 1.9 | 2.1 | --- | 1.4 | 2 |
| Hg | 2.5 | 14.7 | 1.1 | 4.5 | 0.1 | --- | --- | 0.1 | --- |
| Th | 8.9 | 4.3 | 10.9 | 3.5 | 10.5 | 12.3 | 3.2 | 10 | 12.1 |
| U | 3 | 1.5 | 3.9 | 1.7 | 2.7 | 2.7 | --- | 2.4 | 3.3 |
| ANOVA Two-Sample Test | ||||
|---|---|---|---|---|
| Elements | T-Test Equal Mean | F-Test Equal Variance | Mann–Whitney Equal Median | Anderson–Darling Equal Distribution |
| Major elements | 0.99 | 0.87 | 1.00 | 1.00 |
| Trace elements | 0.77 | 0.59 | 0.73 | 0.97 |
| Major elements: SiO2, TiO2, Al2O3, FeO, MnO2, MgO, CaO, K2O, Na2O | ||||
| Trace elements: Sc, V, Cr, Co, Ni, Zn, As, Br, Rb, Sr, Zr, Sb, Cs, Ba, La, Ce, Nd, Sm, Eu, Gd, Tb, Tm, Yb, Hf, Ta, W, Hg, Th, U | ||||
| La/Sm | Gd/Yb | Eu* | Th/U | |
|---|---|---|---|---|
| Sediment | 4.91 ± 1.8 | 1.92 ± 1.3 | 0.69 ± 0.27 | 3.23 ± 1 |
| Soils | 5.81 ± 2.4 | 1.49 ± 1.1 | 0.8 ± 0.32 | 3.03 ± 0.9 |
| UCC | 6.6 | 1.9 | 0.72 | 2.96 |
| NASC | 5.56 | --- | --- | 2.53 |
Publisher’s Note: MDPI stays neutral with regard to jurisdictional claims in published maps and institutional affiliations. |
© 2022 by the authors. Licensee MDPI, Basel, Switzerland. This article is an open access article distributed under the terms and conditions of the Creative Commons Attribution (CC BY) license (https://creativecommons.org/licenses/by/4.0/).
Share and Cite
Abdushukurov, D.A.; Abdusamadzoda, D.; Duliu, O.G.; Zinicovscaia, I.; Nekhoroshkov, P.S. On the Geochemistry of Major and Trace Elements Distribution in Sediments and Soils of Zarafshon River Valley, Western Tajikistan. Appl. Sci. 2022, 12, 2763. https://doi.org/10.3390/app12062763
Abdushukurov DA, Abdusamadzoda D, Duliu OG, Zinicovscaia I, Nekhoroshkov PS. On the Geochemistry of Major and Trace Elements Distribution in Sediments and Soils of Zarafshon River Valley, Western Tajikistan. Applied Sciences. 2022; 12(6):2763. https://doi.org/10.3390/app12062763
Chicago/Turabian StyleAbdushukurov, Djamshed A., Daler Abdusamadzoda, Octavian G. Duliu, Inga Zinicovscaia, and Pavel S. Nekhoroshkov. 2022. "On the Geochemistry of Major and Trace Elements Distribution in Sediments and Soils of Zarafshon River Valley, Western Tajikistan" Applied Sciences 12, no. 6: 2763. https://doi.org/10.3390/app12062763
APA StyleAbdushukurov, D. A., Abdusamadzoda, D., Duliu, O. G., Zinicovscaia, I., & Nekhoroshkov, P. S. (2022). On the Geochemistry of Major and Trace Elements Distribution in Sediments and Soils of Zarafshon River Valley, Western Tajikistan. Applied Sciences, 12(6), 2763. https://doi.org/10.3390/app12062763