Article

Seismological and Ground Deformation Study of the Ionian Islands (W. Greece) during 2014–2018, a Period of Intense Seismic Activity

by
Vassilis Sakkas
1,*,
Vasilis Kapetanidis
1,
George Kaviris
1,
Ioannis Spingos
1,
Spyridon Mavroulis
2,
Michalis Diakakis
2,
John D. Alexopoulos
1,
Danai Kazantzidou-Firtinidou
1,
Ioannis Kassaras
1,
Spyridon Dilalos
1,
Emmanuel Vassilakis
3,
Evelina Kotsi
2,
Gerasimos Tselentis
1,4,
Efthymis Lekkas
2 and
Nicholas Voulgaris
1
1
Section of Geophysics—Geothermics, Department of Geology and Geoenvironment, National and Kapodistrian University of Athens, 15784 Athens, Greece
2
Section of Dynamic Tectonic Applied Geology, Department of Geology and Geoenvironment, National and Kapodistrian University of Athens, 15784 Athens, Greece
3
Section of Geography & Climatology, Department of Geology and Geoenvironment, National and Kapodistrian University of Athens, 15784 Athens, Greece
4
Institute of Geodynamics, National Observatory of Athens, 11810 Athens, Greece
*
Author to whom correspondence should be addressed.
Appl. Sci. 2022, 12(5), 2331; https://doi.org/10.3390/app12052331
Submission received: 19 January 2022 / Revised: 15 February 2022 / Accepted: 17 February 2022 / Published: 23 February 2022
(This article belongs to the Special Issue Mapping, Monitoring and Assessing Disasters)

Abstract

:
Seismicity in the Ionian Sea (W. Greece) is mainly generated along the Cephalonia–Lefkada Transform Fault Zone (CLTFZ) in the central Ionian, and on the northwestern termination of the Hellenic subduction margin in the south. Joint pre-, co- and post-seismic ground deformation and seismological analysis is performed at the broad Ionian area, aiming to homogeneously study the spatiotemporal evolution of the activity prior to and after the occurrence of strong (M > 6) earthquakes during the period of 2014–2018. The 2014 Cephalonia earthquakes (Mw6.1 and Mw5.9) were generated on a faulting system adjacent to CLTFZ, causing local ground deformation. The post-seismic sequence is coupled in space and time with the 2015 Lefkada earthquake (Mw6.4), which occurred on the Lefkada segment of the CLTFZ. Co-seismic displacement was recorded in the broader area. Seismicity was concentrated along the CLTFZ, while its temporal evolution lasted for several months. The 2018 Zakynthos earthquake (Mw6.7) caused regional deformation and alterations on the near-velocity field, with the seismicity rate remaining above background levels until the end of 2021. In the northern Ionian, convergence between the Apulian platform and the Hellenic foreland occurs, exhibiting low seismicity. Seismic hazard assessment revealed high PGA and PGV expected values in the central Ionian.

1. Introduction

The area of the Ionian Islands in western Greece plays an important role in the kinematic processes of the eastern Mediterranean. This tectonically complex area is by far the most seismically active region in Greece and among the most seismogenic regions in Europe. It is characterized by the frequent occurrence of destructive large earthquakes and undergoes intense ground deformation. The central Ionian Islands constitute part of the Eastern Mediterranean lithosphere that is subducted beneath the Aegean lithosphere along the Hellenic Arc.
The Ionian Sea (Figure 1) hosts areas with different fault geometries and kinematics. The prevailing tectonic structure is the NNE–SSW-trending, right-lateral Cephalonia–Lefkada Transform Fault Zone (CLTFZ), which is the most seismically active structure not only in the Ionian Sea, but also in Greece. This zone is a major boundary in the kinematic field of the region, as it separates the Ionian Margin into two different areas. The North Ionian Islands, comprising the Diapontia Islands, Corfu, Paxoi and Antipaxoi Islands, move slowly northward and northwestward at rates lower than 5 mm/year with respect to Eurasia. The South Ionian Islands, comprising Lefkada, Cephalonia, Ithaca and Zakynthos, move rapidly southwestward with velocities of 6–30 mm/year [1,2,3].
The CLTFZ is composed of two segments: the 40 km-long, NE–SW-striking, ESE-dipping, right-lateral Lefkada segment, extending from the northwestern offshore part of Lefkada Island to the northern offshore part of Cephalonia Island [4,5], and the 90-km-long Cephalonia segment, close to the western offshore part of Cephalonia, with similar geometry and kinematic properties to the other segment [6,7].
The South Ionian Islands (Zakynthos and Strofades) are located close to the northwesternmost tip of the Hellenic Arc, a few kilometers east of the Hellenic Trench in the southern Ionian Sea. The trench represents the active plate boundary where the eastern Mediterranean lithosphere is being subducted beneath the Aegean one. This subduction zone terminates against the Cephalonia segment of the CLTFZ.
The CLTFZ is not the only major right-lateral fault zone in the Ionian Sea. A few kilometers south of Zakynthos, another structure occurs. It constitutes the southward extension of the seismic NE–SW-striking, right-lateral Western Achaia Fault Zone (WAFZ), which extends from the northwestern part of the Peloponnese to offshore southern Zakynthos [20]. The epicenter of the 8 June 2008, Mw6.4 Andravida earthquake [21,22] and its aftershock sequence were distributed along the onshore part of the WAFZ, at the northwestern part of the Peloponnese. It is worth noting that the earthquake did not induce direct expression of primary surface faulting [23]. Furthermore, the onshore part of the WAFZ has no direct surficial morphotectonic or geological evidence onshore of the Western Peloponnese. On the contrary, its offshore extension is linked with an offshore pull-apart basin NE of the Strofades Islets [24,25].
The part of the Ionian Sea located south of Zakynthos constitutes a downthrown block of the External Hellenides at the northern end of the Hellenic Trench. Flat thrusts, strike-slip and normal faults are detected [25], with thrusting prevailing over strike-slip or normal faulting [7,26]. The prominent feature of this area is a 46 km-long, NW–SE-trending thrust system [27], responsible for the generation of the 1997 Mw6.6 [28] and the 26 October 2018 Mw6.7 [29] Zakynthos earthquakes.
The intense seismicity on the southern part of the Ionian Sea is attributed to the proximity of this area to the CLTFZ, the Hellenic Trench and many onshore faults in the South Ionian Islands. These islands have been formed either on the margins or within fault blocks. At Lefkada Island, typical cases are the fault zones in the western coastal part [15], along which extensive environmental effects were generated from the two strong Lefkada earthquakes on 14 August 2003 (Mw6.3) [30,31] and on 17 November 2015 (Mw6.4) [32], triggering many rockfalls and landslides in the western coastal part of the island [17,33]. In Cephalonia, several active faulting zones at the northern, western and southwestern parts of the island are susceptible to triggering of earthquake environmental effects, with the most typical example being the numerous rockfalls and slides due to the August 1953 earthquakes [34]. In Zakynthos, typical cases of active faults are the Volimes fault zone in the north part of the island, which has been formed in the transition from the Northern Zakynthos fault block to the Central Zakynthos one. Similar active faults are also located at the eastern and southern parts of Zakynthos Island [16].
Regarding the North Ionian Islands, a NNW–SSE-trending system, with a relatively extended shelf width represents the convergence (continental collision) between the Apulian Platform and the Hellenic foreland, with Corfu lying on the northwestern edge of the Hellenic Fold and Thrust Belt. The E–W-striking Southern Salerno–North Corfu fault zone is a major right-lateral structure that crosses Corfu from coast to coast [35] and which has resulted in the displacement of N–S-trending fold axes and thrusts [36]. This part of the Ionian Sea is characterized by lower seismicity than the southern one. The North Ionian Islands have suffered damage from earthquakes generated in adjacent areas, such as the 20 February 1743 Salento peninsula (Apulia, southern Italy) earthquake with Mw7.1 and I0 = IX, which triggered landslides in Corfu [37] and severe structural damage, including building collapses in Corfu town [38], attributed to very efficient strong propagation with NW–SE preferential directivity [39].
The complex geotectonic status of the area resulted in the high seismic activity that occurs in the broad Ionian area. However, during the last decade, and mainly during the period between 2014 and 2018, increased seismicity was observed, and strong events (M > 6.0) shocked the central Ionian Islands. Early 2014, two earthquakes (Mw5.9 and Mw6.1) occurred on Cephalonia Island, while in November 2015 and in October 2018 two earthquakes of Mw6.4 and Mw6.7 took place at South Lefkada and offshore south of Zakynthos, respectively. The regional crustal motion along the entire Ionian Sea and western Greece, as well as the local deformation on the central Ionian Islands, have been studied and monitored with local dense Global Positioning System (GPS) networks [13,40,41] and continuous Global Navigation Satellite System (GNSS) stations [42,43]. Previous work focused on the seismological analysis and interpretation of each of these strong earthquakes [15,29,32,44,45,46,47,48,49], on the study and modeling of the co-seismic deformation during every event [50,51,52,53,54,55,56,57,58] and on the geological impact close to the epicentral areas [14,15,17,59,60].
The purpose of the present work is to study and present in a unified and homogeneous approach an overview of the seismicity and the ground deformation in the broad area of Ionian Sea, extending from Corfu Island to the north to Strofades Islet in the south. The time span of the data covers the period before, during and after the occurrence of the strong earthquakes of 2014–2018. The spatiotemporal evolution of the seismicity involving these significant events is analyzed. Pre-, co- and post-seismic deformation is quantitatively described, aiming to understand the pattern of the ground motion associated with the recorded seismicity. The regional implications of joint seismological and geodetic analysis are also considered and discussed with respect to the geotectonic status of the area. Seismological data from the Hellenic Unified Seismic Network (HUSN) and geodetic data from the commercial and institutional continuous GNSS networks in the area were used in the framework of this study.

2. Seismological Data and Results

In the Ionian Islands there are historical reports of 94 earthquakes from the years 358 to 1898 [9,61]. A significant number of historical earthquakes are located onshore, most possibly due to the limitations that arise from the use of historical sources. Instrumental seismicity, since 1900, is concentrated around the islands of Lefkada, Cephalonia and Zakynthos [28]. As described above, epicenters in Lefkada and Cephalonia are linked to local faults and mainly to the CLTFZ, whereas seismicity offshore and close to Zakynthos is related to the border between the Eurasian and African plates. Focal depths are limited to the upper 30–40 km of the crust, while foci at greater depths are related to the submerged African plate. The high seismicity rate is reflected in the high seismic hazard of the central Ionian Islands that belong to the highest category (Zone III) of the current Greek Building Code, with a Peak Ground Acceleration (PGA) value of 0.36 g for a return period of 475 years [62].
Since the implementation of the HUSN in 2007 [63], the monitoring of seismic activity in Greece has been enhanced, with increased detectability and improved location accuracy. This was particularly important for the region of the Ionian Islands, as it is situated at the western margins of the network and a significant part of its intense seismicity is located offshore. Herein, a catalogue of ~62,000 earthquakes was compiled. These events have occurred in the broad Ionian Islands area, including part of mainland western Greece. The seismological data were collected from the database of the Geodynamics Institute of the National Observatory of Athens (GI-NOA) for the period from February 2011 to May 2018. For the consecutive period from June 2018 to November 2021, the seismological data were extracted from the database of the Seismological Laboratory of the National and Kapodistrian University of Athens (SL-NKUA). Furthermore, in the present analysis, relocated seismicity catalogues were incorporated for the 2014 Cephalonia, 2015 Lefkada and 2018 Zakynthos aftershock sequences [29,32,64,65,66,67].

2.1. Seismicity Results

After visual inspection, the seismicity of the study area during the last decade was divided into 12 spatial groups (Figure 2), to enable the description of its spatiotemporal evolution. Seismicity marginal to the area of interest was placed in the miscellaneous group #13 (white). The magnitude of completeness is estimated at Mc = 2.0 ± 0.2, with variations depending on the method used for its determination or the time period of a selected subset. At times, it reaches lower values, e.g., 1.5, whereas during the occurrence of significant earthquakes that produce series of large aftershocks, the magnitude of completeness may temporarily surpass 2.5. The cumulative number of events per spatial group (Figure 3a) and the spatiotemporal projection (Figure 3b) along the A–B profile of Figure 2a are drawn after the application of the magnitude threshold (MMc = 2.0). The herein referred magnitudes are ML, unless otherwise stated.
Starting in early 2011, scattered seismicity was observed throughout the Ionian Islands region. An M4.5 earthquake occurred near the northern tip of Cephalonia Island on 16 March 2011, an M4.1 event occurred just offshore south of the island on 5 December 2011 and an M4.2 event near the northwestern part of the Paliki peninsula (Atheras area) on 23 April 2013. The background seismicity rate with M ≥ 2.0 was ~0.4 events/day, occurring mainly onshore of the island (group #1, red) and in Myrtos Gulf (group #2, orange). Overall, very few events are located near to or onshore of Ithaca Island during the study period. Background seismicity was also recorded along the SW extension of the CLTFZ, at a rate of 0.1–0.2 events/day. Further south, near Zakynthos Island, clustered seismicity was recorded following events of magnitude around 4 at group #4 (indigo; ~0.3 events/day) and group #8 (yellow; ~0.5 events/day), which extended from the area between Zakynthos and Cephalonia to the NW Peloponnese. An M5.0 event occurred at the westernmost end of group #4 on 19 July 2011, triggering seismicity along SW–NE-trending streaks. It should be noted that such delineations of epicenters in that area have been argued to be affected by the large azimuthal gap, causing location biases along this direction [29], so they should not be overinterpreted. The southernmost group #6 (cyan) near the Strofades Islets has a background rate of ~0.2 events/day. On Lefkada Island (group #3, green; with a background rate of 0.1–0.2 events/day), seismicity often occurs in spatiotemporal clusters, whereas the background seismicity on Cephalonia Island tends to be more randomly scattered. Significant earthquakes that took place during the study period also include an M4.5 event on 23 October 2012 offshore north of Lefkada and west of Preveza, and an M4.7 event on 23 May 2013 at the southern tip of the island.
Group #9 (black), near the eastern shore of Amvrakikos Gulf, with a background rate of ~0.1 events/day, contains an M5.2 event that occurred on 24 October 2014, producing a small cluster. Further north, Corfu Island is characterized by very low seismicity onshore throughout the study period. Sparse seismic activity was recorded offshore to the south and a bit denser distribution of epicenters is identified to the north, near the shores of Albania (group #5, purple; with a background rate of 0.1–0.2 events/day), related with events of magnitude 4.0 ≤ M < 5.0. West of Corfu Island, at NW Epirus, group #10 (blue; background rate of 0.2–0.4 events/day) included an M = 5.6 thrust event that occurred on 21 March 2020 near Kanallaki [68,69]. Group #11 (beige; background rate of 0.1 events/day) contains an M5.3 event that occurred on 15 October 2016 near Ioannina. At the northern edge of the study area, group #12 (gray; background rate of 0.1 events/day) near the Greco-Albanian border, contains an M5.3 event that occurred on 1 June 2019. The most significant bursts of earthquake activity at the Ionian Islands region during the study period comprise the 2014 Cephalonia (groups #1 and #2), the 2015 Lefkada (groups #3 and #2) and the 2018–2019 Zakynthos mainshock–aftershock sequences (group #4), which are described in more detail in the following subsections.

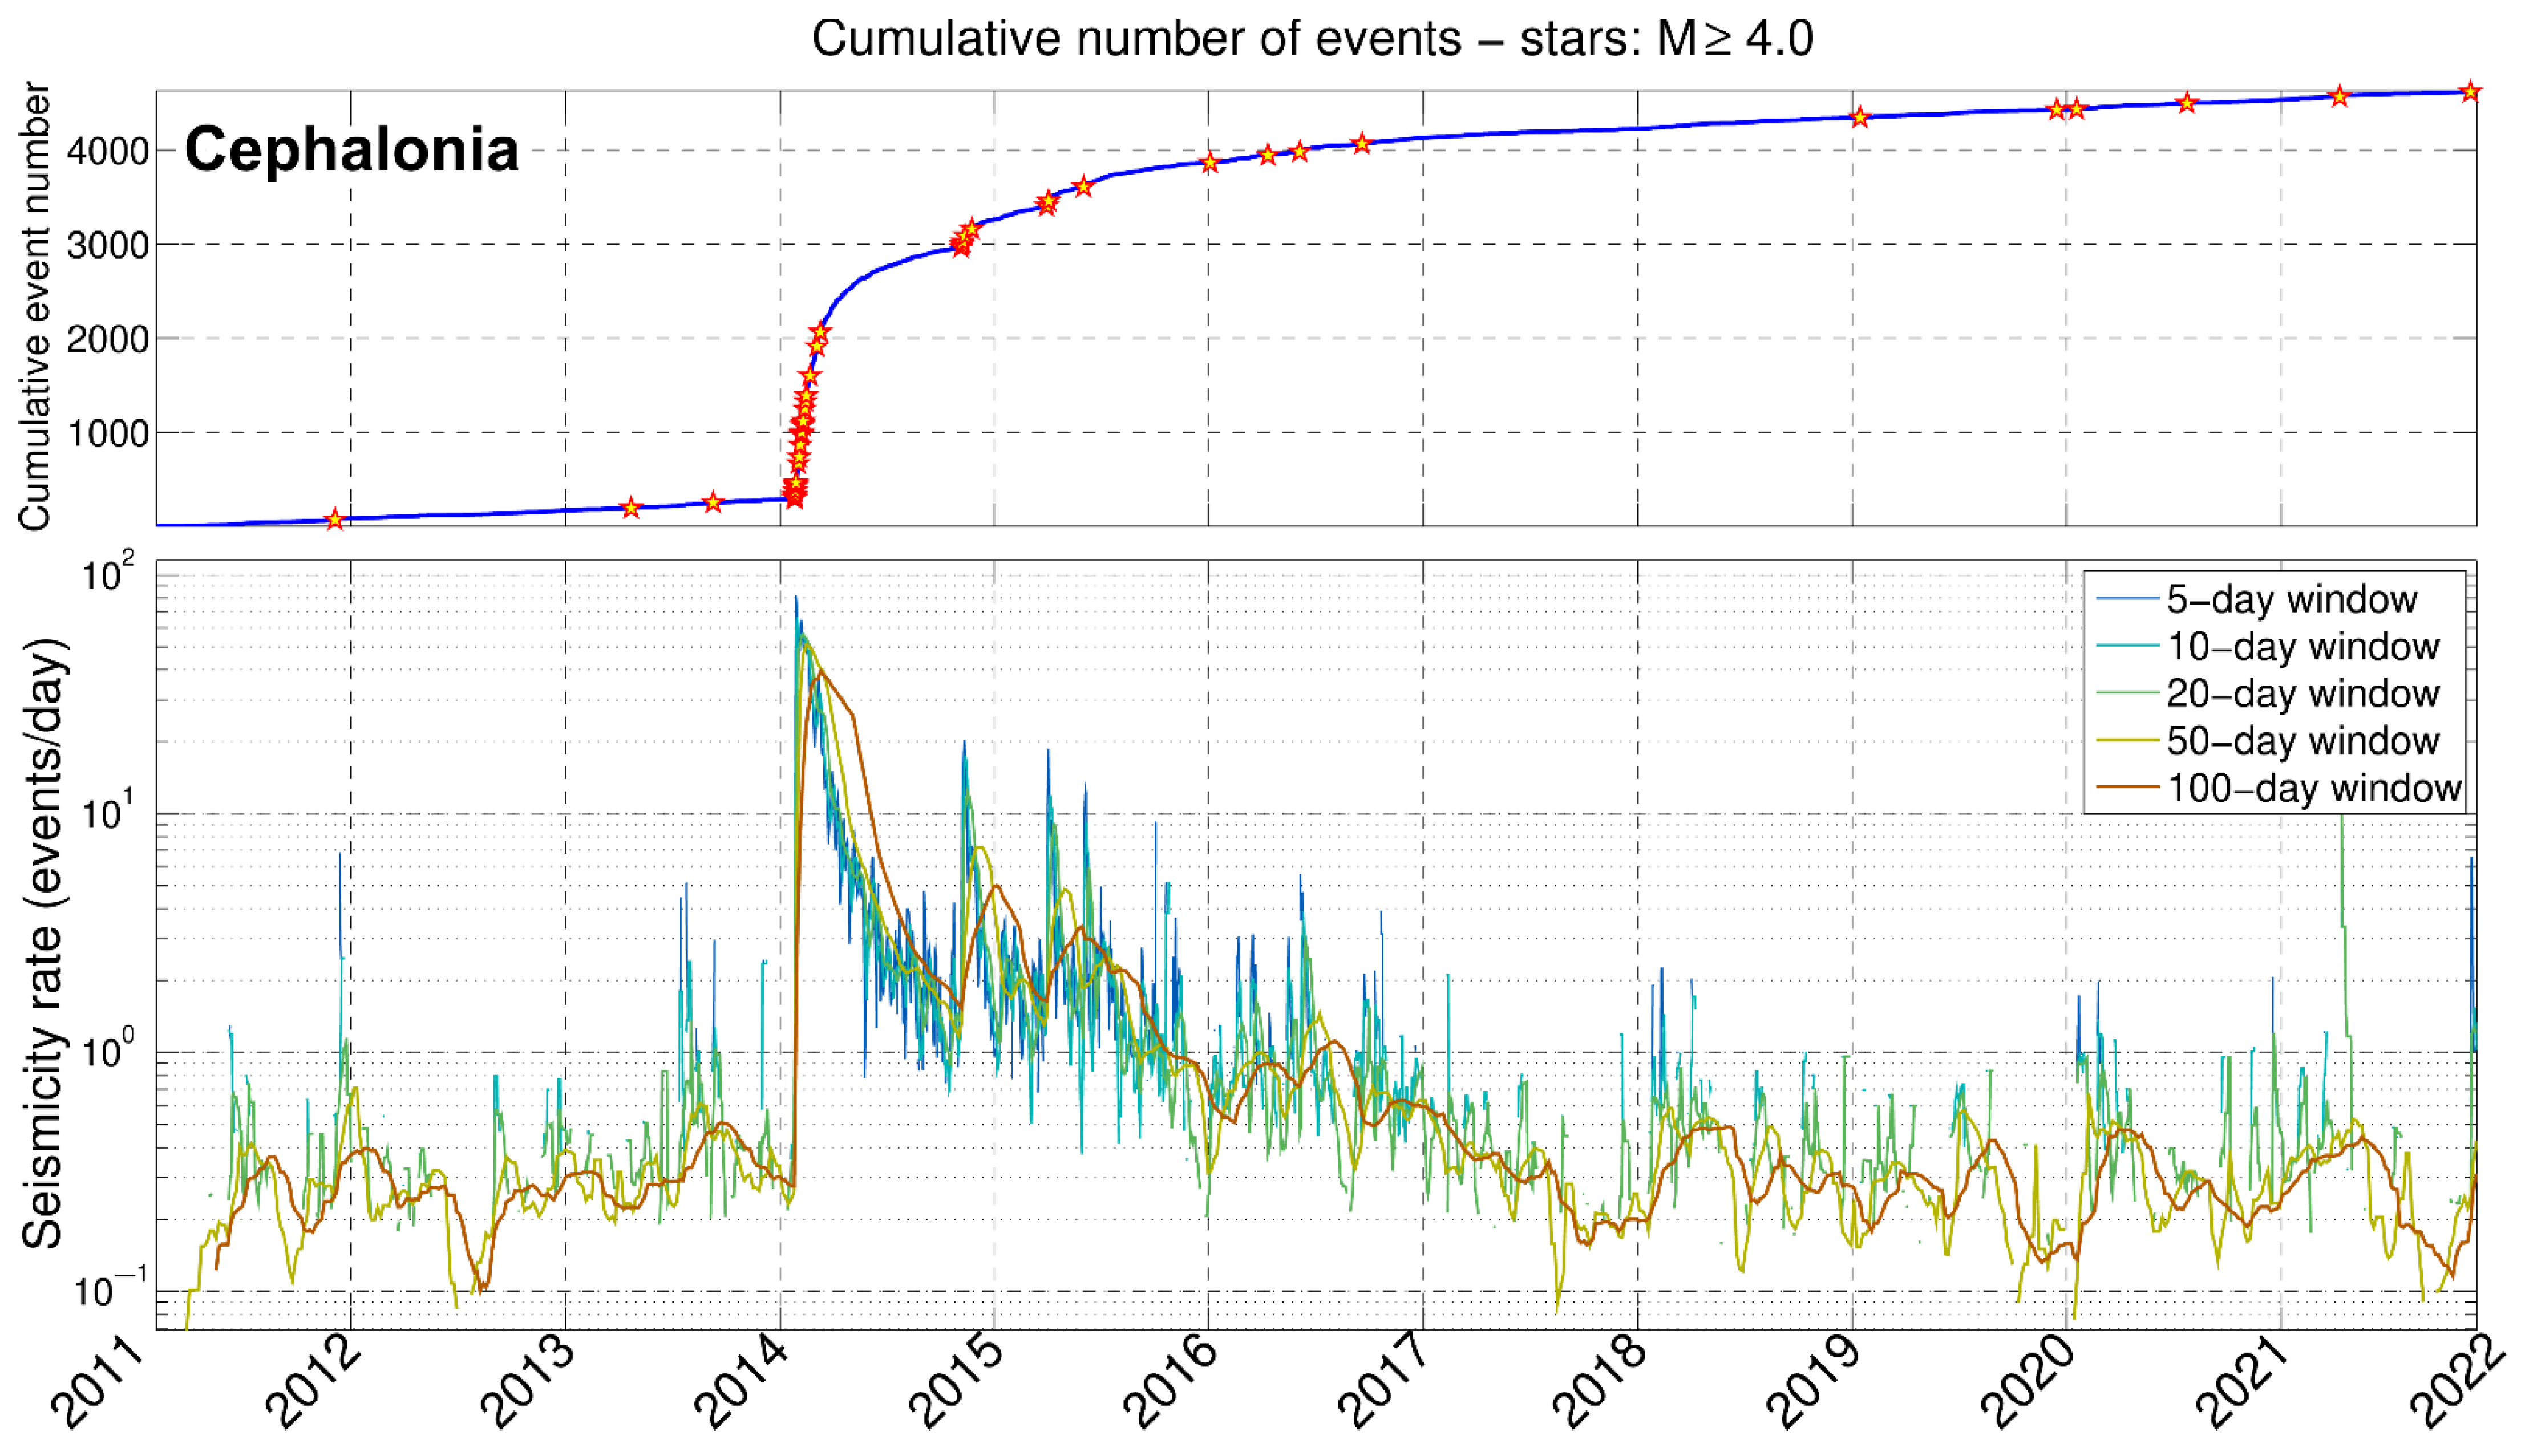
2.1.1. The 2014 Cephalonia Sequence

The 2014 Cephalonia sequence was initiated by an Mw6.1 mainshock that occurred on 26 January 2014, ~2 km NE of the city of Lixouri, on the Paliki peninsula [44,45,46,60,64]. About one week later, on 3 February 2014, another significant earthquake of magnitude Mw5.9 occurred at the NW part of Paliki. The seismicity on Cephalonia Island during 2014 was relocated using the double difference method (HypoDD; [70]) and a minimum 1D velocity model [64,65]. The aftershock distribution extended ~32 km in a N20° E direction, covering the entire Paliki peninsula (group #1), but seismic activity was also triggered in a spatially separated cluster inside Myrtos Gulf (group #2). The southern half of the onshore seismicity, related mostly to the first major earthquake of 26 January 2014 at a depth of 16 km, appeared more complex, being distributed between 5 and 17 km and extending to a width of 15 km in a N110° E direction, whereas the northern half, mostly related to the second major earthquake, was more linearly distributed (width ~5 km) and shallower, at focal depths between 5 and 12 km [65]. Seismicity after the first earthquake was mainly concentrated near its hypocenter during the first hours, but quickly spread throughout the aftershock zone. Some clusters further south, offshore Cephalonia, were triggered at a later stage. A significant cluster occurred south of group #1 after an M5.0 event on 8 November 2014, soon followed by clustered activity in Myrtos Gulf (group #2). The focal mechanisms of the two major events and most of the major aftershocks indicate dextral strike-slip faulting along SSW–NNE-trending, subvertical faults. However, seismicity inside the Myrtos Gulf is characterized by several smaller clusters trending E–W, i.e., transverse to the axis of the CLTFZ, which suggests antithetic sinistral faulting. The 2014 sequence temporarily increased the seismicity rate of the neighboring groups #7 and #8. The temporal evolution of the post-seismic activity in Cephalonia (group #1) shows a long relaxation period that lasted up to July 2017, considering a relatively high background seismicity level (0.3 events/day) for MMc = 2.0 (Figure 4). In the northern area of Cephalonia (group #2), with a smaller background seismicity rate (0.1 events/day prior to 2014), increased activity was observed up to September 2017, due to its reactivation after the 2015 Lefkada mainshock, which is presented in the following Section 2.1.2.

2.1.2. The 2015 Lefkada Sequence

A few months after the Cephalonia events, on 17 November 2015, an Mw6.4 earthquake struck Lefkada Island, with its epicenter located near the mid-southern part of the western coast. The seismicity during the period from 17 November to 3 December 2015, relocated with the double-difference method [65], revealed a very different distribution than that of the 2014 Cephalonia sequence. The aftershocks were divided in distinct clusters, distributed at focal depths between 5 and 15 km. The aftershock zone extended to ~60 km in a N16°E direction, mainly onshore of the island. Very few events occurred south of the mainshock, suggesting that a major fault patch was ruptured, leaving only few small unbroken asperities. The largest aftershock was an M5.0 event that occurred on the same day as the mainshock and close to its vicinity. The densest cluster was located just north of the mainshock, in the same region that was activated during an M5.1 event that had occurred on 29 November 1994 [71], and also triggered after an Mw6.3 earthquake that struck the northern part of the island on 14 August 2003 [30,31]. Notably, the mainshock of 2015 at Lefkada Island, which mainly involved group #3, also triggered seismicity in group #2, between Cephalonia and Lefkada, and even inside the Myrtos Gulf. Furthermore, these offshore southern clusters presented similar characteristics as those in the gulf of Myrtos, i.e., east–west alignment, likely related to antithetic sinistral faulting, transverse to the CLTFZ. The earthquake rate of group #3 that increased since the occurrence of the 17 November 2015 earthquake, remained higher than the background level (0.1 events/day; for MMc = 2.0) as late as September–October 2017. To exclude possible biases due to the increase of event detectability, setting a higher magnitude threshold of 2.3 (Figure 5) indicated a return of the seismicity rate to its background level around October 2016, dropping to very low levels in May–July 2017.

2.1.3. The 2018–2019 Zakynthos Sequence
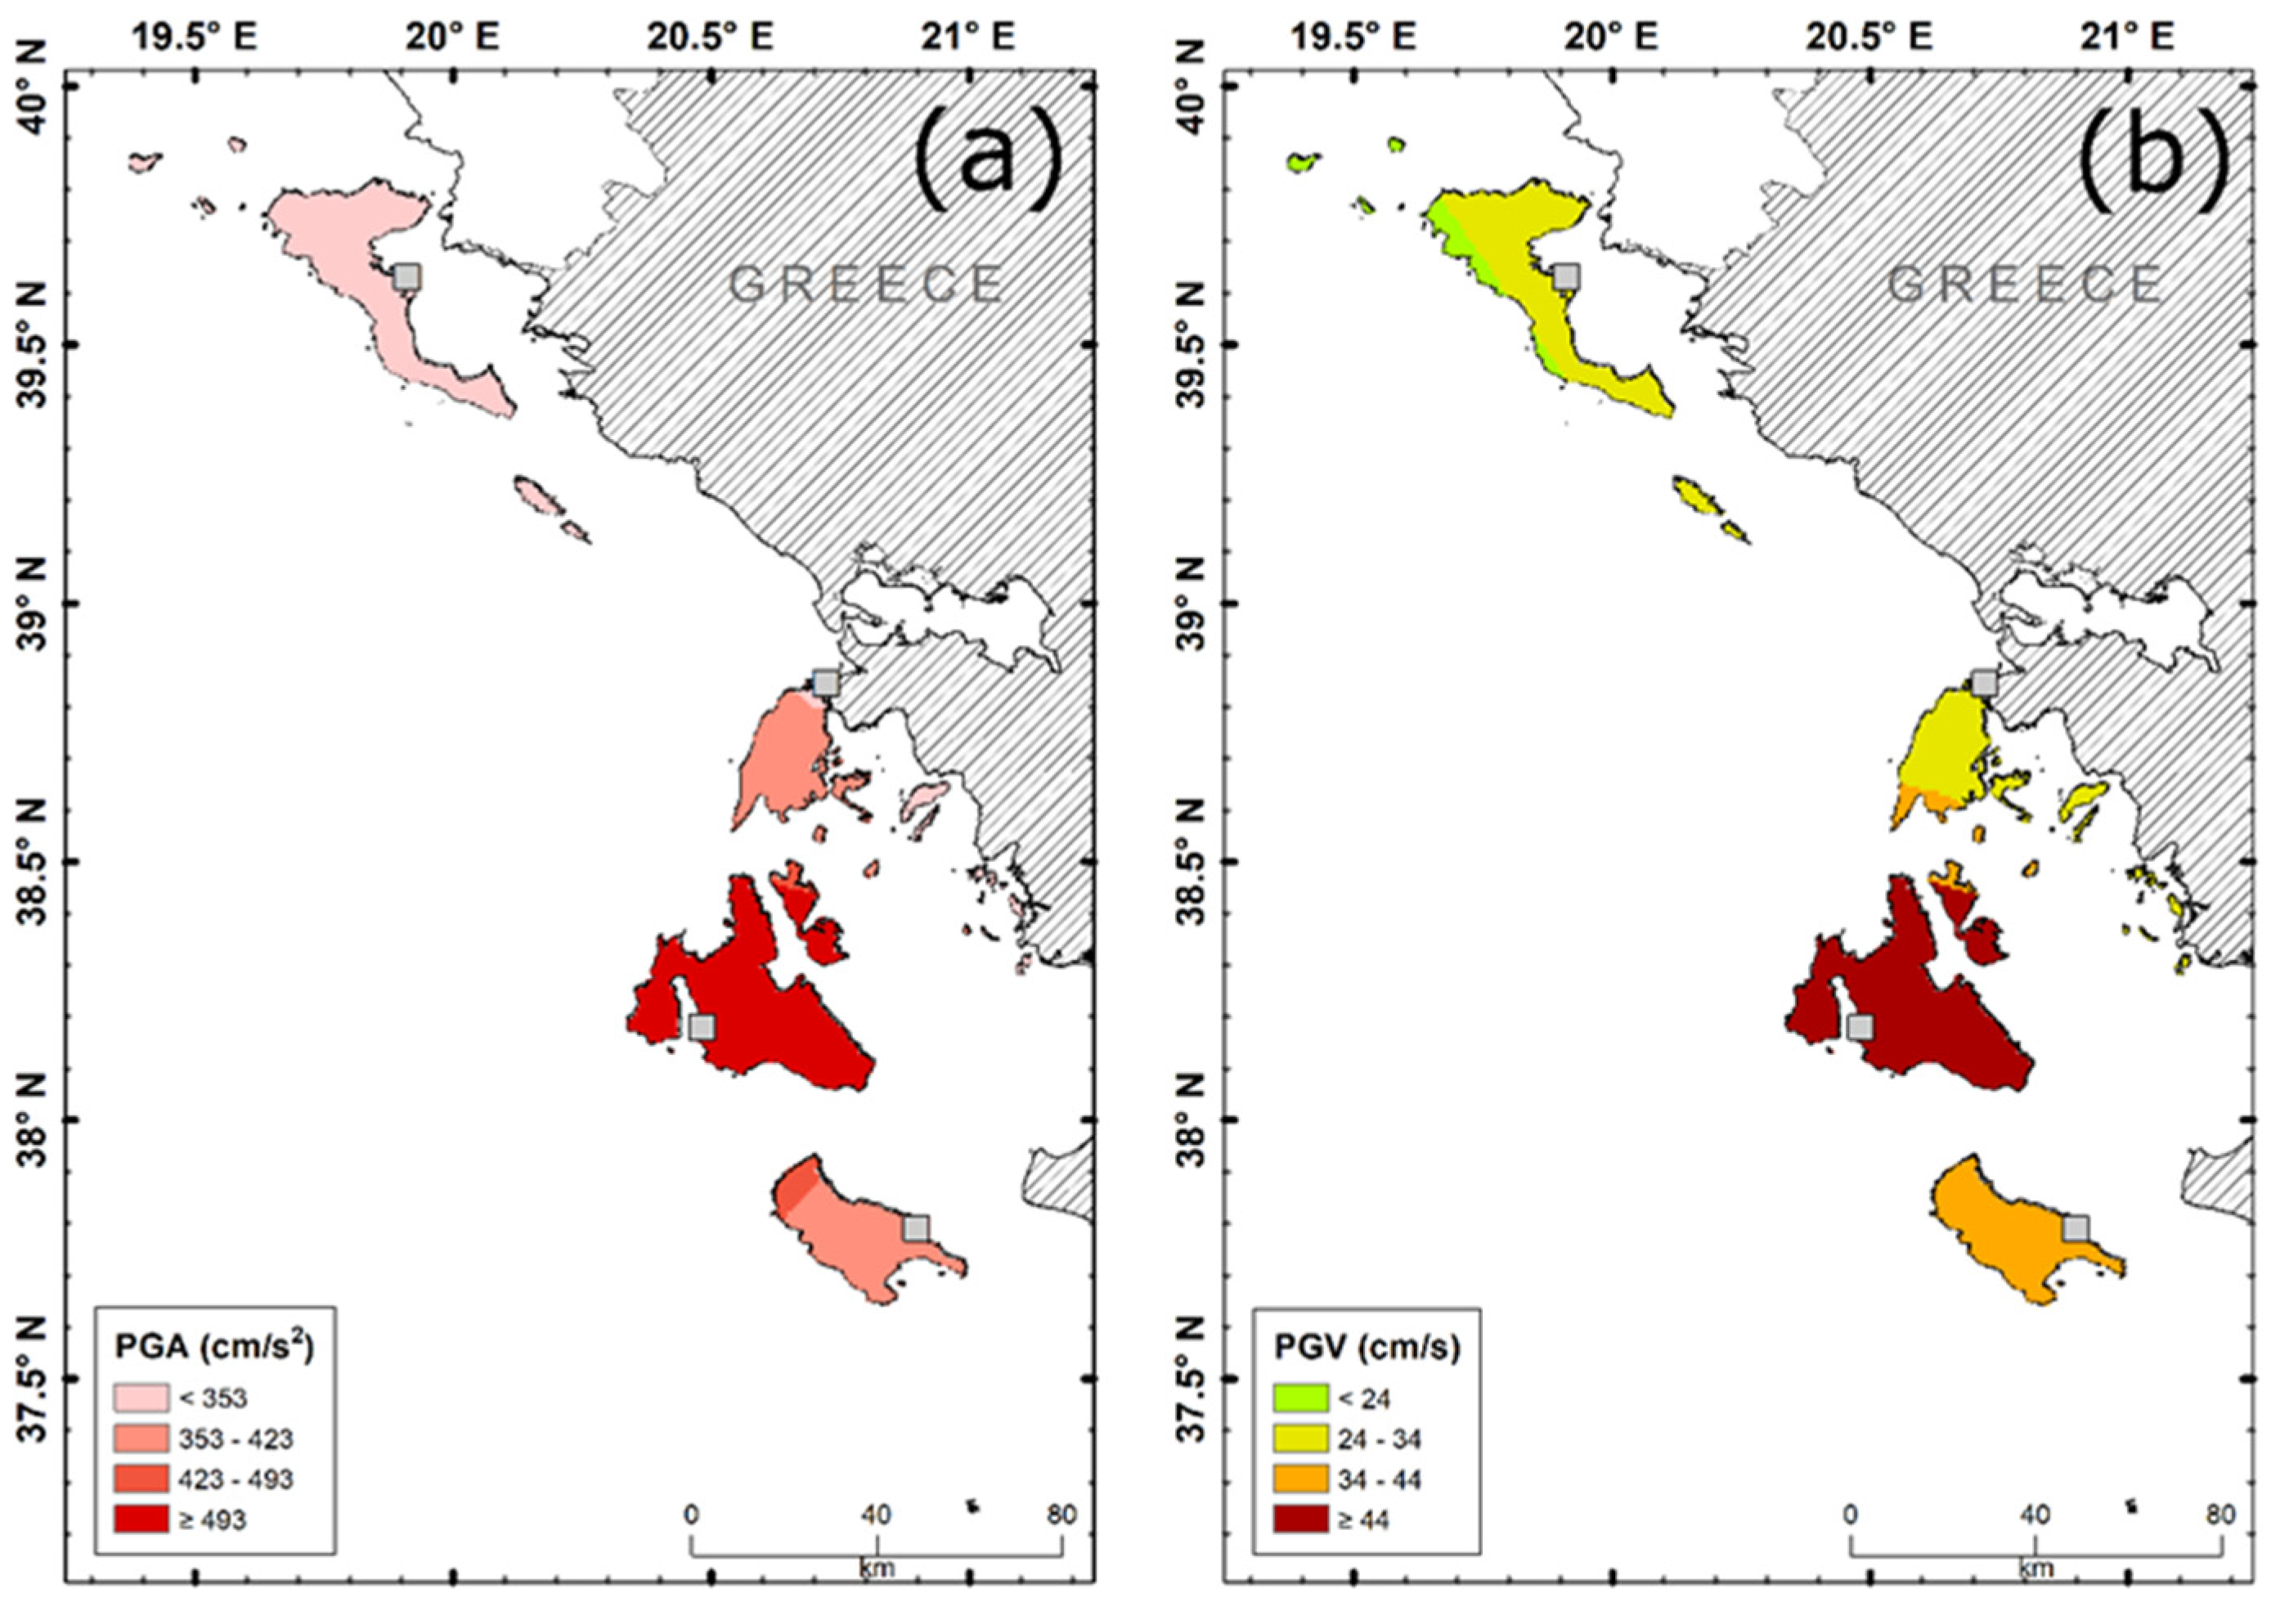
The most recent significant seismic occurrence in the region of the Ionian Islands during the study period is the 2018–2019 Zakynthos mainshock-aftershock sequence [29,49,72]. An Mw6.7 offshore earthquake occurred on 25 October 2018, 45 km SW of Zakynthos Island, at an estimated depth of ~12 km. The focal mechanism of the mainshock indicates dextral strike-slip on a low-angle (25°), east-dipping plane. The relocated catalogue of over 4000 aftershocks in the period between 25 October 2018 and 31 March 2019 reveals an extensive aftershock zone, ~80-km-long in a N110° E direction and ~55 km wide [29]. The largest aftershock was an Mw5.5 event that occurred on 30 October 2018, 15 km NNW of the mainshock, with a similar focal mechanism, albeit with a steeper dip angle. The distribution of epicenters permits the distinction of some sub-clusters within the seismicity cloud. A large group in the vicinity of the mainshock presented a smoothly diminishing seismicity rate. On the other hand, other clusters, particularly at the northern part of the aftershock zone, but also at the southern end, presented outbreaks, some related with the occurrence of significant aftershocks. The most persistent activity was observed at the northern subclusters of group #4, with intense activity that lasted until October 2019. A last burst of seismic activity occurred between March and July 2020 and was triggered at the southern end of the 2018 aftershock zone, after an M4.3 event on 26 March 2020, followed by a few more M > 4 events. A final significant M5.2 event occurred on 21 October 2020 in the same region, after a period of quiescence.
The 2018 Zakynthos mainshock–aftershock sequence was preceded by several foreshocks since the beginning of the year in the vicinity of the mainshock. An M4.8 event had occurred at the northern end of group #4 on 21 February 2018 and another Mw4.8 event was recorded half an hour before the mainshock. Earlier activity was also documented near the mainshock’s region between September 2016 and March 2017, in at least three outbreaks, while a smaller one occurred in August 2017. Focal mechanisms of the 2018 Zakynthos aftershock sequence involved both low-angle and steeper strike-slip faulting [29]. The latter is mainly related with the northern subclusters, which also present a form of SW–NE-trending streaks, similar to the cluster at the southern end of group #4. The kinematics of the mainshock and many of the major aftershocks are consistent with SW–NE-trending compression occurring in this region that is found in a transition zone between strike-slip faulting in the north (CLTFZ) and to the east (WAFZ in the NW Peloponnese, e.g., the 2008 Andravida earthquake [21,22]) and the northwestern end of the Hellenic Arc subduction zone. The temporal evolution of the post-seismic activity indicates that even towards the end of 2021 the seismicity rate had still not returned to its background level, despite the magnitude threshold being set as high as 2.5, quite above the average Mc = 2.0 (Figure 6).

2.2. Seismic Hazard

The intense and large magnitude seismic activity in the broad area of the Ionian Islands makes the assessment of seismic hazard crucial in the urban planning, as well as in the construction of critical infrastructure. Additionally, the tourism industry in the Ionian Islands is a major concern for the local and national economy that requires enhancing its earthquake resilience.
The strong earthquakes that occurred in the area have yielded high values of Peak Ground Acceleration (PGA). At Cephalonia, the two events of 2014 induced shakings reaching ~560 cm/s2 and 735 cm/s2, respectively [73]. At Lefkada, PGAs of ~412 cm/s2 were recorded in the 2003 event [74] and 363 cm/s2 during the 2015 earthquake [67]. Finally, the Mw6.7 earthquake of Zakynthos led to a recorded PGA of ~382 cm/s2 [75], on the island.
On the framework of this study, the seismic hazard of the Ionian Islands was evaluated, aiming to estimate the maximum anticipated ground motion values in this highly active seismogenic area. A probabilistic seismic hazard assessment (PSHA) method has been applied. Based on the regional character of this study, a source-zone approach was selected. Zone boundaries were obtained from the SHARE project [76,77]. However, the b-value, earthquake rate and maximum magnitude for each area were re-estimated, from the catalogue compiled in the context of the current study. To account for time periods of incomplete data, the modified b-value (β) was determined using a maximum likelihood method [78]. The ground motion prediction equations (GMPEs) of [79], which have been successfully applied in seismic hazard studies in Greece [80,81,82], were used to obtain PGA values in the final PSHA model. A reverse/strike-slip focal mechanism type and a rock basement were considered in the GMPE, for all areas. Finally, the seismic hazard was assessed using the R-CRISIS software [83]. The software can calculate the expected hazard value (in this case, PGA and the Peak Ground Velocity; PGV) for estimated earthquake occurrence probabilities at specific timeframes, for the given distribution of sources and the event magnitudes within the limits of each zone. The PGA and PGV values were computed for a 10% exceedance probability level in 50 years (return period of 475 years) (Figure 7).
The two hazard quantities follow similar distributions. Highest values are observed at Cephalonia and the nearby Ithaca Island. The high seismic activity on these islands fully complied with the obtained hazard values. Similarly, increased values are observed at the NW edge of Zakynthos. The hazard quantities decrease towards the central part of Zakynthos, in accordance with the lack of strong events in this area. The high hazard zone is terminated at the southern part of Lefkada Island. The lowest hazard values in the area are observed in the north Ionian Islands (Paxoi and Corfu); as expected, since no large-magnitude events (M ≥ 6.0) have occurred in this area during the past 120 years [28].
The Greek Building Code [62] classifies the Ionian islands into two zones: Zone II (with PGA of 235 cm/s2) and Zone III (with a value of 353 cm/s2). Lefkada, Cephalonia, Ithaca and Zakynthos Islands are in Zone III, with Corfu and Paxoi classified in Zone II. While the code provides wide ranges, the current analysis indicates that there may be a need for a more detailed approach. The expected PGA at Corfu and Paxoi was found to be the lowest in the Ionian Islands, being less than 353 cm/s2. However, it was observed that for Zone III islands, a much finer distribution could be extracted (Figure 7a). Moreover, Cephalonia and Ithaca seemed to feature PGA values much higher than that of the Seismic Code. Making this distinction by introducing a new Zone with stricter building guidelines could prove to be a useful approach to reduce seismic vulnerability—and therefore, risk—in a financially significant area of the Ionian prefecture. Revising the national code would also offer the opportunity to rethink local actions for improving the seismic resilience of older and historical buildings in cities and towns (e.g., Argostoli in Cephalonia) that teem with them. Other seismic hazard studies, albeit Greece-wide, also find PGA values that well exceed those proposed by the building code [80,84].

3. GNSS Data and Results

Daily GNSS data from stations located in the Ionian Islands and western mainland Greece and the Peloponnese were processed for the period from 2009 to 2021. The analysis intended to determine the crustal velocity field of the broad area, detect possible pre-seismic displacements and study co- and post-seismic deformation. The continuous GNSS stations extend from the northern Corfu Island to the Strofades Islets, south of Zakynthos. In western mainland Greece and the Peloponnese, the stations are located in the broad area of Patras Gulf and in the city of Pyrgos in the western Peloponnese (Figure 8). Sites KASI, SPAN, PONT, KIPO, VLSM, ZNTE, STRF, KTCH and RLSO belong to the National Observatory of Athens (NOA network) [42,43]. The commercial network of METRICA SA (HexagonSmartNet) [85] provided data for stations KERK, PAXO, ARGO, ZAKY, AGRI and PYRG. In Cephalonia Island, the sites SISS, KARA and SKAL are part of the National and Kapodistrian University of Athens network (NKUA net) [54]. Meanwhile stations EXAN and DRAN in Lefkada Island and FISK and ASSO in Cephalonia are part of the GNSS network of the Corinth Rift Laboratory (CRL GNSS net) [86], which is the only international Near-Fault Observatory (NFO) of the European Plate Observing System. Finally, PAT0 station in the city of Patras is a European Reference Frame (EUREF) station [87].
The raw GNSS data were processed using the Bernese v5.2 software [88]. Several GNSS stations of the EUREF and IGS were included in the processing together with the local GNSS sites, while auxiliary files were introduced in the procedure. The absolute antenna phase center corrections were used, together with precise orbital solutions from the Center for Orbit Determination in Europe (CODE) and the Vienna Mapping Functions for the tropospheric modeling. The FES2004 model (http://holt.oso.chalmers.se/loading; accessed on 11 January 2022) was used for the tide-loading corrections. The precise double-difference method was used for static-mode solutions. Several ambiguity-resolution strategies were applied, based on the length of the formed baselines between the GNSS stations. The daily calculated coordinates for the GNSS stations were evaluated for the repeatability error on a weekly basis, and solutions were excluded in cases of large deviations from the weekly solution. The processing resulted in the estimation of high-precision station coordinates. Time series were formed, annual velocities were calculated (Figure 8; Table 1, Table 2, Table 3, Table 4 and Table 5) and co-seismic displacements were determined (Appendix B). The daily coordinates of the Ionian GNSS stations were estimated on the global ITRF2014 reference frame.

3.1. Corfu–Paxoi Islands

At the North Ionian Islands, three GNSS stations were processed (Table 1): two in Corfu, KASI and KERK; and the PAXO station located at Paxoi Island. The linear type of motion in all three components for the whole-time span is evident in these stations. There was no static deformation due to the seismic activity that occurred in the south, i.e., related to the 2015 Lefkada or the 2014 Cephalonia events (Figure S1). The calculated velocity vectors are similar to the ones that are presented in [68,89]. For the two Corfu stations (KASI and KERK), the horizontal velocity components are almost parallel, with the southern site exhibiting a slightly increased eastward motion. The most noticeable aspect is the significant subsidence that occurs at the KERK and PAXO stations.

3.2. Lefkada Island

On central Lefkada Island, data from two GNSS stations (SPAN in the north and PONT in the south) were processed for the period from 2009 to 2021 (Figure S2). Partial data from two other sites, EXAN and DRAN, were available after the strong (Mw6.4) 2015 earthquake (Table 2). For the two stations—SPAN and PONT—which operated prior, during and after the November 2015 event, a linear type of motion was observed for the pre-seismic period. There was no clear evidence of any kinematic changes or any alterations on the pattern of motion, in any of the three components, prior to the earthquake. Baseline changes between the two sites calculated for the pre-seismic period (2009 to 2015) indicated shortening of the distance, with a rate of V = (−2.50 ± 0.03) mm/year. The latter is indicative of the compressional status that occurred along the island during the pre-earthquake period.
The co-seismic displacements at the two sites (SPAN and PONT) were quite significant, mainly in the southern PONT station, which is located in the near vicinity of the epicenter (Appendix B). Static co-seismic displacements, which were smaller but not negligible, were also observed at stations located in Cephalonia (VLSM, KARA and SKAL), in Zakynthos (ZAKY) and in western Greece (AGRI) (Appendix B).
During the post-seismic period, the kinematic status of the area was characterized by a long relaxation process, expressed as a non-linear motion on the stations. This post-seismic kinematic behavior was observed at the two Lefkada stations, but mainly in PONT [90], as well as at sites of northern Cephalonia (FISK, ASSO). The slow relaxation was also evident at the two new sites that were established on the island, EXAN and DRAN (CRL GNSS net). The relaxation period on the PONT station was estimated to last up to August 2016, exhibiting a non-linear type of motion during that period. The estimation was performed with an average moving window of 5–60 days in length. The relaxation process was characterized by a significant southward motional component and a strong uplifted tension, following the significant co-seismic subsidence. For the subsequent period (from 2016 to 2021), the time series of the two stations showed an analogous motion to the pre-seismic period, but with slightly smaller horizontal amplitudes (Figure 8). Similar velocity vectors for the post-seismic period were also estimated for the EXAN and DRAN GNSS sites. Calculation of the baseline changes between SPAN and PONT sites after August 2016 shows that the shortening of the distance between these two sites remains, as was the case for the pre-seismic period, but with a slightly decreased amplitude (−1.81 ± 0.05 mm/year).

3.3. Cephalonia Island

Regarding the island of Cephalonia, most GNSS stations were established after the 2014 intense seismic activity. For the period prior to 2014, data were available only from the VLSM station. The time series of this station (Table 3) showed an ENE linear type of motion with small seasonal fluctuations, mainly in the north component, and a subsiding pattern (Figure 9).
The two strong events of Mw6.1 in late January and Mw5.9 in early February 2014, recorded on the VLSM and KIPO stations, caused measurable static displacement (Appendix B). KIPO station, located on the western part of the Paliki peninsula, closer to the earthquakes’ epicenters, revealed the most significant displacement. VLSM station, to the southeast of the epicentral area, situated on the limestone unit of central Aenos Mountain, exhibited smaller co-seismic motion. The co-seismic displacement vectors in these two GNSS sites indicated a right-lateral activated faulting zone [50]. Nevertheless, these events have not caused any displacement to GNSS stations located at the neighboring islands or in western Greece (Appendix B).
The GNSS velocity vectors for the sites located at Cephalonia Island after the seismic activity of 2014 exhibited a gradual rotation on the horizontal component from ENE in the north to ESE motion to the southern part of the island (SKAL station) (Figure 8). Most stations showed linear type of motion since 2014, with a subsiding vertical component (Table 3). The motional behavior of the VLSM station is, however, also worth noting. The time series of VLSM (Figure 9) show irregular motion, in both the north and vertical components, for the period from February 2014 to September 2016. During that period, the station shows a non-linear ESE horizontal motion and uplifting behavior. The station acquired the pre-seismic ENE and subsiding motional character in the subsequent period (from September 2016 to present). This long-lasting irregular behavior—which may be described as a post-seismic relaxation period and also encompassed the 2015 Lefkada earthquake—has not been observed at any other site in the Ionian Islands. Calculating for the post-seismic period (from 2017 to 2020) the baseline changes between the stations in Cephalonia, extension occurred between the northernmost (FISK) and the southernmost (SKAL) stations (V = 4.66 ± 0.10 mm/year). Meanwhile, in the central part of the island the distance between the ARGO and VLSM stations remained almost stable (V = −0.44 ± 0.04 mm/year), for a similar period (from September 2016 to October 2021).

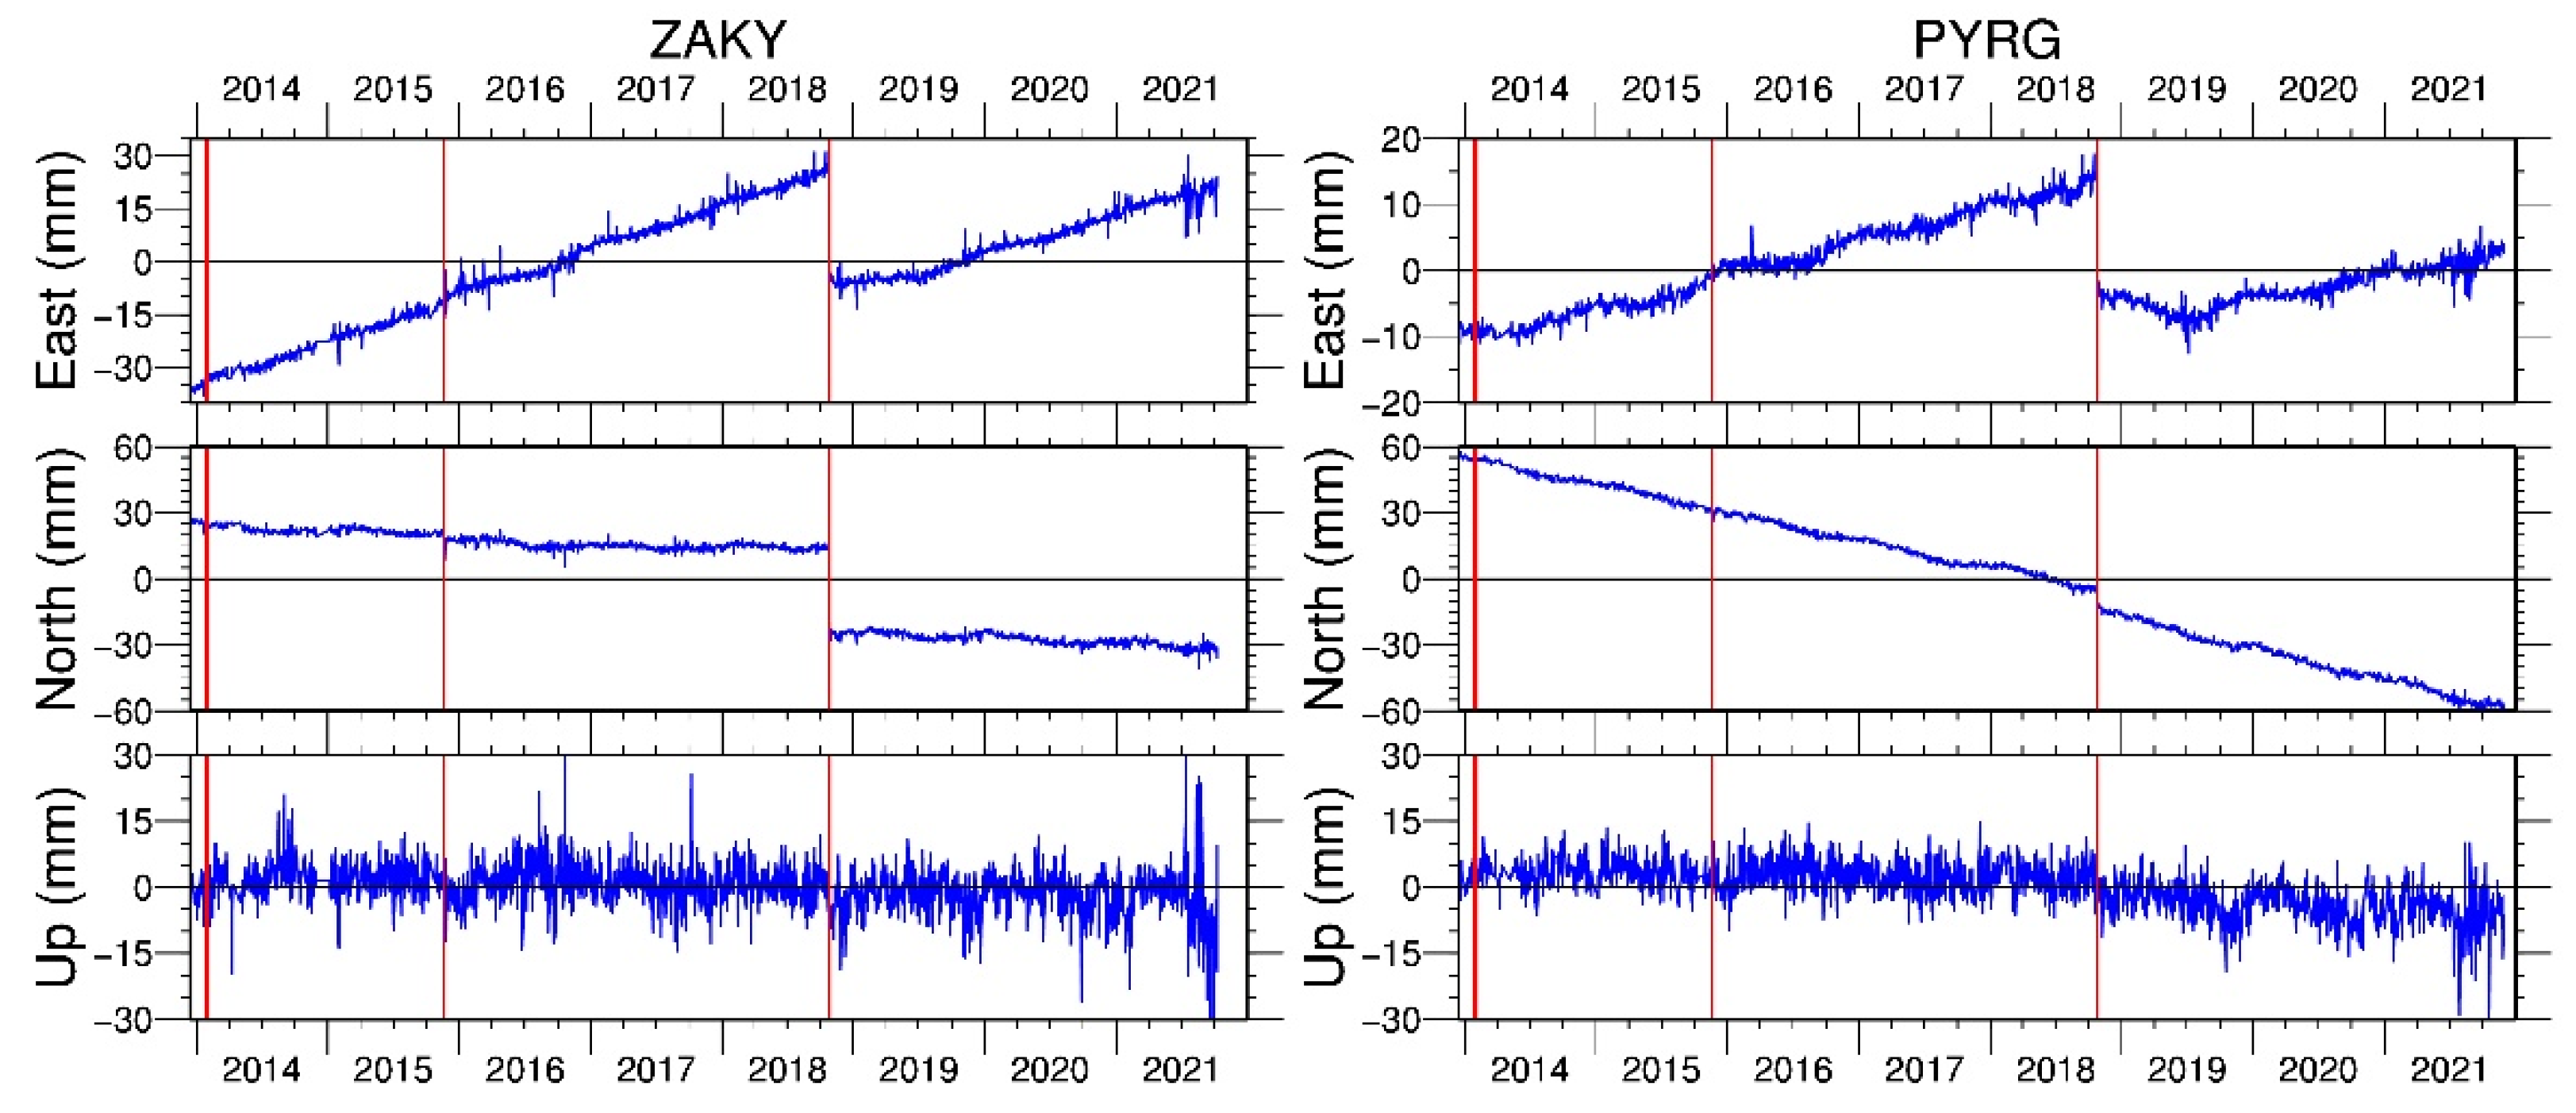
3.4. Zakynthos–Strofades Islands

In the southern part of the Ionian Islands, GNSS data from three stations were processed (Table 4). For the sites of ZAKY and STRF, located in the city of Zakynthos and at the islet of Strofades, respectively, data were available prior to the strong 2018 earthquake (Mw6.7). Both stations exhibited a linear type of ground motion. ZAKY station revealed an ESE horizontal motion, with a negligible subsiding pattern, while STRF station showed an SE motion with lower amplitude (Figure 8). Baseline change calculation between these two sites for the pre-earthquake period showed a lengthening of the distance with an estimated velocity of V = 3.50 ± 0.10 mm/year. ZAKY station’s pre-seismic kinematic behavior indicated shortening relative to the GNSS station PYRG, located in the western Peloponnese (V = −5.12 ± 0.09 mm/year). Likewise, the baseline distance between the STRF and PYRG stations decreased with a similar velocity, V = −4.52 ± 0.08 mm/year. These observations revealed a compressional regime between the Peloponnese and the South Ionian Islands, while extension occurred between Zakynthos and Strofades.
The 2018 earthquake, southwest of Zakynthos, caused strong ground displacement in both Zakynthos and Strofades. Regarding GNSS stations at the island of Cephalonia, significant ground displacement was recorded at the central ARGO and the southern SISS and SKAL stations (Appendix B), but not at the VLSM site. Moreover, static ground displacement was observed at stations located in the western (PYRG) and northwestern (PAT0) Peloponnese, even in the southwestern part of mainland Greece (KTCH).
After the occurrence of the mainshock, a new continuous GNSS station was established in the island (station ZNTE). The two sites that operated in Zakynthos after the Mw6.7 event, together with the PYRG station, revealed an almost eight-month-long post-seismic relaxation period. During this period, the kinematic behavior of ZAKY and PYRG stations showed a significant alteration of motion with respect to the pre-seismic one (Figure 10). A distinctive alteration of the east motional component was observed at PYRG station, where the eastward pre-seismic pattern reversed to a westward post-seismic motion. The post-seismic relaxation period was estimated to last up to early July 2019. During the following period (from July 2019 to the end of 2021), both ZAKY and PYRG stations again presented a pre-seismic motion pattern, with small alterations in the horizontal components (Figure 10). Similarly, the ZNTE station indicated a velocity vector significantly different compared to that of the post-seismic period, with a pattern of motion consistent to that of ZAKY.

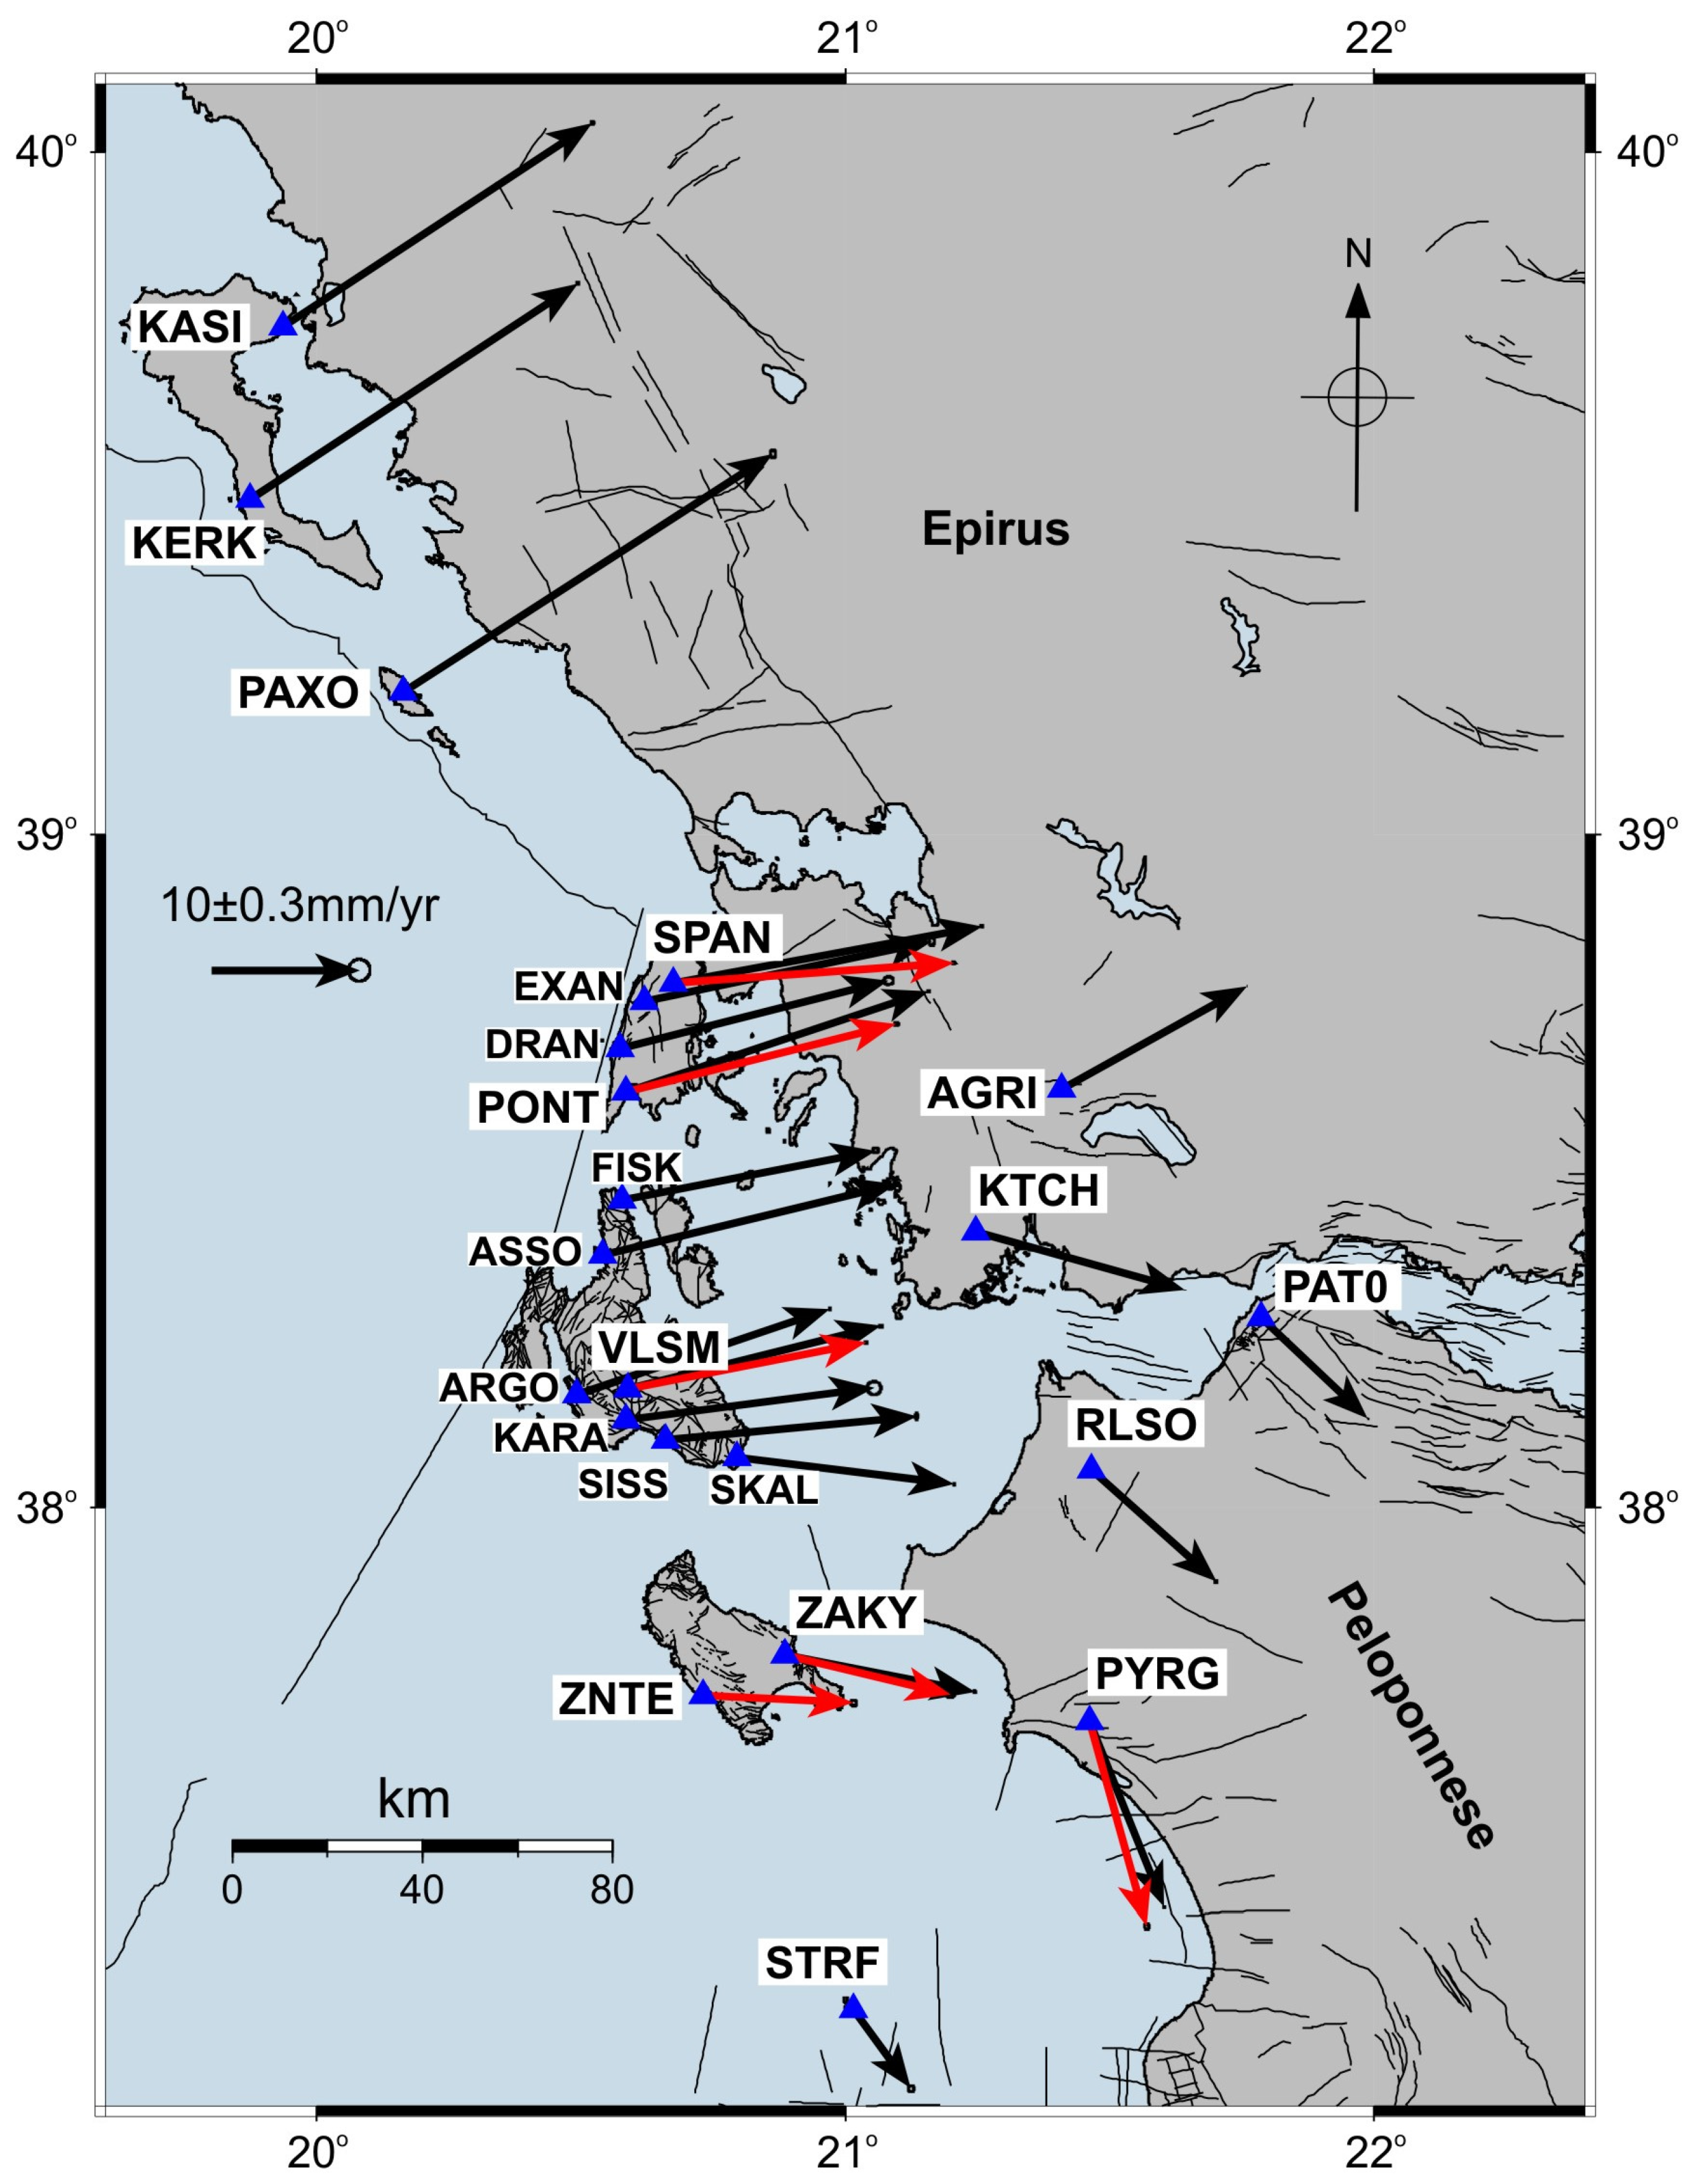
3.5. Neigboring Stations–Overall Image

Together with the continuous GNSS stations in the Ionian Islands, stations located in western mainland Greece (AGRI, KTCH) and western and northwestern Peloponnese (PAT0, RLSO, PYRG) were also processed (Table 5). The goal was to study the velocity field, ground deformation and differential motions in the broad region of the Ionian Sea, focusing on the area close to the highly activated central Ionian Islands.
The deduced velocity field of the area shows the differentiation of the motion between western Greece and the Peloponnese, resulting in the opening of the Patras Gulf with an estimated rate of about 8.0 ± 0.5 mm/year. As previously described, the seismic activity on Cephalonia has not caused any displacement to the broad area, as co-seismic deformation was observed only at local sites. The Lefkada 2015 event affected only the northern AGRI station, located in western Greece. It was only the strong 2018 Zakynthos event that caused noticeable static displacement in both western Greece and the Peloponnese (Appendix B). The most distinct co- and post-seismic deformation was recorded at PYRG station. A small displacement was also observed at KTCH station (Figure S3). The strong events in the Ionian Islands did not appear to affect the velocity field of these stations, which exhibited a linear type of motion throughout the processed period. The only noticeable alterations were observed in the vertical component of PAT0 station (NW Peloponnese) (Figure S3). In this station, the vertical component shows a non-linear motion. Initially, up to the end of 2015, an uplift pattern was observed, which since the beginning of 2016 has reversed to a subsiding motion. A similar pattern also was observed at the neighboring RLSO site.
The overall image of the velocity field in the broad Ionian Islands area shows a gradual rotation of the horizontal velocity vectors (Figure 8). GNSS stations located to the north exhibited a NW horizontal motion, while towards the south, the horizontal vector component shifted to a SW motional direction. The latter has been combined with a decrease in the amplitude of the horizontal velocity from ~26 mm/year in the northern Ionian Islands, to ~13 mm/year in Zakynthos Island and ~7 mm/year in Strofades Islet, respectively. The transition from a northward to southward motion pattern occurs in Cephalonia Island. A similar rotation pattern is also observed at the stations located in western Greece and the NW Peloponnese, with the transition occurring between AGRI and KTCH stations, roughly at the same latitude as Cephalonia.
Analyzing the baseline-length changes for GNSS stations located on different Ionian Islands, as well as between stations in Ionian and western Greece, information about the tectonic status of the area can be extracted (Appendix C). In the northern Ionian Sea, the distance between Corfu and Paxoi has remained almost unchanged (VKERK-PAXO = −0.60 ± 0.11 mm/year). Intense lengthening was calculated between the northern islands (Corfu, Paxoi) and Lefkada (i.e., VPAXO-SPAN = 7.55 ± 0.11 mm/year). The latter indicates an extensional regime between the northern and the central Ionian Islands. Extension with a lower rate is also observed by the baseline changes between the stations located in the central and southern Ionian Islands. Fluctuations in the baseline velocity rates were detected before and after the strong seismic events that occurred in the area during the years 2014–2018. According to the baseline velocity between stations on the islands of Lefkada and Cephalonia, lengthening was taking place during the period before the 2014 seismic events at Cephalonia (i.e., VPONT-VLSM = 2.91 ± 0.04 mm/year). For the period following the 2015 Lefkada earthquake, up to late 2016, the observed intense shortening (VPONT-VLSM = −13.61 ± 0.73 mm/year) could be attributed to the post-seismic process. Re-establishment of the pre- 2014 lengthening character then gradually took place. Negative baseline velocity changes between the central Ionian Islands and stations located in western Greece and the Peloponnese imply compressional forces in this area which were not affected by the intense seismic activity. The latter is supported by the small variations on the velocity values before and after the strong earthquakes (Appendix C).

4. Discussion

Three major tectonic features in the Ionian Islands define the regional kinematic field and control the seismic activity: the convergence of the Apulian Platform and the Hellenic foreland in the north; the long NNE–SSW Cephalonia–Lefkada Transform Fault Zone offshore and west of the respective islands in the central part; and the northwestern tip of the Hellenic Arc in the southern Ionian Sea. These major structures, together with smaller local faults, create a complex tectonic environment generating intense seismic activity and strong ground deformation. In the present study, seismological and geodetic data from the area of the Ionian Islands were combined for the periods before, during and after the occurrence of strong earthquakes in 2014–2018. In the following, the results of the joint analysis are discussed in terms of the overall tectonic status of the study area.

4.1. North Ionian Sea

The northern Corfu and Paxoi Islands located at the Hellenic foreland present the largest amplitude regarding the horizontal velocity vectors (with respect to ITRF), but the recorded seismicity is by far the lowest in the region. The seismicity in this area is located mainly west of Corfu and Paxoi Islands, in mainland Greece and north of Corfu, close to the shores of Albania. The estimated horizontal velocities for the local GNSS stations match with the ones calculated by [68], although the datasets cover slightly different time periods. Considering that the horizontal velocity amplitude of the Apulian Platform is ~31.1 mm/year (VEast = 25.1 mm/year, VNorth = 18.4 mm/year) [68], the Paxoi Island shows a similar horizontal amplitude of ~29.7 mm/year, while Corfu stations have smaller average velocity ~25.8 mm/year. The latter may indicate that, kinematically, Paxoi is controlled by the Apulian motion, as [68] has suggested, although the baseline change between stations KERK and PAXO is estimated to be rather small (about −0.6 ± 0.1 mm/year). The subsiding pattern observed in the southern Corfu and Paxoi stations (KERK, PAXO), though they could be attributed to local geological setting, may also reflect the continental collision that occurs in the area. The absence of significant seismic activity along the NNW–SSE-trending boundary of the Apulian Platform and Hellenic foreland—not just in the limited period of the present study but also during the past (Figure A3 in Appendix A)—indicates a nearly aseismic convergence process, mainly owed to the relatively low motion rate (~5.5 ± 0.7 mm/year; that is, the average converge velocity of the two Corfu stations towards Apulian Platform, similar to the velocity estimated by [89]).

4.2. Central Ionian Sea

The two strong earthquakes in early 2014 on Cephalonia Island triggered a long-lasting aftershock sequence, partially overlapping with that of the 2015 Lefkada mainshock. Prior to the 2014 events, the background seismicity occurred along the regional CLTFZ and onshore at the northern part of the island, likely associated with the local major faulting features. The baseline change between the VLSM station and the southern PONT site in Lefkada indicated that extension occurred between the two islands. The 2014 events occurred on a faulting system adjacent and parallel to the CLTFZ on the Paliki peninsula. Strong co-seismic deformation occurred mainly at the western part of the island, as has been detected from local GPS network measurements [50]. However, ground displacement was observed only on Cephalonia; none of the continuous GNSS stations in the near vicinity of the island, either on Lefkada or western Greece, showed any deformation, proving the local character of the activated seismogenic faulting zone. The post-seismic activity expanded mainly along Paliki, towards the north, but seismic clusters were also observed at the southern part of the activated zone. Seismicity in the area of the Myrtos Gulf indicated activation of structures transverse to the axis of the CLTFZ, oriented with local faults, e.g., the Agia Efimia fault (Figure 1), as the major thrust fault that separates the northern Erissos peninsula from the main island is called. It is important to notice that a similar cluster, on the northern part of Cephalonia, was also formed after the Mw6.3 2003 northern Lefkada earthquake [13,30]. The seismicity rate remained at a high level (above the background level) for the whole period until the occurrence of the November 2015 event on Lefkada. This long post-seismic period is correlated with the ground deformation observed on the GNSS VLSM station, where different pattern of motion was exhibited with respect to the pre-seismic era. Analytically, a southward motion with uplift tension occurred, and increased lengthening of the baseline distance between PONT and VLSM was observed.
The late 2015 Mw6.4 Lefkada earthquake was the second strong event to occur in less than two years in the central Ionian Islands. However, this earthquake occurred on the Lefkada segment of the major CLTFZ or a sub-parallel structure. The regional character of the event reflected on the ground deformation observed in the broad area, extending to Zakynthos Island to the south and to AGRI station in western Greece. The post-seismic activity expanded onshore of Lefkada Island, but also triggered clustered activity on the northern part of Cephalonia, in an area previously activated after the 2003 Lefkada event and, more recently, after the 2014 Cephalonia events. The increased seismicity rate (above the background level) after the strong earthquakes, marks a long relaxation period (up to October 2017), indicative of the activated area (Figure 4 and Figure 5).
The recorded motion at the PONT GNSS site, near the epicentral area, as well as to other neighboring GNSS sites at Lefkada and Cephalonia, confirmed the long relaxation period after the earthquake [90]. Based on the geodetic data, the kinematic field of the area returned to its pre-seismic pattern during August–September 2016, for both Lefkada and Cephalonia. However, the amplitude of the velocity vector at the sites on Cephalonia and Lefkada show small but noticeable differentiation (~15%) with respect to the pre-seismic period from 2009 to 2014.
Regarding the possibility that the 2014 seismic sequence caused or triggered the 2015 earthquake, previous studies [48,91] claimed that the southern Lefkada event was a continuation of the seismic process of the 2003 earthquake in the northern part of CLTFZ. The seismological data in the present study reveal that after the occurrence of the 2014 earthquakes, seismicity propagated northwards, while it has been shown [48] that the 2014 main events caused Coulomb stress changes in the epicentral area of 2015, where the 2003 earthquake also induced stress transfer. The GNSS data, for the inter-seismic period from February 2014 to November 2015, showed motional changes on the VLSM station (southward pattern), while the PONT Lefkada site maintained its kinematic status. The latter resulted in increased velocity (lengthening character) of the baseline change between these two stations, doubled during that period (Appendix C). Assessing the spatiotemporal expansion of the 2014 Cephalonia seismic sequence, together with the geodetic evidence presented in this study, it may be argued that the occurrence of the anticipated event after the 2003 earthquake in southern Lefkada Island may have been accelerated—and even triggered—by the 2014 Cephalonia events. It is likely that the cause of the activity, in both the Cephalonia and Lefkada epicentral areas, was the 2003 event on the major CLTFZ structure [48], expressed as a local-scale activity in Cephalonia, and as a regional one in Lefkada.

4.3. South Ionian Sea

The last strong earthquake (Mw6.7) in the Ionian Sea occurred south of Zakynthos Island, three years after the major event at Lefkada. The source of this earthquake was located on the northwestern end of the active plate boundary between the eastern Mediterranean lithosphere and the Aegean one. Geodetic data from the broad area prior to the earthquake show extensional status between Cephalonia and Zakynthos, as well as between Zakynthos and Strofades. Compression occurred between Zakynthos–Strofades and the Peloponnese, as depicted by the baseline change between the GNSS sites (Appendix C). The earthquake was preceded by a number of intermediate events (~M5.0) in the near vicinity of the epicentral area. Detailed seismological and geodetic work by [58] has suggested slow-slip events in the area, with transient signals on the surface deformation. This earthquake resulted in the longest and most intense seismic sequence of the study period (Figure 6), accompanied by significant ground deformation and motional alterations in the affected area.
The Mw6.7 event caused strong ground deformation on a broad area, extending to Cephalonia Island, to Patras city (NW Peloponnese) and to western mainland Greece (KTCH GNSS station). The extent of the co-seismically deformed area highlights the regional character of this event. The post-seismic activity is concentrated offshore, north and east of the epicenter. It is worth noting the limited activity on the northern onshore part of the island. The latter observation, which may indicate a differentiation between the northern and southern parts of the island, has also been observed on the kinematic field detected by local GPS measurements [41].
Post-seismic evolution of the ground deformation suggests a significantly shorter period until the area returns to the pre-seismic kinematic pattern. This period extended up to July 2019, as revealed by the horizontal component of the three closer sites to the epicenter. The orientation of the seismic clusters on the northern extent of the Zakynthos sequence (group #4; Figure 2c) in a SW–NE-trending direction, coincide with the direction of the 2008 activated zone in NW Peloponnese [21]. This is an area where the geodetic data show a differential motion between the PAT0, RLSO and the PYRG GNSS stations.

4.4. The Broad Ionian Sea Area

The overall image of the seismic activity in the broad area of Ionian Islands is dominated by the three seismic sequences generated after the large-magnitude events (M > 6) in Cephalonia, Lefkada and Zakynthos Islands (Figure 2 and Figure 3). The Lefkada sequence is mainly aligned and concentrated along the north Lefkada segment of the regional CLTFZ structure, expanding offshore and west of the northern part of Cephalonia. The 2014 Cephalonia sequence occurred on a local faulting zone, associated with the Cephalonia segment of the CLTFZ but not comprising part of it. It is distributed spatially on a wider zone, along the western Paliki peninsula, and extends offshore, west of the northern Erissos peninsula. These two sequences appear to be coupled to each other in both time and space and linked with the earlier 2003 Lefkada earthquake. The southern Zakynthos sequence also has regional characteristics and is spatially distributed in a region much larger than anticipated for the magnitude of the mainshock [29]. This is an area affected by the transition of the northwestern end of the Hellenic Arc subduction zone to the CLTFZ major faulting structure.
The geodetic data clearly depicted the kinematic pattern of the broad area, with respect to major tectonic formations and seismic activity (Figure 11). Comparing the regional velocity field on the northern Ionian Islands with the one of the central islands, a clear kinematic boundary emerges between these two areas. The northern islands show a uniform motional pattern, while the velocity field at the central and southern Ionian Sea shows a clockwise rotation around an axis located on Cephalonia Island (calculating the horizontal velocities with respect to VLSM station). Based on the results of this study, a rotation rate of 6.9 ± 2.1 degrees/Myr was estimated. This agrees with previous regional studies [92,93], as well as with local geodetic studies on Cephalonia [13]. Baseline changes between several GNSS sites reveal the extensional regime along the Ionian Islands, which is gradually reduced from north to south, while compression occurs between the central Ionian Islands, and western Greece and the Peloponnese. Extension is also observed between western Greece and the Peloponnese, as well as across the NW Peloponnese. The strain regime alternates the periods after the strong earthquakes, marking the post-seismic relaxation process. The spatial extension of the co-seismic displacements reflects the regional or local character of the activated area. The Lefkada and Zakynthos earthquakes caused static displacement in the broad area, while the Cephalonia events affected only the local GNSS sites.
The temporal and spatial joint analysis of the seismological and geodetic data revealed that the 2014 and 2015 seismic sequences are connected, while the Zakynthos one is part of the tectonic process in the western termination of the Hellenic subduction margin. The expansion of the seismic activity after the 2014 and 2015 events offshore of northern Cephalonia is the spatial link. In this area, previous work [52] identified a seismic gap, indicating that a segment of the CLTFZ has not ruptured yet and may generate a strong event in the future. The present analysis shows that seismicity in this region is clustered in a large number of small segments oriented almost in an E–W direction, transverse to the axis of the CLTFZ. The latter may indicate the transition between the Cephalonia and Lefkada segments of CLTFZ, and the increased seismicity may relieve the accumulated stress. Thus, the occurrence of a strong event in this region seems less likely, but cannot be excluded. Meanwhile, the area between Cephalonia and Zakynthos is characterized by low seismic activity. It is a region whose kinematic status is affected by the CLTFZ in the north and the subduction process in the south. The last major earthquake in the area dates to 1983, with an Mw6.8 earthquake [52] occurring offshore SW of Cephalonia and NW of Zakynthos. It may be argued that this is an area that has the potential to generate another strong event. However, the geodetic data show small changes in the baseline length between the SKAL GNSS site in southern Cephalonia and Zakynthos station, ZAKY (Appendix C), and a similar pattern of motion, in both direction and amplitude. Another area where low seismic activity was observed during the study period is Ithaca Island. Although the general seismic activity in this area is relatively low (e.g., Figure 2b), a few strong earthquakes have occurred in the past (Figure A3). Previous GPS campaign results [54] showed a differential motion between the northern and southern parts of the island, and compression between Cephalonia and Ithaca, compatible with the regional field [93]. The area is considered to have the potential to generate a significant earthquake in the future, taking into account the strong events in its vicinity, but more data are required to assess such a scenario.
The strong earthquakes and large co-seismic ground deformation recorded in the study area clearly exhibit the necessity for seismic hazard analysis in such a seismically active area. As expected, large earthquakes yield violent shaking that coincides well with the expected PGA from the probabilistic analysis. The latter confirms the definition of the SHARE seismic source zones. However, future studies in the area should focus on much smaller scales and identify potential hazards from specific active fault zones in an area as tectonically complex as the broad Ionian Sea. The process of seismogenesis, as described by statistical laws in any PSHA approach, should also be revised according to fault-specific knowledge. Finally, a detailed survey of local site conditions would be crucial in better refining PSHA results and offer greater accuracy of the estimations.

5. Conclusions

Seismological analysis and geodetic results from continuous GNSS stations were combined to study the spatiotemporal evolution of seismic activity and ground deformation in the Ionian Islands during the period from 2014 to 2018, characterized by the occurrence of strong earthquakes in Cephalonia, Lefkada and Zakynthos Islands.
Low seismicity was observed in the north Ionian Sea, where the collision between the Apulian platform and the Hellenic foreland is taking place. The velocity field of the area, deduced by stations on Corfu and Paxoi Islands, shows horizontal NW motion, transverse to the collision front. The vertical component reveals a subsiding pattern, compatible with the convergence process in the area.
The CLTFZ feature offshore of the central Ionian Islands of Cephalonia and Lefkada is the prevailing structure, generating the strong and intense seismic activity observed in the region. The 2014 Mw6.1 and Mw5.9 earthquakes occurred on an adjacent local faulting zone, causing strong ground displacement on the island but not in the broader area. The seismic sequence following these two events expanded in the vicinity of the activated area along the Paliki peninsula, and offshore northwards. Few months later, on 17 November 2015, another strong earthquake (Mw6.4) occurred on or parallel to the Lefkada segment of the CLTFZ. Co-seismic displacement was recorded in almost all the southern Ionian Islands, highlighting the regional character of the seismogenic source. The post-seismic activity expanded along the CLTFZ and southwards in the same area as the 2014 sequence. The temporal evolution of the post-seismic activity and the ground deformation show a long relaxation period. However, the motional pattern obtains its pre-seismic character earlier (August 2016) compared to the respective seismic excitation. The seismic activity reaches its background levels (0.1–0.2 events/day) after a longer period, between late 2016 and mid-2017. The two seismic sequences are linked in space and time, with the 2014 activity likely accelerating the 2015 event.
The October 2018 Mw6.7 Zakynthos earthquake occurred close to the northwestern tip of the Hellenic Arc. Strong ground displacement took place on the near-field GNSS stations, as well as on Cephalonia Island and the Peloponnese. The seismic sequence expanded in the vicinity of the epicentral area, but mainly offshore south and west of Zakynthos. The motion field of the stations in Zakynthos and the western Peloponnese showed significant alterations with respect to the pre-seismic period, on both north and east motional components, which regained its anticipated pattern about eight months after the mainshock. However, the seismicity rate has remained at higher values, compared to the background activity (0.2 events/day), for more than three years.
Probabilistic seismic hazard assessment was performed in the Ionian Islands to estimate PGA and PGV for a return period of 475 years. The smallest values were obtained, as anticipated, for the northern Ionian Islands, corelating with the low seismicity of the area. However, the calculated PGA values in Cephalonia and Ithaca are significantly higher and well exceed the ones proposed by the current Greek Building Code. Based on the herein-performed PSHA analysis, a finer, more detailed zonation of the area and re-evaluation of the PGA values provided by the Building Code must be considered in the future.

Supplementary Materials

The following supporting information can be downloaded at: https://www.mdpi.com/article/10.3390/app12052331/s1, Figure S1: Time series for station KERK on Corfu Island, and PAXO on Paxoi Island; Figure S2: Time series for station SPAN and PONT on the northern and southern part of Lefkada, respectively; Figure S3: Time series for station KTCH in Western Greece and PAT0 on the NW Peloponnese, in the city of Patras.

Author Contributions

Conceptualization, V.S. and G.K.; methodology, V.S., V.K., G.K. and I.S.; software, V.S., V.K. and I.S.; validation, V.S., V.K., G.K. and S.M.; formal analysis, V.S., V.K., G.K. and I.S.; investigation, M.D., J.D.A., D.K.-F., I.K., S.D., E.V. and E.K.; resources, G.T., E.L. and N.V.; data curation, V.S., V.K. and G.K.; writing—original draft preparation, V.S., V.K., G.K., I.S. and S.M.; writing—review and editing, V.K., G.K., I.S., S.M., J.D.A., I.K., S.D., E.V. and E.K.; visualization, V.S., V.K., I.S. and S.M.; supervision, G.K., J.D.A., I.K., E.V., G.T., E.L. and N.V.; project administration, N.V.; funding acquisition, N.V. All authors have read and agreed to the published version of the manuscript.

Funding

This research was funded by the project “Telemachus Innovative Seismic Risk Management Operational System of the Ionian Islands” (MIS 5007986) which is part of the Regional Operational Programme «Ionian Islands 2014 2020» and is co-financed by the European Regional Development Fund (ERDF) (National Strategic Reference Framework NSRF 2014 20).

Informed Consent Statement

Not applicable.

Data Availability Statement

Focal mechanisms presented in Figure 1a are compiled from various sources, including [5,95,96,97,98,99,100,101,102,103,104,105,106]. Seismological data from GI-NOA and SL-NKUA are available at https://bbnet.gein.noa.gr (accessed on 18 January 2022) and http://www.geophysics.geol.uoa.gr/stations/gmapv3_db/ (accessed on 18 January 2022), respectively. GNSS data from NOA-network and for station SISS (NKUA-network) are available at http://geodesy.gein.noa.gr:8000/nginfo/ (accessed on 18 January 2022).

Acknowledgments

The authors would like to thank the personnel of the Hellenic Unified Seismological Network (http://eida.gein.noa.gr/; accessed on 18 January 2022) for the installation and operation of the seismological stations used in the current study. Continuous GNSS data were also provided by METRICA SA (HexagonSmartNet). Some of the figures were made using the Generic Mapping Tools software [107].

Conflicts of Interest

The authors declare no conflict of interest.

Appendix A

Close-up diagrams of the spatiotemporal distribution in the areas of Cephalonia–Lefkada Islands and Zakynthos Island.
Figure A1. Close-up of Figure 3b in the region of Cephalonia–Lefkada between January 2014 and 12 September 2017.
Applsci 12 02331 g0a1
Figure A2. Close-up of Figure 3b in the region of Zakynthos between August 2016 and November 2021.
Applsci 12 02331 g0a2
Figure A3. (Left) Historic seismicity [8,9] and (right) significant earthquakes (Mw ≥ 5.9) during the instrumental era (1900–present) (from [28] and the databases of GI-NOA and SL-NKUA) in the broad region of the Ionian Islands.
Applsci 12 02331 g0a3

Appendix B

The co-seismic displacements on the continuous GNSS stations processed in this study are presented in Table A1. The co-seismic displacement and its error were estimated based on the average value of each coordinate seven days prior to the earthquake and one to seven days after its occurrence, depending on the proximity of each site to the epicentral area. Results are presented only for the stations where the co-seismic displacement was larger than its error, otherwise it is considered that no displacement occurred.
Table A1. Co-seismic displacements on the continuous GNSS stations.
SiteComponentCephalonia Eqs
January–February 2014
Mw6.1 & 5.9
Lefkada Eq
November 2015
Mw6.4
Zakynthos Eq
October 2018
Mw6.6
Lefkada IslandSPANDEast (mm)No
displacement
−76.90 ± 2.47No displacement
DNorth (mm)−56.44 ± 2.62
Dup (mm)−2.83 ± 5.53
PONTDEast (mm)No
displacement
−218.01 ± 1.93No displacement
DNorth (mm)−370.07 ± 2.85
Dup (mm)−55.71 ± 6.24
Cephalonia IslandKIPODEast (mm)1.89 ± 2.42No data
DNorth (mm)73.91 ± 2.42
Dup (mm)55.23 ± 6.19
VLSMDEast (mm)−25.49 ± 2.224.17 ± 1.36No displacement
DNorth (mm)−12.01 ± 2.14−16.61 ± 1.43
Dup (mm)−7.07 ± 5.192.67 ± 5.44
ARGODEast (mm)No data−2.34 ± 0.93
DNorth (mm)0.91 ± 1.91
Dup (mm)−3.77 ± 5.00
KARADEast (mm)No data1.37 ± 1.54No data
DNorth (mm)−12.81 ± 1.57
Dup (mm)−3.14 ± 6.78
SISSDEast (mm)No data−4.22 ± 2.65
DNorth (mm)−2.28 ± 2.44
Dup (mm)0.62 ± 6.88
SKALDEast (mm)No data4.12 ± 1.58−4.55 ± 1.57
DNorth (mm)−9.17 ± 1.62−4.16 ± 2.00
Dup (mm)2.27 ± 7.59−2.91 ± 6.59
Zakynthos–StrofadesZAKYDEast (mm) 2.43 ± 3.49−30.86 ± 1.34
DNorth (mm)No data5.20 ± 2.78−38.68 ± 1.69
Dup (mm) −0.60 ± 3.83−4.12 ± 3.14
STRFDEast (mm)No data22.21 ± 1.05
DNorth (mm)−42.47 ± 0.63
Dup (mm)5.03 ± 2.84
Western Greece–PeloponneseAGRIDEast (mm)No
displacement
−6.70 ± 2.15No displacement
DNorth (mm)0.56 ± 1.80
Dup (mm)3.94 ± 4.75
KTCHDEast (mm)No displacementNo displacement3.70 ± 1.40
DNorth (mm)−5.63 ± 1.48
Dup (mm)1.20 ± 5.63
PAT0DEast (mm)No displacementNo displacement−4.05 ± 1.60
DNorth (mm)−1.43 ± 1.29
Dup (mm)−2.73 ± 5.29
PYRGDEast (mm)No displacementNo displacement−17.24 ± 0.88
DNorth (mm)−7.46 ± 0.95
Dup (mm)−2.04 ± 3.93

Appendix C

The baseline change between two stations was estimated based on the daily coordinates of the selected sites. Baselines were formed only when data were available for both sites and for a period exceeding 24 h. The following Table A2 lists some characteristic formed baselines between the Ionian Islands, as well as between GNSS stations in Ionian Sea and western Greece and the Peloponnese.
Table A2. Baseline velocity between continuous GNSS stations.
BaselinePeriodVelocity (mm/Year)
KASI–SPAN1 January 2013–15 November 20158.00 ± 0.10
18 November 2015–6 May 201711.97 ± 0.22
KERK–PAXO1 November 2019–31 October 2021−0.60 ± 0.11
KERK–SPAN1 March 2017–31 October 20218.26 ± 0.04
PAXO–SPAN1 November 2019–31 October 20217.55 ± 0.11
PONT–VLSM1 January 2009–25 January 20142.91 ± 0.04
8 February 2014–16 November 20156.21 ± 0.18
18 November 2015–4 September 2016−13.61 ± 0.73
5 September 2016–31 October 20211.64 ± 0.05
VLSM–ZAKY8 February 2014–16 November 20152.67 ± 0.16
17 November 2015–4 September 2016−1.05 ± 0.465
5 September 2016–25 October 20180.42 ± 0.10
27 October 2018–31 October 20211.82 ± 0.07
SKAL–ZAKY4 March 2015–16 November 2015−0.72 ± 0.51
18 November 2015–25 October 2018−1.31 ± 0.08
27 October 2018–13 August 20210.32 ± 0.08
ZAKY–STRF6 October 2016–25 October 20183.46 ± 0.09
STRF–PYRG6 October 2016–25 October 2018−4.52 ± 0.07
SPAN–AGRI5 January 2011–16 November 2015−8.65 ± 0.04
18 November 2015–28 April 2018−5.46 ± 0.14
SPAN–KTCH20 November 2013–16 November 2015−0.97 ± 0.15
18 November 2015–31 October 20210.51 ± 0.02
PONT–KTCH23 November 2013–15 November 2015−3.29 ± 0.22
17 November 2015–31 October 20210.28 ± 0.04
VLSM–KTCH22 November 2013–31 October 2021−4.24 ± 0.05
VLSM–PAT027 January 2009–25 January 2014−10.41 ± 0.05
8 February 2014–31 October 2021−10.60 ± 0.03
VLSM–RLSO1 January 2009–25 01 2014−5.32 ± 0.08
8 February 2014–31 October 2021−5.68 ± 0.03
ZAKY–PYRG2 February 2013–25 October 2018−5.12 ± 0.03
27 October 2018–5 July 2019−0.91 ± 0.18
6 July 2019–31 October 2021−4.47 ± 0.09
ZAKY–RLSO8 February 2014–27 February 2017−5.54 ± 0.11
28 02 2019–31 October 2021−4.93 ± 0.11
PAT0–AGRI5 January 2011–12 February 20197.62 ± 0.02
PAT0–KTCH20 November 2013–31 October 2021−5.91 ± 0.02
PAT0–PYRG2 December 2013–25 October 20186.29 ± 0.04
27 October 2018–31 October 20218.66 ± 0.08

References

  1. Anzidei, M.; Baldi, P.; Casula, G.; Crespi, M.; Riguzzi, F. Repeated GPS surveys across the Ionian Sea: Evidence of crustal deformations. Geophys. J. Int. 1996, 127, 257–267. [Google Scholar] [CrossRef] [Green Version]
  2. Hollenstein, C.H.; Geiger, A.; Kahle, H.-G.; Veis, G. CGPS time-series and trajectories of crustal motion along the West Hel-lenic. Arc. Geophys. J. Int. 2006, 164, 182–191. [Google Scholar] [CrossRef] [Green Version]
  3. Hollenstein, C.; Müller, M.; Geiger, A.; Kahle, H.-G. Crustal motion and deformation in Greece from a decade of GPS measurements, 1993–2003. Tectonophys 2008, 449, 17–40. [Google Scholar] [CrossRef]
  4. Underhill, R. Triassic evaporites and Plio-Quaternary diapirism in western Greece. J. Geol. Soc. Lond. 1988, 145, 26–282. [Google Scholar] [CrossRef]
  5. Louvari, E.; Kiratzi, A.A.; Papazachos, B.C. The Cephalonia Transform Fault and its extension to western Lefkada Island (Greece). Tectonophys 1999, 308, 223–236. [Google Scholar] [CrossRef]
  6. Sachpazi, M.; Hirn, A.; Clément, C.; Haslinger, F.; Laigle, M.; Kissling, E.; Charvis, P.; Hello, Y.; Lépine, J.-C.; Sapin, M.; et al. Western Hellenic subduction and Cephalonia Transform: Local earthquakes and plate transport and strain. Tectonophys 2000, 319, 301–319. [Google Scholar] [CrossRef]
  7. Kokinou, E.; Kamberis, E.; Vafidis, A.; Monopolis, D.; Ananiadis, G.; Zelilidis, A. Deep seismic reflection data from offshore western greece: A new crustal model for the ionian sea. J. Pet. Geol. 2005, 28, 185–202. [Google Scholar] [CrossRef]
  8. Stucchi, M.; Rovida, A.; Capera, A.A.G.; Alexandre, P.; Camelbeeck, T.; Demircioglu, M.B.; Gasperini, P.; Kouskouna, V.; Musson, R.M.W.; Radulian, M.; et al. The SHARE European Earthquake Catalogue (SHEEC) 1000–1899. J. Seismol. 2013, 17, 523–544. [Google Scholar] [CrossRef] [Green Version]
  9. Papazachos, B.C.; Papazachou, C.B. The Earthquakes of Greece; Ziti Editions: Thessaloniki, Greece, 2003; 286p. [Google Scholar]
  10. Kapetanidis, V.; Kassaras, I. Contemporary crustal stress of the Greek region deduced from earthquake focal mechanisms. J. Geodyn. 2019, 123, 55–82. [Google Scholar] [CrossRef]
  11. Lekkas, E.L.; Danamos, G.; Mavrikas, G. Geological Structure and Evolution of Kefallonia and Ithaki islands. Bull. Geol. Soc. Greece 2001, 34, 11. [Google Scholar] [CrossRef]
  12. Lekkas, E.L.; Danamos, G.; Lozios, S.G. Neotectonic structure and evolution of Lefkada island. Bull. Geol. Soc. Greece 2001, 34, 157. [Google Scholar] [CrossRef] [Green Version]
  13. Lagios, E.; Sakkas, V.; Papadimitriou, P.; Parcharidis, I.; Damiata, B.N.; Chousianitis, K.; Vassilopoulou, S. Crustal defor-mation in the Central Ionian Islands (Greece): Results from DGPS and DInSAR analyses (1995–2006). Tectonophysics 2007, 444, 119–145. [Google Scholar] [CrossRef]
  14. Lekkas, E.L.; Mavroulis, S.D. Earthquake environmental effects and ESI 2007 seismic intensities of the early 2014 Cephalonia (Ionian Sea, western Greece) earthquakes (January 26 and February 3, Mw 6.0). Nat. Hazards 2015, 78, 1517–1544. [Google Scholar] [CrossRef]
  15. Lekkas, E.; Mavroulis, S.; Carydis, P.; Alexoudi, V. The 17 November 2015 Mw 6.4 Lefkas (Ionian Sea, Western Greece) Earthquake: Impact on Environment and Buildings. Geotech. Geol. Eng. 2018, 36, 2109–2142. [Google Scholar] [CrossRef]
  16. Mavroulis, S.; Stanota, E.-S.; Lekkas, E. Evaluation of environmental seismic intensities of all known historical and recent earthquakes felt in Zakynthos Island, Greece using the Environmental Seismic Intensity (ESI 2007) scale. Quat. Int. 2019, 532, 1–22. [Google Scholar] [CrossRef]
  17. Rondoyanni, T.; Sakellariou, M.; Baskoutas, J.; Christodoulou, N. Evaluation of active faulting and earthquake secondary effects in Lefkada Island, Ionian Sea, Greece: An overview. Nat. Hazards 2012, 61, 843–860. [Google Scholar] [CrossRef]
  18. Ganas, A. NOAFAULTS KMZ layer Version 3.0 (2020 update) (V3.0) [Data set]. Zenodo 2020. [Google Scholar] [CrossRef]
  19. Lekkas, E.; Diakakis, M.; Mavroulis, S.; Kotsi, E. Work Package 1.3: Compilation of Neotectonic Maps. Report, “Telemachus—Innovative Operational Seismic Risk Management System of the Ionian Islands” Project, Priority Axis “Environmental Protection and Sustainable Development” of the Operational Program “Ionian Islands 2014–2020”; National and Kapodistrian University of Athens: Athens, Greece, 2020; p. 150. [Google Scholar]
  20. Makris, J.; Papoulia, J. The backstop between the Mediterranean Ridge and western Peloponnese, Greece: Its crust and tec-tonization. An active seismic experiment with ocean bottom seismographs. Boll. Geofis. Teor. Appl. 2014, 55, 249–279. [Google Scholar]
  21. Ganas, A.; Serpelloni, E.; Drakatos, G.; Kolligri, M.; Adamis, I.; Tsimi, C.; Batsi, E. The Mw 6.4 SW-Achaia (Western Greece) Earthquake of 8 June 2008: Seismological, Field, GPS Observations, and Stress Modeling. J. Earthq. Eng. 2009, 13, 1101–1124. [Google Scholar] [CrossRef]
  22. Karakostas, V.; Mirek, K.; Mesimeri, M.; Papadimitriou, E.; Mirek, J. The Aftershock Sequence of the 2008 Achaia, Greece, Earthquake: Joint Analysis of Seismicity Relocation and Persistent Scatterers Interferometry. Pure Appl. Geophys. 2017, 174, 151–176. [Google Scholar] [CrossRef]
  23. Mavroulis, S.D.; Fountoulis, I.G.; Skourtsos, E.N.; Lekkas, E.L.; Papanikolaou, I.D. Seismic intensity assignments for the 2008 Andravida (NW Peloponnese, Greece) strike-slip event (June 8, Mw = 6.4) based on the application of the Environmental Seismic Intensity scale (ESI 2007) and the European Macroseismic scale (EMS-98). Ann. Geophys. 2014, 56, 0681. [Google Scholar] [CrossRef]
  24. Camera, L.; Mascle, J.; Wardell, N.; Accettella, D. The SEAHELLARC Team. The Peloponnese continental margin from Zak-ynthos Island to Pylos: Morphology and recent sedimentary processes. Boll. Geofis. Teor. Appl. 2014, 55, 325–342. [Google Scholar]
  25. Wardell, N.; Camera, L.; Mascle, J.; Nicolich, R.; Marchi, M.; Barison, E. The structural framework of the Peloponnese conti-nental margin from Zakynthos to Pylos from seismic reflection and morpho-bathymetric data. Boll. Geofis. Teor. Appl. 2014, 55, 343–367. [Google Scholar]
  26. Kokinou, E.; Papadimitriou, E.; Karakostas, V.; Kamberis, E.; Vallianatos, F. The Kefalonia Transform Zone (offshore Western Greece) with special emphasis to its prolongation towards the Ionian Abyssal Plain. Mar. Geophys. Res. 2006, 27, 241–252. [Google Scholar] [CrossRef]
  27. SEAHELLARC Working Group. A new seismogenic model for the Kyparissiakos Gulf and western peloponnese (SW Hellenic Arc). Boll. Geofis. Teor. Appl. 2014, 55, 405–432. [Google Scholar]
  28. Makropoulos, K.; Kaviris, G.; Kouskouna, V. An updated and extended earthquake catalogue for Greece and adjacent areas since 1900. Nat. Hazards Earth Syst. Sci. 2012, 12, 1425–1430. [Google Scholar] [CrossRef] [Green Version]
  29. Papadimitriou, P.; Kapetanidis, V.; Karakonstantis, A.; Spingos, I.; Pavlou, K.; Kaviris, G.; Kassaras, I.; Sakkas, V.; Voulgaris, N. The 25 October 2018 Zakynthos (Greece) earthquake: Seismic activity at the transition between a transform fault and a subduction zone. Geophys. J. Int. 2021, 225, 15–36. [Google Scholar] [CrossRef]
  30. Papadimitriou, P.; Kaviris, G.; Makropoulos, K. The MW=6.3 2003 Lefkada earthquake (Greece) and induced stress transfer changes. Tectonophys 2006, 423, 73–82. [Google Scholar] [CrossRef]
  31. Kassaras, I.; Kalantoni, D.; Benetatos, C.; Kaviris, G.; Michalaki, K.; Sakellariou, N.; Makropoulos, K. Seismic damage sce-narios in Lefkas old town (W. Greece). Bull. Earth. Engin. 2015, 13, 3669–3711. [Google Scholar] [CrossRef]
  32. Papadimitriou, P.; Karakonstantis, A.; Kapetanidis, V.; Bozionelos, G.; Kaviris, G.; Voulgaris, N. The 2015 Lefkada earth-quake sequence (W. Greece). In Proceedings of the 35th General Assembly of the European Seismological Commission, Trieste, Italy, 4–10 September 2016; p. ESC2016-139. [Google Scholar]
  33. Margaris, B.; Papaioannou, C.; Theodulidis, N.; Savvaidis, A.; Anastasiadis, A.; Klimis, N.; Makra, K.; Demosthenous, M.; Karakostas, C.; Lekidis, V.; et al. Preliminary Observations on the 14 August 2003 Lefkada Island (Western Greece) Earth-Quake. EERI Special Earthquake Report; Joint Report by Institute of Engineering Seismology and Earthquake Engineering, National Technical University of Athens and University of Athens; EERI: Oakland, CA, USA, 2003; pp. 1–12. [Google Scholar]
  34. Mavroulis, S.; Lekkas, E. Revisiting the Most Destructive Earthquake Sequence in the Recent History of Greece: Environmental Effects Induced by the 9, 11 and 12 August 1953 Ionian Sea Earthquakes. Appl. Sci. 2021, 11, 8429. [Google Scholar] [CrossRef]
  35. Lekkas, E.; Danamos, G.; Antoniou, V.; Bosinakou, G.; Vassilakis, E. Neotectonic Map of Greece, Kerkyra Island sheet 1:100,000 scale (in Greek); Applied Research Project, National and Kapodistrian University of Athens: Athens, Greece, 1995. [Google Scholar]
  36. Caputo, R. The Neogenic dextral trascurrent system of Corfu (Central Mediterranean). Ann. Geol. Pays Hell. 1988, 33, 327–335. [Google Scholar]
  37. Guidoboni, E.; Ferrari, G.; Mariotti, D.; Comastri, A.; Tarabusi, G.; Valensise, G. CFTI4Med, Catalogue of Strong Earthquakes in Italy (461 B.C.-1997) and Mediterranean Area (760 B.C.-1500). INGV-SGA. 2007. Available online: https://www.researchgate.net/publication/271078106_CFTI4Med_Catalogue_of_strong_earthquakes_in_Italy_461_BC-1997_and_Mediterranean_area_760_BC-1500 (accessed on 17 January 2022).
  38. Galli, P.; Naso, G. The “taranta” effect of the 1743 earthquake in Salento (Apulia, southern Italy). Boll. Geofis. Teor. Appl. 2008, 49, 177–204. [Google Scholar]
  39. Nappi, R.; Gaudiosi, G.; Alessio, G.; De Lucia, M.; Porfido, S. The environmental effects of the 1743 Salento earthquake (Apulia, southern Italy): A contribution to seismic hazard assessment of the Salento Peninsula. Nat. Hazards 2017, 86, 295–324. [Google Scholar] [CrossRef] [Green Version]
  40. Lagios, E.; Papadimitriou, P.; Novali, F.; Sakkas, V.; Fumagalli, A.; Vlachou, K.; Del Conte, S. Combined Seismicity Pattern Analysis, DGPS and PSInSAR studies in the broader area of Cephalonia (Greece). Tectonophys 2012, 524-525, 43–58. [Google Scholar] [CrossRef]
  41. Sakkas, V.; Novali, F.; Lagios, E.; Vassilopoulou, S.; Damiata, B.N.; Fumagalli, A. Ground deformation of Zakynthos Island (Western Greece) observed by PSI and DGPS. In Proceedings of the 2014 IEEE Geoscience and Remote Sensing Symposium, Quebec City, QC, Canada, 13–18 July 2014; pp. 4792–4795. [Google Scholar]
  42. Ganas, A.; Drakatos, G.; Rontogianni, S.; Tsimi, C.; Petrou, P.; Papanikolaou, M.; Argyrakis, P.; Boukouras, K.; Melis, N.; Stavrakakis, G. NOANET: The new permanent GPS network for Geodynamics in Greece. Geophys. Res. Abs. 2008, 10, EGU2008-A-04380. [Google Scholar]
  43. Chousianitis, K.; Papanikolaou, X.; Drakatos, G.; Tselentis, G.-A. NOANET: A Continuously Operating GNSS Network for Solid-Earth Sciences in Greece. Seism. Res. Lett. 2021, 92, 2050–2064. [Google Scholar] [CrossRef]
  44. Karakostas, V.; Papadimitriou, E.; Mesimeri, M.; Gkarlaouni, C.; Paradisopoulou, P. The 2014 Kefalonia Doublet (MW6.1 and MW6.0), Central Ionian Islands, Greece: Seismotectonic Implications along the Kefalonia Transform Fault Zone. Acta Geophys. 2015, 63, 1–16. [Google Scholar] [CrossRef] [Green Version]
  45. Karastathis, V.K.; Mouzakiotis, E.; Ganas, A.; Papadopoulos, G.A. High-precision relocation of seismic sequences above a dipping Moho: The case of the January–February 2014 seismic sequence on Cephalonia island (Greece). Solid Earth 2015, 6, 173–184. [Google Scholar] [CrossRef] [Green Version]
  46. Papadopoulos, G.; Karastathis, V.K.; Koukouvelas, I.; Sachpazi, M.; Baskoutas, I.; Chouliaras, G.; Agalos, A.; Daskalaki, E.; Minadakis, G.; Moshou, A.; et al. The Cephalonia, Ionian Sea (Greece), sequence of strong earthquakes of January–February 2014: A first report. Res. Geophys. 2014, 4. [Google Scholar] [CrossRef] [Green Version]
  47. Sokos, E.; Kiratzi, A.; Gallovič, F.; Zahradnik, J.; Serpetsidaki, A.; Plicka, V.; Janský, J.; Kostelecký, J.; Tselentis, A. Rupture process of the 2014 Cephalonia, Greece, earthquake doublet (Mw6) as inferred from regional and local seismic data. Tectonophysics 2015, 656, 131–141. [Google Scholar] [CrossRef]
  48. Papadimitriou, E.; Karakostas, V.; Mesimeri, M.; Chouliaras, G.; Kourouklas, C. The Mw6.5 17 November 2015 Lefkada (Greece) Earthquake: Structural Interpretation by Means of the Aftershock Analysis. Pure Appl. Geophys. 2017, 174, 3869–3888. [Google Scholar] [CrossRef]
  49. Sokos, E.; Gallovič, F.; Evangelidis, C.P.; Serpetsidaki, A.; Plicka, V.; Kostelecký, J.; Zahradník, J. The 2018 Mw 6.8 Zakynthos, Greece, earthquake: Dominant strike-slip faulting near subducting slab. Seismol. Res. Lett. 2020, 91, 721–732. [Google Scholar] [CrossRef]
  50. Sakkas, V.; Lagios, E. Fault modelling of the early-2014 ~M6 Earthquakes in Cephalonia Island (W. Greece) based on GPS measurements. Tectonophys 2015, 644-645, 184–196. [Google Scholar] [CrossRef]
  51. Chousianitis, K.; Konca, A.O.; Tselentis, G.-A.; Papadopoulos, G.A.; Gianniou, M. Slip model of the 17 November 2015 Mw = 6.5 Lefkada earthquake from the joint inversion of geodetic and seismic data. Geophys. Res. Lett. 2016, 43, 7973–7981. [Google Scholar] [CrossRef] [Green Version]
  52. Ganas, A.; Elias, P.; Bozionelos, G.; Papathanassiou, G.; Avallone, A.; Papastergios, A.; Valkaniotis, S.; Parcharidis, I.; Briole, P. Coseismic deformation, field observations and seismic fault of the 17 November 2015 M = 6.5, Lefkada Island, Greece earthquake. Tectonophys 2016, 687, 210–222. [Google Scholar] [CrossRef]
  53. Boncori, J.P.M.; Papoutsis, I.; Pezzo, G.; Tolomei, C.; Atzori, S.; Ganas, A.; Karastathis, V.; Salvi, S.; Kontoes, C.; Antonioli, A. The February 2014 Cephalonia Earthquake (Greece): 3D Deformation Field and Source Modeling from Multiple SAR Techniques. Seism. Res. Lett. 2015, 86, 124–137. [Google Scholar] [CrossRef] [Green Version]
  54. Sakkas, V.; Lagios, E. Ground deformation effects from the ~M6 earthquakes (2014–2015) on Cephalonia–Ithaca Islands (Western Greece) deduced by GPS observations. Acta Geophys. 2017, 65, 207–222. [Google Scholar] [CrossRef]
  55. Saltogianni, V.; Taymaz, T.; Yolsal-Çevikbilen, S.; Eken, T.; Moschas, F.; Stiros, S. Fault model for the 2015 Leucas (Aegean arc) earthquake: Analysis based on seismological and geodetic observations. Bull. Seismol. Soc. Am. 2017, 107, 433–444. [Google Scholar] [CrossRef]
  56. Saltogianni, V.; Moschas, F.; Stiros, S. The 2014 Cephalonia Earthquakes: Finite Fault Modeling, Fault Segmentation, Shear and Thrusting at the NW Aegean Arc (Greece). Pure Appl. Geophys. 2018, 175, 4145–4164. [Google Scholar] [CrossRef]
  57. Ganas, A.; Briole, P.; Bozionelos, G.; Barberopoulou, A.; Elias, P.; Tsironi, V.; Valkaniotis, S.; Moshou, A.; Mintourakis, L. The 25 October 2018 Mw=6.7 Zakynthos earthquake (Ionian Sea, Greece): A low-angle fault model based on GNSS data, relocated seismicity, small tsunami and im-plications for the seismic hazard in the west Hellenic Arc. J. Geodyn. 2020, 137, 101731. [Google Scholar]
  58. Mouslopoulou, V.; Bocchini, G.M.; Cesca, S.; Saltogianni, V.; Bedford, J.; Petersen, G.; Gianniou, M.; Oncken, O. Earthquake swarms, slow slip and fault interactions at the western-end of the Hellenic subduction system precede the moment Mw 6.9 Zakynthos earthquake, Greece. Geochem. Geophys. Geosystems 2020, 21, e2020GC009243. [Google Scholar] [CrossRef]
  59. Chousianitis, K.; Konca, A.O. Intraslab Deformation and Rupture of the Entire Subducting Crust During the 25 October 2018 Mw 6.8 Zakynthos Earthquake. Geophys. Res. Lett. 2019, 46, 14358–14367. [Google Scholar] [CrossRef]
  60. Valkaniotis, S.; Ganas, A.; Papathanassiou, G.; Papanikolaou, M. Field observations of geological effects triggered by the January–February 2014 Cephalonia (Ionian Sea, Greece) earthquakes. Tectonophysics 2014, 630, 150–157. [Google Scholar] [CrossRef]
  61. Kouskouna, V.; Makropoulos, K. Historical earthquake investigations in Greece. Ann. Geophys. 2004, 47, 723–731. [Google Scholar] [CrossRef] [Green Version]
  62. EAK. Greek Seismic Code edited by: Earthquake Planning & Protection Organization. Athens Greece 2003, 72, 7. (In Greek) [Google Scholar]
  63. Evangelidis, C.P.; Triantafyllis, N.; Samios, M.; Boukouras, K.; Kontakos, K.; Ktenidou, O.-J.; Fountoulakis, I.; Kalogeras, I.; Melis, N.S.; Galanis, O.; et al. Seismic Waveform Data from Greece and Cyprus: Integration, Archival, and Open Access. Seism. Res. Lett. 2021, 92, 1672–1684. [Google Scholar] [CrossRef]
  64. Papadimitriou, P.; Voulgaris, N.; Kouskouna, V.; Kassaras, I.; Kaviris, G.; Pavlou, K.; Karakonstantis, A.; Bozionelos, G.; Kapetanidis, V. The Kefallinia Island earthquake sequence January–February 2014. In Proceedings of the Second European Conference on Earthquake Engineering and Seismology (2ECEES), Istanbul, Turkey, 24–29 August 2014. [Google Scholar]
  65. Kapetanidis, V. Spatiotemporal Patterns of Microseismicity for the Identification of Active Fault Structures Using Seismic Waveform Cross-Correlation and Double-Difference Relocation. Ph.D. Thesis, Department of Geophysics-Geothermics, Faculty of Geology and Geoenvironment, University of Athens, Athens, Greece, 2017. [Google Scholar]
  66. Papadimitriou, P.; Kapetanidis, V.; Karakonstantis, A.; Spingos, I.; Pavlou, K.; Kaviris, G.; Kassaras, I.; Voulgaris, N. The 25th October, 2018 Zakynthos Earthquake. Bull. Geol. Soc. Greece 2019, 7, 259–260. [Google Scholar]
  67. Bonatis, P.; Akinci, A.; Karakostas, V.; Papadimitriou, E.; Kaviris, G. Near-fault Broadband Ground Motion Simulation Ap-plications at the Central Ionian Islands, Greece. Pure Appl. Geophys. 2021, 178, 3505–3527. [Google Scholar] [CrossRef]
  68. Valkaniotis, S.; Briole, P.; Ganas, A.; Elias, P.; Kapetanidis, V.; Tsironi, V.; Fokaefs, A.; Partheniou, H.; Paschos, P. The Mw = 5.6 Kanallaki Earthquake of 21 March 2020 in West Epirus, Greece: Reverse Fault Model from InSAR Data and Seismotec-tonic Implications for Apulia-Eurasia Collision. Geosciences 2020, 10, 454. [Google Scholar] [CrossRef]
  69. Lekkas, E.; Mavroulis, S.; Carydis, P.; Skourtsos, E.; Kaviris, G.; Paschos, P.; Ganas, A.; Kazantzidou-Firtinidou, D.; Par-charidis, I.; Gatsios, T.; et al. The March 21, 2020, Mw 5.7 Epirus (Greece) Earthquake. Newsletter of the Postgraduate Studies Program “Environmental Disasters & Crises Management Strategies” of the National and Kapodistrian University of Athens. Issue No. 17. 2020. Available online: https://www.researchgate.net/publication/346039612_The_March_21_2020_Mw_57_Epirus_Greece_Earthquake (accessed on 17 January 2022).
  70. Waldhauser, F. hypoDD—A Program to Compute Double-Difference Hypocenter Locations. U. S. Geol. Surv. Open File Rep. 2001, 113. [Google Scholar] [CrossRef]
  71. Makropoulos, K.; Diagourtas, D.; Kassaras, J.; Kouskouna, V.; Papadimitriou, P.; Ziazia, M. The November–December 1994 Lefkas (W. Greece) earthquake sequence: Results from in situ seismological survey. In Proceedings of the XXV General Assembly of ESC, Reykavik, Iceland, 1996; p. 108, Book of abstracts. [Google Scholar]
  72. Karakostas, V.; Kostoglou, A.; Chorozoglou, D.; Papadimitriou, E. Relocation of the 2018 Zakynthos, Greece, aftershock sequence: Spatiotemporal analysis deciphering mechanism diversity and aftershock statistics. Acta Geophys. 2020, 68, 1263–1294. [Google Scholar] [CrossRef]
  73. Kassaras, I.; Papadimitriou, P.; Kapetanidis, V.; Voulgaris, N. Seismic site characterization at the western Cephalonia Island in the aftermath of the 2014 earthquake series. Int. J. Geo-Eng. 2017, 8, 1251. [Google Scholar] [CrossRef]
  74. Papathanassiou, G.; Pavlides, S.; Ganas, A. The 2003 Lefkada earthquake: Field observations and preliminary microzonation map based on liquefaction potential index for the town of Lefkada. Eng. Geol. 2005, 82, 12–31. [Google Scholar] [CrossRef]
  75. Cirella, A.; Romano, F.; Avallone, A.; Piatanesi, A.; Briole, P.; Ganas, A.; Theodoulidis, N.; Chousianitis, K.; Volpe, M.; Bozionellos, G.; et al. The 2018 Mw 6.8 Zakynthos (Ionian Sea, Greece) earthquake: Seismic source and local tsunami characterization. Geophys. J. Int. 2020, 221, 1043–1054. [Google Scholar] [CrossRef]
  76. Giardini, D.; Wössner, J.; Danciu, L. Mapping Europe’s Seismic Hazard. Eos 2014, 95, 261–262. [Google Scholar] [CrossRef] [Green Version]
  77. Woessner, J.; Laurentiu, D.; Giardini, D.; Crowley, H.; Cotton, F.; Grünthal, G.; Valensise, G.; Arvidsson, R.; Basili, R.; Demircioglu, M.B.; et al. The 2013 European Seismic Hazard Model: Key components and results. Bull. Earthq. Eng. 2015, 13, 3553–3596. [Google Scholar] [CrossRef] [Green Version]
  78. Weichert, D. Estimation of the Earthquake Recurrence Parameters for Unequal Observation Periods for Different Magnitudes. Bull. Seismol. Soc. Am. 1980, 70, 1337–1340. [Google Scholar] [CrossRef]
  79. Danciu, L.; Tselentis, G.-A. Engineering Ground-Motion Parameters Attenuation Relationships for Greece. Bull. Seism. Soc. Am. 2007, 97, 162–183. [Google Scholar] [CrossRef]
  80. Tselentis, G.-A.; Danciu, L. Probabilistic seismic hazard assessment in Greece-Part 1: Engineering ground motion parameters. Hazards Earth Syst. Sci. 2010, 10, 25–39. [Google Scholar] [CrossRef]
  81. Pavlou, K.; Κaviris, G.; Kouskouna, V.; Sakkas, G.; Zymvragakis, A.; Sakkas, V.; Drakatos, G. Minor seismic hazard changes in the broader area of Pournari artificial lake after the first filling (W. Greece). Results Geophys. Sci. 2021, 7, 100025. [Google Scholar] [CrossRef]
  82. Κaviris, G.; Zymvragakis, A.; Bonatis, P.; Sakkas, G.; Kouskouna, V.; Voulgaris, N. Probabilistic Seismic Hazard Assessment for the Broader Messinia (SW Greece) Region. Pure Appl. Geophys. 2022, 1–17. [Google Scholar] [CrossRef]
  83. Ordaz, M.; Salgado-Gálvez, M.A.; Giraldo, S. R-CRISIS: 35 years of continuous developments and improvements for proba-bilistic seismic hazard analysis. Bull. Earthq. Eng. 2021, 19, 2797–2816. [Google Scholar] [CrossRef]
  84. Burton, P.W.; Xu, Y.; Tselentis, G.A.; Sokos, E.; Aspinall, W. Strong ground acceleration seismic hazard in Greece and neigh-boring regions. Soil Dyn. Earthq. Eng. 2003, 23, 159–181. [Google Scholar] [CrossRef]
  85. HexagonSmartNet METRICA S.A. Available online: https://hxgnsmartnet.com (accessed on 17 January 2022).
  86. Corinth Rift Laboratory (CRL) GNSS network. Available online: https://nfo.crlab.eu/gnss (accessed on 17 January 2022).
  87. EUREF Permanent GNSS Network—ETRF/ITRF Transformation. Available online: http://www.epncb.oma.be (accessed on 24 April 2020).
  88. Dach, R.; Lutz, S.; Walser, P.; Fridez, P. Bernese GNSS Software Version 5.2; User manual; Astronomical Institute, University of Bern, Bern Open Publishing: Bern, Switzerland, 2015. [Google Scholar]
  89. Briole, P.; Ganas, A.; Elias, P.; Dimitrov, D. The GPS velocity field of the Aegean. New observations, contribution of the earthquakes, crustal blocks model. Geophys. J. Int. 2021, 226, 468–492. [Google Scholar] [CrossRef]
  90. Vallianatos, F.; Sakkas, V. Multiscale Post-Seismic Deformation Based on cGNSS Time Series Following the 2015 Lefkas (W. Greece) Mw6.5 Earthquake. Appl. Sci. 2021, 11, 4817. [Google Scholar] [CrossRef]
  91. Sokos, E.; Zahradník, J.; Gallovič, F.; Serpetsidaki, A.; Plicka, V.; Kiratzi, A. Asperity break after 12 years: The Mw6.4 2015 Lefkada (Greece) earthquake. Geophys. Res. Lett. 2016, 43, 6137–6145. [Google Scholar] [CrossRef] [Green Version]
  92. Chousianitis, K.; Ganas, A.; Evangelidis, C.P. Strain and rotation rate patterns of mainland Greece from continuous GPS data and comparison between seismic and geodetic moment release. J. Geophys. Res. Solid Earth 2015, 120, 3909–3931. [Google Scholar] [CrossRef]
  93. D’Agostino, N.; Métois, M.; Koci, R.; Duni, L.; Kuka, N.; Ganas, A.; Georgiev, I.; Jouanne, F.; Kaludjerovic, N.; Kandić, R. Active crustal deformation and rotations in the southwestern Balkans from continuous GPS measurements. Earth Planet. Sci. Lett. 2020, 539, 116246. [Google Scholar] [CrossRef]
  94. Pérouse, E.; Sébrier, M.; Braucher, R.; Chamot-Rooke, N.; Bourlès, D.; Briole, P.; Sorel, D.; Dimitrov, D.; Arsenikos, S. Transition from collision to subduction in Western Greece: The Katouna–Stamna active fault system and regional kinematics. Geol. Rundsch. 2017, 106, 967–989. [Google Scholar] [CrossRef] [Green Version]
  95. Baker, C.; Hatzfeld, D.L.; Lyon-Caen, H.; Papadimitriou, E.; Rigo, A. Earthquake mechanisms of the Adriatic Sea and Western Greece: Implications for the oceanic subduction-continental collision transition. Geophys. J. Int. 1997, 131, 559–594. [Google Scholar] [CrossRef] [Green Version]
  96. Constantinescu, L.; Ruprechtová, L.; Enescu, D. Mediterranean-Alpine Earthquake Mechanisms and their Seismotectonic Implications. Geophys. J. Int. 1966, 10, 347–368. [Google Scholar] [CrossRef] [Green Version]
  97. Drakopoulos, J.; Delibasis, N. The Focal Mechanisms of Earthquakes in the Major Area of Greece for the Period 1947–1981. Seismol. Lab. Univ. Athens Publ. Athens Greece 1982, 2, 1–72. [Google Scholar]
  98. Jackson, J.; Haines, J.; Holt, W. The horizontal velocity field in the deforming Aegean Sea region determined from the moment tensors of earthquakes. J. Geophys. Res. 1992, 97, 17657. [Google Scholar] [CrossRef]
  99. Kiratzi, A.; Louvari, E. Focal mechanisms of shallow earthquakes in the Aegean Sea and the surrounding lands determined by waveform modelling: A new database. J. Geodyn. 2003, 36, 251–274. [Google Scholar] [CrossRef]
  100. Main, I.G.; Burton, P.W. Moment—magnitude scaling in the Aegean area. Tectonophysics 1990, 179, 273–285. [Google Scholar] [CrossRef]
  101. Papadimitriou, E. Focal mechanism along the convex side of the Hellenic arc. Boll. De Geofis. Teor. Ed Appl. 1993, XXXV, 401–426. [Google Scholar]
  102. Papadopoulos, G.; Kondopoulou, D.; Leventakis, G.-A.; Pavlides, S. Seismotectonics of the Aegean region. Tectonophys 1986, 124, 67–84. [Google Scholar] [CrossRef]
  103. Papazachos, B.; Delibasis, N. Tectonic stress field and seismic faulting in the area of Greece. Tectonophys 1969, 7, 231–255. [Google Scholar] [CrossRef]
  104. Papazachos, B.; Kiratzi, A.; Papadimitriou, E. Regional focal mechanisms for earthquakes in the Aegean area. Pure Appl. Geophys. 1991, 136, 405–420. [Google Scholar] [CrossRef]
  105. Ritsema, A. The earthquake mechanics of the Balkan region. R. Netherl. Meteorol. Inst. De Bilt. Sci. Rep. 1974, 4–74. [Google Scholar]
  106. Wickens, A.J.; Hodgson, J.H. Computer Re-Evalutation of Earthquake Mechanism Solutions; Departement of Energy, Mines and Resources: Ottawa, ON, Canada, 1967. [Google Scholar]
  107. Wessel, P.; Smith, W.H.F.; Scharroo, R.; Luis, J.; Wobbe, F. Generic Mapping Tools: Improved Version Released. EOS Trans. Am. Geophys. Union 2013, 94, 409–410. [Google Scholar] [CrossRef] [Green Version]
Figure 1. Seismotectonic background of the Ionian Islands region. Focal mechanisms of stronger events (M ≥ 5.5) are presented (see Data Availability Statement for references). Historic seismicity is presented by gray squares (SHEEC database, [8,9]) Principal stress axes S1 (blue) and S3 (red) after [10]. Fault lines after [11,12,13,14,15,16,17,18,19]. CLTFZ: Cephalonia–Lefkada Transform Fault Zone, WAFZ: Western Achaia Fault Zone.
Applsci 12 02331 g001
Figure 2. (a) Seismicity in the region of the Ionian Islands during the period February 2011–November 2021 from the databases of GI-NOA and SL-NKUA, including relocated catalogues for the three main aftershock sequences [29,32,64,65]. Colors and numbers correspond to different spatial groups. The north–south-oriented profile A–B is used for the spatiotemporal projection of Figure 3b. (b) Close-up of the seismicity in the region of Cephalonia–Ithaca–Lefkada Islands. (c) Close-up of the seismicity in the region of Zakynthos Island.
Applsci 12 02331 g002
Figure 3. (a) Cumulative number of events per spatial group of Figure 2 (different colors), for events with MMc = 2.0. The larger events (M ≥ 4.0) are marked by circles. (b) Spatiotemporal projection along the north–south-oriented profile A–B of Figure 2a, for events within a range of ±50 km from the profile and MMc = 2.0. Symbol size is proportional to magnitude. Events with M ≥ 5.0 are marked with stars. Close-ups for the periods January 2014 to September 2017 and August 2016 to November 2021 are presented in Figure A1 and Figure A2 of Appendix A, respectively.
Applsci 12 02331 g003
Figure 4. Temporal evolution of the seismic sequence on Cephalonia Island (group #1), for events with MMc = 2.0. The upper panel shows the cumulative number of events, with the occurrence of M ≥ 4.0 events depicted by stars, while the lower panel describes the seismicity rate on a semi-logarithmic scale, measured for sliding windows of various lengths (5 days to 100 days).
Applsci 12 02331 g004
Figure 5. Temporal evolution of the seismic sequence on Lefkada Island (spatial group #3) for events with M ≥ 2.3. Panels are similar to Figure 4.
Applsci 12 02331 g005
Figure 6. Same as Figure 4, but for the temporal evolution of seismicity south of Zakynthos Island (group #4), for events with M ≥ 2.5.
Applsci 12 02331 g006
Figure 7. Maps showcasing the spatial distribution of PGA (a) and PGV (b) for a return period of 475 years. Major cities in the Ionian complex are marked by gray boxes.
Applsci 12 02331 g007
Figure 8. Horizontal velocity vectors (black arrows) for the continuous GNSS sites (blue triangles) of the broad Ionian Islands area. Red arrows indicate the horizontal velocity component estimated for the period after the strong (M > 6) earthquakes in the area (ITRF 2014).
Applsci 12 02331 g008
Figure 9. Time Series of VLSM Cephalonia GNSS station. Red lines mark the dates of the strong earthquakes in the Ionian Islands.
Applsci 12 02331 g009
Figure 10. Time series for the two GNSS stations in Zakynthos (ZAKY) and the western Peloponnese (PYRG). Red lines are the same as Figure 9.
Applsci 12 02331 g010
Figure 11. Overview of the Ionian Islands area showing the main tectonic structures together with seismic activity (M > 4) (black circles), and strong (M > 6) events (yellow stars). Black arrows show the relative Eurasia–Africa motion in the SW [94], and the motion of the Hellenic foreland with respect to the Apulian Platform (estimated herein) in the north. The extensional (red arrows) and compressional (blue arrows) pattern calculated based on baseline changes between GNSS stations (green triangles) is qualitatively presented.
Applsci 12 02331 g011
Table 1. Velocity components for the GNSS stations on Corfu and Paxoi Islands (ITRF 2014).
SiteLatitude
(o)
Longitude (o)PeriodVEast
(mm/Year)
VNorth
(mm/Year)
VUp
(mm/Year)
KASI39.746419.93551 January 2013–6 May 201720.91 ± 0.0413.75 ± 0.040.39 ± 0.09
4.35 years
KERK39.493719.87341 March 2017–31 October 202122.15 ± 00.314.57 ± 0.03−2.07 ± 0.11
4.67 years
PAXO39.210820.16391 November 2019–31 October 202124.96 ± 0.0716.08 ± 0.11−3.1 ± 0.30
2.00 years
Table 2. Velocity components for the Lefkada GNSS stations (ITRF 2014).
SiteLatitude
(o)
Longitude (o)PeriodVEast
(mm/Year)
VNorth
(mm/Year)
VUp
(mm/Year)
SPAN38.781320.67361 January 2009–16 November 201520.86 ± 0.023.83 ± 0.02−0.50 ± 0.05
6.88 years
18 November 2015–31 October 202118.97 ± 0.041.37 ± 0.03−0.95 ± 0.07
5.94 years
EXAN38.754020.618625 November 2015–16 May 202119.46 ± 0.074.06 ± 0.12−5.90 ± 0.51
5.48 years
DRAN38.683820.574624 November 2015–17 June 201818.10 ± 0.134.59 ± 0.11−5.06 ± 0.36
2.56 years
PONT38.619020.58521 January 2009–16 November 201520.45 ± 0.036.81 ± 0.02−0.71 ± 0.08
6.88 years
18 November 2015–6 August 20165.28 ± 0.81−17.31 ± 0.6518.52 ± 2.06
0.72 years
6 August 2016–31 October 202118.27 ± 0.054.61 ± 0.04−0.63 ± 0.13
5.24 years
Table 3. Velocity components for the Cephalonia GNSS stations (ITRF 2014).
SiteLatitude
(o)
Longitude (o)PeriodVEast
(mm/Year)
VNorth
(mm/Year)
VUp
(mm/Year)
FISK38.459720.577115 March 2017–17 August 202017.14 ± 0.083.32 ± 0.071.01 ± 0.28
3.49 years
ASSO38.377820.541715 March 2017–18 May 202119.81 ± 0.074.79 ± 0.04−2.03 ± 0.19
4.18 years
VLSM38.176820.58861 January 2009–25 January 201417.10 ± 0.044.27 ± 0.03−0.70 ± 0.09
5.07 years
8 February 2014–4 September 201614.07 ± 0.13−1.49 ± 0.070.44 ± 0.25
2.57 years
5 September 2016–31 October 202116.10 ± 0.033.15 ± 0.03−1.20 ± 0.09
5.16 years
ARGO38.169020.49251 May 2016–31 Ocotber 202117.08 ± 0.025.78 ± 0.02−2.27 ± 0.27
5.50 years
KARA38.130820.58436 May 2014–16 November 201516.78 ± 0.192.17 ± 0.182.48 ± 0.71
1.53 years
SISS38.100920.65946 February 2016–31 October 202116.97 ± 0.031.59 ± 0.0.03−3.57 ± 0.10
5.73 years
SKAL38.074620.79374 March 2015–13 August 202114.69 ± 0.02−1.80 ± 0.02−1.52 ± 0.07
4.45 years
Table 4. Velocity components for the Zakynthos—Strofades GNSS stations (ITRF 2014).
SiteLatitude
(o)
Longitude (o)PeriodVEast
(mm/Year)
VNorth
(mm/Year)
VUp
(mm/Year)
ZAKY37.779220.88502 December 2013–25 October 201812.83 ± 0.03−2.5 ± 0.03−0.31 ± 0.08
4.90 years
27 October 2018–5 July 20192.37 ± 0.42−1.34 ± 0.426.40 ± 1.24
0.69 years
6 July 2019–31 October 202111.21 ± 0.10−2.68 ± 0.09−0.88 ± 0.32
2.32 years
ZNTE37.717620.730823 November 2018–31 May 2019−8.30 ± 0.8320.61 ± 0.51−3.39 ± 2.18
0.52 years
1 June 2019–31 October 202110.17 ± 0.08−0.48 ± 0.080.10 ± 0.025
2.42 years
STRF37.245421.01566 October 2016–25 October 20183.87 ± 0.08−5.31 ± 0.09−0.46 ± 0.24
2.05 year
Table 5. Velocities of GNSS stations in western Greece and the NW Peloponnese (ITRF 2014).
SiteLatitude
(o)
Longitude (o)PeriodVEast
(mm/Year)
VNorth
(mm/Year)
VUp
(mm/Year)
AGRI38.624021.40905 January 2011–12 February 201912.54 ± 0.016.96 ± 0.01−0.30 ± 0.04
8.11 years
KTCH38.411621.246920 November 2013–31 October 202114.12 ± 0.01−3.94 ± 0.01−1.25 ± 0.03
7.95 years
PAT038.283721.786827 January 2009–31 October 20217.20 ± 0.01−6.82 ± 0.01−0.46 ± 0.02
12.77 years
RLSO38.055821.46473 June 2011–26 February 20178.45 ± 0.03−7.53 ± 0.030.34 ± 0.07
5.74 years
1 March 2019–31 October 202110.03 ± 0.08−10.95 ± 0.06−2.27 ± 0.16
2.67 years
PYRG37.678821.46222 December 2013–25 October 20185.03 ± 0.02−12.51 ± 0.02−0.40 ± 0.06
4.90 years
27 October 2018–12 July 2019−6.47 ± 0.29−17.74 ± 0.29−0.91 ± 1.03
0.70 years
13 July 2019–31 October 20213.86 ± 0.06−13.79 ± 0.08−0.94 ± 0.23
2.30 years
Publisher’s Note: MDPI stays neutral with regard to jurisdictional claims in published maps and institutional affiliations.

