Article

Evaluation of Hydrogen Cyanide in the Blood of Fire Victims Based on the Kinetics of the Reaction with Ninhydrin

by
Daniel Tabian
1,2,
Diana Bulgaru Iliescu
2,*,
Madalina Maria Diac
2,
Mihaela Badea
1,
Sebastian Ionut Toma
1 and
Gabi Drochioiu
3,*
1
Faculty of Medicine, Transilvania University of Brasov, 56 Nicolae Balcescu Street, 500019 Brasov, Romania
2
Faculty of Medicine, “Grigore T. Popa” University of Medicine and Pharmacy Iasi, 16 Universitatii Street, 700115 Iasi, Romania
3
Faculty of Chemistry, “Alexandru Ioan Cuza” University of Iasi, 11 Carol I, 700605 Iasi, Romania
*
Authors to whom correspondence should be addressed.
Appl. Sci. 2022, 12(5), 2329; https://doi.org/10.3390/app12052329
Submission received: 31 December 2021 / Revised: 13 February 2022 / Accepted: 18 February 2022 / Published: 23 February 2022
(This article belongs to the Special Issue Updates in Forensic Medicine: New Tools Applied in Forensic Science)

Abstract

:
An original kinetic spectrophotometric procedure was developed for the determination of hydrogen cyanide (HCN) in the whole blood of fire victims. Cyanide poisoning by smoke inhalation is common in forensic medicine, but the blood HCN of fire victims has not been studied in detail so far. In this research project, we developed a simple, fast, sensitive, and selective quantification method for both free and metabolized HCN based on the kinetics of cyanide reaction with ninhydrin. The method was linear in range, from 0.26 to 2.6 μg mL−1, with a coefficient of determination of r = 0.994. A high molar absorptivity of 4.95 × 10⁵ L mol−1 cm−1 was calculated under the reaction conditions. The limit of quantification was 0.052 μg mL−1; the detection limit was 0.012 μg mL−1 and the standard error was ±2.7%. This micro method proved to be accurate, sensitive, and selective and has been successfully applied to the analysis of blood samples, allowing rapid monitoring of blood cyanide in several fire victims.

1. Introduction

The extreme toxicity of cyanide and environmental concerns continue to generate interest in rapid, sensitive, and selective methods for cyanide detection and quantification. Toxicity of hydrogen cyanide (HCN) from inhalation of smoke from building fires has received additional recognition in injuries and deaths [1,2,3]. Exposure to HCN can induce heart attacks which are the leading cause of fire deaths [4]. When the body is exposed to HCN by inhalation, it becomes deprived of oxygen, and mitochondria deteriorate rapidly until death occurs unless exposure is quickly identified and treated immediately [5]. In fact, the common cause of fire death is the inhalation of noxious gases such as HCN and carbon monoxide (CO) rather than thermal injury [3,5,6,7]. HCN has the capacity to act and can even be the cause of death [8]. However, it is assumed that HCN poisoning is still an overlooked diagnosis in fire victims [9,10].
Hydrogen cyanide has a suffocating effect, causing the transition from aerobic to anaerobic metabolism and lactic acidosis, which leads to neurological, respiratory, and cardiovascular depression. Confusion and loss of consciousness, bradycardia, hypotension, and respiratory and cardiac arrest have also been described [11,12,13]. Smoke interferes with visibility, an important factor in the evacuation of people in the case of fire scenarios. It is also possible that the incapacitating effect of HCN exposure will affect the efficiency of fire evacuation, causing the victim to remain inside the room until exposure to heat or toxicity leads to injury or death [3,14]. During inhalation of smoke containing HCN, some of the HCN is converted by rhodanese enzyme to thiocyanates (salts of HSCN) [15].
Evidence is now growing that blood HCN measurements may also be beneficial for understanding fire fatalities [11,16]. Quantification of the unbound HCN blood concentration increases the information gained for those cases of fire fatalities [17]. Nevertheless, numerous papers are already published regarding the methods for HCN determination in blood [18,19,20]. A review summarized the literature since 2005 on cyanide determination in drinking water and wastewater, as well as cigarette smoke and biological fluids such as blood, urine, and saliva [21]. The reviewed methods include naked eye visual detection, spectrophotometry or colorimetry, capillary electrophoresis, fluorimetry, chemiluminescence, near-infrared cavity ring-down spectroscopy, atomic absorption spectrometry, electrochemical methods, mass spectrometry, gas chromatography, and quartz crystal mass monitors. An amperometry test was also developed [22]. Headspace gas chromatography associated with acidification with tartaric acid was developed for the analysis of cyanide in whole blood [23]. Another method for the analysis of cyanide in human whole blood involves the conversion of cyanide into hydrogen cyanide and its subsequent headspace solid-phase microextraction and detection by gas chromatography–mass spectrometry (GC/MS) [24]. In addition, an automated procedure based on isotope-dilution gas chromatography–mass spectrometry for the accurate and rapid determination of HCN in whole blood was advanced [25]. The simultaneous derivatization and extraction of free cyanide in biological samples using homemade hollow fiber-protected headspace liquid-phase microextraction is followed by capillary electrophoresis (CE) determination [26]. A kinetic spectrophotometric determination of cyanide based on copper (catalyzed oxidation of 3-hydroxybenzaldehyde azine (3-OHBAA)) by potassium peroxydisulfate was previously proposed [27]. The calibration plot was linear in the range of 0.15–0.6 μg mL−1 cyanide and the detection limit was 0.050 μg mL−1. Another method was based on the decrease in absorbance at 612 nm [28]. However, all these methods require expensive and sophisticated equipment. In addition, although intoxications with HCN via smoke inhalation are frequently encountered in forensic medicine, its analysis was less studied in detail.
Despite numerous studies on the determination of cyanide with ninhydrin [29,30,31,32,33,34,35], only a few methods using ninhydrin have been published for HCN or HSCN in blood or other biological samples [14,36,37].
Therefore, we present here, based on the reaction of cyanide with ninhydrin, a kinetic spectrophotometric method for the quantitative determination of HCN in the blood of fire victims, including HCN metabolized to thiocyanate. The originality of the micro method proposed by us consists mainly in the study of the kinetics of the HCN reaction released from the blood with phosphoric acid (H3PO4); previously, the spectrophotometric measurements were made only 15 min after the addition of the reagents [38]. In addition, the optimization of HCN microdiffusion from blood samples using Conway dishes and the performance of the method were discussed. We also emphasized the importance of adding sodium fluoride during the sampling process, as other authors have suggested [39,40].

2. Materials and Methods

2.1. Chemicals and Reagents

All chemicals used were of analytical grade of purity. MilliQ grade (18.2 MΩ·cm) water (Millipore, Milford, MA, USA) was used in all experiments. Ninhydrin (2,2-dihydroxy-1,3-indandione) was purchased from Serva (Heidelberg, Germany), whereas potassium cyanide (KCN), K2CO3, and phosphoric acid (H3PO4) were obtained from Merck KGaA (Darmstadt, Germany). Potassium hydroxide (KOH) was bought from Carl Roth GmbH CoKG (Karlsruhe, Germany). Potassium thiocyanate was from Sigma-Aldrich Chemie GmbH (Taufkirchen, Germany). All chemicals and solvents were used without further purification.
The ninhydrin reagent (NR, 5 mg mL−1 ninhydrin in 2% K2CO3) was carried out by solving 250 mg of ninhydrin in 50 mL of 2% K2CO3. A stock solution of 650 μg mL−1 KCN in 0.1 N KOH was prepared weekly. The solution was stored at +4 °C. Working solutions were prepared daily by dilution of appropriate aliquots from stock solution in 0.1 N KOH.

2.2. Instrumentation

Conway microdiffusion units, made of glass or plastic, were used for distilling and capturing HCN in alkaline solutions and an electric heater with an automatic stirring system (VMS C1; VWR™) to heat them at 40 °C. UV–vis spectra of the colored solutions resulting from the reaction of cyanide with ninhydrin were recorded using a Libra S35 PC spectrophotometer with thermostated cuvettes from Biochrom Ltd. (Cambridge, England) and Acquire Application Software 1.03 in QS quartz cuvettes (10.00 mm). UV–vis spectra were recorded in a range of 200–800 nm. However, after setting the maximum absorption at 493 nm, plastic cuvettes were also used for the kinetic measurements at this wavelength. The relationship between the slope values of the kinetic curves and HCN concentrations (as KCN) was studied.

2.3. Sampling

This study was conducted with the approval of the Ethics Committee of Transilvania University of Brasov (4/26.02.2020) and “Grigore T. Popa” University of Medicine and Pharmacy of Iasi, Romania (2182/27.01.2020). The biological samples were collected at autopsy 24–48 h after death. Thus, 5 mL of femoral venous blood was collected in a test tube with sodium fluoride as an anticoagulant and immediately frozen. Prior to the HCN measurement, the frozen blood was thawed and stored at 4 °C.

2.4. Distillation (HCN Capture)

For the determination of unbound HCN in blood, 1 mL of blood, 1 mL of water, and 1 mL of 20% H3PO4 were placed in the external chamber of the Conway unit. Then, 2 mL of 0.1 N KOH solution or 2% K2CO3 was pipetted in the internal chamber of the Conway vial to capture the HCN released from the outer chamber. The insulating cap is immediately placed on the Conway vial. Conway cells were then heated for 30 min at 40 °C on the electric heater.
The absorbent solution containing HCN captured after its removal from the 1 mL blood samples was recovered with a 1 mL automatic pipette and quickly transferred to 2 mL glass vials. The internal chamber was washed with water to remove the traces of HCN, and the resulting solution was added to the solution found in the glass vial, adjusted with water to 2 mL and stirred.
To determine total HCN, including that metabolized to thiocyanate ions, 1 mL of blood, 1 mL of 20% H3PO4, and 1 mL of 7.5 mg mL−1 KMnO4 solution instead of 1 mL of water was pipetted into the outer chamber to convert the thiocyanate ions to HCN. Then, the Conway cell was heated at 40 °C for 30 min, and the absorbent solution was adjusted to 2 mL as in the case of free HCN determination. In the presence of 1 mL of blood, the permanganate magenta color did not disappear due to the permanganate reaction with reducing agents present in the blood. Aliquots of 100 μL were taken from each absorbent solution and treated with NR. The blank value was calculated using water instead of the blood sample, which will be checked for HCN.

2.5. The Hydrogen Cyanide Determination

Volumes of 100 μL of absorbent and 1 mL of ninhydrin reagent were pipetted into the quartz or plastic cuvette of the spectrophotometer. Immediately, the cuvette was covered with parafilm and shaken vigorously by inverting several times. The absorbance values at 493 nm were measured kinetically spectrophotometrically for 30 min, immediately after mixing the reagents. If the concentration of HCN in the blood is too high, the cyanide-containing absorbent may be diluted before measurements. Separately, other absorption measurements were also performed at certain times, such as 5 min, 10 min, 20 min, 30 min, and even 50 min. A reference solution was prepared each time by mixing 100 μL of 2% K2CO3 or 0.01 N KOH and 1 mL of 5 mg mL−1 ninhydrin reagent directly in the spectrophotometric cuvette. The kinetics of the color reaction between cyanide ions and ninhydrin was followed against the reference solution at 493 nm in 1 cm3 plastic cuvettes.
The calibration curves were plotted with known concentrations of HCN either by the proposed kinetic spectrophotometric micro method or by the spectrophotometric reading of the absorbance of the cyanide adduct with ninhydrin at 584 nm and at a fixed time of 15 min [38]. In addition, the results of the proposed micro method with ninhydrin were statistically compared with those obtained by the reference method using chloramine T/barbituric acid-pyridine in pH 4.0 buffer solutions and at 30 °C [41]. The following solutions were prepared: (i) 0.2 M acetate buffer of pH 4.0; (ii) 0.50% (w/v) chloramine-T (Merck) in distilled water; and (iii) 0.150 M barbituric acid and 10% (v/v) pyridine were mixed and diluted to the mark in a 100 mL volumetric flask. The absorbance was read at 578 nm and 30 °C and compared with the slope values obtained by the proposed micro method.
We studied method accuracy by measuring the HCN content of unfrozen whole blood samples fortified with a known amount of KCN.

3. Results

3.1. Spectrophotometric Study of the Reaction between Ninhydrin and CN

First, we established the suitable wavelength for kinetic measurements. Figure 1a shows the absorption spectrum of the reagent with ninhydrin (100 μL of 2% K2CO3 + 1 mL NR) against water, which reached absorbance maximum at 370 nm (A = 1.486 A.U., where A means absorbance, and A.U. represents absorbance units). At 493 nm, a relatively low value, A = 0.106 A.U., was found for the reference. The absorption spectrum of 100 μL of 2.6 μg mL−1 treated with 1 mL of ninhydrin reagent (NR) against water reached absorbance maximum at 470 nm (A = 1.993 A.U.). However, when the spectrum was read against the NR and not water as the reference, the maximum moved to 493 nm (A = 1.800 A.U.). Hence, 493 nm was selected for further studies. Then, we repeated the spectrophotometric measurements using 100 μL of 1 μg mL−1 potassium cyanide (KCN) solution (Figure 1b), where a complicated polynomial equation was calculated. Here, it is important to observe the high contribution of ninhydrin to the absorbance values in the UV range, as well as in the range from 350 to 400 nm (yellow color in the presence of potassium carbonate). In addition, part of ninhydrin is consumed in the reaction with cyanide, so the spectrum of cyanide–ninhydrin adduct may become complicated and dependent on the concentration of each reagent involved.

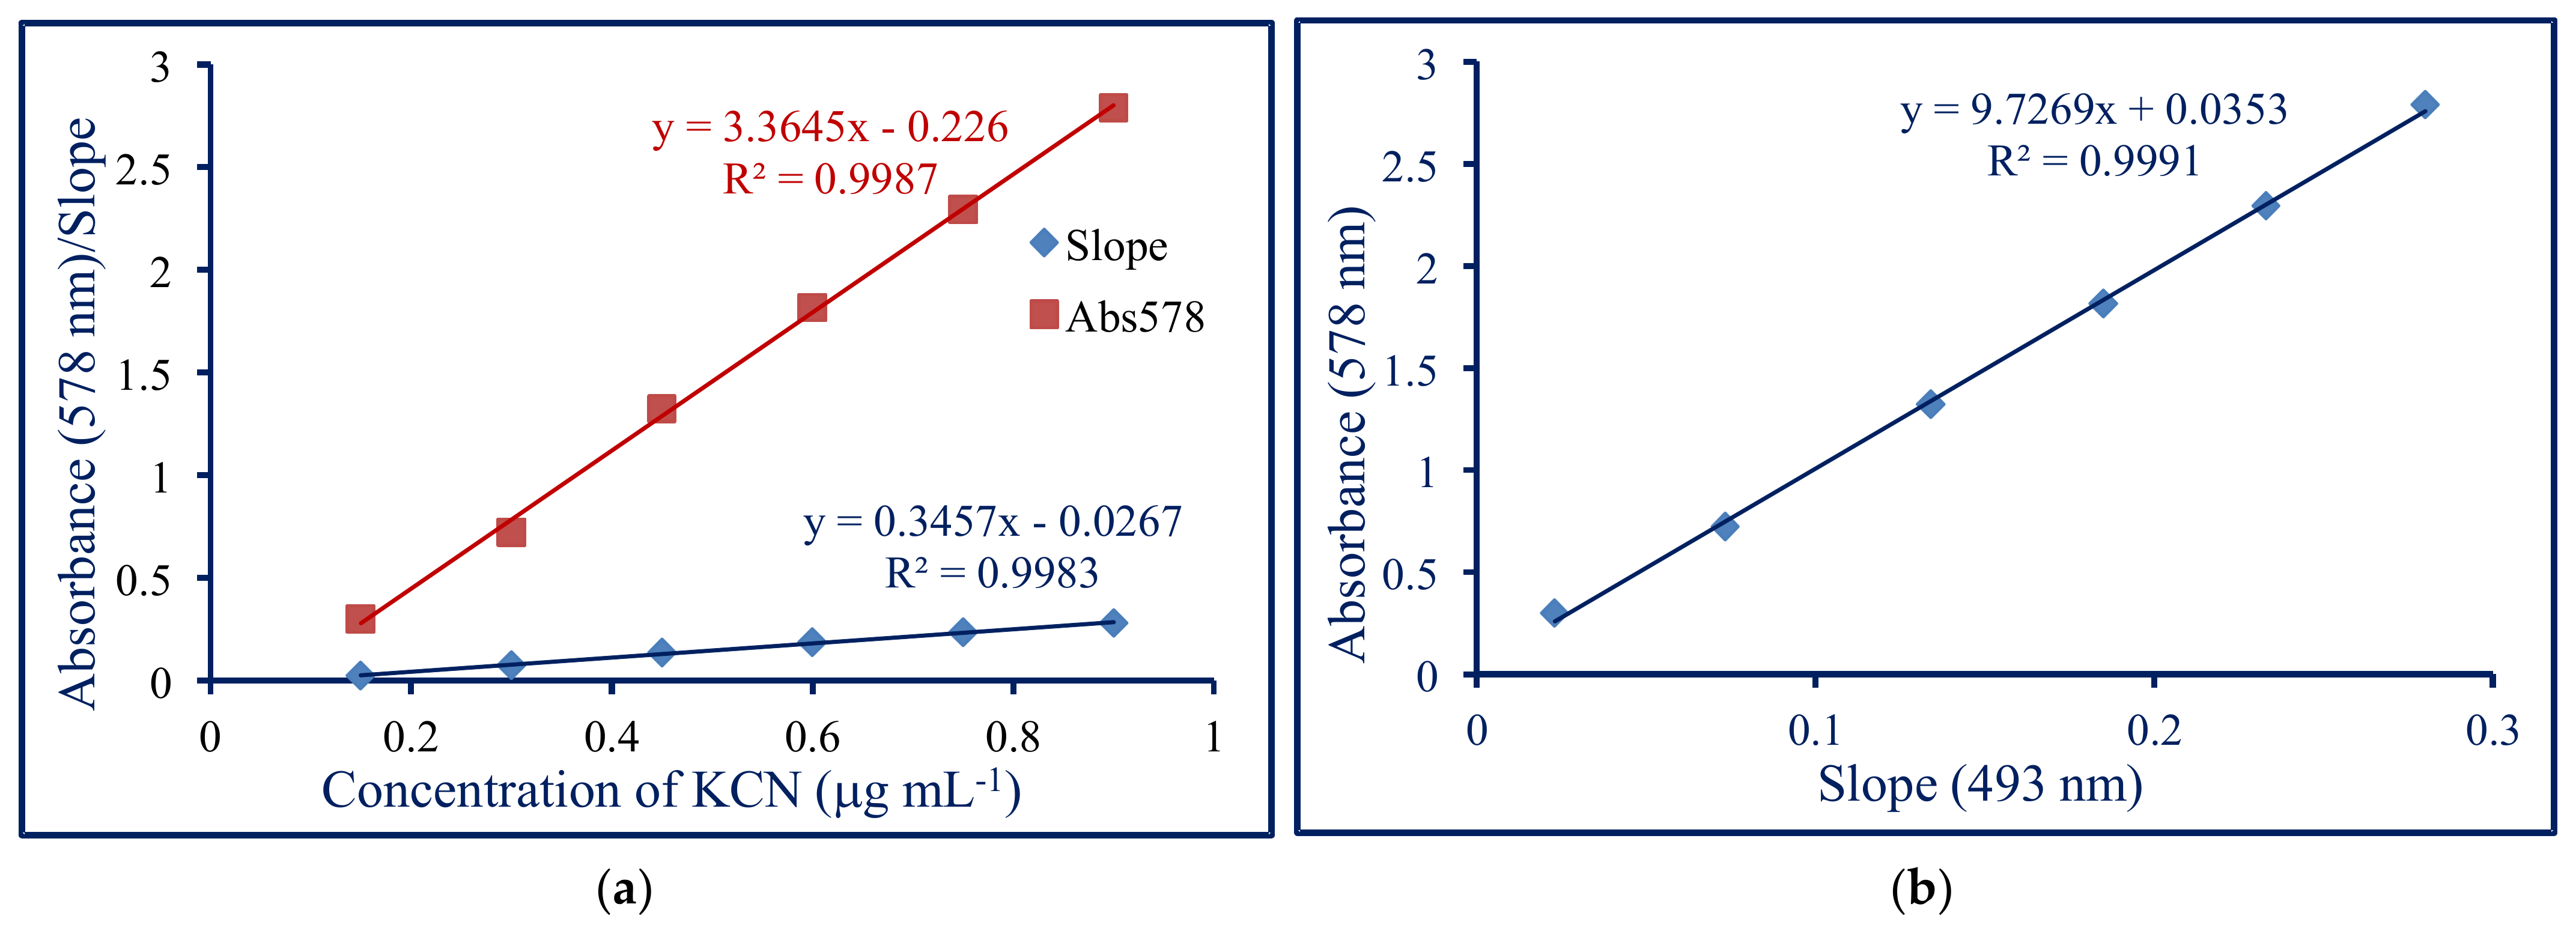
3.2. Analytical Performance

Volumes of 100 μL of KCN solutions with concentrations ranging from 0 to 2.6 μg mL−1 reacted with ninhydrin (1 mL of NR) in the spectrophotometer cuvettes for 60 min at 25 °C (not shown). The reaction kinetics were measured at 493 nm against the reference made with the reagents. Then, we plotted the calibration curve with the absorbance values measured at 20 min after reagent mixing. The cyanide–ninhydrin system obeys Beer’s law in the range from 0.26 μg mL−1 to 2.6 μg mL−1 KCN (R2 = 0.9879) with molar absorptivity ε = 4.5 × 10⁴ L mol−1 cm−1 (Figure 2). However, keeping in mind that 100 μL of cyanide solution was mixed with 1 mL of NR, the concentration of KCN in the resulted solution becomes 0.236 μg mL−1 and ε = 4.95 × 10⁵ L mol−1 cm−1; a value close to that was found by other authors when cyanogen compounds were determined in plants (ε = 1.4 × 10⁵ L mol−1 cm−1, in the range from 0.020 μg mL−1 to 0.800 μg mL−1) [38].
Figure 2 shows the calibration curve for cyanide determination at 493 nm 20 min after the start of the reaction. We reported the absorbance values of the cyanide–ninhydrin adduct as a function of cyanide concentration.
At the beginning, we used an excel sheet to first calculate the HCN concentration (expressed as KCN) in absorbent solution, then in 0.5 mL of blood, then the HCN concentration expressed as μg mL−1 HCN. In the meantime, we simplified the HCN calculation, using the following formula: C = 2.0063 A493 + 0.5022, where C means HCN concentration in blood and A493 is the absorbance value at 493 nm as measured against the reagents. In this case, we recovered only 1.555 mL of absorbent from 2 mL initially introduced into the Conway unit. Since the calibration curve is linear in the concentration range 0.1–2.6 μg mL−1, we considered the lowest concentration to be accurately measured under the experimental conditions of this method as 0.10 μg mL−1 KCN. However, considering that HCN in 1 mL of blood is captured in 2 mL of alkaline solutions and only 100 μL of absorbent is used in the reaction with ninhydrin, the limit of quantification becomes much lower. Indeed, the limit of quantification was 0.052 μg mL−1; the detection limit was 0.012 μg mL−1 and the standard error was ±2.7%. However, concentrations higher than 0.1 μg mL−1 are of interest for HCN determination in blood samples. This value is sufficiently satisfactory for the determination of HCN in the blood of fire victims and not for the very sensitive determination of blood cyanide for other purposes. However, we sought to improve the sensitivity of HCN determination by investigating the relationship between absorbance values and a wider range of KCN concentrations (Figure 3). Although a calibration curve of polynomial and not linear shape, in the range indicated in Figure 2, did not show a higher correlation coefficient r (r = 0.994 vs. r = 0.993; R2 = 0.9896 vs. R2 = 0.9879), better results were obtained with a calibration curve of polynomial shape in the concentration range 0–2.6 μg mL−1. Thus, linear correlation and abscissa interception, with the regression equation: y = 0.5071x, where y is the absorbance and x, the KCN concentration, led to a lower correlation coefficient, r = 0.979 (R2 = 0.9592). However, using the regression equation y = −0.0786x3 + 0.3805x2 + 0.0796x, very low concentrations of KCN (below 28 ng mL−1) and HCN (less than 12 ng mL−1) can be measured. Nevertheless, the Lambert–Beer law cannot be applied to such low concentrations because the relationship between the absorbance values and concentrations is not linear. Separately, we added in each artificial solution of cyanide, as well as in the reference solution without cyanide, a small amount of cyanide solution (1 mL artificial solution + 0.02–0.1 mL of 2.6 μg mL−1 KCN) so that the calibration curve becomes linear.
For the new calibration curve obtained by adding 0.1 mL of 2.6 μg mL−1 KCN, including the reference solution, a standard deviation sx = 0.00593 was calculated. The limit of detection (LOD) being three times higher: LOD = 3·sx = 0.177 μg mL−1 KCN, which means 0.074 μg mL−1 HCN.
The colored product resulting from the cyanide reaction with ninhydrin was stable for more than 60 min. The slope, intercept, and the correlation coefficient evaluated by least squares regression analysis were also considered.
Because the HCN concentration in the blood sample of fire victim three (M.L.) was high enough, we used duplicates of 0.5 mL of blood and not 1 mL (Table 1 and Table 2). In addition, we determined the total concentration of HCN in blood, including that metabolized to the salts of thiocyanic acid. Therefore, in the outer chamber of the Conway unit, we pipetted 1 mL of water, 0.5 mL of blood, 1 mL of 20% H3PO4, and 1 mL of 7.5 mg mL−1 KMnO4. The Conway units containing either 0.5 mL of blood plus the other reagents or 1 mL of 2.6 μg mL−1 KCN solution (as standard) or 1 mL of water (reference) were kept on the heater at 40 °C for 30 min. Then, 100 μL of absorbent from each Conway cell were mixed with 1 mL of NR and the kinetics of the reaction was studied at 493 nm for 30 min. Only data collected 20 min after reagent mixing was shown in Table 1 and Table 2.

3.3. Reproducibility

Reproducibility of the method was checked by six replicate analyses of the KCN solution containing 1.0 µg mL−1. The standard deviation and relative standard deviation were found to be ±0.015 and 2.3%, respectively.

3.4. Headspace Extraction for Determination of Hydrogen Cyanide

We also combined headspace extraction to determine cyanide, as shown by Khatha et al. [42] with the kinetic spectrophotometric determination of HCN in blood with ninhydrin, improving the method of determining cyanides at a fixed time of 15 min [38]. In this case, an increase in sensitivity was observed due to the head-space extraction. Hydrogen cyanide (HCN) was generated through the addition of H3PO4, and after a 30 min incubation, 100 μL of the headspace was injected into the 1 mL of ninhydrin reagent.

3.5. Hydrogen Cyanide Recovery

The recovery of HCN was determined by extracting and assaying HCN-free blood samples fortified to contain 1.3 and 2.6 μg mL−1 of KCN and by comparing the absorbencies with those obtained by pouring directly equivalent loads of the KCN stock solution into the inner well of the microdiffusion device (the outer well was kept empty). The results for recovery rate (mean ± S.D.) of six replicates at this concentration were 84.4 ± 6.6%, when 0.1 N KOH solution was used for capturing the HCN removed by the 20% phosphoric solution, and 78% ± 8.3% in the case of 2% K2CO3 absorbent solution. This recovery was found to be satisfactory and quite similar to those obtained following a longer time period (2–3 h) with conventional Conway units [43].
The HCN from blood samples was recovered in a proportion ranging from 75% to 85%, determined by internal standards with known concentrations of KCN (1.3 μg mL−1 and 2.6 μg mL−1 KCN). When 1 mL of 1.3 μg mL−1 KCN was added to each blood sample as an internal standard, HCN in the blood was determined more accurately. A better recovery of HCN was observed when the aqueous solutions of 1.3 μg mL−1 and 2.6 μg mL−1 KCN were placed in the Conway external wall instead of cyanide-free blood with the addition of KCN. Comparing the absorbance values for HCN in blood samples with those in a calibration curve performed with aqueous KCN solutions in the range of concentrations from 0 to 2.6 μg mL−1, a blood HCN concentration of 0.75 μg mL−1 and a total HCN of 1.37 μg mL−1 were calculated for a specific blood sample taken from a fire victim. However, a blood HCN concentration of 1.043 μg mL−1 and another one of 1.904 μg mL−1 for total hydrogen cyanide were determined if the calculation was made with the two internal standards (1.3 μg mL−1 and 2.6 μg mL−1 KCN).
From Figure 4, for the absorbance value of 1.432 at 493 nm, which corresponds to a concentration of 2.6 μg mL−1 KCN or 1.08 μg mL−1 HCN, a high molar absorptivity of 3.58 × 10⁶ L mol−1 cm−1 was calculated. Therefore, the sensitivity of this assay is comparable with that of the fluorescence methods. A derivative of the absorbance spectra showed a small variation in the absorbance values during the kinetic measurements. In general, the reference sample had the absorbance values in a narrow range close to zero. On the contrary, in Figure 4a, a negative value was observed, probably due to the experimental errors. However, the slope of the reference spectrum was very low (Slope 0.060), while its value increased with the concentration of KCN or HCN (Slope 0.5029–0.5348 for 2.6 μg mL−1 KCN in two different days). Since the absorbance values and slopes of kinetic spectra slightly differ from one day to another, a standard with KCN is needed for each series of determinations per day.
Head-space sampling of HCN demonstrated the high sensitivity of this method (A493 > 2.3, at 30 min from the reagent mixing). On comparing the absorbance values on the kinetic curve (A = 2.348 vs. A = 1.888, where A means the absorbance values at 493 nm, at t = 30 min for 2.6 μg mL−1 KCN + 0.1 mL gas from the head-space vial vs. the absorbance of the standard sample at a concentration of 2.6 μg mL−1 KCN).
A close relationship between the slope of the kinetic curve and the cyanide concentration was found (Figure 5). The concentration dependence on the slope values proved to be linear in the range from 0.1 μg mL−1 to 2.6 μg mL−1 KCN. A regression equation C = 3.0427·S + 0.1401, where C = KCN concentration and S = the corresponding slope values, was calculated (r = 0.995; R2 = 0.9918). The kinetic measurement of the cyanide concentration has the advantage of quickly reading the values, without waiting for the color development for 15 min.

3.6. The Determination HCN at Different Fixed Times

The content of HCN found in 100 μL artificial solutions with known concentrations (0–1.5 μg mL−1) was determined kinetically spectrophotometrically and separately by reading the absorbance at 493 nm in plastic cuvettes with a path length of 1 cm at 10 to 50 min, all at the same time (Table 3). In addition, the same concentrations were measured at 15 min fixed time and 485 nm [38].
Table 3 shows the absorbance values determined at 493 nm after 10–50 min following reagent mixing and those obtained by the reference method [38]. A close relationship was found between the concentration values (0.15–1.50 μg mL−1) and the absorbance at 493 nm. Thus, for the values measured at only 10 min, a regression equation was calculated (y = 1.1255x − 0.1782, where y = absorbance at 493 nm and x = the concentration of KCN; R² = 0.9836). This means it is possible to measure HCN concentration in the first minutes of reaction. However, a better correlation was found at t = 20 min, where R2 = 0.989). A similar correlation was found between the values of the concentration of the calibration solutions and those of the absorbance at 485 nm, which was measured by the fixed-time spectrophotometric method (y = 1.06x − 0.2014; R² = 0.9842) [38]. We then compared the absorbance values obtained at different times with those measured at 485 nm. On comparing the absorbance values at 493 nm and 20 min with those obtained at 485 nm and 15 min time of reaction, a close relationship was also found (y = 0.8865x; R² = 0.9984; r = 0.999). We expected such a high correlation, as the correlation coefficient, r, demonstrated, because the methods are rather similar. However, we compared the slope values characteristic to kinetic spectrophotometric measurements with those of absorbance at 485 nm. A close correlation was also noticed between the two series of values (R2 = 0.981).

3.7. Chloramine-T/Barbituric Acid-Pyridine Method

The series of the standard solution was 0.15, 0.30, 0.45, 0.60, 0.75, and 0.90 μg mL−1 KCN, respectively, because the standard method with chloramine T was linear in this range of concentrations. To plot the calibration curve of the proposed micro method, we prepared solutions of KCN with the same concentrations. However, 0.1 mL of 0.20 μg mL−1 KCN was added in each cuvette before adding 0.1 mL of standard solution to obtain a linear calibration curve. Then, we compared the two calibration curves (Figure 6).
A close relationship was noticed between the slope values in the kinetic spectrophotometric method using ninhydrin and the absorbance of the complex of chloramine T with barbituric acid and pyridine. A regression equation y = 9.7269x + 0.0353 was calculated (R2 > 0.999), where y = the absorbance values at 578 nm and x = the slope values.
We measured the absorbance of the cyanide adduct with ninhydrin at 493 nm in the concentration range from 0.26 to 2.6 μg mL−1 KCN and found that the slope values were relatively low, although the absorbance values at 10–30 min were very high. However, the absorbance increased slowly in the first 3 min and, therefore, the slope values are proportional to higher concentrations than 2.6 μg mL−1 KCN. We measured thus the kinetic values from 0.26 to 6.5 μg mL−1 KCN and obtained a linear calibration curve with the slope values. A regression equation, y = 0.3259x − 0.0428 (R² = 0.9981), between the slope values (y) and the concentration (x) was calculated. Thus, a value of 1.1 A.U. and another one of 2.11 A.U. were obtained for the 3.25 and 6.5 μg mL−1 KCN solutions (calculated: 1.0163 and 2.0755 μg mL−1 KCN, respectively).

4. Discussion

4.1. Basis of the Process

The kinetics of cyanide reaction with ninhydrin have not previously been fully investigated. Here, we reported on the specificity of kinetic curves and reached the conclusion that kinetic measurements may improve cyanide determination in blood. As a result, a kinetic-spectrophotometric method for determining the concentration of hydrogen cyanide in the blood of fire victims was developed based on the reaction between HCN and ninhydrin with the measurement of absorbance at 493 nm. HCN is removed from blood samples with 20% H3PO4 and absorbed in a 2% potassium carbonate (K2CO3) solution or, better, 0.01 N KOH. Other authors also reported that HCN derivatives in the blood can be decomposed using a citrate/phosphoric acid mixture or phosphoric acid only at 40 °C, and the resulting HCN is captured in an alkaline solution [44]. However, in our method, different amounts of HCN trapped in the absorbent react with a ninhydrin reagent to form a red-dye complex, which indicates the mass concentration of cyanide ions in the sample.
Determinations performed using the Conway vial and a ninhydrin-containing reagent require less space, sample material (0.5–1 mL), reagents, and cleaning. Spectrophotometric determination with ninhydrin prevents the user from having to deal with unpleasant substances, such as pyridine and other bad smelling compounds. Finally, the selectivity of both the cyanide reaction with ninhydrin and the HCN captured in an alkaline solution make this method extremely specific and suitable for medico legal as well as clinical applications.
The standard method is sensitive to cyanide but the complexation with chloramines-T and barbituric acid–pyridine is difficult and expensive for the determination of cyanide in blood [45]. The proposed method has similar specificity, accuracy, and limit of detection. HCN from 0.5–1 mL of blood is captured in 2 mL of absorbent and 0.1 mL only was used in the reaction with ninhydrin. Therefore, this micro method can be greatly improved for use in forensic toxicology where analytical requirements are very high. We compared the kinetic spectrophotometric determination of HCN in the blood samples of the fire victims with the fixed-time spectrophotometric measurement. Furthermore, a comparison of this method with the chloramine T spectrophotometric method showed a significant advantage in terms of simplicity, less cost, and the use of common reagents and instruments.
Indeed, some methods are based on gas chromatography and measure cyanide as cyanogen chloride after conversion with chloramine-T. Such a method involves a number of chemical manipulations and requires an electron capture detector and a specific column [46]. On measuring cyanide with this method, Odoul et al. [18] found a linear detection response from 0.005 to 1.0 μg mL−1 cyanide. The blood cyanide was measured by isotope dilution with a detection limit of 0.3 µM [47]. The addition of phosphoric acid liberates the cyanide as HCN, which is determined by headspace gas chromatography coupled with by mass spectrometry. A linear calibration graph over a wide concentration range of cyanide, and the limit of determination of 1 ng mL−1 was reported, when head-space capillary gas chromatography with nitrogen–phosphorus detection was applied [48]. However, thiocyanate showed a positive interference. The results of this method agree with those obtained by the microdiffusion spectrophotometric method for blood samples from fire victims [48]. Moreover, Gambaro et al. [49] compared the automated headspace gas chromatographic method with a nitrogen–phosphorus detector with a standard spectrophotometric method. The results obtained by the two procedures were not different and the authors concluded that both methods are suitable for rapid diagnosis of cyanide in postmortem cases. The conversion of cyanide into HCN and its subsequent headspace solid-phase microextraction and detection by gas chromatography/mass spectrometry (GC/MS) in selected ion monitoring mode was proposed as well [24]. Cyanide in whole blood was also determined using ion chromatography with amperometric detection [50]. This method shows good linearity in the range of 0.002 to 0.05 μg mL−1 cyanide. Although all these methods are fast and sensitive enough for the rapid diagnosis of cyanide intoxication in clinical and forensic toxicology, they need relatively expensive equipment. Spectrophotometric methods like the proposed one require inexpensive reagents and instruments and can be applied to a limited number of samples as found in small hospitals.
Nevertheless, the spectrophotometric methods are largely used in cyanide determination in blood [51]. However, a method using cobinamide showed reasonable agreement when analyzed by linear regression, but not when analyzed by a standard error of the estimate or paired t-test. It has a lower limit of quantification of 3.27 µM cyanide. On the contrary, our proposed method is much more sensitive and specific.
Several kinetic spectrophotometric methods have been proposed [27,28,41]. For example, a linear calibration plot in the range 0.15–0.60 μg mL−1 cyanide and the detection limit of 0.05 μg mL−1 cyanide were reported by Velasco et al. [27]. Instead, our proposed micro method was linear in the range 0.26–2.60 μg mL−1 KCN if the measurements are performed at 10 min, 15 min, and 20 min fixed time and in a larger range of concentrations when the slope values are plotted against cyanide concentrations. In addition, the proposed micro method can also be greatly improved by increasing the volume of absorbent and decreasing that of the reagent or by increasing the reaction temperature above 25 °C.

4.2. Micromethod Performance

The proposed method provides a simple, sensitive, and selective determination of blood cyanide. It is comparable with the very sensitive methods for HCN determination in blood samples. For example, a limit of detection of 50 ng mL−1 was achieved by headspace gas chromatography [23]. Another headspace gas chromatography with dual-column/dual-flame ionization detection method was validated, being linear in range, from 1 to 50 μg mL−1. Its limit of quantification proved to be 1.0 μg mL−1 and the detection limit 0.5 μg mL−1 [52]. Blood cyanide concentrations more than 1.00 μg mL−1 are considered toxic, whereas those below 0.25 μg mL−1 are nontoxic [53]. HCN can be absorbed into the body by inhalation, by ingestion, and through the skin, whereas the most susceptible organs to cyanide are the central nervous system and the heart [2]. Cyanide determination in biological samples is still important in terms of clinical and forensic toxicology [52]. The kinetics of the reaction of cyanide with ninhydrin is in agreement with the mechanism of this reaction, which was previously advanced [54].
The effects of various cyanate and thiocyanate concentrations (up to 1 μg mL−1) on the cyanide response were studied. Our results showed that cyanate and thiocyanate did not interfere with HCN quantitation. However, the permanganate ion quantitatively converted thiocyanate to cyanide, which was determined separately or together with free cyanide.
The amount of HCN from blood samples was recovered in the proportion ranging from 75% to 85%, determined by internal standards with known concentrations of KCN (1.3 μg mL−1 and 2.6 μg mL−1 KCN). This recovery was found to be satisfactory, and quite similar to those obtained following a longer time period (2–3 h) with conventional Conway units [43].

4.3. Applications for Real Samples

The proposed micro method was applied for the determination of HCN in several blood samples. The results of the determinations were in good agreement with those made with a well-known spectrophotometric method [55].
First, the HCN concentration was determined in post-mortem blood samples after its removal with 20% H3PO4 and capture in a 2% potassium carbonate solution. The autopsy and chemical analyses of a 51-year-old man were performed 24 h after death [14]. Free HCN concentration was determined to be 1.043 μg mL−1, whereas the total HCN (free HCN plus HCN metabolized to thiocyanate) was 1.904 μg mL−1. In this case, the toxic concentrations of HCN and total HCN were seen as a vital sign (suggesting that the victim must have been still alive when the fire started), indicating a contributing effect of HCN in the mechanism of death. Both HCN in the blood and thiocyanate resulting from the partial metabolism of HCN (salts of thiocyanate acid, HSCN) were determined using 0.5–1 mL of femoral blood. The cause of death was the severe second-degree burns on about 50% of the body surface and acute alcohol intoxication. In addition, the amount of HCN metabolized to HSCN salts could also have a contributing effect. Therefore, a cause of death with three factors can be considered in the reported case [14].
The second case: an 80-year-old man with locomotor disabilities died due to an open fire of vegetation debris and household waste in his yard [37]. Similarly, the HCN from 1 mL of femoral post-mortem blood was captured in 2 mL of 2% potassium carbonate solution and the resulted solution was collected with an automatic pipette; the Conway vial was rinsed, and the two solutions were transferred into a vial and completed with 2 mL of distilled water. Aliquots of 100 μL were taken and treated with 1 mL of 5 mg mL−1 ninhydrin reagent. A toxic concentration of 1.3 μg mL−1 HCN was found. Nevertheless, the carboxyhemoglobin (COHb) level was lethal (73.7%). Despite extremely severe burns and high levels of carbon monoxide, the additive effect of HCN in the mechanism of death was also highlighted [37].
Preservation of blood samples with 1% sodium fluoride at postmortem collection has been recommended [39]. Therefore, we collected the femoral venous blood in tubes with sodium fluoride as an anticoagulant and froze it immediately. Prior to HCN measurement, frozen blood was thawed and stored at 4 °C. In fact, no significant difference was observed between cyanide concentrations in the blood of fire victims in samples treated with sodium fluoride and control samples of at least 9 days [40]. However, the samples treated with sodium fluoride were stable over a 25-day period when compared with the control samples, which showed significant increases in HCN concentrations. The authors recommended the addition of 2% sodium fluoride to blood samples from fire victims to reduce potential instability due to bacteriological activity [40].

4.4. The Toxicity of HCN

Cyanide in blood is either free in plasma or bound to ferric hemoglobin [17]. Although blood cyanide levels in healthy subjects are sub-micromolar, toxic or fatal blood concentrations are higher than 1.08 μg mL−1 but concentrations in survivors can exceed 5 μg mL−1, while values exceeding 10 μg mL−1 have been recorded from fatalities. Accidental cyanide exposure contributes to 80% of fire-related deaths [53]. Within a few seconds of ignition of the fire, carbon monoxide and hydrogen cyanide concentrations may increase dramatically while oxygen levels in the room decrease [56]. In numerous cases of smoke inhalation, hydrogen cyanide has increasingly been recognized as an important toxicant [11,57,58]. Nevertheless, the diagnosis of cyanide poisoning is still difficult and failure to recognize it can lead to misdiagnosis.
Kaita et al. (2018) reported that some fire victims had HCN concentrations above the lethal dose of 3 μg mL−1, whereas two of three patients who had an HCN concentration above the lethal level had COHb levels under 50%. These authors considered that cardiac arrest might have been cyanide induced [13].
Stoll et al. (2017) reported concentrations of HCN between 0.5 μg mL−1 and 2.0 μg mL−1, while the COHb levels of the blood samples of 12 fire victims were measured to be between 15–40% [8].
Medicines for HCN poisoning of fire victims should only be administered based on clinical diagnosis [59]. Oxygen and a recommended antidote, such as hydroxycobalamin, which has few side effects, should be administered immediately to reduce cellular hypoxia and eliminate HCN [17,60].

5. Conclusions

Sample preparation and analysis of hydrogen cyanide in the blood samples of fire victims based on the kinetics of the ninhydrin reaction in the presence of cyanide following the microdistillation of free and metabolized cyanide was investigated. The cyanide ion captured in alkaline absorbent after distillation at 40 °C in the presence of 20% phosphoric acid was determined spectrophotometrically at 493 nm. HCN metabolized to thiocyanate ions was recovered using a potassium permanganate solution. The kinetics of cyanide reaction with ninhydrin have not previously been fully investigated. We studied the specificity of kinetic curves and reached the conclusion that kinetic measurements may improve cyanide determination in blood. A close relationship between the slope of the kinetic curve and the cyanide concentration in blood samples was calculated. The concentration dependence on the slope values was linear in the range from 0.04 μg mL−1 to 1.08 μg mL−1 HCN. A relatively high recovery that varied between 75% and 85%, depending on the experimental conditions, demonstrated the efficiency of microdistillation. The results obtained using the slope values were in agreement with those of the method of determining cyanides at a fixed time of 15 min as well as with those of the chloramine-T/barbituric acid–pyridine method with no statistically significant difference at 95% confidence level. The developed analytical method is simple, selective, and sensitive enough for the rapid determination of blood HCN in clinical and forensic toxicology. This analytical protocol was used in clinical studies for measuring HCN free and total concentrations.

Author Contributions

Conceptualization and methodology, G.D., D.T. and D.B.I.; software, validation, and formal analysis, G.D. and D.T.; investigation, resources, and data curation, G.D., D.T., D.B.I. and M.B.; writing—original draft preparation, G.D. and D.T.; writing—review and editing, G.D., D.B.I., M.B. and D.T.; visualization, supervision, project administration, and funding acquisition, M.M.D., S.I.T., D.B.I. and M.M.D. All authors have read and agreed to the published version of the manuscript.

Funding

This research received no external funding.

Institutional Review Board Statement

The study was conducted according to the guidelines of the Declaration of Helsinki, and approved by the Ethics Committee of Transilvania University of Brasov (4/26.02.2020) and “Grigore T. Popa” University of Medicine and Pharmacy Iasi (2182/27.01.2020).

Informed Consent Statement

Informed consent was obtained from all subjects involved in the study.

Data Availability Statement

Not applicable.

Acknowledgments

We thank our colleagues and their partner institutions for providing information, resources, and expertise that have greatly helped our research. The authors are grateful to Transilvania University of Brasov, Romania, for the financial support given for publication.

Conflicts of Interest

The authors declare no conflict of interest.

References

  1. Son, M.H.; Kim, Y.; Jo, Y.H.; Kwon, M. Assessment of chemical asphyxia caused by toxic gases generated from rigid polyurethane foam (RPUF) fires. Forensic Sci. Int. 2021, 328, 111011. [Google Scholar] [CrossRef] [PubMed]
  2. Manila, D.P. Hydrogen cyanide: Risk assessment, environmental, and health hazard. In Hazardous Gases Risk Assessment on the Environment and Human Health; Academic Press: Cambridge, MA, USA, 2021; pp. 183–195. [Google Scholar]
  3. Lulea, D.M.; Iordache, V.; Nastase, I. Numerical model development of the air temperature variation in a room set on fire for different ventilation scenarios. Appl. Sci. 2021, 11, 11698. [Google Scholar] [CrossRef]
  4. Ma, K.H.; Lippner, D.S.; Basi, K.A.; DeLeon, S.M.; Cappuccio, W.R.; Rhoomes, M.O.; Hildenberger, D.M.; Hoard-Fruchey, H.M.; Rockwood, G.A. Cyanide poisoning compromises gene pathways modulating cardiac injury in vivo. Chem. Res. Toxicol. 2021, 34, 1530–1541. [Google Scholar] [CrossRef] [PubMed]
  5. Wyman, J.L.; Understanding Cyanide Toxicity in Victims of Smoke Inhalation. Doctor of Nursing Practice Capstone Projects 56. 2021. Available online: https://encompass.eku.edu/dnpcapstones/59/ (accessed on 30 December 2021).
  6. McAllister, J.; Kunsman, G.W.; Levine, B.S. Carbon monoxide/cyanide. In Principles of Forensic Toxicology; Springer: Cham, Switzerland, 2020; pp. 545–560. [Google Scholar]
  7. Loke, J.; Matthay, R.A.; Smith, G.W. The toxic environment and its medical implications with special emphasis on smoke inhalation. In Pathophysiology and Treatment of Inhalation Injuries; CRC Press: Boca Raton, FL, USA, 2020; pp. 453–504. [Google Scholar]
  8. Stoll, S.; Roider, G.; Keil, W. Concentrations of cyanide in blood samples of corpses after smoke inhalation of varying origin. Int. J. Legal Med. 2017, 131, 123–129. [Google Scholar] [CrossRef]
  9. Lawson-Smith, P.; Jansen, E.C.; Hyldegaard, O. Cyanide intoxication as part of smoke inhalation-a review on diagnosis and treatment from the emergency perspective. Scand. J. Trauma Resusc. Emerg. Med. 2011, 19, 14. [Google Scholar] [CrossRef] [Green Version]
  10. Haikonen, K. Fire-Related Injuries and Their Burden in Finland 2000–2010. Ph.D. Thesis, University of Helsinki, Helsinki, Finland, 2020. [Google Scholar]
  11. Anseeuw, K.; Delvau, N.; Burillo-Putze, G.; De Iaco, F.; Geldner, G.; Holmström, P.; Yves, L.; Sabbe, M. Cyanide poisoning by fire smoke inhalation: A European expert consensus. Eur. J. Emerg. Med. 2013, 20, 2–9. [Google Scholar] [CrossRef]
  12. Giebułtowicz, J.; Rużycka, M.; Wroczyński, P.; Purser, D.A.; Stec, A.A. Analysis of fire deaths in Poland and influence of smoke toxicity. Forensic Sci. Int. 2017, 277, 77–87. [Google Scholar] [CrossRef]
  13. Kaita, Y.; Tarui, T.; Shoji, T.; Miyauchi, H.; Yamaguchi, Y. Cyanide poisoning is a possible cause of cardiac arrest among fire victims, and empiric antidote treatment may improve outcomes. Am. J. Emerg. Med. 2018, 36, 851–853. [Google Scholar] [CrossRef]
  14. Tabian, D.; Drochioiu, G.; Damian, S.I.; Girlescu, N.; Toma Gradinaru, O.; Toma, S.I.; Bulgaru Iliescu, D. Toxic blood hydrogen cyanide concentration as a vital sign of a deceased room fire victim—Case report. Toxics 2021, 9, 36. [Google Scholar] [CrossRef]
  15. Haque, M.R.; Bradbury, J.H. Simple method for determination of thiocyanate in urine. Clin. Chem. 1999, 45, 1459–1464. [Google Scholar] [CrossRef] [Green Version]
  16. Fonollosa, J.; Solórzano, A.; Marco, S. Chemical sensor systems and associated algorithms for fire detection: A review. Sensors 2018, 18, 553. [Google Scholar] [CrossRef] [Green Version]
  17. Lindsay, A.E.; Greenbaum, A.R.; O’Hare, D. Analytical techniques for cyanide in blood and published blood cyanide concentrations from healthy subjects and fire victims. Anal. Chim. Acta 2004, 511, 185–195. [Google Scholar] [CrossRef]
  18. Odoul, M.; Fouillet, B.; Nouri, B.; Chambon, R.; Chambon, P. Specific determination of cyanide in blood by headspace gas chromatography. J. Anal. Toxicol. 1994, 18, 205–207. [Google Scholar] [CrossRef]
  19. Darr, R.W.; Capson, T.L.; Hileman, F.D. Determination of hydrogen cyanide in blood using gas chromatography with alkali thermionic detection. Anal. Chem. 1980, 52, 1379–1381. [Google Scholar] [CrossRef]
  20. Kaur, P.; Upadhyay, S.; Gupta, V.K. Spectrophotometric determination of hydrogen cyanide in air and biological fluids. Analyst 1987, 112, 1681–1683. [Google Scholar] [CrossRef]
  21. Ma, J.; Dasgupta, P.K. Recent developments in cyanide detection: A review. Anal. Chim. Acta 2010, 673, 117–125. [Google Scholar] [CrossRef] [Green Version]
  22. Lindsay, A.E.; O’Hare, D. The development of an electrochemical sensor for the determination of cyanide in physiological solutions. Anal. Chim. Acta 2006, 558, 158–163. [Google Scholar] [CrossRef]
  23. Sundermann, T.R.; Schmitt, G.; Bartel, M. Modified congener analysis: Quantification of cyanide in whole blood, other body fluids, and diverse beverages. Drug Test. Anal. 2021, 13, 412–418. [Google Scholar] [CrossRef]
  24. Frison, G.; Zancanaro, F.; Favretto, D.; Ferrara, S.D. An improved method for cyanide determination in blood using solid-phase microextraction and gas chromatography/mass spectrometry. Rapid Commun. Mass Spectrom. 2006, 20, 2932–2938. [Google Scholar] [CrossRef]
  25. Murphy, K.E.; Schantz, M.M.; Butler, T.A.; Benner, B.A., Jr.; Wood, L.J.; Turk, G.C. Determination of cyanide in blood by isotope-dilution gas chromatography–mass spectrometry. Clin. Chem. 2006, 52, 458–467. [Google Scholar] [CrossRef] [Green Version]
  26. Meng, L.; Liu, X.; Wang, B.; Shen, G.; Wang, Z.; Guo, M. Simultaneous derivatization and extraction of free cyanide in biological samples with home-made hollow fiber-protected headspace liquid-phase microextraction followed by capillary electrophoresis with UV detection. J. Chromatogr. B 2009, 877, 3645–3651. [Google Scholar] [CrossRef] [PubMed]
  27. Velasco, A.; Silva, M.; Valcarcel, M. Kinetic spectrophotometric determination of nanogram amounts of cyanide. Talanta 1991, 38, 303–308. [Google Scholar] [CrossRef]
  28. Abbasi, S.; Valinezhad, R.; Khani, H. A novel kinetic spectrophotometric method for the determination of ultra-trace amount of cyanide. Spectrochim. Acta A 2010, 77, 112–116. [Google Scholar] [CrossRef] [PubMed]
  29. Themelis, D.G.; Karastogianni, S.C.; Tzanavaras, P.D. Selective determination of cyanides by gas diffusion-stopped flow-sequential injection analysis and an on-line standard addition approach. Anal. Chim. Acta 2009, 632, 93–100. [Google Scholar] [CrossRef]
  30. Jain, A.; Pillai, A.K.; Sharma, N.; Verma, K.K. Headspace single-drop microextraction and cuvetteless microspectrophotometry for the selective determination of free and total cyanide involving reaction with ninhydrin. Talanta 2010, 82, 758–765. [Google Scholar] [CrossRef]
  31. Santelli, R.E.; Micelli, A.S.; de Carvalho, M.D.F.B. Automated flow injection method for monitoring total cyanide concentration in petroleum refinery effluents using ninhydrin as color reagent. Spectrosc. Lett. 2006, 39, 605–618. [Google Scholar] [CrossRef]
  32. Surleva, A.; Zaharia, M.; Ion, L.; Gradinaru, R.V.; Drochioiu, G.; Mangalagiu, I. Ninhydrin-based spectrophotometric assays of trace cyanide. Acta Chem. IASI 2013, 21, 57–70. [Google Scholar] [CrossRef] [Green Version]
  33. Mihaescu, I.M.; Drochioiu, G. Cyanide reaction with ninhydrin: The effect of pH changes and UV-Vis radiation upon the analytical results. Rev. Roum. Chim. 2009, 54, 841–945. [Google Scholar]
  34. Mihaescu, I. Cyanide determination with a modified ninhydrin reagent using N-acetyl cysteine in the presence of heavy metal ions. J. Chil. Chem. Soc. 2010, 55, 467–468. [Google Scholar] [CrossRef] [Green Version]
  35. Nagaraja, P.; Kumar, M.S.H.; Yathirajan, H.S.; Prakash, J.S. Novel sensitive spectrophotometric method for the trace determination of cyanide in industrial effluent. Anal. Sci. 2002, 18, 1027–1030. [Google Scholar] [CrossRef] [Green Version]
  36. Sulistyarti, H.; Mulyasuryani, A.; Sabarudin, A.; Rumhayati, B.; Cahyani, Y.D.; Atikaningsih, R.A. Thiocyanate determination using technique of flow injection-gas diffusion spectrophotometry with cerium (IV)-ninhydrin reagent. IOP Conf. Ser. Mater. Sci. Eng. 2019, 546, 032030. [Google Scholar] [CrossRef]
  37. Tabian, D.; Bulgaru Iliescu, D.; Iov, T.; Barna, B.; Toma, S.I.; Drochioiu, G. Hydrogen cyanide and carboxyhemoglobin assessment in an open space fire-related fatality. J. Forensic Sci. 2021, 66, 1171–1175. [Google Scholar] [CrossRef]
  38. Surleva, A.; Drochioiu, G. A modified ninhydrin micro-assay for determination of total cyanogens in plants. Food Chem. 2013, 141, 2788–2794. [Google Scholar] [CrossRef]
  39. McAllister, J.L.; Roby, R.J.; Levine, B.; Purser, D. Stability of cyanide in cadavers and in postmortem stored tissue specimens: A review. J. Anal. Toxicol. 2008, 32, 612–620. [Google Scholar] [CrossRef] [Green Version]
  40. McAllister, J.L.; Roby, R.J.; Levine, B.; Purser, D. The effect of sodium fluoride on the stability of cyanide in postmortem blood samples from fire victims. Forensic Sci. Int. 2011, 209, 29–33. [Google Scholar] [CrossRef]
  41. Afkhami, A.; Sarlak, N.; Zarei, A.R. Simultaneous kinetic spectrophotometric determination of cyanide and thiocyanate using the partial least squares (PLS) regression. Talanta 2007, 71, 893–899. [Google Scholar] [CrossRef]
  42. Khatha, P.; Phutthaphongloet, T.; Timpa, P.; Ninwong, B.; Income, K.; Ratnarathorn, N.; Dungchai, W. Distance-based paper device combined with headspace extraction for determination of cyanide. Sensors 2019, 19, 2340. [Google Scholar] [CrossRef] [Green Version]
  43. Tracqui, A.; Raul, J.S.; Geraut, A.; Berthelon, L.; Ludes, B. Determination of blood cyanide by HPLC-MS. J. Anal. Toxicol. 2002, 26, 144–148. [Google Scholar] [CrossRef] [Green Version]
  44. Volmer, W.; Giesselmann, G. Simplifying cyanide analysis with microdistillation. Am. Lab. 2000, 32, 18–22. [Google Scholar]
  45. Parmar, P.; Pillai, A.K.; Gupta, V.K. Rapid spectrophotometric determination of trace amounts of cyanide and hydrogen cyanide using p-aminoacetanilide in various samples. J. Korean Chem. Soc. 2010, 54, 165–168. [Google Scholar] [CrossRef]
  46. Tucker, R.B.; Graham, B.F.; Mason, V.A. Cyanide levels in fire victims as determined by a simple microdiffusion procedure. Can. Soc. Forensic Sci. J. 1978, 11, 251–256. [Google Scholar] [CrossRef]
  47. Dumas, P.; Gingras, G.; LeBlanc, A. Isotope dilution-mass spectrometry determination of blood cyanide by headspace gas chromatography. J. Anal. Toxicol. 2005, 29, 71–75. [Google Scholar] [CrossRef] [Green Version]
  48. Seto, Y.; Tsunoda, N.; Ohta, H.; Shinohara, T. Determination of blood cyanide by headspace gas chromatography with nitrogen-phosphorus detection and using a megabore capillary column. Anal. Chim. Acta 1993, 276, 247–259. [Google Scholar] [CrossRef]
  49. Gambaro, V.; Arnoldi, S.; Casagni, E.; Dell’Acqua, L.; Pecoraro, C.; Froldi, R. Blood cyanide determination in two cases of fatal intoxication: Comparison between headspace gas chromatography and a spectrophotometric method. J. Forensic Sci. 2007, 52, 1401–1404. [Google Scholar] [CrossRef]
  50. Sim, J.; Kim, M.; Kim, S.; Yang, W. A novel method for cyanide quantification in human whole blood using ion chromatography with amperometric detection and its application to cyanide intoxication cases. J. Forensic Sci. 2021, 67, 353–357. [Google Scholar] [CrossRef]
  51. Swezey, R.; Shinn, W.; Green, C.; Drover, D.R.; Hammer, G.B.; Schulman, S.R.; Zajicek, A.; Jett, D.A.; Boss, G.R. Comparison of a new cobinamide-based method to a standard laboratory method for measuring cyanide in human blood. J. Anal. Toxicol. 2013, 37, 382–385. [Google Scholar] [CrossRef] [PubMed] [Green Version]
  52. Wachełko, O.; Chłopaś-Konowałek, A.; Zawadzki, M.; Szpot, P. Old poison, new problem: Cyanide fatal intoxications associated with internet shopping. J. Anal. Toxicol. 2021, 2021, bkab039. [Google Scholar] [CrossRef]
  53. Silverman, S.H.; Purdue, G.F.; Hunt, J.L.; Bost, R.O. Cyanide toxicity in burned patients. J. Trauma 1988, 28, 171–176. [Google Scholar] [CrossRef]
  54. Drochioiu, G.; Mangalagiu, I.; Avram, E.; Popa, K.; Dirtu, A.C.; Druta, I. Cyanide reaction with ninhydrin: Evaluation of interference and mechanisms. Anal. Sci. 2004, 20, 1443–1447. [Google Scholar] [CrossRef] [Green Version]
  55. Verma, A.K.; Gupta, V.K. Spectrophotometric determination of cyanide and hydrogen cyanide using p-amino benzoic acid as a new reagent and its application in steel industries. Asian J. Chem. 1996, 8, 613. [Google Scholar]
  56. Harris, D.; Davis, A.; Ryan, P.B.; Cohen, J.; Gandhi, P.; Dubiel, D.; Black, M. Chemical exposure and flammability risks of upholstered furniture. Fire Mater. 2021, 45, 167–180. [Google Scholar] [CrossRef]
  57. Jackson, R.; Logue, B.A. A review of rapid and field-portable analytical techniques for the diagnosis of cyanide exposure. Anal. Chim. Acta 2017, 960, 18–39. [Google Scholar] [CrossRef]
  58. Isenschmid, D.S.; Levine, B. Principles of Forensic Toxicology; AACC Press: Washington, DC, USA, 2013; pp. 293–316. [Google Scholar]
  59. Saeed, F.S.; Al Bashit, A.; Viswanathan, V.; Valles, D. An initial machine learning-based victim’s scream detection analysis for burning sites. Appl. Sci. 2021, 11, 8425. [Google Scholar] [CrossRef]
  60. Davies, V.; Turner, J.; Greenway, M. Toxic inhalational injury. BMJ Case Rep. 2020, 13, e232875. [Google Scholar] [CrossRef]
Figure 1. Determination of the maximum absorption of KCN that reacts with the ninhydrin reagent. The absorption spectrum was measured 20 min after mixing (a) 100 μL of 2.6 μg mL−1 KCN and (b) 100 μL of 1 μg mL−1 KCN with 1 mL of ninhydrin reagent at 25 °C in 1 cm quartz cuvettes.
Applsci 12 02329 g001
Figure 2. Calibration curve for cyanide determination: relationship between the absorbance of ninhydrin reagent at 493 nm and the cyanide concentration.
Applsci 12 02329 g002
Figure 3. Linear and polynomial shape of the calibration curve: (a) linear calibration curve in the range of 0.26 μg mL−1 to 2.6 μg mL−1, which is of interest for the determination of HCN in the blood; (b) better results with a calibration curve of the polynomial form in the concentration range of 0–2.6 μg mL−1.
Applsci 12 02329 g003
Figure 4. Kinetics of the reaction of cyanide with ninhydrin reagent at 493 nm: (a) reference: no cyanide sample; (b) kinetics of KCN reaction with ninhydrin (0.1 mL of 2.6 μg mL−1 KCN + 1 mL of 5 mg mL−1 ninhydrin reagent); (c) the same experiment as described in (b) but performed the next day; and (d) head-space sampling of HCN: 0.1 mL of vapors containing HCN liberated in the Conway vial at 40 °C for 30 min was bubbled in 100 μL of 2.6 μg mL−1 KCN solution, then 1 mL of ninhydrin reagent was added.
Applsci 12 02329 g004
Figure 5. Relationship between the slope of the kinetic curve and the cyanide concentration (μg mL−1 KCN).
Applsci 12 02329 g005
Figure 6. Calibration curves in the cyanide determination by the spectrophotometric method with chloramine T and by the kinetic spectrophotometric method with ninhydrin (a). The close correlation relationship between the values for absorbance (standard method) and the slope in the kinetic measurements (b).
Applsci 12 02329 g006
Table 1. Data for plotting the calibration curve shown in Figure 2b and an example of the calculation of the HCN concentration in the blood of a fire victim (M.L., D1, and D2 being duplicates 1 and 2). * Potassium cyanide concentrations (μg mL−1) used to produce the absorbance values at 493 nm after 20 min from reagent mixing; ** Concentration of KCN determined from the calibration curve, according to the following equation: CKCN = 1.5525 A + 0.3886, where A is the absorbance at 493 nm.
SampleKCN, * μg·mL−1Absorbance 493 nmKCN, ** μg·mL−1
00.000.0000.2676
10.260.0900.4283
20.520.1460.6152
30.780.2190.7385
41.040.3510.9535
51.300.5871.2999
61.560.8021.6233
71.820.9921.8926
82.081.0492.0617
92.341.2132.2717
102.601.4322.6117
Sample 3, D1 (M.L.)-1.2752.3680
Sample 3, D2 (M.L.)-1.3892.5450
Table 2. The HCN concentration in the blood of a fire victim (M.L., D1, and D2 being duplicates 1 and 2). ** Concentration of KCN determined from the calibration curve, according to the following equation: CKCN = 1.5525 A + 0.3886, where A is the absorbance at 493 nm; *** Quantity of KCN in 0.5 mL of blood used in measurements; **** Quantity of HCN in 0.5 mL of blood; and ***** Concentration of HCN in blood.
SampleAbsorbance 493 nmKCN, ** μg·mL−1KCN μg/0.5 mL of Blood ***HCN, μg/0.5 mL of Blood ****HCN, μg/mL of Blood *****
Sample 3, D1 (M.L.)1.2752.36803.68361.53013.0602
Sample 3, D2 (M.L.)1.3892.54503.95891.64443.2890
Average3.1746
Table 3. Data for plotting the calibration curves at different reaction time intervals.
Volume of KCN Solution (μL)KCN Concentration (μg mL−1)Read Time (min) and the Wavelength (nm)
10; 49320; 49330; 49350; 49315; 485
100.150.004−0.009−0.006−0.002−0.003
200.300.1880.1590.1330.0590.123
300.450.3420.3320.3170.2660.286
400.600.5070.4640.3900.3530.390
500.750.6480.7320.7310.6500.628
600.900.7600.7940.7920.6800.688
701.050.9020.9440.8940.8890.811
801.201.1961.2201.2911.1821.111
901.351.4821.4911.4711.4441.338
1001.501.4741.5291.5221.4621.361
Publisher’s Note: MDPI stays neutral with regard to jurisdictional claims in published maps and institutional affiliations.

