Abstract
Aqueous electrochemical flow capacitors (EFCs) have demonstrated high-power capabilities and safety at low cost, making them promising energy storage devices for grid applications. A primary performance metric of an EFC is the steady-state electrical current density it can accept or deliver. Performance prediction, design improvements, and up-scaling are areas in which modeling can be useful. In this paper, a novel stochastic superparticle (SP) modeling approach was developed and applied to study the charging of carbon electrodes in the EFC system, using computational superparticles representing real carbon particles. The model estimated the exact values of significant operating parameters of an EFC, such as the number of particles in the flow channel and the number of electrolytic ions per carbon particle. Optimized model parameters were applied to three geometrical designs of an EFC to estimate their performance. The modeling approach allowed study of the charge per carbon particle to form the electric double-layer structure. The linear relationship between the concentration of SPs and the ionic charge was observed when optimized at a constant voltage of 0.75 V. The simulation results are in excellent agreement with experimental data, providing a deep insight into the performance of an EFC and identifying limiting parameters for both engineers and material scientists to consider.
1. Introduction
Flowable electrodes (FEs) or semi-solid electrodes have received significant interest for large-scale applications such as wastewater treatment, seawater desalination, and grid-scale energy storage systems. FE is a material system comprising an active material (electrode) suspended in an electrolyte solution. Advanced technologies such as redox flow batteries [1,2], fuel cells [3,4,5], and electrochemical flow capacitors (EFCs) [6] use FEs to improve the scalability limitations of electrochemical energy storage. In such systems, the continuous flow of semi-solid electrodes provides the cell’s steady charge capacity when the uncharged slurry is provided as input [7].
In principle, the charge storage in FE systems originates because of different mechanisms such as electric double-layer formation and faradic reactions [6,8], surface redox reactions [9,10], intercalation [11], polymer redox [12,13], and hybrid mechanisms [14,15]. The operating performance of the FEs relies on support from the diffusion of the ions [16], electronic charge in and out of the pores via a particle-current collector, particle–particle interactions [17], and the formation of the electrical double layer (EDL) at the pore surface [18,19]. Under the mild flow condition, the suspended electrode particles and their mutual interaction establish a dynamically varying physical contact for charge transport through the bulk material. Thus, the particle–particle interaction becomes indispensable for the charging/discharging of FEs [20,21,22]. A major challenge for FE applications is the accurate prediction of rheological and electrical properties of suspended electrodes [23,24]. Low electrical conductivity and high cell resistance are the attributes of a high electrolyte concentration compared with the electrode. However, the conductivity can be improved by using a conductive additive [25], optimizing particle size and shape [26], and utilizing a finely dispersed suspension [27].
The design of the EFC cell is critically important to facilitate the FEs (i.e., mitigate clogging) and maximize system performance. A reduction in ohmic losses can be achieved by using shallow channel geometry and supporting the free passage of the FEs without clogging. The design of EFC is also dependent on the properties of the FEs used for capacitive storage. In particular, the concentration of electrode particles, particle size/shape, and carrier-fluid (electrolyte) viscosity have a significant effect on the performance of the FEs and can be altered to obtain improvements in rheological and electrochemical properties for enhanced slurry flow and EFC performance [6]. The charge is stored by forming an electric double layer at the interface of the highly porous electrode and the surrounding electrolyte. Once charged, the FE is pumped into ionically and electronically isolated external reservoirs, where it is held until the stored energy is needed to be recovered (Figure 1).
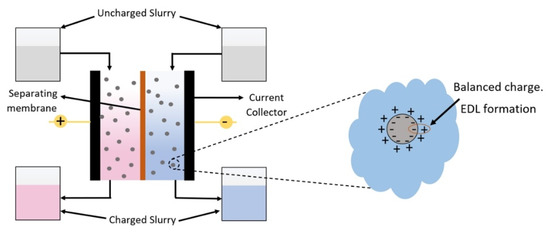
Figure 1.
Schematic architecture of an EFC for charging slurry by EDL formation.
Previous investigations showing the low-current-density operations of an EFC required a better understanding of the relationships between slurry properties, preparation protocols, operating mode, and device design improvements [6,28]. For instance, slurry preparation by stir-bar and turbo-shear mixing methods was used to study the mixing effects on the non-additive slurry compositions and those containing multi-walled carbon nanotubes (MWCNTs). When more time was allowed for mixing, the electrical conductivity of the FE improved by up to 57% [27]. Additional studies showed that the electronic conductivity of FE relies on the particles’ direct physical contact or the surface-to-surface hopping mechanism of electrons [21,28], and the conductivity was improved through redox-active mediators [29] or high-salt-concentration aqueous electrolytes [30]. Furthermore, a biphasic suspension electrode at 20% vol of active material (LiFePO4) was found to customize the interactions between the active and conducting particles and improve flowability and electronic conductivity [31]. Finally, energy stored in an all-iron flow battery using MWCNT slurry (both positive and negative) electrodes exhibited an improved state-of-charge at current densities higher than 200 mA cm−2 [32].
Mathematical modeling and numerical simulations of electrochemical energy systems such as redox flow batteries and supercapacitors play vital roles in design improvements and performance estimation. Newman’s porous electrode theory [33,34] predicts the electrodes’ adsorption capacity connected with EDL charging and the interfacial area of electrode per unit volume. The active mass transport of electrodes and electrolytes in the FEs corresponds to the diffusion, migration, and convection processes without affecting electroneutrality [35]. Continuum theory is mainly used to investigate the electrode–electrolyte interface, porous material theories, and geometrical effects on the device’s performance.
However, in such an approach, the interface is considered a continuous phase, having numerous challenges, including false numerical diffusion [36] and accurate consideration of the particle shape [37,38,39], chemical reactions at the surface [40], and interactive forces such as the Brownian and drag forces [41,42]. The standard Poisson–Nernst–Planck model simulates the effect of spherical particle size on the interactive forces at a water–oil interface [43]. Particles at close proximity and their geometries determine the localized interaction forces since the particle can distort the electric field around it [43]. The Stokesian simulation model predicts the effect of particle concentration and the ratio of the particle charging time to interaction time for cluster formation and improvement in electric conductivity [44]. The particle–particle interaction driven by the electric field contributes to the dielectrophoretic interaction near the particle surface and forms connection chains depending upon the concentration of the particles [45].
The role of computational fluid dynamics (CFD) to predict carbon-loaded FEs hydrodynamics has increased considerably. The calculation of charge redistribution and interactive forces between particles is a time-consuming CFD simulation, considering the large number of particles in the system. Particle-in-cell is a common approach to studying the high-particle-count behavior by considering a large computational superparticle (SP) representing thousands of real particles [46,47,48].
The present work investigates the charging of slurry electrodes in an EFC device using a novel stochastic particle model. The model uses the computational superparticle as a basic unit, predicting the dynamic behavior of real carbon particles in the background fluid (water). Furthermore, the mathematical model is optimized based on critical parameters of the model, and their sensitivity is validated against experimental measurements of the EFC device. The model also allows observing the dynamics of SPs charging in both flow channels side by side. The aim is to improve the working understanding and estimate the efficiency of EFCs, capacitive deionization, and similar systems.
2. Experimental Study
2.1. EFC Prototype and Slurry Preparation
The slurry used in this study consists of activated carbon black (Vulcan XC 72R) in an aqueous electrolyte. First, 5 mg/mL carbon black was suspended in 0.1M aqueous electrolyte. The prepared slurry was used in a symmetric EFC cell made of two Teflon supports with grooved stainless-steel tubes as flow channels and pre-installed gaskets to avoid leakage and support the membrane [49]. The flow channel was 5 mm wide and 120 mm long. The flow rate of slurry through the cell was adjusted using a peristaltic pump. The slurry was charged in EFC flow channels and then collected in separate containers during operation. The slurry could be pumped back into the electrochemical cell from these containers, where the material could be fully discharged for energy recovery. The experimental setup for charging the flow electrode in EFC cell is shown in Figure 2a.
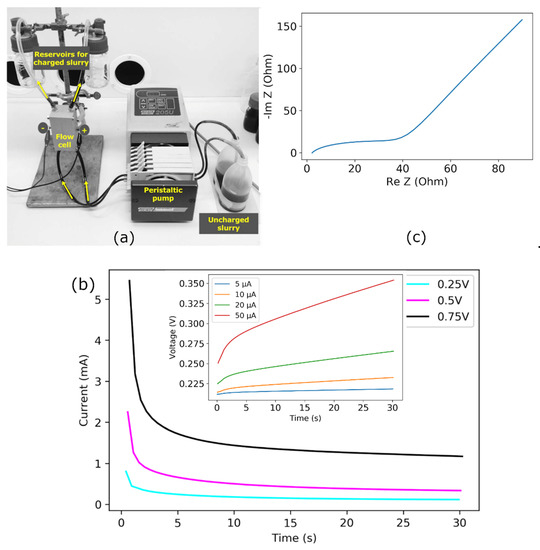
Figure 2.
(a) Photograph of flow capacitor cell and experimental set-up for charging [49]. (b) Potentiostatic measurements at constant voltages of 0.25, 0.5, and 0.75 V and (inset) at constant currents of 5, 10, 20, and 50 µA. (c) Nyquist plot for carbon slurry in 0.1 M .
2.2. Characterization of the Slurry Performance
The prepared slurry was characterized using a VSP potentiostat/galvanostat (Biologic) in a two-electrode configuration. The charging current of the slurry in the EFC with minimum faradic contribution was measured based on current and voltage efficiencies in the voltage and current control modes, as shown in Figure 2b. Of note, the current measured at a constant applied voltage was used later to examine the suitability of the modeling setup.
The increase in potential was observed as a function of time at the constant current applications of 5, 10, 20, and 50 µA. These potential curves are distorted lines with decreasing slopes. For the applied current of 5 µA, the voltage rises initially and stays nearly constant after 4 s. At the applied current of 10 µA and greater, the voltages gradually rise once the initial steady value is achieved. The early steady-state period at lower currents indicated the charging was complete. For the higher currents, the delay of the steady-state period showed that more time was needed to complete the charging of the slurry electrodes. The maximum voltage achieved in charging at the constant current of 5 µA was significantly less than the voltage obtained from the 50 µA measurement (Figure 2b inset). The Nyquist plot obtained by electrochemical impedance spectroscopy (EIS) measures the relationship between the current and applied potential difference in the frequency domain, as shown in Figure 2c. The higher frequency regime represents a low faradic charging resistance with a short arc. The low resistance indicates the availability of electroactive surface area attributed to the surface area of suspended carbon electrodes. The inclined line in EIS following the low frequency represents the capacitive charge storage on the carbon electrode [50].
3. Theoretical Model Description
The modeling approach adopted for FE charging in EFC geometry takes the physical properties of carbon electrodes into account, such as size/shape, particle volume fraction, and concentration. Approximately 1.8 × 10¹⁷ carbon particles were in 1 cm3 of the slurry electrode. Solving the differential equations simultaneously for time, three-dimensional position, and distribution in such a dense system of nano-particles would be costly. For a more efficient simulation, the concept of a superparticle representing many real particles weakly interacting at overlapping distances was applied. The building block of the model is not of single particles but rather of collective clouds: each computational particle (defined as a superparticle) represents a group of particles that can be visualized as a small piece of phase space. This particle-based model was developed to study the dense particle concentration by following each particle’s trajectory using Newton’s law of motion [51]. In addition, this method allows the rescaling of the number of particles because the Lorentz force’s acceleration depends only on the charge-to-mass ratio so that each superparticle follows the same trajectory as a real carbon particle. The SP diameter should be smaller than the width of the flow channel and several orders larger than the size of carbon particles. Figure 3 shows the main idea, depicting the lumping of several real particles into a distribution of superparticles. Due to stochastic nature of the model, the main advantage of such an approach is its capacity to add arbitrary random and fluctuating side reactions or forces to the simulation.
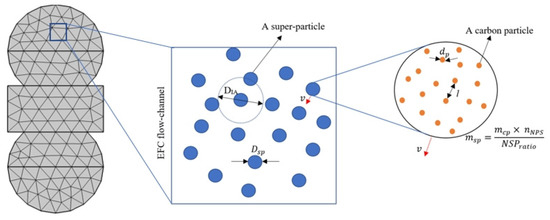
Figure 3.
Schematics of carbon particles and the SP system for parameters representation (not to scale).
The method solves second-order ordinary differential equations for the components of each superparticle position. The conservation of linear momentum of each superparticle (SP) takes the familiar form of Newton’s second law of motion as
where is the mass of the individual SP and is its velocity. Generally, the total force acting on the particles can be divided into two categories, those due to external fields (electric field or magnetic field) and due to interactions between particles. It can be a combination of drag (subjected to the velocity of the particle), dielectrophoretic (particle under the influence of electric field), and Brownian (imbalanced collision of particles) forces, among others, depending on the requirement of the system under study. The Brownian movement at the microscale is negligible [52], and the drag and dielectrophoretic forces for spherical particles located in an infinite medium without any neighboring particle are of the order of , which is considered ineffective for such systems [53]. Thus, momentum Equation (1) gives the force on each particle to track the motion of computational superparticles.
Using the finite element method, the flow channel’s continuous domain was divided into a mesh of discrete elements. The position of an SP released in the channel is given by , and the respective velocity at a specific location is given as . The force on the SP in the background fluid, e.g., water is given by Equation (1). The trajectories of individual particles are always solved in the time domain. At each time step taken by the solver, the force acting on each particle is queried at the current particle position. During each time step, the particles may interact with boundaries in the geometry, or they may be subjected to other phenomena that can discontinuously change the particle velocity. The mesh boundaries not parallel to each another alter the velocity magnitude and direction. After the collision event, the velocity of the SP must be reinitialized by sampling the velocity of the background fluid at random from the drifting Maxwellian distribution given by
where is the Boltzmann constant, and K is the temperature in Kelvin. The total mass of superparticles was equal to the total mass of spherical carbon particles in the experimental slurry [49,54]. The motion of superparticles was responsible for the physical charge redistribution, which occurred in two ways. First, a neutral superparticle would experience diffuse scattering by the outer wall of the flow channel and gain a unit charge. Later, this charge would be transferred/distributed homogenously to the neighboring SPs in the interaction range.
The activated carbon black used as an electrode in the slurry had an average particle size of 50 nm and a bulk density of 96.11 kg/m3. The slurry comprised 1.80 1014 carbon particles per mm3 at an estimated distance apart of 17 nm and 1.80 1014 electrolytic ions available per mm3, resulting in approximately one ion per carbon particle free to adsorb on the carbon surface. With the high number density of carbon, the COMSOL Multiphysics particle tracing module was customized to track particle motion under the influence of momentum force. The SP size was influenced by the physical properties of carbon particles and the volume V of the electrode flowing channel. The total number of SPs, needed in the flow channel can be approximated as
where L is the length of the flow channel, VSP is the volume of the SP, and DSP is the SP diameter. Theoretically, the number of carbon particles in an SP can be estimated by using the and volume of a single carbon particle :
The total mass of the SP is dependent on the mass of carbon and :
where is the ratio of the total number of SPs needed in the system, , to the number of SPs actually used in a flow channel of the model.
Each SP, carrying thousands of carbon particles, moves around in the flow channel and obtains surface charge while scattering from the current collector (CC) [55]. After this particle–boundary wall interaction, the force caused by the momentum exchange between neutral SPs and the current-collector surface is large enough to move SPs away from the CC. Since the SP velocity vector is discretely changing in each time step crossing the boundary, it must be reinitialized to the velocity of SP in the previous boundary. This reinitialization condition is set for the size of the domain comparable to the diameter of SP itself.
In the positive flow channel, when the neutral SPs scatter from the CC boundary, they obtain the charge, representing the sodium ion () being adsorbed on the carbon particle. Similarly, in the negative flow channel, the carbon particle adsorbs the surface charge, representing sulfate ion (). The SP charging scheme at the boundary and charge distribution within the interaction range is given in Figure 4.
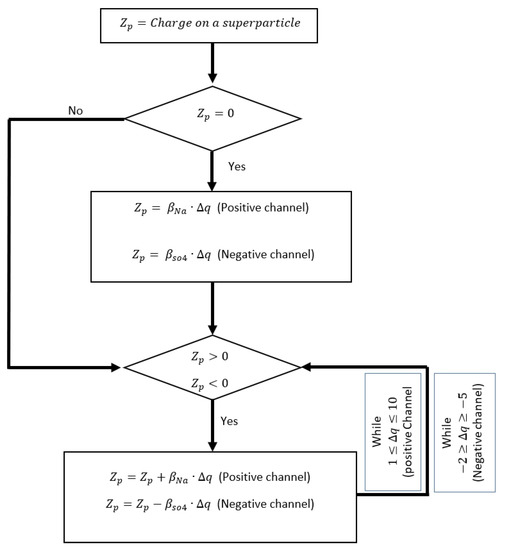
Figure 4.
Initialization of SP charge distribution based on the defined model.
The variable is the initial charge on the SP, and is the charge difference before and after the charge transfer to the SP. Since the initial SP release in the flow channel is random and diffuse scattering randomly interacts with other SPs, the charge transfer is also considered random. If the average number of positive ions to adsorb to the carbon is , then the number of negative ions that adsorb to the carbon is , following the charge neutrality. Each SP redistributes its charge to the neighboring SP within the interaction diameter , conserving the total charge [56]. This recurring charge transfer over time is calculated by a state variable , given as
with initial conditions and .
The subscript t indicates the time derivative of the variable. The variable is set as a function of the total charge as an average of both flow channel cross-sectional dimensions:
where is the total accumulated charge from the positive channel of the geometry and is the accumulated charge from the negative channel of the geometry. The total charge along the length L of the flow channel is estimated by
where L here is the z-dimension of the flow channel and e is the constant electronic charge. This total charge accumulated in the flow channels over time is the estimated total current in the system. The current is calculated as
3.1. Geometrical Design
The model described above is implemented for three specific channel geometries: circular, box-shaped with a linear current collector, and box-shaped with an extended current collector, as shown in Figure 5 [54]. Each geometrical design allows the different direct contact rate between the electrode phase and the CC. With the flow channels 5 mm wide and 120 mm long, the contact area for circular flow channel geometry is approximately 1884 mm2. The contact area is reduced to 600 mm2 and 1800 mm2 for the box-shaped geometry with linear and extended CC, respectively [54]. The circular-shaped channel geometry resembles the prototype used for experimental analysis and later used for the model optimization and sensitivity testing of modeling parameters.
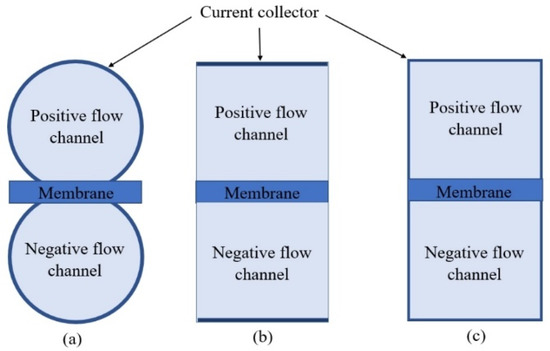
Figure 5.
Model geometry design with two channels separated by a membrane. (a) Circular channel, (b) box-shaped with the linear current collector, and (c) box-shaped with the extended current collector.
3.2. Simulation Parameters
The essential simulation parameters and physical properties are given in Table 1, which were either adopted from the literature or calculated based on the experimental results.

Table 1.
Parameters for the particle-based stochastic model.
3.3. Model Assumptions
For a computationally executable mathematical model, the following assumptions were made along the process:
- The model of the particles ensures that mass and momentum and charge are rigorously conserved.
- Each particle scatters instantly from the charging boundary with some physical charge.
- The interactive forces between the particles, e.g., dielectrophoretic and Brownian forces, are negligible [52,53].
3.4. Model Implementation
The proposed numerical simulation method was implemented in COMSOL Multiphysics 5.5 and developed based on finite element analysis and Newtonian particle dynamics. Figure 6 shows the schematic loop diagram of the numerical solution procedure of the developed method. The velocities of particles are initialized by Maxwell distribution at the first time step of the simulation—in the following steps, Newton’s equations are solved to obtain particle movement This loop is carried through all the particles individually at each time increment. To calculate the charge quantity, the loop is also performed on all the contact SPs within the interaction range.
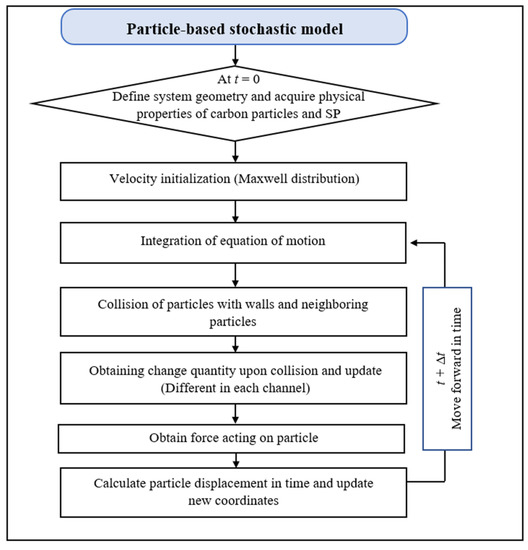
Figure 6.
Loop diagram of the numerical solution process.
4. Results and Discussion
The particle-based model presented in Section 3 is validated using experimental measurements from Section 2. The model allows calculating the total charge in the flow channel, while the total charge in the experimental study is evaluated by integrating the current at the constant voltage of 0.75 V. This validation of the particle charging model includes the optimization of the critical modeling parameters and testing its sensitivity for the charging progress.
4.1. Parameter Optimization of the PDE-Based Model
The parameterization of the computational model is one of the significant challenges. It is also beneficial to find kinetic and transport parameters from the experiment charge/discharge data. Such techniques are typically formulated to minimize objective function (OF) given by the sum-of-squares differences between the model outputs and their experimentally measured values for each ith cycle. The output of this particle-based model is measured in terms of the total charge in the flow channels, while the current measured from the FE charging in the EFC cell at constant voltage is used to estimate the total charge in charged FEs. The OF is given as,
where is the measured charge at the constant voltage cycle in time for cycle i, is the charge computed from the particle-based model at time for cycle i for the vector of model parameters (the parameters estimated from the experimental data), and is the number of time points in cycle i. Here, the goal is to evaluate the capability of COMSOL and its interfacing module to determine these parameters [57]. Since the total charge in this model is dependent on the SP size from Equation (8), mass and concentration of SP are also connected by Equation (5); thus, the optimization requires the modeling parameters such as SP size and mass , the actual number of SPs and the average number of positive ions per carbon particle .
The optimization step requires a set of global variables for gradient-based and gradient-free optimization on an existing COMSOL model. BOBYQA is a gradient-free algorithm used to optimize the model to determine input values to yield an output that matches the experimental data [58]. The optimization was performed individually for selective parameters, starting with the size and mass of an SP. The actual numbers of SPs and ions per carbon particle were estimated using an SP’s optimized mass and size. The scales, upper bounds, and lower bounds for control variables and parameters are given in Table 2.
Table 2.
Parameters used in optimization with their upper and lower bounds.
To assess the suitability of the above modeling approach to the actual systems, the numerical results of the total charge in the model were compared with the corresponding potentiostatic EFC charging in the control voltage scenario. The total charge was obtained by integrating potentiostatic EFC current under the constant voltages of 0.75, 0.50, and 0.25 V, respectively. The optimization yielded values for the SP diameter, SP mass, number of SPs used in the flow channel, and average number of ions for a single carbon particle for the best match, as listed in Table 2 under the heading labeled “Exact”. An optimization plot of charge in the experiment vs. time resulting from the potentiostatic charging of the EFC is shown in Figure 7. The error analysis is based on a comparison of the experimental measurements and the model’s predictions—a comparison of them showed excellent agreement. The maximum difference between the charge obtained by the model and experiment was C. We define the error measure as
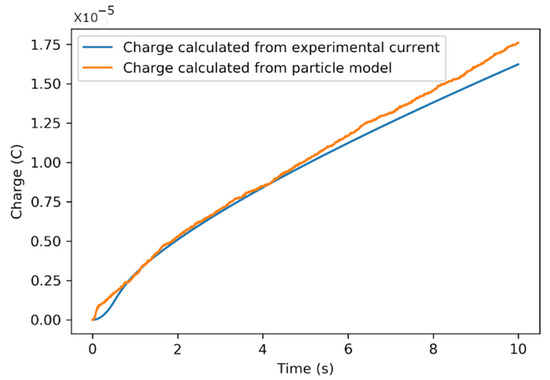
Figure 7.
Experimental vs. actual numerical charge estimated data for 0.75 V potentiostatic charge.
4.2. Sensitivity of Parameters and Model Calibration
In addition to the optimization, the parametric study helped quantify the influence of the number of SPs used in the flow channel, and the interaction diameter, on the charging efficiency of the EFC circular-geometry design. The change in the number of positive ions per carbon particle, , was calculated as a function of the changes and the interaction diameter.
4.2.1. Effect of Number of SPs
SPs are released on boundaries and domains uniformly, according to the underlying mesh, as defined by a grid. Usually, a particle simulation suffers from too many particles in the total system [59]. Since the SP size can only be increased to a specific limit, the high number of SPs released in each channel can render the computation slow and costly. Varying the weights of the SP by annihilation and cloning reduces the non-uniformity in the computational particle number density [60,61]. A similar scheme of reducing the SP quantity balances the computation model cost and speed. The use of fewer SPs can be compensated for by a constant current scaling factor on the total current collected from the channels, thus mitigating the effect of SP quantities in the system [59,60].
After the optimization, the flow channel contained 4031 superparticles, and for each carbon particle in an SP, 0.69154 positive ions were present for double-layer charging. Increasing the number of SPs would decrease the mass of the individual SP, facilitating efficient movement. Hence, more collisions could improve the charging of electrodes over time. Doubling the SPs also doubled the availability of positive ions for the charging process (Figure 8). This change in ion availability was much more prominent at higher voltages, supporting better carbon electrode utilization. The change in showed an almost linear relationship with increasing constant voltage, suggesting that only double-layer charging would be expected in a circular flow channel.
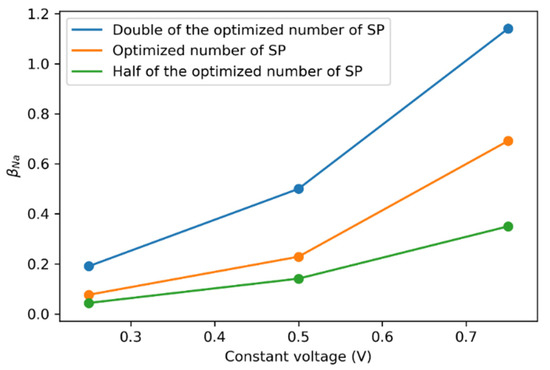
Figure 8.
Changes in against varying at the constant voltages of 0.75, 0.5, and 0.25 V.
4.2.2. Interaction Diameter of the SP
The interaction diameter represents a regional domain in the channel, in which the SP can interact and redistribute the charge homogenously. This interaction obeys neutrality by conserving the mass and charge when leaving the interaction diameter range. The interaction between two SPs is essential for the charging process in the semi-solid electrode system.
The SP size was kept constant at the optimized value of . The change in when changing the interaction diameter by ±2 and 4% from the optimized value is illustrated in Figure 9. When the interaction diameter was less than the SP size, the increased because of the fewer scattering possibilities for other SPs. The numerical analysis showed that the relationship between SPs was asymptotic at the increased interaction distance. In contrast, for the interaction distance comparable to the size of SP, the interaction was most effective for the homogenous charging of the semi-solid electrode in the flow channel [62]. The change in at the lower voltages was almost negligible, yielding unproductive operating conditions. The utilization of carbon and charging productivity improved at the higher voltages, resulting in the more efficient charging of slurry electrodes.
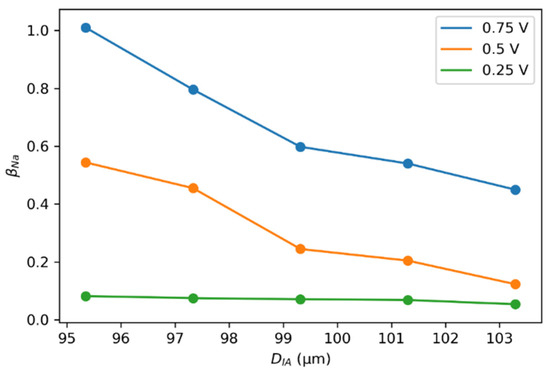
Figure 9.
Effect of the interaction diameter on the average charge number, with an SP size of 99.319 µm. Individual calculations were performed using the experimental reference data of EFC charging at a constant voltage of 0.75, 0.5, and 0.25 V.
4.2.3. Effect of SP Size
The allowable size of an SP is limited based on the size of actual particles and the size of the simulated system. Too large an SP can smear out the real solid carbon particle properties. On the other hand, an SP size too small influences the interpolation of the total charge distributed in the flow channel. An optimal SP size is necessary for accurate simulation predictions [48,63]. The size of SP directly affects the average number of carbon particles in an SP in Equation (4), i.e., increasing the SP size also increases the mass. Despite enough interaction range, this extra weight slows the SP diffusion, affects SP trajectories, and limits charge distribution. However, the rate of change in when decreasing the SP size by 2% and 4% was considerably more prominent, hence improving the availability of carbon particles to charge (Figure 10). The parameter changed little when the SP size increased by 2% and 4%, making the charging of particles difficult.
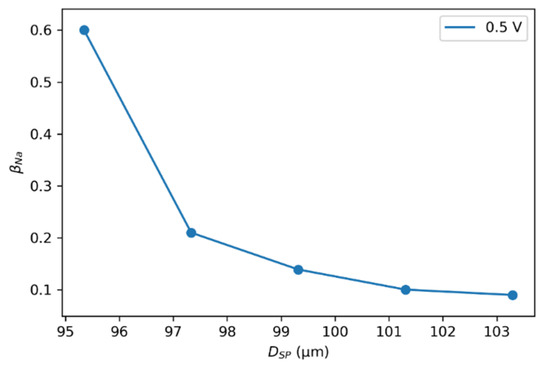
Figure 10.
as a function of SP size with . Calculations were performed using the experimental reference data of EFC charging at a constant voltage of 0.5 V.
4.3. Comparison between Simulations and Experimental Results
Figure 11 shows the plot of the total charge in the EFC model for the three geometries. Using optimized parameters from Table 2, the circular EFC geometry was most favorable for charging the slurry electrodes at a low flow rate. The charging activity of the carbon particle was maximum near the current collecting boundary. The model also showed the inactivity of charging in the centers of the flow channels [49,54] in terms of uncharged SP when moving away from the current-collector (CC) boundary.
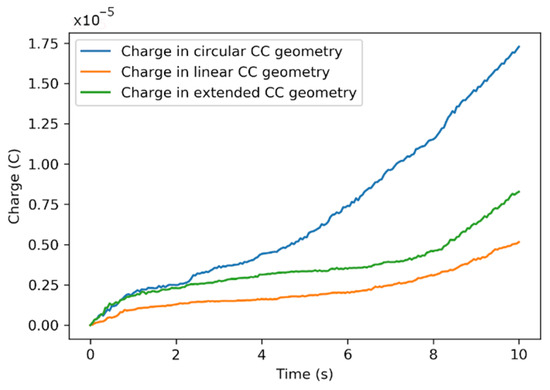
Figure 11.
Total charge in three geometrical designs with optimized values of modeling parameters at the constant voltage of 0.75 V.
Figure 12 shows the charge distributions in the flow channel for the three geometries. The charging activity was more prominent near the CCs, leaving the central regions uncharged. The circular channel exhibited maximum charging and carbon utilization, as shown in Figure 12a–d. The charge diffusion becomes less effective for the carbon electrode in the box-shaped geometry with a linear and extended CC, slowing the rate of charging, as shown in Figure 12e–l. The progress of charging for each geometry is given in the Supplementary Materials: Figure S1 for the circular geometry design, Figure S2 for box-shaped geometry with a linear CC, and Figure S3 for box-shaped geometry with an extended CC.
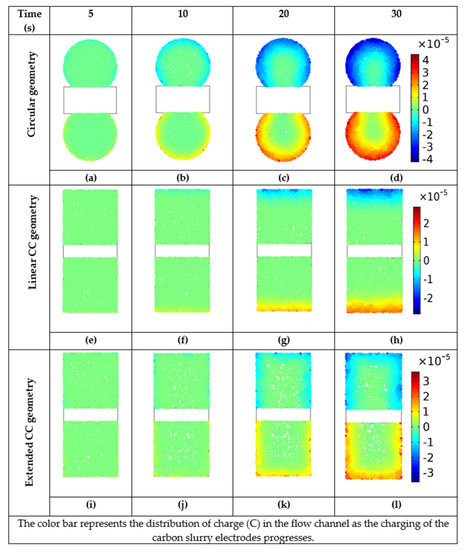
Figure 12.
Charging of carbon slurry electrodes in terms of charge distribution after 5, 10, 20, and 30 s in three geometrical arrangements, when the model is optimized at the constant voltage of 0.75 V. For circular shaped flow channel see (a–d), for box shaped channel geometry with linear CC see (e–h), and for box shaped channel geometry with extended CC see (i–l).
5. Conclusions
This paper investigates the spherical particle model for charging the semi-solid slurry electrodes in the EFC architecture. The model was constructed using the concept of the computational SP representing a group of real carbon particles as the electrode phase. The dynamics of SP charging were studied in the EFC architecture to predict the performance, and design improvements to assist its scalability. In addition, the numerical model was used to analyze and optimize various modeling parameters to study the charging process for the future implementation of the model. The effect of the size and concentration of the SP was optimized by the minimization of the objective function. Using this model enabled study of the effect of the concentration of SPs on the charge capacity in terms of (Na ions per carbon particle) and (SO4 ions per carbon particle). The main advantage of such a particle-based model is its stochastic nature—it becomes very easy and straightforward to add different chemical side reactions, random processes, and rare events into the model. The optimized numbers of SPs and Na ions were stable at 4031.6 and 0.69154, respectively. The charge distribution process was significantly more progressive near the CC, showing minimal or no activity in the center of the channel. According to the optimized numerical model, the circular EFC architecture showed more charging productivity than other geometries at the constant voltage of 0.75 V.
Supplementary Materials
The following are available online at https://www.mdpi.com/article/10.3390/app12041887/s1, Figure S1: Charge distribution in the carbon phase when allowed to charge in the circular flow channel geometry. The flow channels were 5 mm wide, Figure S2: Charge distribution in the carbon phase when allowed to charge in the Box-shaped geometry with linear current collector. The flow channels were 5 mm wide, Figure S3: Charge distribution in the carbon phase when allowed to charge in the Box-shaped geometry with extended current collector. The flow channels were 5 mm wide.
Author Contributions
Conceptualization, F.S., V.Z. and J.T.; methodology, V.Z.; investigation, F.S.; data curation, F.S.; writing—original draft preparation, F.S.; writing—review and editing, F.S., J.T., A.K. and V.Z.; supervision, J.T., V.Z. and A.A. All authors have read and agreed to the published version of the manuscript.
Funding
This research was funded by Estonian Research Council grant IUT 20-14, PUT-1149, PUT-1372 and Grant Agreement No. 856705 (ERA Chair “MATTER”).
Institutional Review Board Statement
Not applicable.
Informed Consent Statement
Not applicable.
Data Availability Statement
Contact the corresponding author.
Acknowledgments
This work has been supported by Estonian Research Council grant IUT 20-14, PUT-1149, PUT-1372, Information Technology Foundation Education (Hariduse Infotehnoloogia Sihtasutus, HITSA), Estonian Centre of Excellence in ICT Research (EXCITE), Graduate School of Functional Materials and Technologies (GSFMT), the European Union’s Horizon 2020 research and innovation program, Grant Agreement No. 856705 (ERA Chair “MATTER”) and European Regional Development Fund in University of Tartu, Estonia.
Conflicts of Interest
The authors declare no conflict of interest.
References
- Dunn, B.; Kamath, H.; Tarascon, J.M. Electrical energy storage for the grid: A battery of choices. Science 2011, 334, 928–935. [Google Scholar] [CrossRef] [PubMed] [Green Version]
- Mubeen, S.; Jun, Y.S.; Lee, J.; McFarland, E.W. Solid Suspension Flow Batteries Using Earth Abundant Materials. ACS Appl. Mater. Interfaces 2016, 8, 1759–1765. [Google Scholar] [CrossRef] [PubMed]
- Dicks, A.L. The role of carbon in fuel cells. J. Power Sources 2006, 156, 128–141. [Google Scholar] [CrossRef]
- Li, X.; Sabir, I.; Park, J. A flow channel design procedure for PEM fuel cells with effective water removal. J. Power Sources 2007, 163, 933–942. [Google Scholar] [CrossRef]
- Turpin, C.; Van Laethem, D.; Morin, B.; Rallières, O.; Roboam, X.; Verdu, O.; Chaudron, V. Modelling and analysis of an original direct hybridization of fuel cells and ultracapacitors. Math. Comput. Simul. 2017, 131, 76–87. [Google Scholar] [CrossRef]
- Presser, V.; Dennison, C.R.; Campos, J.; Knehr, K.W.; Kumbur, E.C.; Gogotsi, Y. The electrochemical flow capacitor: A new concept for rapid energy storage and recovery. Adv. Energy Mater. 2012, 2, 895–902. [Google Scholar] [CrossRef]
- Porada, S.; Lee, J.; Weingarth, D.; Presser, V. Continuous operation of an electrochemical flow capacitor. Electrochem. Commun. 2014, 48, 178–181. [Google Scholar] [CrossRef]
- Hoyt, N.C.; Wainright, J.S.; Savinell, R.F. Mathematical Modeling of Electrochemical Flow Capacitors. J. Electrochem. Soc. 2015, 162, A652–A657. [Google Scholar] [CrossRef]
- Hatzell, K.B.; Beidaghi, M.; Campos, J.W.; Dennison, C.R.; Kumbur, E.C.; Gogotsi, Y. A high performance pseudocapacitive suspension electrode for the electrochemical flow capacitor. Electrochim. Acta 2013, 111, 888–897. [Google Scholar] [CrossRef]
- Yoon, H.; Kim, H.J.; Yoo, J.J.; Yoo, C.Y.; Park, J.H.; Lee, Y.A.; Cho, W.K.; Han, Y.K.; Kim, D.H. Pseudocapacitive slurry electrodes using redox-active quinone for high-performance flow capacitors: An atomic-level understanding of pore texture and capacitance enhancement. J. Mater. Chem. A 2015, 3, 23323–23332. [Google Scholar] [CrossRef]
- Madec, L.; Youssry, M.; Cerbelaud, M.; Soudan, P.; Guyomard, D.; Lestriez, B. Electronic vs. Ionic Limitations to Electrochemical Performance in Li4Ti5O12-Based Organic Suspensions for Lithium-Redox Flow Batteries. J. Electrochem. Soc. 2014, 161, A693–A699. [Google Scholar] [CrossRef]
- Zhao, Y.; Si, S.; Liao, C. A single flow zinc//polyaniline suspension rechargeable battery. J. Power Sources 2013, 241, 449–453. [Google Scholar] [CrossRef]
- Wu, S.; Zhao, Y.; Li, D.; Xia, Y.; Si, S. An asymmetric Zn//Ag doped polyaniline microparticle suspension flow battery with high discharge capacity. J. Power Sources 2015, 275, 305–311. [Google Scholar] [CrossRef]
- Hatzell, K.B.; Boota, M.; Gogotsi, Y. Materials for suspension (semi-solid) electrodes for energy and water technologies. Chem. Soc. Rev. 2015, 44, 8664–8687. [Google Scholar] [CrossRef]
- Dubal, D.P.; Ayyad, O.; Ruiz, V.; Gómez-Romero, P. Hybrid energy storage: The merging of battery and supercapacitor chemistries. Chem. Soc. Rev. 2015, 44, 1777–1790. [Google Scholar] [CrossRef]
- Boota, M.; Hatzell, K.B.; Beidaghi, M.; Dennison, C.R.; Kumbur, E.C.; Gogotsi, Y. Activated Carbon Spheres as a Flowable Electrode in Electrochemical Flow Capacitors. J. Electrochem. Soc. 2014, 161, A1078. [Google Scholar] [CrossRef]
- Burkhardt, S.; Friedrich, M.S.; Eckhardt, J.K.; Wagner, A.C.; Bohn, N.; Binder, J.R.; Chen, L.; Elm, M.T.; Janek, J.; Klar, P.J. Charge Transport in Single NCM Cathode Active Material Particles for Lithium-Ion Batteries Studied under Well-Defined Contact Conditions. ACS Energy Lett. 2019, 4, 2117–2123. [Google Scholar] [CrossRef]
- Lindgren, E.B.; Chan, H.K.; Stace, A.J.; Besley, E. Progress in the theory of electrostatic interactions between charged particles. Phys. Chem. Chem. Phys. 2016, 18, 5883–5895. [Google Scholar] [CrossRef]
- Pilon, L.; Wang, H.; D’Entremont, A. Recent Advances in Continuum Modeling of Interfacial and Transport Phenomena in Electric Double Layer Capacitors. J. Electrochem. Soc. 2015, 162, A5158–A5178. [Google Scholar] [CrossRef] [Green Version]
- Narayanan, A.; Mugele, F.; Duits, M.H.G. Mechanical History Dependence in Carbon Black Suspensions for Flow Batteries: A Rheo-Impedance Study. Langmuir 2017, 33, 1629–1638. [Google Scholar] [CrossRef] [Green Version]
- Chen, Y.; Sprecher, A.F.; Conrad, H. Electrostatic particle-particle interactions in electrorheological fluids. J. Appl. Phys. 1991, 70, 6796–6803. [Google Scholar] [CrossRef]
- Chang, C.; Powell, R.L. Dynamic Simulation of Bimodal Suspensions of Hydrodynamically Interacting Spherical Particles. J. Fluid Mech. 1993, 253, 1–25. [Google Scholar] [CrossRef]
- Richards, J.J.; Hipp, J.B.; Riley, J.K.; Wagner, N.J.; Butler, P.D. Clustering and Percolation in Suspensions of Carbon Black. Langmuir 2017, 33, 12260–12266. [Google Scholar] [CrossRef] [PubMed]
- Madec, L.; Youssry, M.; Cerbelaud, M.; Soudan, P.; Guyomard, D.; Lestriez, B. Surfactant for enhanced rheological, electrical, and electrochemical performance of suspensions for semisolid redox flow batteries and supercapacitors. Chempluschem 2015, 80, 396–401. [Google Scholar] [CrossRef]
- Lohaus, J.; Rall, D.; Kruse, M.; Steinberger, V.; Wessling, M. On charge percolation in slurry electrodes used in vanadium redox flow batteries. Electrochem. Commun. 2019, 101, 104–108. [Google Scholar] [CrossRef]
- Campos, J.W.; Beidaghi, M.; Hatzell, K.B.; Dennison, C.R.; Musci, B.; Presser, V.; Kumbur, E.C.; Gogotsi, Y. Investigation of carbon materials for use as a flowable electrode in electrochemical flow capacitors. Electrochim. Acta 2013, 98, 123–130. [Google Scholar] [CrossRef]
- Akuzum, B.; Agartan, L.; Locco, J.; Kumbur, E.C. Effects of particle dispersion and slurry preparation protocol on electrochemical performance of capacitive flowable electrodes. J. Appl. Electrochem. 2017, 47, 369–380. [Google Scholar] [CrossRef]
- Hoyt, N.C.; Wainright, J.S.; Savinell, R.F. Current Density Scaling in Electrochemical Flow Capacitors. J. Electrochem. Soc. 2015, 162, 1102–1110. [Google Scholar] [CrossRef]
- Ma, J.; He, D.; Tang, W.; Kovalsky, P.; He, C.; Zhang, C.; Waite, T.D. Development of Redox-Active Flow Electrodes for High-Performance Capacitive Deionization. Environ. Sci. Technol. 2016, 50, 13495–13501. [Google Scholar] [CrossRef]
- Yang, S.; Choi, J.; Yeo, J.G.; Jeon, S.-I.; Park, H.R.; Kim, D.K. Flow-Electrode Capacitive Deionization Using an Aqueous Electrolyte with a High Salt Concentration. Environ. Sci. Technol. 2016, 50, 5892–5899. [Google Scholar] [CrossRef]
- Wei, T.-S.; Fan, F.Y.; Helal, A.; Smith, K.C.; McKinley, G.H.; Chiang, Y.-M.; Lewis, J.A.; Wei, T.; Lewis, J.A.; Fan, F.Y.; et al. Biphasic Electrode Suspensions for Li-Ion Semi-solid Flow Cells with High Energy Density, Fast Charge Transport, and Low-Dissipation Flow. Adv. Energy Mater. 2015, 5, 1500535. [Google Scholar] [CrossRef] [Green Version]
- Petek, T.J.; Hoyt, N.C.; Savinell, R.F.; Wainright, J.S. Slurry electrodes for iron plating in an all-iron flow battery. J. Power Sources 2015, 294, 620–626. [Google Scholar] [CrossRef]
- Newman, J.S.; Tobias, C.W. Theoretical Analysis of Current Distribution in Porous Electrodes. J. Electrochem. Soc. 1962, 109, 1183–1191. [Google Scholar] [CrossRef]
- Johnson, A.M.; Newman, J. Desalting by Means of Porous Carbon Electrodes. J. Electrochem. Soc. 1971, 118, 510–517. [Google Scholar] [CrossRef]
- Brunini, V.E.; Chiang, Y.M.; Carter, W.C. Modeling the hydrodynamic and electrochemical efficiency of semi-solid flow batteries. Electrochim. Acta 2012, 69, 301–307. [Google Scholar] [CrossRef]
- Guenther, C.; Syamlal, M. The effect of numerical diffusion on simulation of isolated bubbles in a gas-solid fluidized bed. Powder Technol. 2001, 116, 142–154. [Google Scholar] [CrossRef]
- Kroupa, M.; Offer, G.J.; Kosek, J. Modelling of Supercapacitors: Factors Influencing Performance. J. Electrochem. Soc. 2016, 163, A2475–A2487. [Google Scholar] [CrossRef] [Green Version]
- Chauhan, D.; Singhvi, N.; Singh, R. Effect of Geometry of Filler Particles on the Effective Thermal Conductivity of Two-Phase Systems. Int. J. Mod. Nonlinear Theory Appl. 2012, 01, 40–46. [Google Scholar] [CrossRef] [Green Version]
- Roco, M.C.; Shook, C.A. Modeling of slurry flow: The effect of particle size. Can. J. Chem. Eng. 1983, 61, 494–503. [Google Scholar] [CrossRef]
- Borodin, O.; Ren, X.; Vatamanu, J.; Von Wald Cresce, A.; Knap, J.; Xu, K. Modeling Insight into Battery Electrolyte Electrochemical Stability and Interfacial Structure. Acc. Chem. Res. 2017, 50, 2886–2894. [Google Scholar] [CrossRef]
- Pandey, A.; Derakhshandeh, M.; Kedzior, S.A.; Pilapil, B.; Shomrat, N.; Segal-Peretz, T.; Bryant, S.L.; Trifkovic, M. Role of interparticle interactions on microstructural and rheological properties of cellulose nanocrystal stabilized emulsions. J. Colloid Interface Sci. 2018, 532, 808–818. [Google Scholar] [CrossRef] [PubMed]
- Daintree, L.; Biggs, S. Particle-particle interactions: The link between aggregate properties and rheology. Part. Sci. Technol. 2010, 28, 404–425. [Google Scholar] [CrossRef]
- Uppapalli, S.; Zhao, H. The influence of particle size and residual charge on electrostatic interactions between charged colloidal particles at an oil-water interface. Soft Matter 2014, 10, 4555–4560. [Google Scholar] [CrossRef] [PubMed]
- Karzar-Jeddi, M.; Luo, H.; Cummings, P.T.; Hatzell, K.B. Computational Modeling of Particle Hydrodynamics and Charging Process for the Flowable Electrodes of Carbon Slurry. J. Electrochem. Soc. 2019, 166, A2643–A2653. [Google Scholar] [CrossRef]
- Hossan, M.R.; Dillon, R.; Roy, A.K.; Dutta, P. Modeling and simulation of dielectrophoretic particle-particle interactions and assembly. J. Colloid Interface Sci. 2013, 394, 619–629. [Google Scholar] [CrossRef]
- Kvashnin, A.G. Cell model of suspension of spherical particles. Fluid Dyn. 1980, 14, 598–602. [Google Scholar] [CrossRef]
- Snider, D.M. An Incompressible Three-Dimensional Multiphase Particle-in-Cell Model for Dense Particle Flows. J. Comput. Phys. 2001, 170, 523–549. [Google Scholar] [CrossRef]
- Verma, V.; Padding, J.T. A novel approach to MP-PIC: Continuum particle model for dense particle flows in fluidized beds. Chem. Eng. Sci. X 2020, 6, 100053. [Google Scholar] [CrossRef]
- Torop, J.; Summer, F.; Zadin, V.; Koiranen, T.; Jänes, A.; Lust, E.; Aabloo, A. Low concentrated carbonaceous suspensions assisted with carboxymethyl cellulose as electrode for electrochemical flow capacitor. Eur. Phys. J. E 2019, 42, 8. [Google Scholar] [CrossRef]
- Sunil, V.; Pal, B.; Izwan Misnon, I.; Jose, R. Characterization of supercapacitive charge storage device using electrochemical impedance spectroscopy. Mater. Today Proc. 2021, 46, 1588–1594. [Google Scholar] [CrossRef]
- Lu, L.; Yoo, K.; Benyahia, S. Coarse-Grained-Particle Method for Simulation of Liquid-Solids Reacting Flows. Ind. Eng. Chem. Res. 2016, 55, 10477–10491. [Google Scholar] [CrossRef]
- Castellanos, A.; Ramos, A.; González, A.; Green, N.G.; Morgan, H. Electrohydrodynamics and dielectrophoresis in microsystems: Scaling laws. J. Phys. D Appl. Phys. 2003, 36, 2584. [Google Scholar] [CrossRef]
- Çetin, B.; Öner, S.D.; Baranoğlu, B. Modeling of dielectrophoretic particle motion: Point particle versus finite-sized particle. Electrophoresis 2017, 38, 1407–1418. [Google Scholar] [CrossRef] [PubMed] [Green Version]
- Summer, F.; Zadin, V.; Nakshatharan, S.S.; Aabloo, A.; Torop, J. Optimization of Electrochemical Flow Capacitor (EFC) design via finite element modeling. J. Energy Storage 2020, 29, 101304. [Google Scholar] [CrossRef]
- Romashchenko, E.V.; Bizyukov, A.A.; Girka, I.O. Dynamics of macroparticle in a weakly collisional plasma. Probl. At. Sci. Technol. 2019, 119, 112–115. [Google Scholar]
- Esirkepov, T.Z. Exact charge conservation scheme for Particle-in-Cell simulation with an arbitrary form-factor. Comput. Phys. Commun. 2001, 135, 144–153. [Google Scholar] [CrossRef]
- Rajabloo, B.; Désilets, M.; Choquette, Y. Parameter Estimation of Single Particle Model Using COMSOL Multiphysics® and MATLAB® Optimization Toolbox. In Proceedings of the 2015 COMSOL Conference, Boston, MA, USA, 20 May 2015. [Google Scholar]
- Powell, M.J.D. The BOBYQA Algorithm for Bound Constrained Optimization without Derivatives; Cambridge NA Report NA2009/06; University of Cambridge: Cambridge, UK, 2009. [Google Scholar]
- Johnson, P.L. Predicting the impact of particle-particle collisions on turbophoresis with a reduced number of computational particles. Int. J. Multiph. Flow 2020, 124, 103182. [Google Scholar] [CrossRef] [Green Version]
- Garg, R.; Narayanan, C.; Subramaniam, S. A numerically convergent Lagrangian–Eulerian simulation method for dispersed two-phase flows. Int. J. Multiph. Flow 2009, 35, 376–388. [Google Scholar] [CrossRef]
- Shon, C.H.; Lee, H.J.; Lee, J.K. Method to increase the simulation speed of particle-in-cell (PIC) code. Comput. Phys. Commun. 2001, 141, 322–329. [Google Scholar] [CrossRef]
- Momot, A.I.; Zagorodny, A.G.; Orel, I.S. Interaction force between two finite-size charged particles in weakly ionized plasma. Phys. Rev. E 2017, 95, 13212. [Google Scholar] [CrossRef]
- Cloete, S.; Johansen, S.T.; Amini, S. Grid independence behaviour of fluidized bed reactor simulations using the Two Fluid Model: Effect of particle size. Powder Technol. 2015, 269, 153–165. [Google Scholar] [CrossRef] [Green Version]
Publisher’s Note: MDPI stays neutral with regard to jurisdictional claims in published maps and institutional affiliations. |
© 2022 by the authors. Licensee MDPI, Basel, Switzerland. This article is an open access article distributed under the terms and conditions of the Creative Commons Attribution (CC BY) license (https://creativecommons.org/licenses/by/4.0/).