Abstract
A slurry pump is a device used to transport slurry, which is a mixture of solids and liquids. The slurry pump is subjected to physical erosion, generally resulting from erosion by friction between the solid and liquid particles. This study aimed to analyze the effects of process parameters on the erosion wear of a throat bush, which is the main component of a slurry pump. The erosion rate density (E) was analyzed based on the process parameters, that is, the slurry particle diameter, rotation speed of the impeller, and gap between the impeller and the throat bush. The discrete phase model (DPM) of the slurry pump was simulated using the process parameters. These parameters were optimized to minimize the erosion rate density. The optimization method using design of experiments (DOE) to derive a specific location with the greatest influence of the design variables through the one-way layout method and optimize the response value at that location is a method that efficiently analyzes a large number of cases. The optimization results confirmed that the erosion rate density was reduced in the optimization model compared with the earlier model.
1. Introduction
A slurry pump is a device used to transport slurry, which is a mixture of solids and liquids. It has been used in various industrial fields, such as coal mining, chemical manufacturing, and electricity generation. A slurry pump is subjected to physical erosion, generally resulting from erosion by friction between the solid and liquid particles, referred to as slurry erosion [1,2]. The erosion damage of the slurry pump is a chronic problem caused by the characteristics of the slurry, geometry of the main components of the pump, and working conditions.
The key components of a slurry pump subjected to erosion damage are the impeller, casing, and throat bush. The impeller is subjected to wear owing to its rotation. However, it exhibits relatively uniform erosion characteristics. However, irregular erosion patterns occur in the case of the casing and throat bush owing to the flow path of the slurry. Recently, the surface erosion of the pump and pump cases caused by slurry particles was experimentally investigated. Zhong et al. [3], measured the erosion damage caused by particle collisions and expressed the wear coefficient based on the Bitter model. Fritsche et al. [4], analyzed the amount of erosion based on Bommes’ theory using the angle and diameter of the casing and the impeller blade exit angle as parameters. Pagalthivarthi et al. [5], predicted the flow field of a high-density slurry in a centrifugal pump casing under various work and geometric conditions and identified the physical causes of erosion. They demonstrated that the solid concentration of the slurry and the shear stress generated in the casing gradually increased from the upstream tongue region to the downstream navel region. These measurements can be used to calculate the amount of erosion that occurs in the casing wall. Jashanpreet Singh and Simranjit Singh, [6], presented a neural network prediction of slurry erosion of heavy-duty pump impeller casing materials. In their work, a standard multilayer artificial neural network was designed. That research aimed to study the slurry erosion of pump materials for the flow of sand slurry using experimental and predictive methods. A pot tester was employed to conduct the slurry erosion experimentation for the variation of rotational speed, concentration, time, and impact angles. Rahul Tarodiya and Bhupendra K. Gandhi, [7], established the effect of variation in particle size distribution on the centrifugal slurry pump (CSP) performance and particle kinetics. Computational fluid dynamics (CFD) modeling of a CSP with multi-size particulate slurry was performed using the granular Eulerian–Eulerian model. The numerical model was validated with the experimental data of the pump performance for multi-size particulate fly ash slurry. Guangjie Peng et al., 2020 [8], analyzed solid–liquid two-phase flow and wear in a large-scale centrifugal slurry pump. After that, in 2021 [9], they proposed the optimal hydraulic design to minimize erosive wear in a centrifugal slurry pump impeller. They used an Eulerian–Eulerian mixture model to simulate the solid–liquid two-phase flow of quartz sand and water in a slurry pump. The impeller was optimized statistically.
With the development of advanced computing techniques, the computational CFD-based approach is being increasingly applied for analyzing the flows in components handling slurry. The CFD method has the advantages of high efficiency and good economy, and its accuracy has been very reliable. The benefit of the CFD-based approach is that it gives comprehensive information about the local variations of flow parameters where the measurements are either difficult or impractical to conduct. In the case of a low particle concentration, choosing the CFD-DPM method can improve the calculation efficiency while ensuring calculation accuracy [10,11]. Rui Li et al. [12], showed the design optimization of a hemispherical protrusion for mitigating elbow erosion via CFD-DPM. Mazadak Parsia et al. [13], used the DPM model to accurately predict the erosion distribution of the elbow in a gas–liquid–solid flow. Solnordal et al. [14], used the DPM model, combined with two-way coupling and wall roughness models, to obtain the erosion rate distribution in the elbow. The calculated data was very consistent with the experimental data. DPM is a Lagrangian parcel-based approach that models particle collisions and uncorrelated translations using the kinetic theory of granular flows. This approach has numerous advantages over the established Eulerian two-fluid model. These include better resolution of particle clusters and bubbles, more natural incorporation of particle size distributions, and better handling of crossing particle jets clusters [15]. Erosion analysis using DPM was verified regarding its effectiveness and validity by many previous studies.
In many previous studies, simulations and experiments were performed according to the conditions of the slurry pump. They proposed a shape design that can minimize erosion. Several studies were conducted on the erosion of the impeller and casing. There are not many studies using statistical analysis methods to analyze the amount of erosion according to various combinations of factors.
In this study, the process parameters were optimized to reduce the erosion rate density (E) of the throat bush while maintaining the operating conditions of the slurry pump. The erosion rate density (E) of the throat bush was first analyzed using a DPM that considered the operating conditions of the slurry pump and particle characteristics. Based on the first simulation, the effects of the gap between the impeller and the throat bush, rotation speed (rpm) of the impeller, and slurry particle diameter on the erosion rate density (E) were analyzed using a one-way layout. From the analysis results, we derived the erosion maps. The locations that exhibited the highest erosion rate density (E) were selected. A second analysis was performed to derive conditions for minimizing the erosion rate density at that location. A combination of process parameters was established using the response surface methodology (RSM) in the design of experiments methods. Accordingly, the parameters and dimensions were optimized to minimize the erosion rate density.
2. Mathematical Models
2.1. Erosion Mechanism
Erosion occurs because of the interaction between the solid particles and the pump surface caused by the fluid flow, based on sliding and impact mechanisms [16,17]. Erosion can also be used to represent the wear caused by flowing gases, liquid droplets, or particles. The solid particles in the slurry pump were calcium carbonate granules mixed with water and precipitated or made into a heterogeneous lime slurry. The generated slurry was transported by a centrifugal pump, which eroded the impeller and bush inside the pump. Figure 1 illustrates a schematic of erosion modeling for slurry flow.
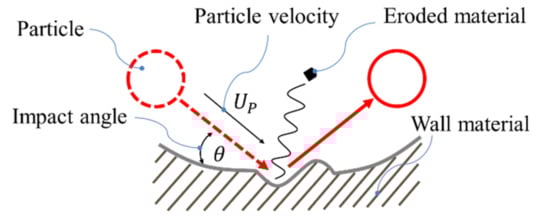
Figure 1.
Schematic for erosion modeling.
2.2. Erosion Model
Erosion occurs owing to various factors, such as particle impact and the characteristics of the fluid and walls. Several models exist for erosion analysis [18,19,20]. However, the Finnie erosion model is the most widely used. Finnie suggested an exponential correlation between the erosion rate and the kinetic energy of colliding particles. This model uses both Lagrangian particle tracking and Eulerian–Eulerian multiphase approaches. Additionally, it can be used in the ANSYS Fluent software. Equation (1), presented below, was applied to the Finnie model, where E denotes the erosion rate.
Here, k denotes a constant that varies depending on the fluid properties, such as temperature, density, and viscosity. Up denotes the impact velocity, and n denotes the velocity index that varies depending on the material of the eroded surface. f(θ) represents a function of the impact angle, which is presented in Equations (2) and (3).
θ = 18.4° denotes the critical value used to differentiate between sliding wear and impact wear. Sliding wear is dominant in the θ < 18.4° section, whereas impact wear is dominant in the θ > 18.4° section [21].
2.3. Turbulence Models
The shear stress transport (SST) model was applied as a turbulence model to predict flow separation [22,23]. It effectively predicts flow separation as a combination of the turbulence frequency-based k-omega model and the volumetric flow k-epsilon model. Equation (4) was used in the SST model for the multiphase flow.
Here, denotes the density, k denotes the turbulent kinetic energy, denotes the turbulence frequency, and denotes the blending function. denotes the turbulent viscosity and S denotes the shear stress. The superscript m denotes the mixture and denotes the coefficient that determines the proportion of fluid or solid [24,25].
3. CFD Analysis
3.1. DPM Analysis Modeling
A slurry pump consists of a casing, an impeller, and a throat bush, as shown in Figure 2. The throat bush of a slurry pump from Warman, Australia, was selected as the target model in this study, and an analysis model was designed accordingly. Figure 2a depicts the throat bush used in the slurry pump that was subjected to erosion wear by slurry particles. The simulation model comprised a casing, impeller, and throat bush (Figure 2b).
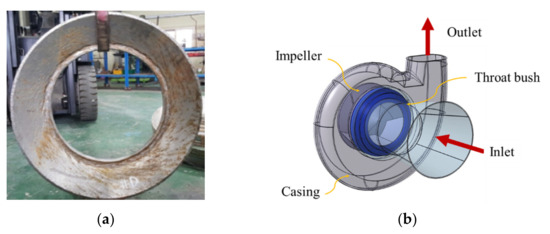
Figure 2.
Throat bush and slurry pump: (a) erosion by slurry particles; (b) boundary conditions for multiphase flow analysis model of the slurry pump with an impeller, throat bush, and casing.
Mesh independence is an important part of a simulation study to guarantee that the numerical solution independent of the size of the mesh [26]. For this reason, three meshes, i.e., fine mesh, normal mesh, and coarse mesh, were generated. The total elements for fine mesh, medium mesh, and coarse mesh are 418,173, 291,421, and 260,052 respectively, with all three meshes shown in Figure 3. In this study, simulations were performed using a fine mesh. Table 1 shows the number of grids with different grid types in the slurry pump.
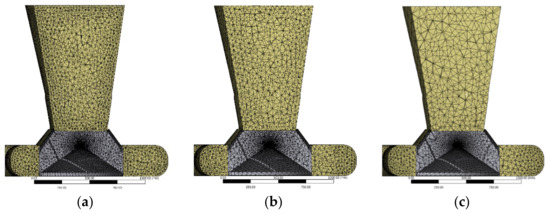
Figure 3.
Three types of mesh slurry pump: (a) fine mesh; (b) normal mesh; (c) coarse mesh.

Table 1.
The number of cells with different grid types in the slurry pump.
Among the analysis conditions, the three boundary conditions for the fluid region are the mass flow rate condition at the inlet, no-slip condition at the wall, and pressure condition at the outlet. The number and velocity of the particles are determined using the value obtained by dividing the mass flow rate assigned to the representative particle by the actual mass of the particle [27]. Table 2 presents the boundary conditions for the simulations. The boundary condition was set based on the operating conditions applied in a Korean thermal power plant.
Table 2.
Boundary conditions.
The main parameters that affect the erosion rate density include the particle diameter, gap between the main components, and impeller speed. The analysis range of the pump based on these parameters was set as the overload and underload states under actual operating conditions. Table 3 lists the ranges of parameters applied to the DPM. Figure 4 depicts the gap between the impeller and the throat bush ().
Table 3.
Design parameters.
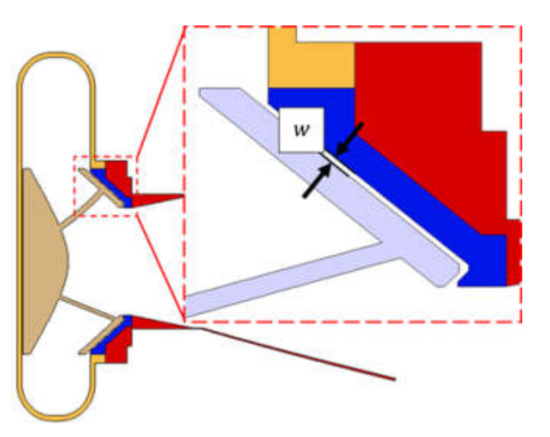
Figure 4.
Gap between the impeller and the throat bush.
3.2. Analysis of the Simulation Results
Figure 4 demonstrates the results of the simulation of the slurry particle velocity tracking and erosion damage in the slurry pump. The maximum velocity of the slurry particles was observed to be near the impeller and throat bush. Consequently, the slurry particles uniformly flowed into the pump casing, swirled around the impeller, and uniformly exited the pump casing, as illustrated in Figure 5a. The maximum erosion damage occurred in the throat bush, as depicted in Figure 5b.
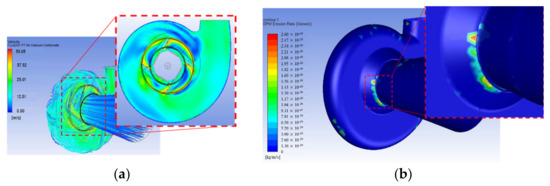
Figure 5.
Simulation results: (a) slurry particles tracking and velocity streamlines; (b) erosion rate density.
A wear map for the entire throat bush was presented at angular intervals of 45° in the counterclockwise direction to identify erosion damage for each section of the throat bush, as shown in Figure 6.
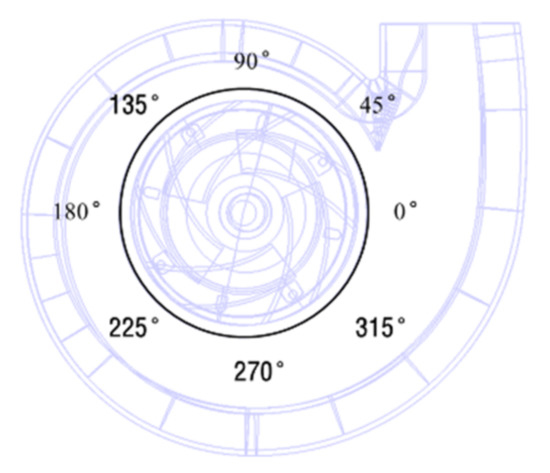
Figure 6.
Wear map for different locations on an angular basis.
3.2.1. Analysis of the Erosion Rate Density (E) Based on the Gap between the Impeller and the Throat Bush (w)
Figure 7 depicts the erosion rate density based on the gap between the impeller and the throat bush. In this instance, the slurry particle diameter and impeller rotation speed were fixed at 44 m and 600 rpm, respectively. However, the gap between the impeller and the throat bush (w) was varied from 1 to 1.2 to 1.4 mm.
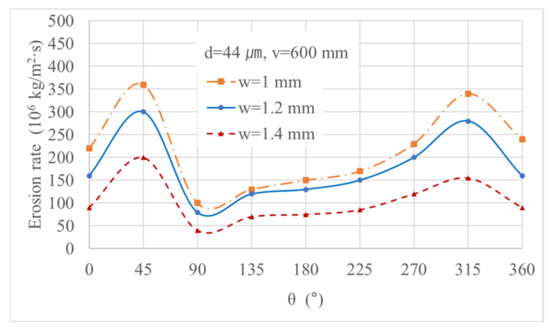
Figure 7.
Erosion rate density based on the distance between the parts.
As the distance between the two components increased, the erosion rate density decreased. The erosion rate density decreased more when the gap between the impeller and the throat bush increased from 1.2 to 1.4 mm compared with when the gap increased from 1 to 1.2. If the gap between the impeller and the throat bush is increased, the sliding of the internal fluid and the surface is reduced and the wear due to impact is reduced [16]. Additionally, the simulation results showed that the highest erosion rate density occurred near and , which were close to the outlet. The two parts close to the exit had a lot of erosion because the internal flow changed radically, despite the increase in the spacing between the impeller and the throat bush.
3.2.2. Analysis of the Erosion Rate Density (E) Based on the Impeller Speed (v)
Figure 8 presents the erosion rate density based on the impeller rotation speed. The particle diameter and gap between the impeller and the throat bush were fixed at 44 and 1 , respectively. However, the impeller rotation speed was varied from 550 to 600 rpm and then to 650 rpm. As the impeller rotation speed increased, the erosion rate density increased. It increased more when the impeller rotation speed increased from 550 to 600 rpm compared with when the speed increased from 600 to 650 rpm. In general, if the rotational speed of the impeller increases, the speed of the internal flow also increases, and the impact wear also increases. Similar to the previous result, the highest erosion rate density was observed near and , which were close to the outlet.
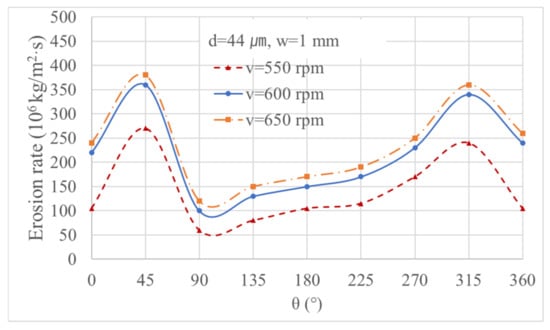
Figure 8.
Erosion rate density based on the distance between the parts.
3.2.3. Analysis of the Erosion Rate Density (E) Based on the Slurry Particle Diameter (d)
Figure 9 shows the erosion rate density based on the slurry particle diameter in microns. Here, the impeller rotation speed and the gap between the impeller and the throat bush were fixed at 600 rpm and 1 mm, respectively. However, the particle diameter was varied from 37 to 44 μm and then to 53 μm. As the particle diameter increased, the erosion rate density increased. However, the erosion rate density in the vicinity of was higher when the particle diameter was 44 than when the diameter was 53. This trend is because larger particles cause less impact wear but are more susceptible to sliding wear [16]. Similar to the previous results, the highest erosion rate density occurred near and , which were close to the outlet.
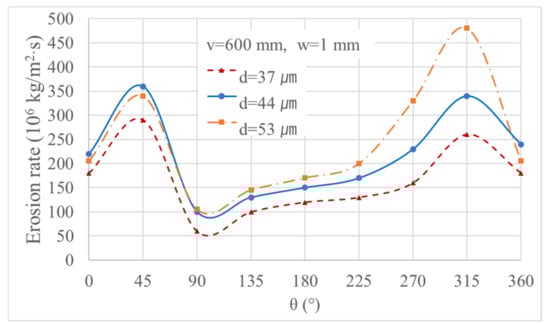
Figure 9.
Erosion rate density against different values of slurry particle.
4. Erosion Optimization
4.1. DPM Analysis with Response Surface Methodology (RSM)
Optimization analysis was conducted to reduce the erosion wear at the locations at which the previous analysis confirmed a high erosion rate density. As can be seen from the analysis results of the wear map, the largest amount of erosion occurred at 45° and 315°.
To analyze the optimal conditions for minimizing the wear at these two locations, we performed DPM analysis under the conditions shown in Table 4 using the Box–Behnken design of the response surface methodology (RSM) [28,29,30]. We set the analysis condition table with three factors and three levels, designed a total of 15 conditions, and designed the condition that repeats the center point three times. Statistical analysis was conducted using the statistical software program Minitab 17 based on the obtained data.
Table 4.
Results of experimental and predicted values.
4.2. Results and Analysis
We derived two regression equations. Equations (5) and (6) were for predicting the amount of erosion at the two points with the most wear on the wear map, namely, 45° and 315°, respectively. Analysis of variance (ANOVA) confirmed that all parameters significantly influenced the erosion rate density. A higher value of the regression coefficient indicates that the model equation is well fitted to the data. The values of the regression coefficients were as follows: Equation (5)— = 0.9963 and adjusted = 0.9926, and Equation (6)— = 0.599 and adjusted = 0.9375, where these equations show the best fits of the model with experimental data along with the p-values of the linear, quadratic, and interaction coefficients.
The regression equations for the erosion rate density were
where w, distance (mm); d, diameter (µm); and v, impeller rotation speed (rpm).
Figure 10a,b shows the response surface plots for the erosion rate density of the throat bush in the slurry pump. The curvature effect was confirmed to occur according to these parameters.
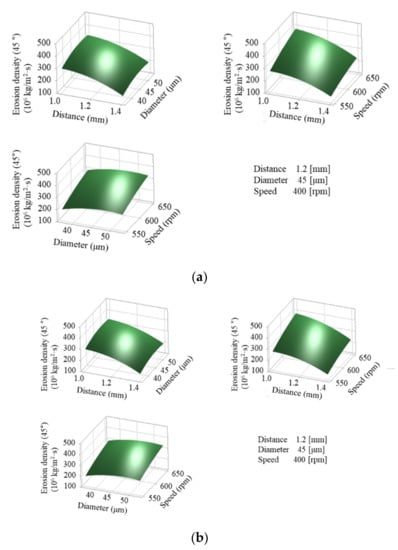
Figure 10.
The response surface plots for the erosion rate density: (a) erosion rate density at 45° locations of the wear map; (b) erosion rate density at 315°.
The response optimizer, which is a reaction optimization tool, was used to derive the optimal values for the gap between the impeller and the throat bush, impeller speed, and slurry particle diameter that affect the erosion rate density of the throat bush. Figure 11 shows the optimal condition results based on the parameters. The target function was set to minimize the erosion rate density in the and sections. The optimal process parameters and dimensions were derived by setting the constraint function to a flow rate of 7000 m3/h. The optimal conditions derived using the RSM were applied to the slurry pump for modeling, and a DPM simulation was performed. The results derived from the basic model and the DOE were compared with the optimized results. Table 5 presents a comparison of the results. The optimization results confirmed that the erosion rate density in the and sections of the throat bush was lower than that observed in the earlier model.
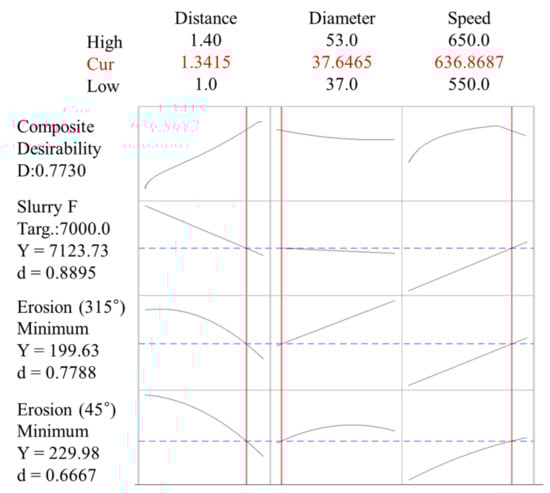
Figure 11.
Optimization conditions.
Table 5.
Optimization results.
5. Conclusions
This study aimed to investigate the erosion rate density of the throat bush via parameter optimization using DPM simulations and DOE to reduce the erosion wear of the throat bush owing to the operation of a slurry pump. We applied a statistical method using the design of experiments method to derive the conditions for minimizing the amount of erosion of the pump. We analyzed the erosion rate density (E) of a throat bush with a one-way layout for three different parameters to create a wear map, and as a result, derived the location where erosion occurred the most. To derive the conditions for reducing the erosion rate density at the derived location, we performed optimization using the response surface methodology (RSM). We derived variable conditions that could minimize the erosion rate density of the throat bush. This result is expected to help minimize the erosion of the throat bush in the slurry pump. The optimization method using DOE to derive a specific location with the greatest influence of design variables through the one-way layout method and optimize the response value at that location is a method that can efficiently analyze a large number of cases. We plan to analyze the amount of erosion by making a pump by reflecting the derived design and operating conditions and performing experiments, and we will verify the validity of the analysis in further studies. This is expected to be applicable in the field.
- (1)
- The casing, impeller, and throat bush of the slurry pump were modeled.
- (2)
- DPM simulation was performed using a one-way layout to compare the impact of the gap between the impeller and the throat bush, speed of the impeller, and slurry particle diameter on the erosion rate density. The occurrence of the highest erosion rate density was confirmed at the α = 45° and 315° sections of the throat bush through the wear map.
- (3)
- The parameters, that is, the gap between the impeller and the throat bush, impeller speed, and slurry particle diameter, were optimized using RSM to reduce the erosion rate density in the α = 45° and 315° sections of the throat bush. The optimization results confirmed that the erosion rate density was reduced in the optimization model compared with the earlier model.
Author Contributions
Conceptualization, Y.S.K. and E.S.J.; software, S.J.N.; validation, S.J.N. and Y.S.K.; writing—original draft preparation, Y.S.K.; writing—review and editing, Y.S.K.; supervision, E.S.J. All authors read and agreed to the published version of the manuscript.
Funding
This research was supported by the Human Resource Training Program (S2755803) for business-related research and development of Ministry of SMEs and Startups in 2019.
Institutional Review Board Statement
Not applicable.
Informed Consent Statement
Not applicable.
Data Availability Statement
Data are available in a publicly accessible repository.
Conflicts of Interest
The authors declare no conflict of interest.
References
- Singh, G. A review on erosion wear of different types of slurry pump impeller materials. Mater. Today Proc. 2020, 37, 2298–2301. [Google Scholar] [CrossRef]
- Brahim, B.; Meshram, S.G.; Abdallah, D.; Larbi, B.; Drisss, S.; Khalid, M.; Khedher, K.M. Mapping of soil sensitivity to water erosion by RUSLE model: Case of the Inaouene watershed (Northeast Morocco). Arab. J. Geosci. 2020, 13, 1–15. [Google Scholar] [CrossRef]
- Alawadhi, K.; Alzuwayer, B.; Alrahmani, M.; Murad, A. Evaluation of the Erosion Characteristics for a Marine Pump Using 3D RANS Simulations. Appl. Sci. 2021, 11, 7364. [Google Scholar] [CrossRef]
- Fritsche, M.; Epple, P.; Steber, M.; Rußwurm, H.J. Erosion Optimized Radial Fan Impellers and Volutes for Particle Flows. In Proceedings of the ASME 2017 International Mechanical Engineering Congress and Exposition, Tampa, FL, USA, 3–9 November 2017; Volume 58424. V007T09A071. [Google Scholar]
- Pagalthivarthi, K.; Gupta, P.; Tyagi, V.; Ravi, M. CFD prediction of erosion wear in centrifugal slurry pumps for dilute slurry flows. J. Comput. Multiph. Flows 2011, 3, 225–245. [Google Scholar] [CrossRef]
- Singh, J.; Singh, S. Neural network prediction of slurry erosion of heavy-duty pump impeller/casing materials 18Cr-8Ni, 16Cr-10Ni-2Mo, super duplex 24Cr-6Ni-3Mo-N, and grey cast iron. Wear 2021, 476, 203741. [Google Scholar] [CrossRef]
- Tarodiya, R.; Gandhi, B.K. Effect of particle size distribution on performance and particle kinetics in a centrifugal slurry pump handling multi-size particulate slurry. Adv. Powder Technol. 2020, 31, 4751–4767. [Google Scholar] [CrossRef]
- Peng, G.; Huang, X.; Zhou, L.; Zhou, G.; Zhou, H. Solid-liquid two-phase flow and wear analysis in a large-scale centrifugal slurry pump. Eng. Fail. Anal. 2020, 114, 104602. [Google Scholar] [CrossRef]
- Peng, G.; Fan, F.; Zhou, L.; Huang, X.; Ma, J. Optimal hydraulic design to minimize erosive wear in a centrifugal slurry pump impeller. Eng. Fail. Anal. 2021, 120, 105105. [Google Scholar] [CrossRef]
- Hao, G.; Zhang, C.; Sun, K.; Li, L.; Zhou, J. Research on the Influence of the Deflector Angle on the Droplet Trajectory Based on the CFD Discrete Phase Model. J. Physics Conf. Ser. 2020, 1600, 012034. [Google Scholar] [CrossRef]
- Mingzhi, Z.; Yiming, M.; Xiaobo, K. Base on DPM model to simulation Sand erosion on PV modules surface. IOP Conf. Ser. Earth Environ. Sci. 2018, 146, 012036. [Google Scholar]
- Li, R.; Sun, Z.; Li, A.; Li, Y.; Wang, Z. Design optimization of hemispherical protrusion for mitigating elbow erosion via CFD-DPM. Powder Technol. 2022, 117128. [Google Scholar] [CrossRef]
- Parsi, M.; Kara, M.; Agrawal, M.; Kesana, N.; Jatale, A.; Sharma, P.; Shirazi, S. CFD simulation of sand particle erosion under multiphase flow conditions. Wear 2017, 376–377, 1176–1184. [Google Scholar] [CrossRef]
- Solnordal, C.B.; Wong, C.Y.; Boulanger, J. An experimental and numerical analysis of erosion caused by sand pneumatically conveyed through a standard pipe elbow. Wear 2015, 336–337, 43–57. [Google Scholar] [CrossRef]
- Cloete, S.; Johansen, S.T.; Amini, S. Performance evaluation of a complete Lagrangian KTGF approach for dilute granular flow modelling. Powder Technol. 2012, 226, 43–52. [Google Scholar] [CrossRef]
- Noon, A.A.; Kim, M. Erosion wear on centrifugal pump casing due to slurry flow. Wear 2016, 364–365, 103–111. [Google Scholar] [CrossRef]
- Gohil, P.; Saini, R. Indian Institute of Technology Roorkee Numerical Study of Cavitation in Francis Turbine of a Small Hydro Power Plant. J. Appl. Fluid Mech. 2016, 9, 357–365. [Google Scholar]
- Messa, G.V.; Wang, Y.; Negri, M.; Malavasi, S. An improved CFD/experimental combined methodology for the calibration of empirical erosion models. Wear 2021, 476, 203734. [Google Scholar] [CrossRef]
- Guo, T.; Srivastava, A.; Flanagan, D.C. Improving and calibrating channel erosion simulation in the Water Erosion Prediction Project (WEPP) model. J. Environ. Manag. 2021, 291. [Google Scholar] [CrossRef]
- Li, Q.-Q.; Wu, C.-S.; Qian, B.; Wu, P.; Huang, B.; Wu, D.-Z. Investigation of the Matching Relation Between Impeller and Flow Channel of Regenerative Flow Pumps. J. Fluids Eng. 2021, 143, 061209. [Google Scholar] [CrossRef]
- Affatato, S. Wear of Orthopaedic Implants and Artificial Joints; Elsevier: Cambridge, UK, 2012. [Google Scholar]
- Shamsuddeen, M.M.; Ma, S.; Kim, S.; Yoon, J.; Lee, K.; Jung, C.; Kim, J. Flow Field Analysis and Feasibility Study of a Multistage Centrifugal Pump Designed for Low-Viscous Fluids. Appl. Sci. 2021, 11, 1314. [Google Scholar] [CrossRef]
- Menter, F. Innovative Turbulence Modeling: SST Model in ANSYS CFX. Available online: http://www.ansys.com/assets/tech-briefs/cfx-sst.pdf (accessed on 15 December 2020).
- Noon, A.A.; Kim, M. Erosion wear on Francis turbine components due to sediment flow. Wear 2017, 378–379, 126–135. [Google Scholar] [CrossRef]
- Gohil, P.P.; Saini, R. Effect of temperature, suction head and flow velocity on cavitation in a Francis turbine of small hydro power plant. Energy 2015, 93, 613–624. [Google Scholar] [CrossRef]
- Chang, P.; Xu, G.; Huang, J. Numerical study on DPM dispersion and distribution in an underground development face based on dynamic mesh. Int. J. Min. Sci. Technol. 2020, 30, 471–475. [Google Scholar] [CrossRef]
- Karimipour, A.; Esfe, M.H.; Safaei, M.R.; Semiromi, D.T.; Jafari, S.; Kazi, S. Mixed convection of copper–water nanofluid in a shallow inclined lid driven cavity using the lattice Boltzmann method. Phys. Stat. Mech. Appl. 2014, 402, 150–168. [Google Scholar] [CrossRef]
- Kim, S.; Choi, Y.; Lee, K.; Yoon, J. Design optimization of centrifugal pump impellers in a fixed meridional geometry using DOE. Int. J. Fluid Mach. Syst. 2009, 2, 172–178. [Google Scholar] [CrossRef][Green Version]
- Oh, M.H.; Ko, J.; Park, J.Y.; Choi, M. Optimization of a circumferential groove in a centrifugal compressor. Int. J. Turbo Jet-Engines 2020. [Google Scholar] [CrossRef]
- Kim, J.; Lee, H.; Kim, J.; Choi, Y.; Yoon, J.; Yoo, I.; Choi, W. Improvement of hydrodynamic performance of a multiphase pump using design of experiment techniques. J. Fluids Eng. 2015, 137, 081301. [Google Scholar] [CrossRef]
Publisher’s Note: MDPI stays neutral with regard to jurisdictional claims in published maps and institutional affiliations. |
© 2022 by the authors. Licensee MDPI, Basel, Switzerland. This article is an open access article distributed under the terms and conditions of the Creative Commons Attribution (CC BY) license (https://creativecommons.org/licenses/by/4.0/).