Abstract
We propose two new sensors based on surface plasmon resonance (SPR) and optical fibers to determine the concentration of sucrose in products such as beverages, honey, condensed milk, etc., in real-time during the fabrication process or when the product has been manufactured. The sensors have been made with a hemispherical prism, a layer of MgF2, and another of Ag or Al with the Kretschmann configuration, and they are modulated in intensity. We have optimized these sensors from the modeling of reflectance curves. We have carried out a numerical simulation with these sensors to show how they can detect small changes in the refractive index depending on the concentration of sucrose where the device is immersed. The maximum sensitivity of the sensors is 11.9 RIU−1 and 5.7 RIU−1, the resolutions 1.7 × 10⁻⁴ RIU and 7.9 × 10⁻⁴ RIU, and the detection limits between 0-78Brix. Moreover, the sensors have an alarm system that is triggered when the sucrose concentration is insufficient or excessive. Data can also be sent in real-time to a remote place.
1. Introduction
It is a fact that plasmonic sensors are currently the ones that provide the highest sensitivity [1], particularly in the field of food [2,3].
In the beverage industry, it is extremely difficult to continuously measure the real concentration of mixed substances in real-time without extracting a sample.
In the fermentation of alcoholic beverages, it is essential to know the exact concentration of ethanol, glucose, fructose, sucrose, etc. in real time because this quantity determines the percentage volume of alcohol. This concentration is traditionally measured in the same way as commented above, i.e., a quantity of liquid is extracted and analyzed outside the barrel, tank, or container, therefore, the determination of the concentration is not continuous, and the fermentation process control is not possible to automate [4].
The concentration of glucose/ethanol depends not only on the moment of taking the measurement but also on the place where the sample is taken from because the mixtures are usually inhomogeneous.
To carry out an analysis with an electronic tongue, as with other analytical techniques it is habitual to extract a sample from the system which can then be studied, moreover, these tongues use reactions that have to be replaced [5].
During the manufacturing process, it is necessary to know the quantity of sucrose in the mixture (both types of syrups) to control the dissolution. This control is carried out by extracting a sample and analyzing it. This is a problem because we do not know either the quantity of sucrose or the heterogeneity of the mixture in the tanks in real-time and this causes a delay in the manufacturing process. Moreover, if the sucrose distribution is not uniform (as can occur) the concentration will depend on what part of the tank the sample is extracted from, and results cannot adjust to the actual composition. Moreover, the process is time-consuming and in various steps, and the control of the concentration of sucrose has to be verified many times in many places.
In 2009, Silveira et al. [6] measured the sucrose concentration in lemon-type soft drinks with dispersive Raman spectroscopy. To carry out the measurement, a quantity of liquid had to be extracted from the container and be analyzed outside, therefore, the measuring, although very precise and accurate, was not continuous, and these measurements depended on the sample and the place where the sample was taken from.
Ilaslan et al. [7] used Raman spectroscopy to determine the concentration of fructose, glucose, and sucrose in soft drinks. This method involves extracting a portion of liquid and then measuring it. The concentration of the sample could vary depending on the place where it was extracted from and thus, the measurements were not continuous.
Nayak et al. [8] fabricated two stable fiber optic sucrose sensors, one with EGO-Au NPs (encapsulated graphene oxide and gold nanoparticles) and the other with AuNPs tested for wavelength (450–850 nm) with a resolution of 8.7 × 10⁻⁵ RIU (EGO). The sensor measures sucrose concentration by the change in the peak absorbance due to the deposition of EGO-Au NPs in the core of an optical fiber.
Harnsoongnoen et al. [9] measured the concentration of sucrose in liquids with a coplanar waveguide loaded with a split ring resonator-based microwave sensor for aqueous sucrose solutions. The results are quite good, but the range of concentration was only 0–1 gmL−1. As in the former cases, a sample has to be taken from the tank and measured, so, the measurements are not continuous.
Bagal-Kestwal et al. [10] enhanced the sensitivity of a sucrose biosensor with ultra-microelectrode. In this case, a sample has to be prepared outside the product and it takes more than 20 min.
Fujiwara et al. [11] developed an optical fiber sensor to determine the concentration of sucrose and ethanol in process streams and effluents of the sugarcane bio-ethanol industry. The physical principle is the Fresnel reflection. This type of sensor does not measure directly from the medium, but a sample has to be taken for measurement.
Saetear et al. [12] developed a device to determine sucrose and phosphate content, in cola drinks, using a sequential injection system with a low-cost paired emitter-detector diode by mean of the schlieren effect and turbidity. This method is readily applicable for automation and is found to be an alternative method to conventional procedures for online quality control processes in the cola-drink industry, but the method is not able to measure concentrations.
A sensor-based on hetero-core structured fiber optics would be able to measure the degree Brix of beverages correlating the peak wavelength and sucrose concentration [13]. The optical fiber is illuminated with white light and the peak of loss of every wavelength is correlated with the concentration. This sensor is only able to measure sucrose concentrations from 0–23.467%.
With the current processes, we are unable to automate the entire system, the extraction of the sample is essential, then the analysis, and in view of the results, add, extract or do nothing. If the determination of the concentration of sucrose were continuous, i.e., the determination of the concentration of sucrose anywhere in the tank and in real-time, the system would be able to give the order to add sugar or not to the dissolution and completely automate the process in the production line of the soft drink.
In view of all the limitations of the sensors described above, we propose an SPR sensor to measure the concentration of sucrose for a wide range of concentrations.
In this research, we have designed two surface plasmon resonance (SPR) sensors based on intensity interrogation for measuring refractive indexes. We have used the Kretschmann configuration [14].
2. Design of the Plasmonic Sensor
The theoretical basis of surface plasmons and SPR sensors can be consulted in [14,15].
The sensor is composed of the following parts:
- -
- P-polarized incident laser at 589 nm (sodium D line) and with S polarization, surface plasmon polaritons (SPPs) are not excited, for this reason, it is used the P polarization [16].
- -
- Hemispherical prism SF10 with refractive index np = 1.72803 [17] has a radius of curvature of approximately 0.56 cm with a spherical surface of approximately 4 cm2 and a flat surface, corresponding to the contact surfaces of the layers with the medium of 2 cm2.
We propose two different materials for the metal medium, either aluminum nm = 0.94483 + 6.2571i [18], a thickness of 10 nm, a dielectric layer of magnesium fluoride (MgF2), refractive index nd = 1.3776 [19] and thickness of 110 nm or silver (Ag) nm = 0.049787 + 3.9063i [20], a thickness of 30.2 nm and a dielectric layer of MgF2, refractive index nd = 1.3776 [19] and thickness of 81 nm.
Figure 1 shows the diagram of the two sensors.
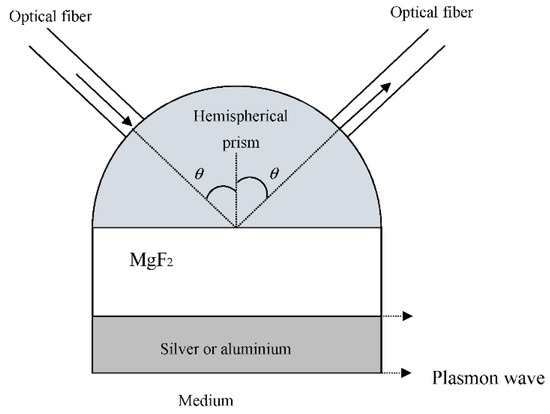
Figure 1.
Diagram of the two plasmonic sensors. At the top, on the left, the optical fiber transports the incident radiation to the hemispherical prism, and at the top, on the right, another optical fiber collects the reflected radiation. The SPPs are also shown propagating through the MgF2-silver/aluminum and/or silver/aluminum-medium interfaces.
The medium is a sucrose solution the refractive index of which is measured. Data of the refractive index and the concentration are in the chemistry and physics handbooks [19]. All the data are obtained at 20 °C, normal pressure (1 atm), and are measured at a wavelength of 589 nm (sodium D line).
- -
- Detector: this is used to collect the signal transported by the optical fiber from the hemispherical prism. The angle of half sensitivity is not critical as the radiation will hit the perpendicular detector. The detector must be a high-speed and highly sensitive PIN photodiode chip with, at least, π mm2 sensitive circular area to cover the straight section of the output optical fiber. It has to be sensitive to visible light. It should have peak sensitivity at 589 nm or near to it. The minimum accuracy of the detector must be 0.2%.
- -
- Optical fiber: this is used only to transport the light from the laser to the hemispherical prism and from the hemispherical prism to the detector. The input and output optical fibers must be the same so that the losses are the same, and there is no asymmetry, and the reflectance can be calculated with minimum error. Taking into account the size of the hemispherical prism, the dimensions of the fibers can be: core diameter, cladding, and buffer 1 mm, 1.05 mm, and 1.25 mm, respectively. The core is pure fused silica, and the cladding is a polymer. The optical fiber is a multimode step-index and has an attenuation of 10 dB/km and a transmittance close to 100% at the working wavelength. To reduce costs, low working temperatures are not needed but it may be that high temperatures are needed, around 100 °C when working with aqueous solutions close to boiling point.
Electronic device: this processes the signal collected from the detector. It is connected to a PC to have the measurements in real-time (the refractive indexes and the concentration of sucrose). The system is connected with the sucrose filling machine. If the concentration of the sucrose is not high enough, the electronic device orders more sucrose to be added to the solution. If it is the correct amount, the electronic device remains on standby. If the concentration of sucrose is higher than the correct amount, the electronic device orders more water to be added until the correct concentration is achieved. The system is equipped with programmable alarms if is required.
As can be seen in Figure 1, the light which travels through an optical fiber is injected into the hemispherical prism. The reflected light inside the prism, in the glass-MgF2 interface, is injected into another optical fiber and is conducted to a detector. It is constantly in contact with an electronic system to process the signal in real-time.
The angle of incidence with respect to the normal in the MgF2 is θ. When the light strikes the hemispherical prism-MgF2 interface at an angle θ greater than the critical angle, an evanescent wave is generated and is propagated along with the hemispherical prism-MgF2 interface. This evanescent wave is able to excite two SPPs depending on the thickness of the layers. The energy of the incident light is then transferred to the surface plasmons, resulting in a sharp dip in the intensity of the light reflected [14]. The theoretical modeling of SPR reflectance was carried out using the transfer-matrix method to solve the Fresnel equations for the multi-layer stack [21,22] with a WinSpall software package. WINSPALL is a free PC-based piece of software that computes the reflectivity of optical multilayer systems. It is based on the Fresnel equations and the matrix formalism. It is used to analyze surface plasmon experiments.
The sensors that we propose are based on intensity interrogation and therefore have the advantage of not having moving parts, so there is no mechanical wear and tear, and they will have a long useful life.
MgF2 is very transparent to visible wavelengths (our sensor) and is an anti-reflective compound so it will increase the light intensity in the back metal layer (Ag or Al). Another advantage of this compound is that it is very easily deposited on the glass, which is why the manufacture of the sensor is cheaper. The last layer of Al or Ag is easy to deposit so the central sensor block is easy to manufacture.
The optical fibers are glued with index equalizing epoxy resin (nep = 1.44) to reduce the inevitable Fresnel reflections as much as possible. The optical fibers are glued at an angle with the normal to the base of the prism equal to that calculated for each sensor. Being a hemispherical prism, the light enters perpendicular to its face, and we do not have to take into account Snell’s law as in the case of prisms with flat faces.
3. Results and Discussion
3.1. Fresnel Reflection Losses
As we explained in Section 2, we have designed two sensors with two different structures MgF2-Ag and MgF2-Al.
Losses by Fresnel Reflection occur at any boundary of a medium where the refractive index changes, causing a part of the incident radiation to be reflected to the first medium and another part to be refracted to the second medium.
The losses caused in the changes of media of the two optical fibers are the same since the light is refracted or reflected in the same media.
The equation that gives us the Fresnel reflection losses is
where n1 is the refractive index of the medium in which the light is incident and n2 is the refractive index in which the light is refracted. Applying Equation (1) to the different interfaces we have:
Losses in the optical fiber-epoxy resin interface are 4.61598 × 10⁻⁵ dB.
Losses in the epoxy resin-prism interface are 0.00360481 dB.
Losses in the hemispherical prism-MgF2 interface are 0.005565023 dB.
Losses in the hemispherical prism-epoxy resin interface are 0.00360481 dB.
Losses in the epoxy resin-optical fiber interface are 4.61598 × 10⁻⁵ dB.
Therefore, to sum up, the total losses are 0.013 dB, a very low value.
3.2. Sensor MgF2-Ag
The angle where the second surface plasmon occurs is 87°. Since it is a difficult angle to achieve experimentally in the incidence of the optical fiber on the MgF2 layer, we could work in the interval between 87–80° which is much easier, and the reflectance lines (and therefore the sensitivity) to follow are sufficiently separated. The thickness of the MgF2 is 81 nm and the thickness of the silver one is 30.2 nm. Figure 2 shows the reflectance curves. We have chosen the compound MgF2 and the elements Ag because they had refractive indices that make the curves in Figure 2 more widely spaced, therefore they were able to better distinguish between concentrations by increasing the sensitivity with respect to the other substances.
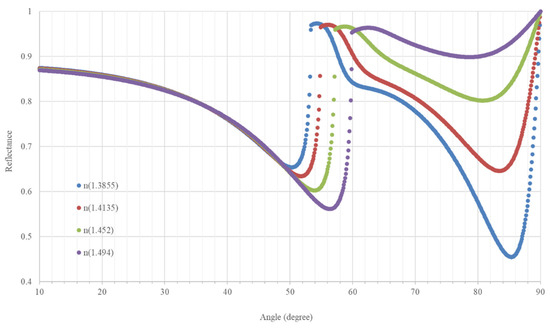
Figure 2.
Reflectance curves as a function of the angle of incidence of the light in the prism for the range of refractive index values.
The reflectance curve vs. the refractive index of the concentration of sucrose is shown in Figure 3.
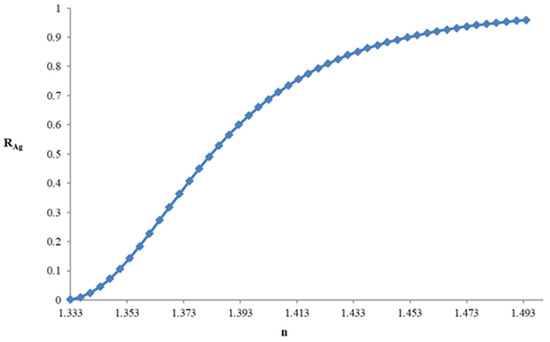
Figure 3.
Reflectance curve vs. refractive index of the sucrose solution.
The reflectance curves vs. the concentration of sucrose are shown in Figure 4. We have used data from [19].
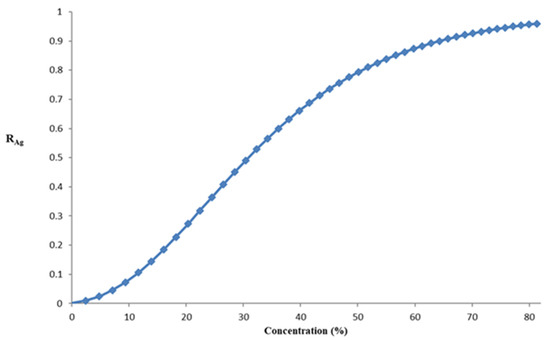
Figure 4.
Reflectance curve vs. concentration of sucrose.
As Figure 3 and Figure 4 show the sucrose concentration (or the refractive index of the solution) can be determined by measuring the reflectance.
The increase in reflectance with the refractive index is a monotonically increasing function although it is not linear and shows that the refractive index increases with the concentration of sucrose.
The sensitivity of our sensor can be calculated from the change in reflectance per unit of change of refractive index. The sensitivity range is between 1 RIU−1 and 11.9 RIU−1, the maximum value corresponding to a 22% sucrose concentration. Thus, when the sucrose concentration diminishes or increases, the sensitivity diminishes.
The sensor resolution depends upon the accuracy with which the monitored SPR parameter can be determined by the specific sensing device and as such is limited by sensor-system noise. To calculate the resolution of the sensor, we divided the accuracy of the photodetector by its sensitivity. Considering an accuracy of 0.2% in the signal registered by the photodetector [23,24], we achieved a resolution of between 1.7 × 10⁻⁴ RIU and 1.9 × 10⁻³ RIU. As we can see, the uncertainty is in the third and fourth decimal places. In the case of the fourth decimal place, the maximum accuracy is taken into account and so the refractive indexes are given with four decimal numbers.
3.3. Sensor MgF2-Al
The operational angle is 61° because it is where there is more distance among the reflectance curves and each concentration is better distinguished. The thickness of the MgF2 is 110 nm and the aluminum is 10 nm. We have chosen the compound MgF2 and the elements Ag because they had refractive indices that made the curves in Figure 5 more widely spaced, in this way, they could better distinguish between concentrations by increasing the sensitivity with respect to the other substances. Figure 5 shows the reflectance curves.
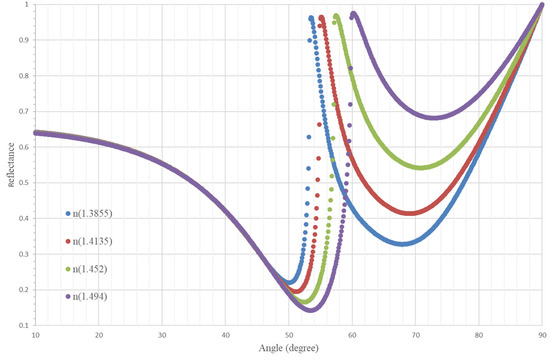
Figure 5.
Reflectance curves as a function of the angle of incidence of the light in the prism for the range of refractive index values.
In this configuration, the range of refractive indexes is less than the sensor with the silver layer.
The reflectance curve vs. refractive index of the concentration of sucrose is shown in Figure 6.
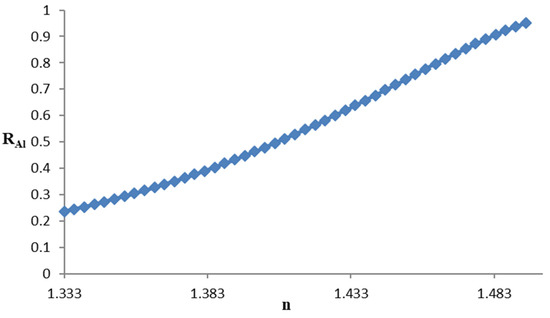
Figure 6.
Reflectance curve vs. refractive index of the sucrose solution.
The reflectance curves vs. the concentration of sucrose are shown in Figure 7.
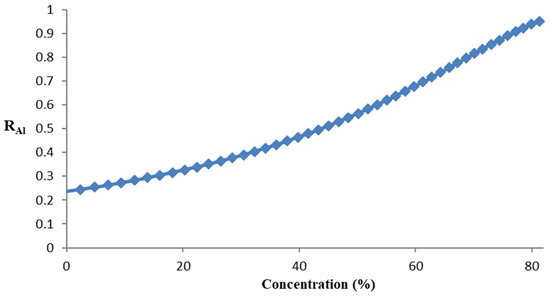
Figure 7.
Reflectance curve vs. the concentration of sucrose.
The increase in reflectance with the refractive index is a monotonically increasing function as in the sensor with aluminum although this one is a little more linear than the previous one.
In the aluminum sensor, the sensitivity values are between 2.5 RIU−1 and 5.7 RIU−1, and the resolution is between 3.5 × 10⁻⁴ RIU and 7.9 × 10⁻⁴ RIU. This sensitivity decreases when the concentration of sucrose decreases or increases.
In the case of the aluminum sensor, the maximum sensitivity and resolution are reached in the region of high values of sucrose concentration, whilst in the case of the silver sensor formed the maximum sensitivity is in the region of low values of sucrose concentration.
Chen [25] proposed a biosensor with optical fiber-based on nanoparticles of silver and modulated in intensity. The sensitivity of this sensor is 1.6 RIU−1 and the resolution 4.68 × 10⁻³ RIU with a resolution of 0.75% of the photodetector. In our sensor, the resolution of our photodetector is 0.2%. Considering 0.2% in Chen’s sensor, 1.2 × 10⁻³ RIU would be obtained, thus, comparing our sensor with Chen’s sensor, the resolution of our aluminum sensor is better, and the silver sensor is the same in the zone of worst resolution and better in the other zones.
We can compare our sensor with others based on absorbance, interrogation in angle, and interrogation in wavelength. Nayak et al. [8] proposed a plasmonic sensor based on absorbance. They obtained a resolution of 8.7 × 10⁻⁵ RIU, better than ours, due to the resolution of their spectrometer (0.0002), but not due to the sensor.
Compared with sensors based on interrogation in wavelength or angular, we have better sensitivity and resolution than those based on wavelengths but worse than those based on the interrogation of angle [26]. The advantage, in our case, is that we use a simple photodetector for measuring instead of a spectrometer and we do not have to take a sample, we measure continuously.
Comparing ranges, we can measure concentrations of up to 78% sucrose solution, a very long range compared with others which are considered to have a wide range [26] such as a range of 60%.
Although the sensor designed by Tanvir Ahmed et al. [27] is not specifically for sucrose, when it works in amplitude interrogation, it has a maximum sensitivity of 93 RIU−1 when the refractive indices are in the range 1.42–1.43, which are in the same order of magnitude as our maximum sensitivity.
When compared with the glucose concentration measurement sensor from Alok Kumar Paul et al. [28] its maximum sensitivity is 14,847.03 RIU−1 with analyte with a refractive index of 1.333 and 7351.82 RIU−1 with analyte with a refractive index of 1.331, which are refractive indices of distilled water, however, they do not give the sensitivity for all the other concentrations of sucrose.
Table 1 summarizes the key characteristics of the studied sensors so that they can be compared easily and quickly. The number in brackets corresponds to the reference number of the paper.

Table 1.
Summary table with the essential characteristics of the sensors studied.
The components of the sensor (glass, epoxy resin, plastic, and Al/Ag) could be in contact with the sucrose solutions and all these materials do not alter their composition and are not harmful to health because they do not form secondary compounds. Even so, the optical fibers and the epoxy resin could be covered to avoid contact if they are in contact with human beverages for the health authorities. The complete sensor (Figure 1) is submerged in the dissolution tank; therefore, we can measure the concentration in real-time [29] in situ without having to extract samples. Thanks to the optical fibers, the emitting laser, and the receiving photodiode can be in distant places, even in different laboratories. By using optoelectronic coupling, there is no danger of electric shocks or electrocution with aqueous solutions.
Of all the components that are part of the sensor, optical fibers, hemi-prism (glass), light source (laser), and photodetector, those with a lower average life are the last two, so their average life will be the life of the sensor if it is used properly.
4. Conclusions
The measuring device presented in this study offers many advantages over sensors described by the majority of other authors.
We have designed a sensor to measure the concentration of sucrose in real-time based on SPR. The sensor is based on intensity interrogation; therefore, it is not necessary to extract a sample and measure the concentration in tanks, recipients, deposits, or any other container where the sucrose solution is. Compared with the sensors based on angle interrogation, we avoid the extraction of the sample from the container, so we know the exact place where we are measuring which does not occur when using the angle interrogation sensor.
Both the silver and the aluminum-coated sensors are able to measure 95% of the reflectance, i.e., the outer signal is very high.
Our sensor works with only one laser, only one photodiode, and only two optical fibers, for this reason, it only needs one hole in the upper side of the tank or container (if the tank has to be closed) for the solution we want to measure. As the device works with one only wavelength, periodical calibrations are unnecessary.
In addition, it is capable of continually measuring concentrations of sucrose with very similar (or very different) refractive indexes which do not attack the optical fiber, or the structure used.
The overall system is equipped with a visual and audible alarm which can be regulated to any low or high concentration of sucrose. Another specification is that the gauge is controlled by a PC capable of storing the data in the memory, printing them, or sending them in real-time by internet.
Our sensor could be integrated with others capable of measuring concentrations of salt, acids, etc., and become part of an electronic language.
Author Contributions
Conceptualization, A.M.P. and F.P.-O.; methodology, J.M.S.; software, J.M.S. and O.R.; validation, A.M.P. and F.P-O.; formal analysis, J.M.S.; investigation, A.M.P., F.P.-O., J.M.S. and O.R.; resources, A.M.P., F.P.-O., J.M.S. and O.R.; data curation, J.M.S. and O.R.; writing—original draft preparation, F.P.-O.; writing—review and editing, A.M.P., J.M.S. and O.R.; visualization, A.M.P., F.P.-O., J.M.S. and O.R.; supervision, A.M.P. All authors have read and agreed to the published version of the manuscript.
Funding
This research received no external funding.
Institutional Review Board Statement
Not applicable.
Informed Consent Statement
Not applicable.
Data Availability Statement
Not applicable.
Acknowledgments
The authors wish to thank Angela L. Tate, a native English speaker and expert in translations of scientific papers, for her assistance with the English version.
Conflicts of Interest
The authors declare no conflict of interest.
References
- Gomez-Cardona, N.; Reyes-Vera, E.; Torres, P. High sensitivity refractive index sensor based on the excitation of long-range surface plasmon polaritons in H-shaped optical fiber. Sensors 2020, 20, 2111. [Google Scholar] [CrossRef] [PubMed] [Green Version]
- Yuana, J.; Denga, D.; Laurena, D.R.; Aguilarb, M.I.; Wua, Y. Surface plasmon resonance biosensor for the detection of ochratoxin A in cereals and beverages. Anal. Chim. Acta 2009, 656, 63–71. [Google Scholar] [CrossRef] [PubMed]
- Monfared, Y.E. Overview of recent advances in the design of plasmonic fiber-optic biosensors. Biosensors 2020, 10, 77. [Google Scholar] [CrossRef] [PubMed]
- Lea, A.G.H.; Piggott, J.R. Fermented Beverage Production, 2nd ed.; Springer: New York, NY, USA, 2003. [Google Scholar]
- Peris, M.; Escuder-Gilabert, L. Electronic noses and tongues to assess food authenticity and adulteration. Trends Food Sci. Tech. 2016, 58, 40–54. [Google Scholar] [CrossRef] [Green Version]
- Silveira, L., Jr.; Moreira, L.M.; Conceição, V.G.B.; Casalechi, H.L.; Muñoz, I.S.; Silva, F.F.D.; Silva, M.A.S.R.; Souza, R.A.D.; Pacheco, M.T.T. Determination of sucrose concentration in lemon-type soft drinks by dispersive Raman spectroscopy. J. Spectrosc. 2009, 23, 217–226. [Google Scholar] [CrossRef]
- Ilaslan, K.; Boyaci, I.H.; Topcu, A. Rapid analysis of glucose, fructose and sucrose contents of commercial soft drinks using Raman spectroscopy. Food Control 2015, 48, 56–61. [Google Scholar] [CrossRef]
- Nayak, J.K.; Parhi, P.; Jha, R. Graphene oxide encapsulated gold nanoparticle based stable fibre optic sucrose sensor. Sens. Actuators B Chem. 2015, 221, 835–841. [Google Scholar] [CrossRef]
- Harnsoongnoen, S.; Wanthong, A. Coplanar waveguides loaded with a split ring resonator-based microwave sensor for aqueous sucrose solutions. Meas. Sci. Technol. 2016, 27, 1–6. Available online: https://iopscience.iop.org/article/10.1088/0957-0233/27/1/015103 (accessed on 12 December 2021). [CrossRef]
- Bagal-Kestwal, D.; Karve, M.S.; Kakade, B.; Pillai, V.K. Invertase inhibition based electrochemical sensor for the detection of heavy metal ions in aqueous system: Application of ultra-microelectrode to enhance sucrose biosensor′s sensitivity. Biosens. Bioelectron. 2008, 24, 657–664. [Google Scholar] [CrossRef]
- Fujiwara, E.; Ono, E.; Suzuki, C.K. Application of an optical fiber sensor on the determination of sucrose and ethanol concentrations in process streams and effluents of sugarcane bioethanol industry. IEEE Sens. J. 2015, 12, 2839–2843. [Google Scholar] [CrossRef]
- Saetear, P.; Khamtau, K.; Ratanawimarnwong, N.; Sereenonchai, K.; Nacapricha, D. Sequential injection system for simultaneous determination of sucrose and phosphate in cola drinks using paired emitter-detector diode sensor. Talanta 2013, 115, 361–366. [Google Scholar] [CrossRef] [PubMed]
- Seki, A.; Narita, K.; Watanabe, K. Refractive index measurement in sucrose solution and beverage using surface plasmon resonance sensor based on hetero-core structured fiber optic. Procedia Chem. 2016, 20, 15–117. [Google Scholar] [CrossRef] [Green Version]
- Pozo, A.M.; Pérez-Ocón, F.; Rabaza, O. A Continuous Liquid-Level Sensor for Fuel Tanks Based on Surface Plasmon Resonance. Sensors 2016, 16, 724. [Google Scholar] [CrossRef] [PubMed] [Green Version]
- Li, M.; Cushing, S.K.; Wu, N. Plasmon-enhanced optical sensors: A review. Analyst 2015, 140, 386–406. [Google Scholar] [CrossRef] [PubMed] [Green Version]
- Popescu, A.A. Surface plasmon resonance: Concept and applications for nano-sensors and optical active devices. In Proceedings SPIE. Advanced Topics in Optoelectronics, Microelectronics, and Nanotechnologies (ATOM-N); SPIE: Constanta, Romania, 2015. [Google Scholar] [CrossRef]
- Polyanskiy, M. SF10 Optical Glass-Refractive Index of SF10, RefractiveIndex. INFO Website: © 2008–2020. Available online: https://refractiveindex.info/?shelf=glass&book=SF10&page=SCHOTT (accessed on 9 January 2020).
- McPeak, K.M.; Jayanti, S.V.; Kress, S.J.; Meyer, S.; Iotti, S.; Rossinelli, A.; Norris, D.J. Plasmonic films can easily be better: Rules and recipes. ACS Photonics 2015, 2, 326–333. [Google Scholar] [CrossRef]
- Lide, D.R. CRC Handbook of Chemistry and Physics, 100th ed.; CRC press: Boca Raton, FL, USA, 2019. [Google Scholar]
- Babar, S.; Weaver, J.H. Optical constants of Cu, Ag, and Au revisited. Appl. Opt. 2015, 54, 477–481. [Google Scholar] [CrossRef]
- Heavens, O.S. The optical properties of thin solid films, thin films optics. In Optical Properties of Thin Solid Films, 2nd ed.; Dover Publications: New York, NY, USA, 2011; pp. 45–96. [Google Scholar]
- Ohta, K.; Ishida, H. Matrix formalism for calculation of electric field intensity of light in stratified multilayered films. Appl. Opt. 1990, 29, 1952–1959. [Google Scholar] [CrossRef]
- Homola, J.; Yee, S.S.; Gauglitz, G. Surface plasmon resonance sensors: Review. Sens. Actuators B Chem. 1990, 54, 3–15. [Google Scholar] [CrossRef]
- Ronot-Trioli, C.; Trouillet, A.; Veillas, C.; Gagnaire, H. Monochromatic excitation of surface plasmon resonance in an optical fibre refractive-index sensor. Sens. Actuators A Phys. 1996, 54, 589–593. [Google Scholar] [CrossRef]
- Chen, J.; Shi, S.; Su, R.; Qi, W.; Huang, R.; Wang, M.; Wang, L.; He, Z. Optimization and application of reflective LSPR optical fiber biosensors based on silver nanoparticles. Sensors 2015, 15, 12205–12217. [Google Scholar] [CrossRef]
- Zhang, J.; Chen, W.P.; Dong, C. Fiber-Optic sucrose sensor based on mode-filtered light detection. J. Carbohyd. Chem. 2013, 32, 475–482. [Google Scholar] [CrossRef]
- Ahmed, T.; Haider, F.; Aoni, R.A.; Ahmed, R. Highly sensitive U-shaped micro-channel photonic crystal fiber–based plasmonic biosensor. Plasmonics 2021, 16, 2215–2223. [Google Scholar] [CrossRef]
- Paul, A.K.; Mollah, M.A.; Hassan, M.Z.; Gomez-Cardona, N.; Reyes-Vera, E. Graphene-coated highly sensitive photonic crystal fiber surface plasmon resonance sensor for aqueous solution: Design and numerical analysis. Photonics 2021, 8, 155. [Google Scholar] [CrossRef]
- Homola, J. Surface Plasmon Resonance Based Sensors; Series on Chemical Sensors and Biosensors; Springer: Berlin/Heidelberg, Germany, 2006. [Google Scholar]
Publisher’s Note: MDPI stays neutral with regard to jurisdictional claims in published maps and institutional affiliations. |
© 2022 by the authors. Licensee MDPI, Basel, Switzerland. This article is an open access article distributed under the terms and conditions of the Creative Commons Attribution (CC BY) license (https://creativecommons.org/licenses/by/4.0/).