1. Introduction
The demand for Electrical energy is increasing over time. Thus, the consumption of fossil fuels is also growing rapidly and their results greatly affect the environment, for instance, in terms of fossil fuel produces Carbon and Sulphur dioxide which causes the greenhouse effect. Presently, Renewable Energy Resources (RES) are playing a significant role in substituting the traditional energy resources of fossil fuel. Thus, many countries are switching to RES e.g., Iceland, Sweden, the U.S., Costa Rica, and Nicaragua. In the previous decade among all RES, solar energy has emerged as a promising source of energy and has gained more attention because it is a noise-free, pollution-free, increasingly cost-effective, and limitless source of energy. In the coming years based on recent advancements in solar technologies, PV energy has brought significant development in the solar PV market as it is expecting to surpass other RES as well.
PV systems, on the other hand, have faced a number of issues, one of which is maximizing efficiency under varying irradiance circumstances. Characteristic curves of I-V & P-V of a photovoltaic system by nature are non-linear due to the changing nature of the sun, manufacturing tolerance, aging, shadowing, bird dropping and different orientations of the Solar cells to the sun rays [
1]. The non-linear behavior of the PV system is a result of partial shading [
2]. As a result, maximum power point tracking (MPPT) has emerged as the primary problem for PV systems.
By changing the duty cycle of the DC-DC converter, the problem of the partial shading is resolved with the capability to track MPPT. Many local maxima (LM) and single GM are visible on the PV and I-V characteristics curves of PV energy systems. To obtain the desired optimization, the pulse signal of the DC-DC converter is required to be controlled by a power switch.
Whenever the PV array is exposed to uniform irradiance, almost every algorithm works well; but, when the PV module is partially shaded, its performance deteriorates. Many researchers have looked into extracting the full output power from shaded PV modules, using various integrated power typologies for both offline and online grid connecting PV energy systems [
3].
Different Perturb & Observe (P&O) and Incremental Conductance (InC) Maximum power point (MPP) techniques have been used in the PV system by the researcher. For detecting the GM, P-V & I-V curves are used. The techniques used in [
4] are evaluated based on speed, accuracy, and complexity. Fractional Short Circuit Current (FSCC), P&O, Fractional Open Circuit Voltage (FOCV), and InC techniques are conventional and most commonly employed techniques in PV energy systems [
5].
FOCV method is easy to implement as it uses only one feedback loop. InC can use analog devices instead of digital components i.e microcontrollers. To update the open-circuit voltage, the output of PV modules needs to be opened frequently [
6]. This algorithm offers low efficiency due to the expected error in
and power loss during the measurement of
. Due to the use of approximate values for the correlation between
and
, this method is incapable to choose the real MPP values.
To get FSCC, the PV array needs to be shorted for a small interval of time using an additional switch which makes this technique more troublesome as compared to the FOCV method. Like the FOCV method, this technique cannot track real MPP due to approximations. To overcome this problem, the photovoltaic voltage sweeping process is proposed to attain real MPP. So, it will obscure the system that increase the overall system cost [
7]. The algorithm must be calibrated first, so
is adjusted to 0.05
and
is configured to 0.95
, so the MPP is between 5% to 95% of
, where
is the open-circuit voltage under standard testing conditions (STC) [
8].
From the conventional MPPT techniques, the P&O method perturbs the voltages and observes the power of the system. If the previous power is less than the new power, the homogeneous process of power perturbation is repeated for locating the MPP. Otherwise, it will reverse the perturbation process for tracking MPP. The major disadvantage of P&O is the oscillation of the system around MPP which results in energy loss that’s why this method is not suitable for varying weather conditions. Reference voltage that has a small step size and precise duty cycle can compensate for these issues.
To compensate for the problems of P&O, adaptive P&O techniques with changing step size are proposed in the literature [
9]. Based on the position of the switching point, changing pulse signal techniques settles the step size of the DC to DC converter. When the MPP is far from the position of the operating point then a larger step size is employed. The size of the pulse signal decreases whenever it is located nearer to MPP. So, at MPP step size can decrease to zero.
An improved effective hybrid MPPT of PV combines the modified enhanced PSO and P&O. To minimize the area between the P-V curves, the Search Skip Judge (SSJ) Mechanism is incorporated. In this way, the unneeded motion of the particle is reduced causing fast convergence. An initial form of the SSJ proposed algorithm is evaluated in comparison with widely known MPPT algorithms i.e., modified InC, hybrid PSO, and modified CS. The effectiveness of these techniques are analyzed based on searching several required computation cycles, global maximum power point correctly, tracking time, and the scanned interval. Results demonstrate that the proposed technique significantly increases the accuracy and speed of finding the real global maximum power point. Moreover, it is irrespective of the complexity of PS conditions [
10].
In [
11], the authors describe the analysis of PS conditions for PV energy systems. In a PV energy system during partial shading conditions, if the PV modules increase in a string, then the 0.8
model is used to raise the efficiency. Peaks in the case of PS are situated at the multiples of 0.8
. For finding the correct position of peaks in the PV energy system for partial shading conditions, the authors [
11] used a set of new equations model. Problems of partial shading in long-term PV systems are resolved using a model. However, this model slows the speed of the overall PV system.
Using the three-point-based method, the authors in [
12] examine the parameters extraction of a single diode model. The pivot point is used to make points of critical data. The model forces to pass through these points after that Evolutionary Algorithm (EA) is applied to fine-tune the remaining section of the suitable curve. The EA technique shows substantial enhancement for fitting accuracy. From the MATLAB/Simulink results, it is concluded that the suggested method constantly converges to an optimum solution in less than 50 iterations but increases the system complexity [
12].
The authors in [
7] also proposed many techniques based on artificial intelligence like neural networks & fuzzy logic control. In the Artificial Neural Network (ANN), the input combination is considered as the surrounding condition of PV parameters, and output is assumed to be either reference voltage or duty cycle. As compared to the conventional neural network (NN) technique for MPPT, a multi-level neuro-fuzzy model has been proposed. The proposed model has been proven better efficient under a wide range of operating circumstances [
13]. However, as the characteristic of PV array changes, the system needs to train periodically to obtain high accuracy [
14].
The main benefits of Fuzzy Logic Control (FLC) is the acceptance of the noisy input signal and its ability to converge during a sudden change in surrounding conditions [
15,
16]. However, this technique determined the error based on a rule base table. The drawback of this method is that it highly depends on the availability of previous knowledge of the input signal [
7]. In the literature, the Takagi-Sugeno model is used for further improvement in the stability and robustness of the system [
17,
18].
State-Space (SS) based MPPT technique uses the SS model to represent PV systems and dynamic feedback controllers to track MPP. Due to the ease of change in system parameters, this technique is very suitable even in fast-changing weather conditions and partially shaded conditions. However, no experimental verification is given [
19,
20]. The Slide Control Method (SCM) is achieving MPP that achieved the control of DC/DC converters. This technique normally employs the hysteric mode control of the DC/DC converter. The leading advantage of this method is its dynamic response and fast speed. Although, the unstable switching frequency is its major drawback [
21].
Another MPP Flower Pollination Algorithm (FPA) has been introduced by the researchers in which five pollens or duty cycles are initially generated with an FPA between 0–1 and measure the power of each pollen. The pollen that gives the maximum power is chosen as the best power. To deciding which pollen will pass through global pollination or local pollination, a new number between 0-1 is randomly generated that has a 0.8 switching probability “P” for achieving the power. Researchers concluded that the best power gives the global best value after 25 iterations only [
22]. The major disadvantages of FPA are high computation time, difficulty to tune parameters, complex structure, and procedural complications [
23].
Modified FPA is described for the MPP of the PV system. The performance of the system is improved but the structure of FPA has become more complex [
24]. Anderson et al. [
25], examined the MPP using global optimization issues known as Random Search Method (RSM) as it tracks the MPP using a random solution. In defined limits, Anderson et al. produce the solution randomly and search for appropriate solutions that have a range between 0–1. To measure the power, these values send to the DC–DC converter against each input. Furthermore, these values are restructured continuously until the MPP is obtained after each iteration.
In [
26] a Modified Firefly algorithm (FA) for the calculation of MPP is elaborated. To decrease the randomization of fireflies, randomization
and
parameters are introduced by varying irradiance and temperature. From the result, the authors of [
26] concluded that efficiency and tracking speed is improved as compared to the conventional FA.
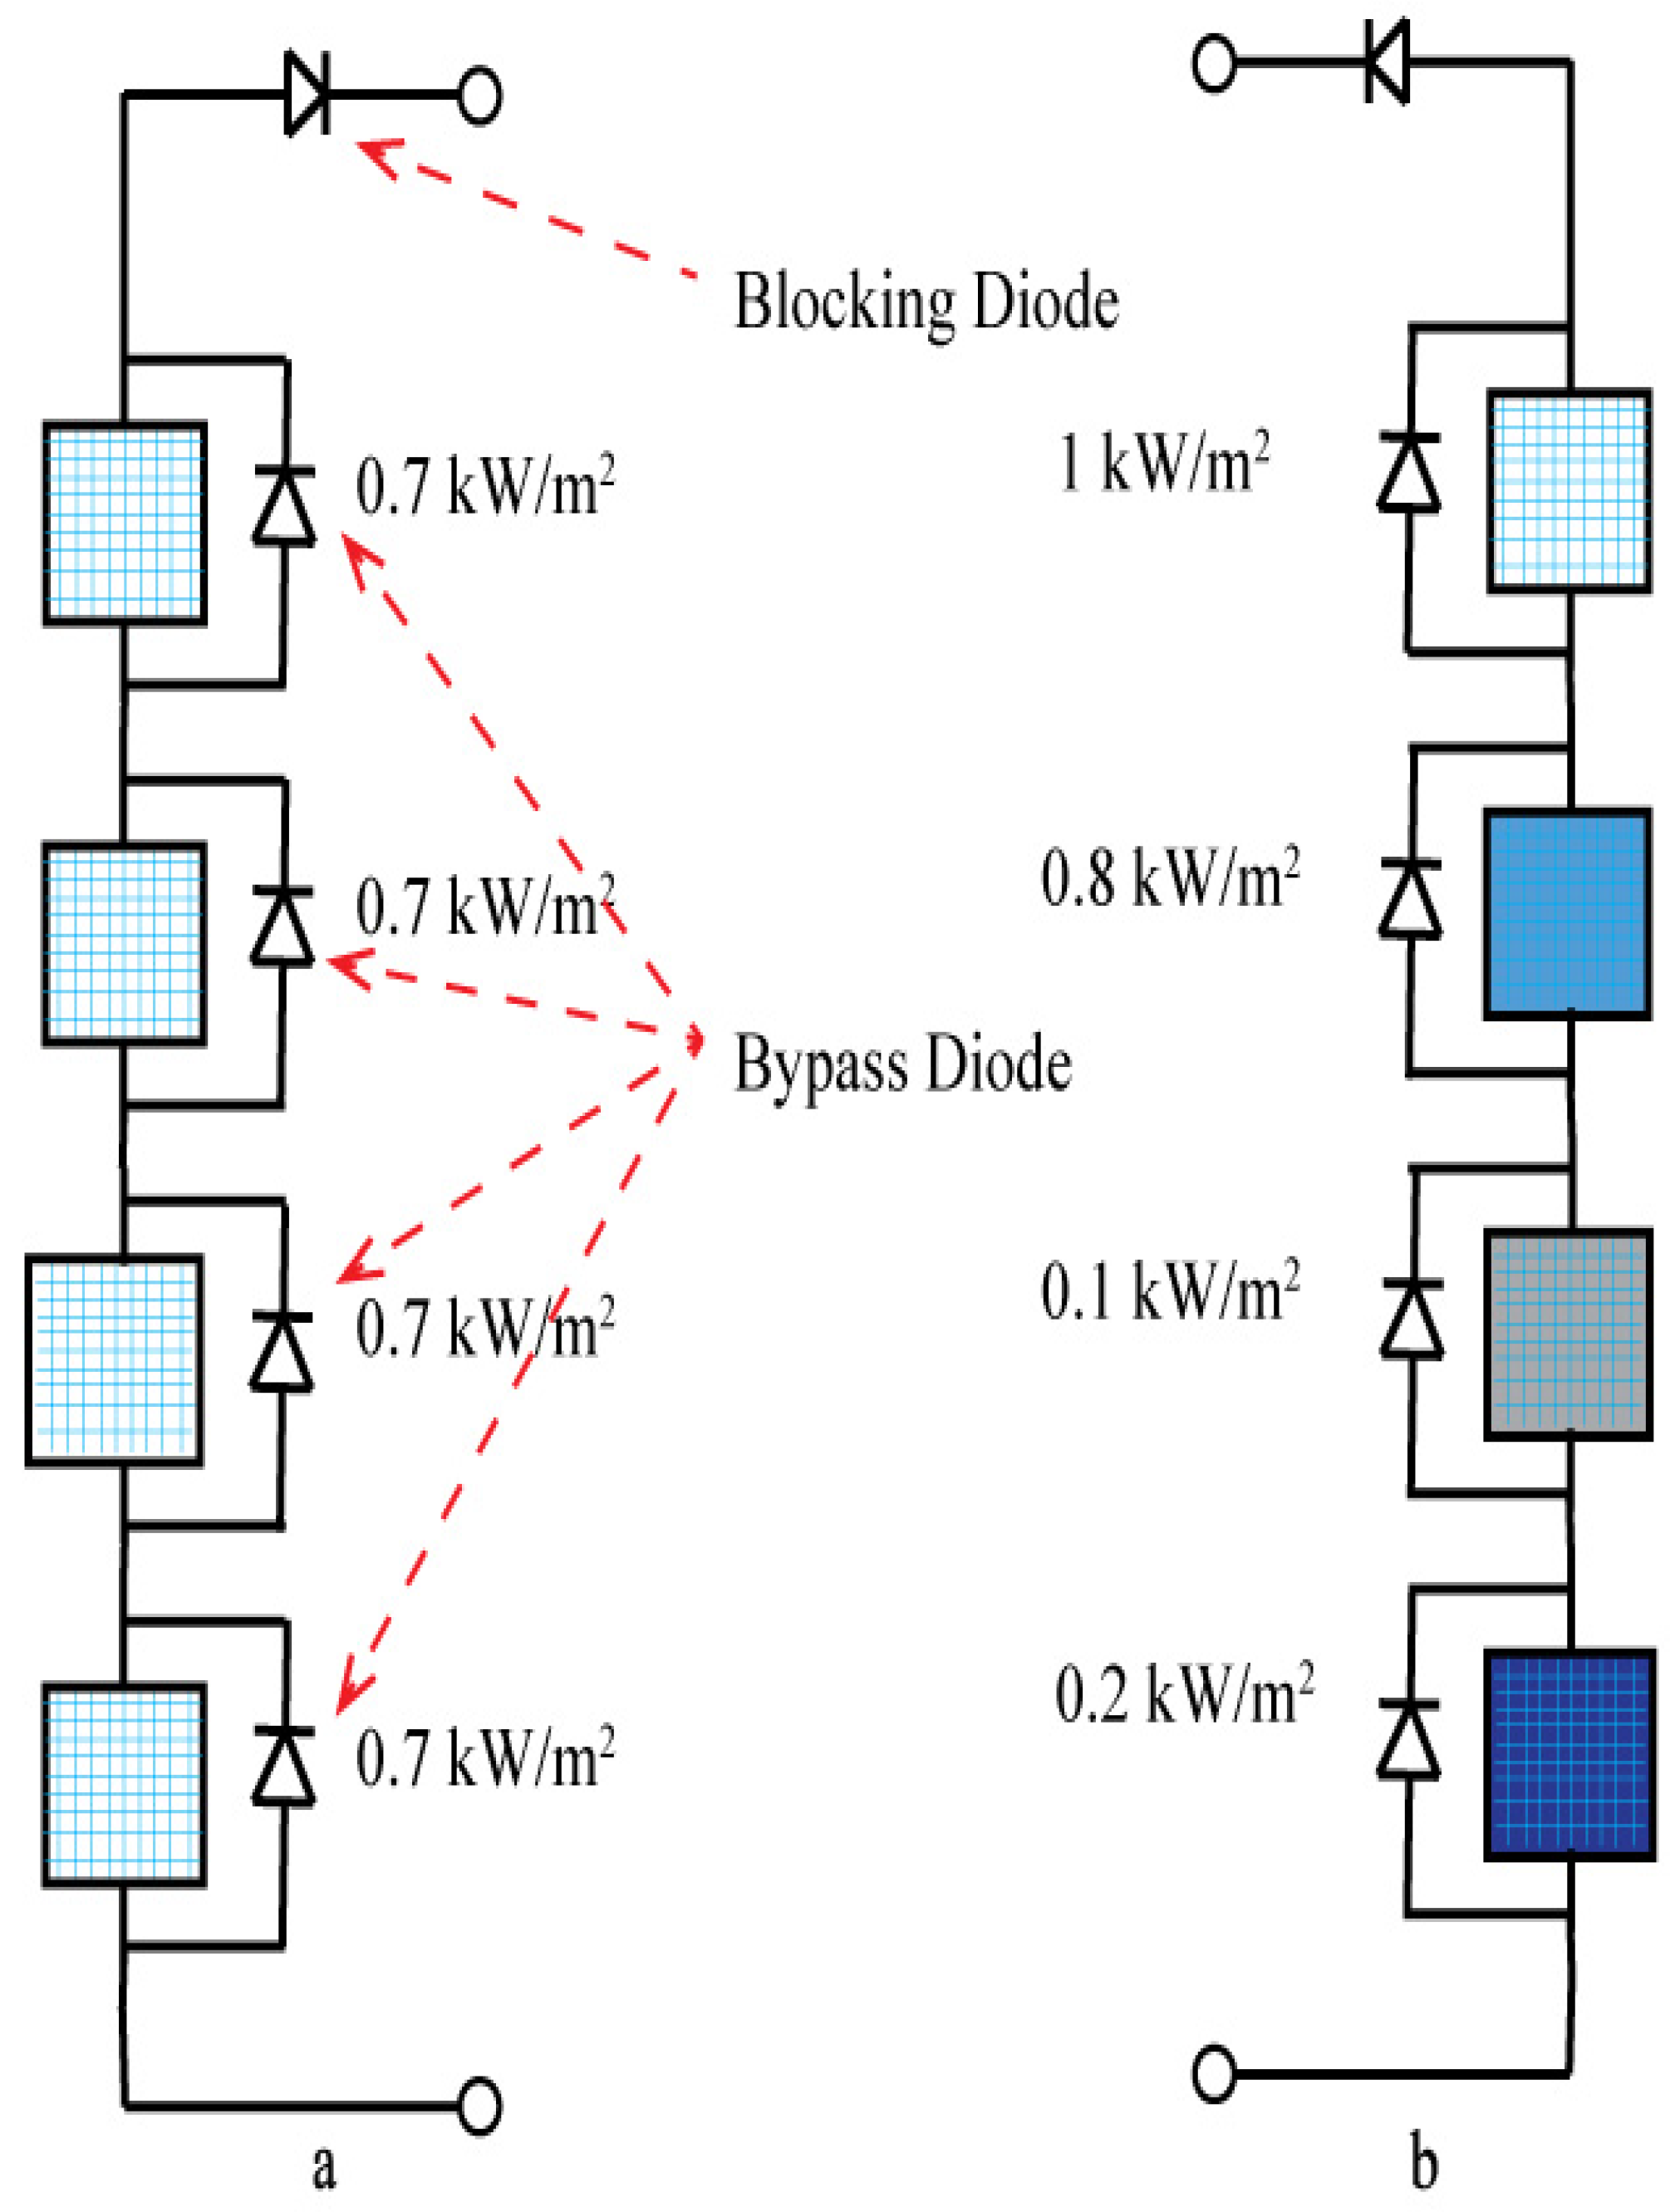
The bypass diodes are reverse biased and have little effect under UI levels. Whenever the PV array is partially shaded, the bypass diode is forward biased, and the current flows via the diode instead of through the PV module. Many MPP’s occur in the P–V curve under partial shading due to the existence of bypass diodes. Traditional MPPT algorithms are looking for the peak of the P–V curve centered on a localized initial stage. As a result, they are unable to distinguish between LMPP and GMPP [
27,
28].
The authors in [
29] improved the modified FA in terms of searching speed and decreases the number of computations of conventional FA. A Simplified FA is elaborated in which decreases the computational load and rises the MPPT in the PV energy systems. Steady-state oscillations also reduce additionally. Many other optimization techniques for MPP in PV systems such as Artificial Bee Colony (ABC) [
30], Ant Colony Optimization (ACO) [
31], Bacterial Fragmentation and aging (BFA) [
32], Genetic Algorithm (GA) [
33], Differential Evaluation (DE) [
34], Grey Wolf Optimization (GWO) [
35] and Simulated Annealing (SA) [
36] algorithms have been discussed and evaluated based on response time, accuracy, efficiency, partial shading, and performance of the PV system under rapid response.
Up till now, under all circumstances, no technique gave the best results in terms of convergence and settling time, power tracking capability, and efficiency. There is still exists a research gap that how the PV system gives the response and addresses the PS condition according to the system requirements. These gaps still required to be eliminated by hybridizing the two techniques. So, We hybridize the conventional InC and soft-computing DFO techniques and use their advantages. If the uniform condition occurs then there is no benefit of using the soft computing techniques because they are slow with respect to change in any environmental condition. In the majority of cases, there is no existing PS condition and system response uniformly. However, if the PS does not occur in the PV system then InC is an ideal technique for use. In the world mostly P&O and InC techniques are used because they are fast and simple but cannot address the PS and CPS. On the other hand, a research gap exists in soft computing techniques where some tackle the PS condition and cannot respond to the CPS condition. Our contribution in this paper is as follows:
A hybrid MPP tracking technique is implemented using InC and DFO to minimize tracking time and improve accuracy.
A mathematical model is implemented to detect the UI, PS, and especially CPS condition in a PV system.
Five different cases are developed to identify the accuracy and response time of the proposed technique.
To check the robustness of the proposed Hybrid technique by comparing it with six previous implemented techniques i.e., FA, InC, ACO, DFO, PSO, and CS.
The performance of the suggested method is also verified using real-time data from the Beijing database.
The rest of the paper is arranged in the following Sections.
Section 2 described the partially shaded PV energy system.
Section 3 and
Section 4 elaborate on the previous and proposed MPPT techniques for PV energy systems.
Section 5 presented the simulation model. In
Section 6 results and discussion are illustrated for all weather conditions. Finally, the conclusion of the paper is given in
Section 7.
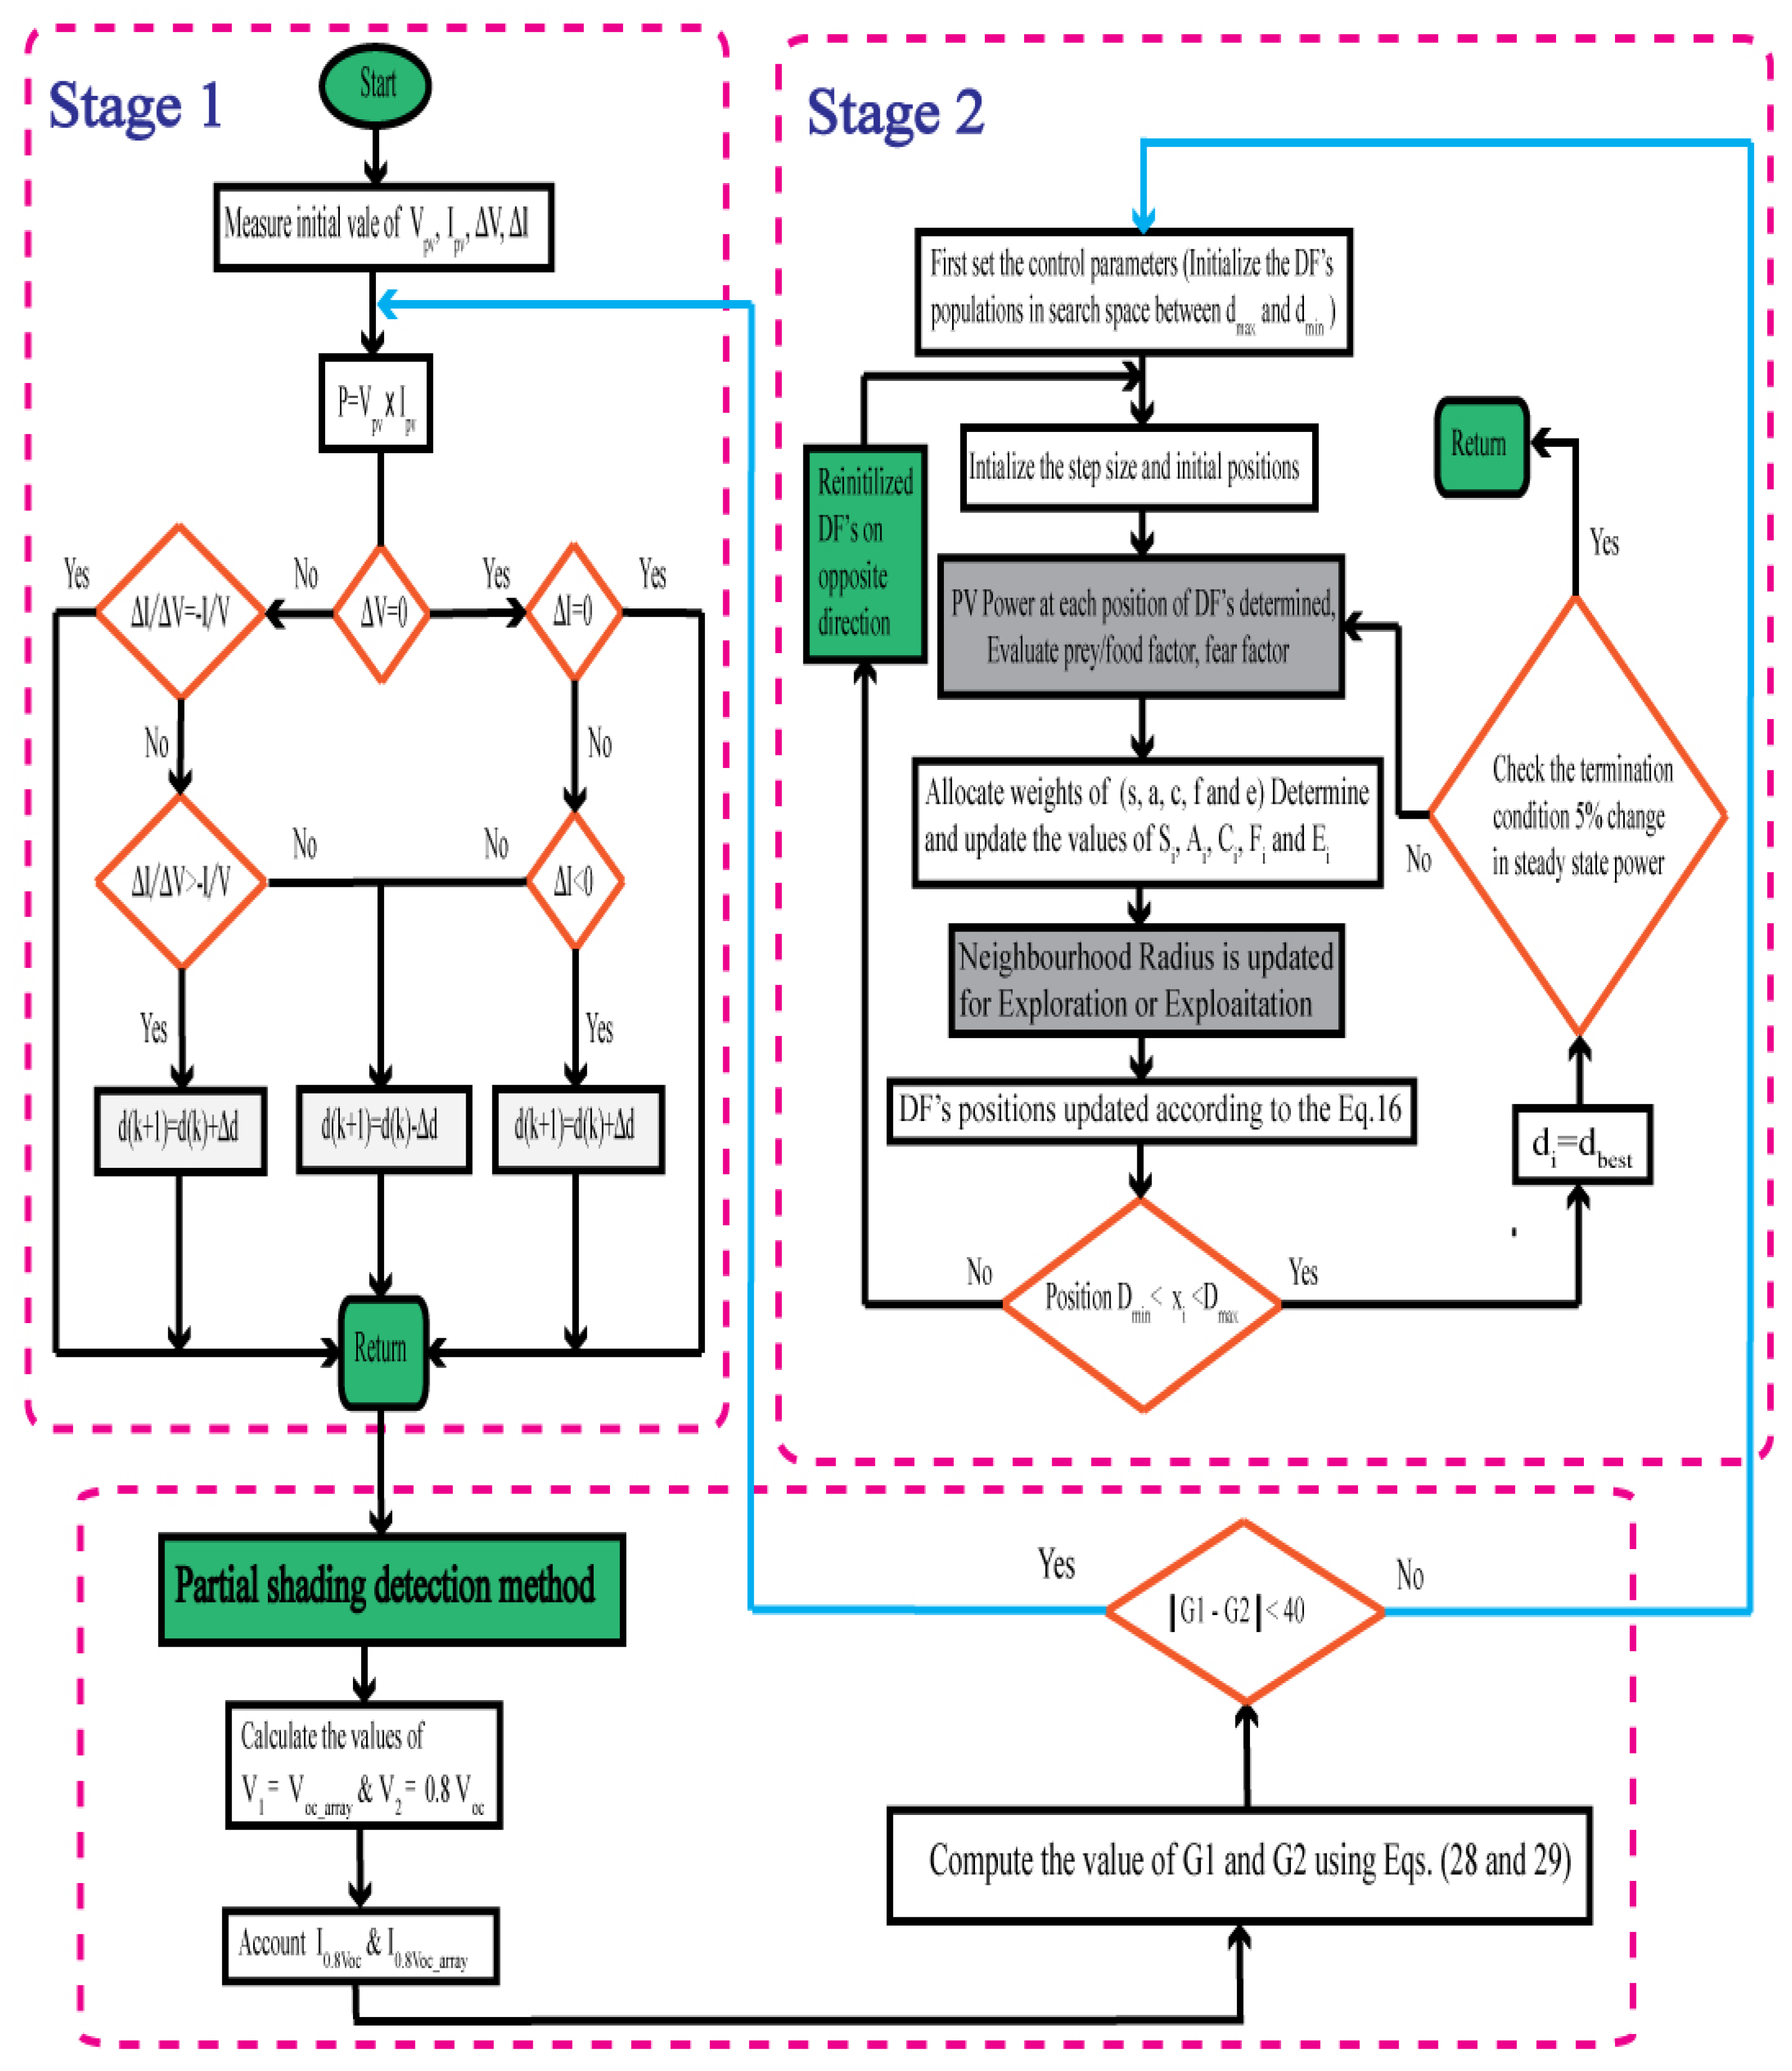
4. Proposed Hybrid (InC-DFO) Technique for PV Energy Systems
For the sake of making a new strong technique, the authors of this paper merge the powerful characteristics of InC with variable step size and DFO algorithm known as (InC-DFO) technique based on their features in a meta-heuristic context.
The proposed InC-DFO technique is a computational technique that has the advantages of both algorithms. These two techniques are sequentially executed to enhance the effectiveness of the optimization problem. The output of the InC technique with variable step size calculates the initialization of the DFO technique. However, the InC-DFO technique is applied for all weather conditions like UI, partial, and complex partial conditions for PV energy systems. InC-DFO algorithm is used in two stages, in the first stage, the InC technique with variable step size is used because it performs efficiently under UI values and their less convergence and settling time but this technique is trapped on LM and results in power loss.
However, practically it is not possible to achieve constant MPP so there is still some oscillation present around MPP. Thus, a satisfying compromise has to be made among the oscillations and the dynamics for MPPT with fixed step size in the conventional InC technique. The smaller step size can decrease the oscillations around the MPP with decelerating dynamics. On the other side, a larger step size gives the speedy tracking of MPP but it may results in steady-state unavoidable oscillations. For solving these challenges, the InC algorithm is used with variable step size is given as follows:
where
and
are the boost converter duty cycle at previous instant
and at instant
k.
N represents the scaling factor to adjust the step size. Whereas
,
and
are the output power, voltage and current of PV array respectively. It can be written as follow:
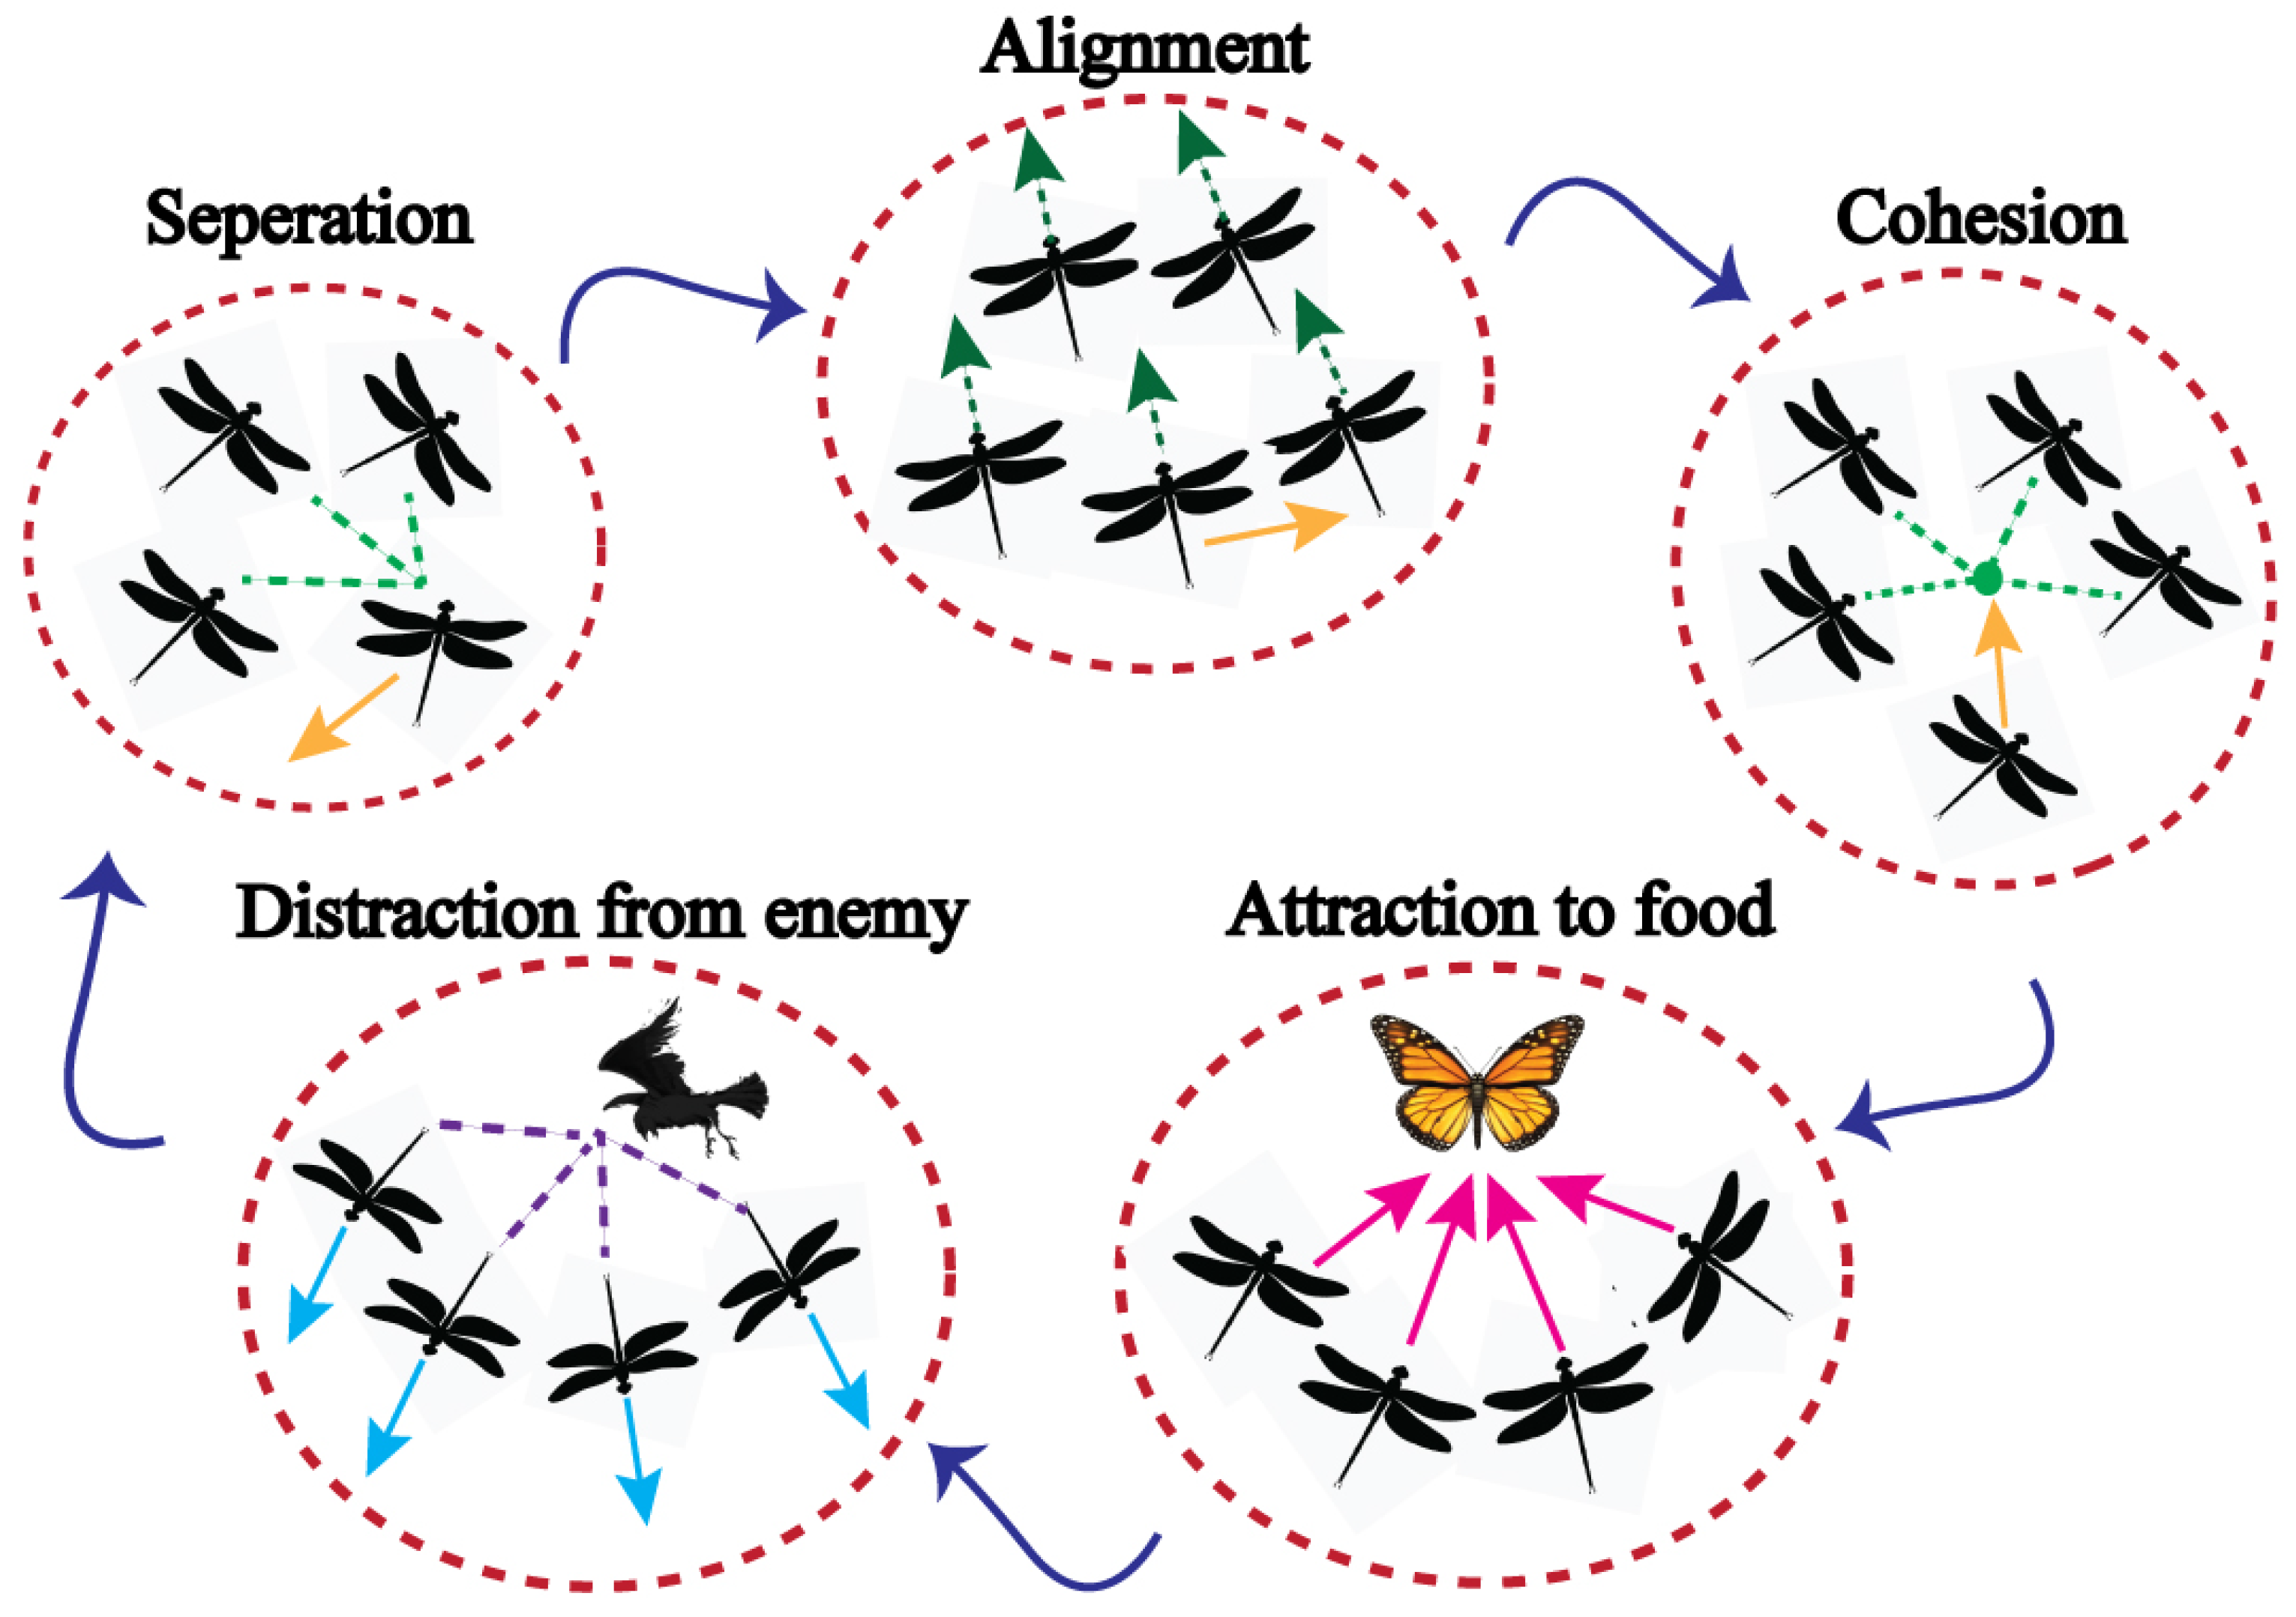
The location of the DF’s in global MPP searching of PV systems is the duty ratio at which dc to dc boost converter runs. It is a one-dimensional issue. The PV array’s power output is the goal function to be optimized, and the DA is employed to maximize this power. The following procedures are followed to implement the DF algorithm in the second stage for global MPP tracking.
Step 1: The DF’s are dispersed with a one search space within and that are the search space in contexts of duty cycle. The values of and in this article are selected to be and 2% 98%, correspondingly. The population’s value of the step is initialized.
Step 2: PV power of the DF’s at each position (duty ratio) is calculated. The food supply and opponent positions are modified as a result of this.
Step 3: Modified the ‘s’, ‘a’, ‘c’, ‘f’, and ‘e’ values.
Step 4: The Equations and are used to compute ‘S’, ‘A’, ‘C’, ‘F’, and ‘E’ for each individual.
Step 5: The radius of the neighborhood has been modified.
Step 6: The DF’s positions are changed with the help of equation . If this equation produces a location outside of the and bounds, the flies are placed on the other side of the boundary.
Step 7: Exit the algorithm if the termination criteria are satisfied.
Step 8: If the perceived power changes, relaunch the tracking.
Any individual’s neighborhood radius is expanded in this application, and the weights ‘f’, ‘c’, ‘a’, ‘s’, and ‘e’ are lowered in accordance with the iteration calculation. This helps the swarm accomplish effective exploration in its early generations. The DF’s are more impacted by each other in subsequent rounds as the algorithm approaches convergence. It would also ensure precise convergence and keep the DF’s out of local maxima. The opponent and food sources are picked as their best and the worst solutions identified by the swarm up to that point. It enables the swarm to travel towards the best place it has identified thus far while avoiding less promising parts of the search field. The termination criteria for this task is set to be the circumstance in which the mean deviation of all DF’s around the optimal location would be less than 5%. This number can be chosen by the user based on the necessary convergence precision. The pseudocode of DF algorithm [
40] is shown in Algorithm 1.
| Algorithm 1 Pseudocode of DF algorithm [40] |
| Create the population of DF’s (i = 1, 2, ..., n). |
| Initiate (i = 1, 2, ..., n) step vectors. |
| while The final condition is unsatisfactory. |
| Determine all of the DF’s performance indices. |
| Upgrade the enemies and food sources. |
| Values of ‘w’, ‘s’, ‘a’, ‘c’, ‘f’, and ‘e’ should all be updated. |
| Compute the values of ‘S’, ‘A’, ‘C’, ‘F’, and ‘E’ using their equations. |
| Modify the radius of the neighborhood. |
| if A DF is surrounded by at least one other DF. |
| Using Equation (16), update the vector of velocity. |
| Equation , update the vector of position. |
| else |
| Vector of position are updated. |
| end if |
| Examine and adjust the new locations depending on the variable limits. |
| end while |
There are many factors in the suggested DF method used for hybridization that has to be fine-tuned. Various exploitative and exploitative behaviors may be created during optimization using separation ‘s’, alignment ‘a’, cohesion ‘c’, food ‘f’, and enemy ‘e’ parameters. From these parameters, some of them have constant values and others have changing values according to the scenarios. DF neighbors are extremely essential, therefore each imitation DF is considered to have a neighborhood with a specific radius. In a dynamic swarm, DF tends to coordinate their flight while maintaining adequate separation and coherence. Therefore, in a static swarming, alignments are usually extremely low but cohesiveness is quite strong to assault prey.
As a result, while searching the search space, we give DF low cohesion and high alignment weights, whereas when exploiting the search space, we give DF’s high cohesion and low alignment. The radius of neighborhoods is enhanced linearly with the number of iterations when transitioning from exploration to exploitation. The food supply and opponent are picked from among the best and worst solutions discovered thus far by the entire swarm. This results in convergence into promising portions of its optimal solution and divergence away from non-promising ones. Various exploratory or exploiting swarm behaviors can also be obtained with varying weight levels. For exploiting, the value of ’c’ is kept large, but an is kept low because static swarming requires strong cohesion and low orientation. In a dynamic swarm, but on the other hand, ’c’ is maintained modest while an is raised for better exploration qualities.
A heuristic method in MPP tracking aims to identify GM in its transient state with the least amount of time and reduce oscillations in the steady-state surrounding GM to decrease power loss. DF algorithm is used to improve MPP searching by considering these two features. In our approach, the duty cycle represents the search space, which accepts values between 0 and 1. The output duty cycle and the location of the DF are related. Within the search space, the solution is generated at random. Except for initiation, the method stages are repeated until the stopping condition is fulfilled or the maximum number of iterations is reached. The greatest value of PV power at GM is the fitness function.
Partial Shading Detection Method to Transfer from InC to DFO
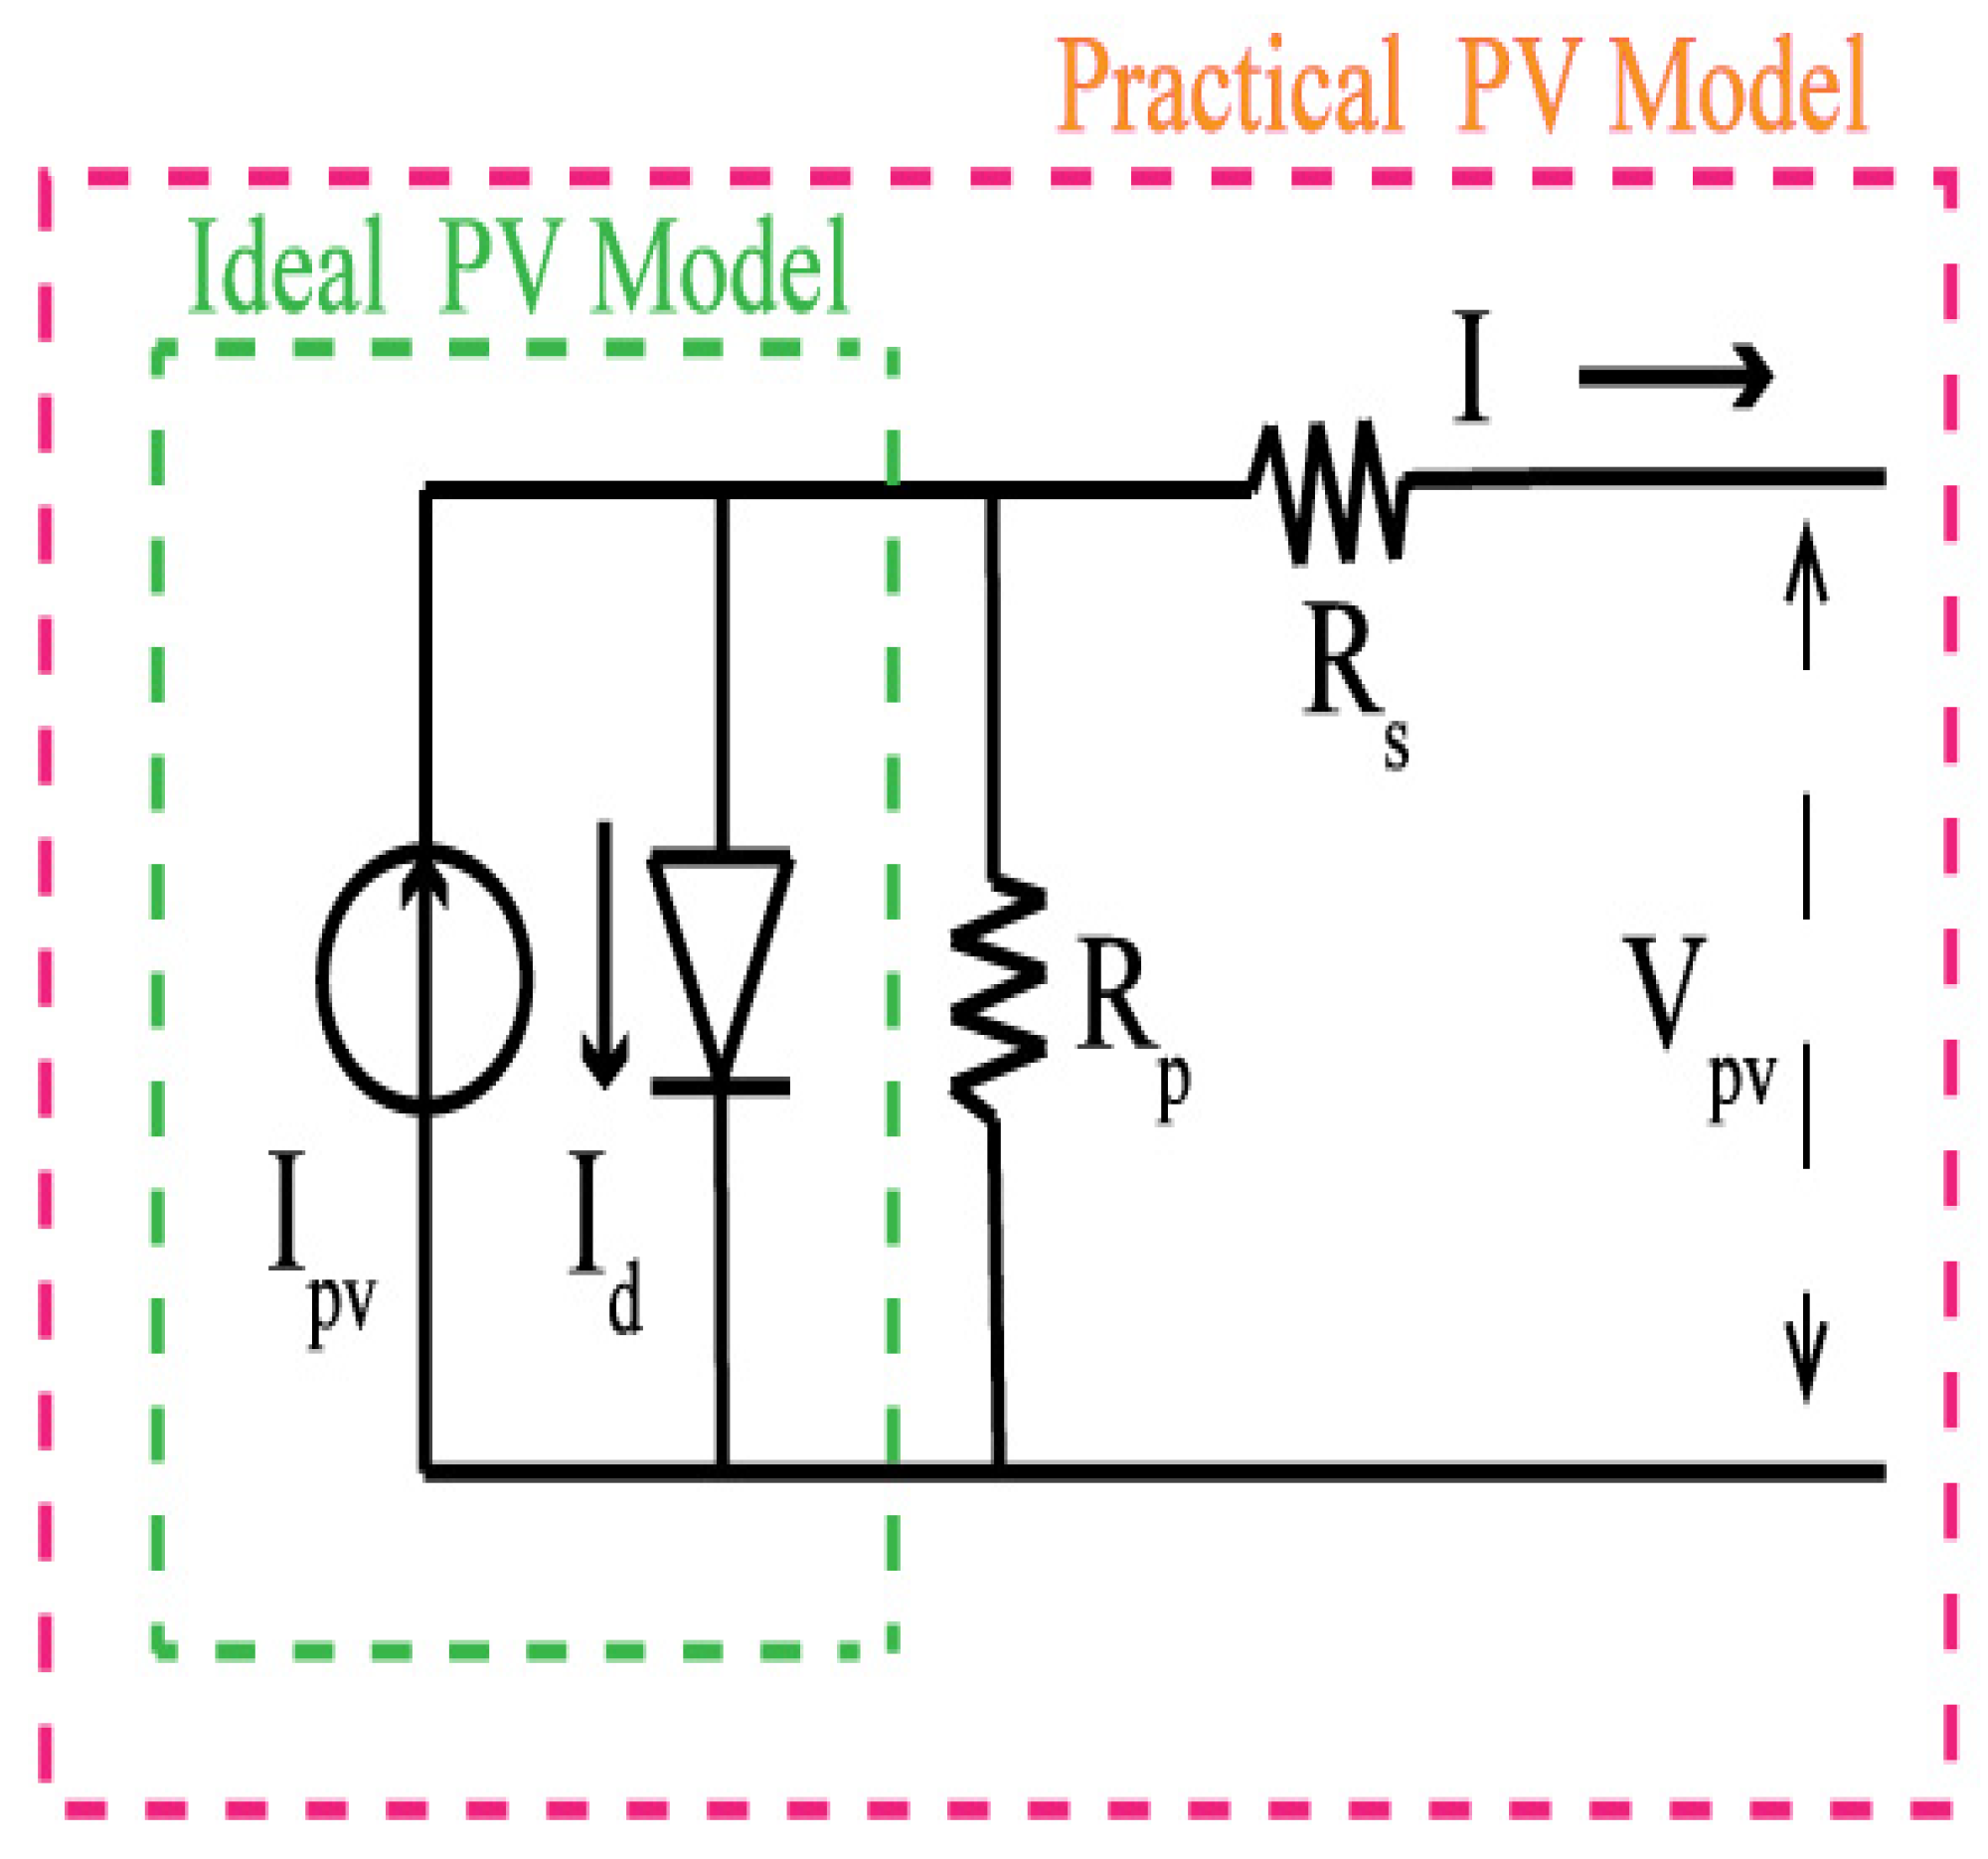
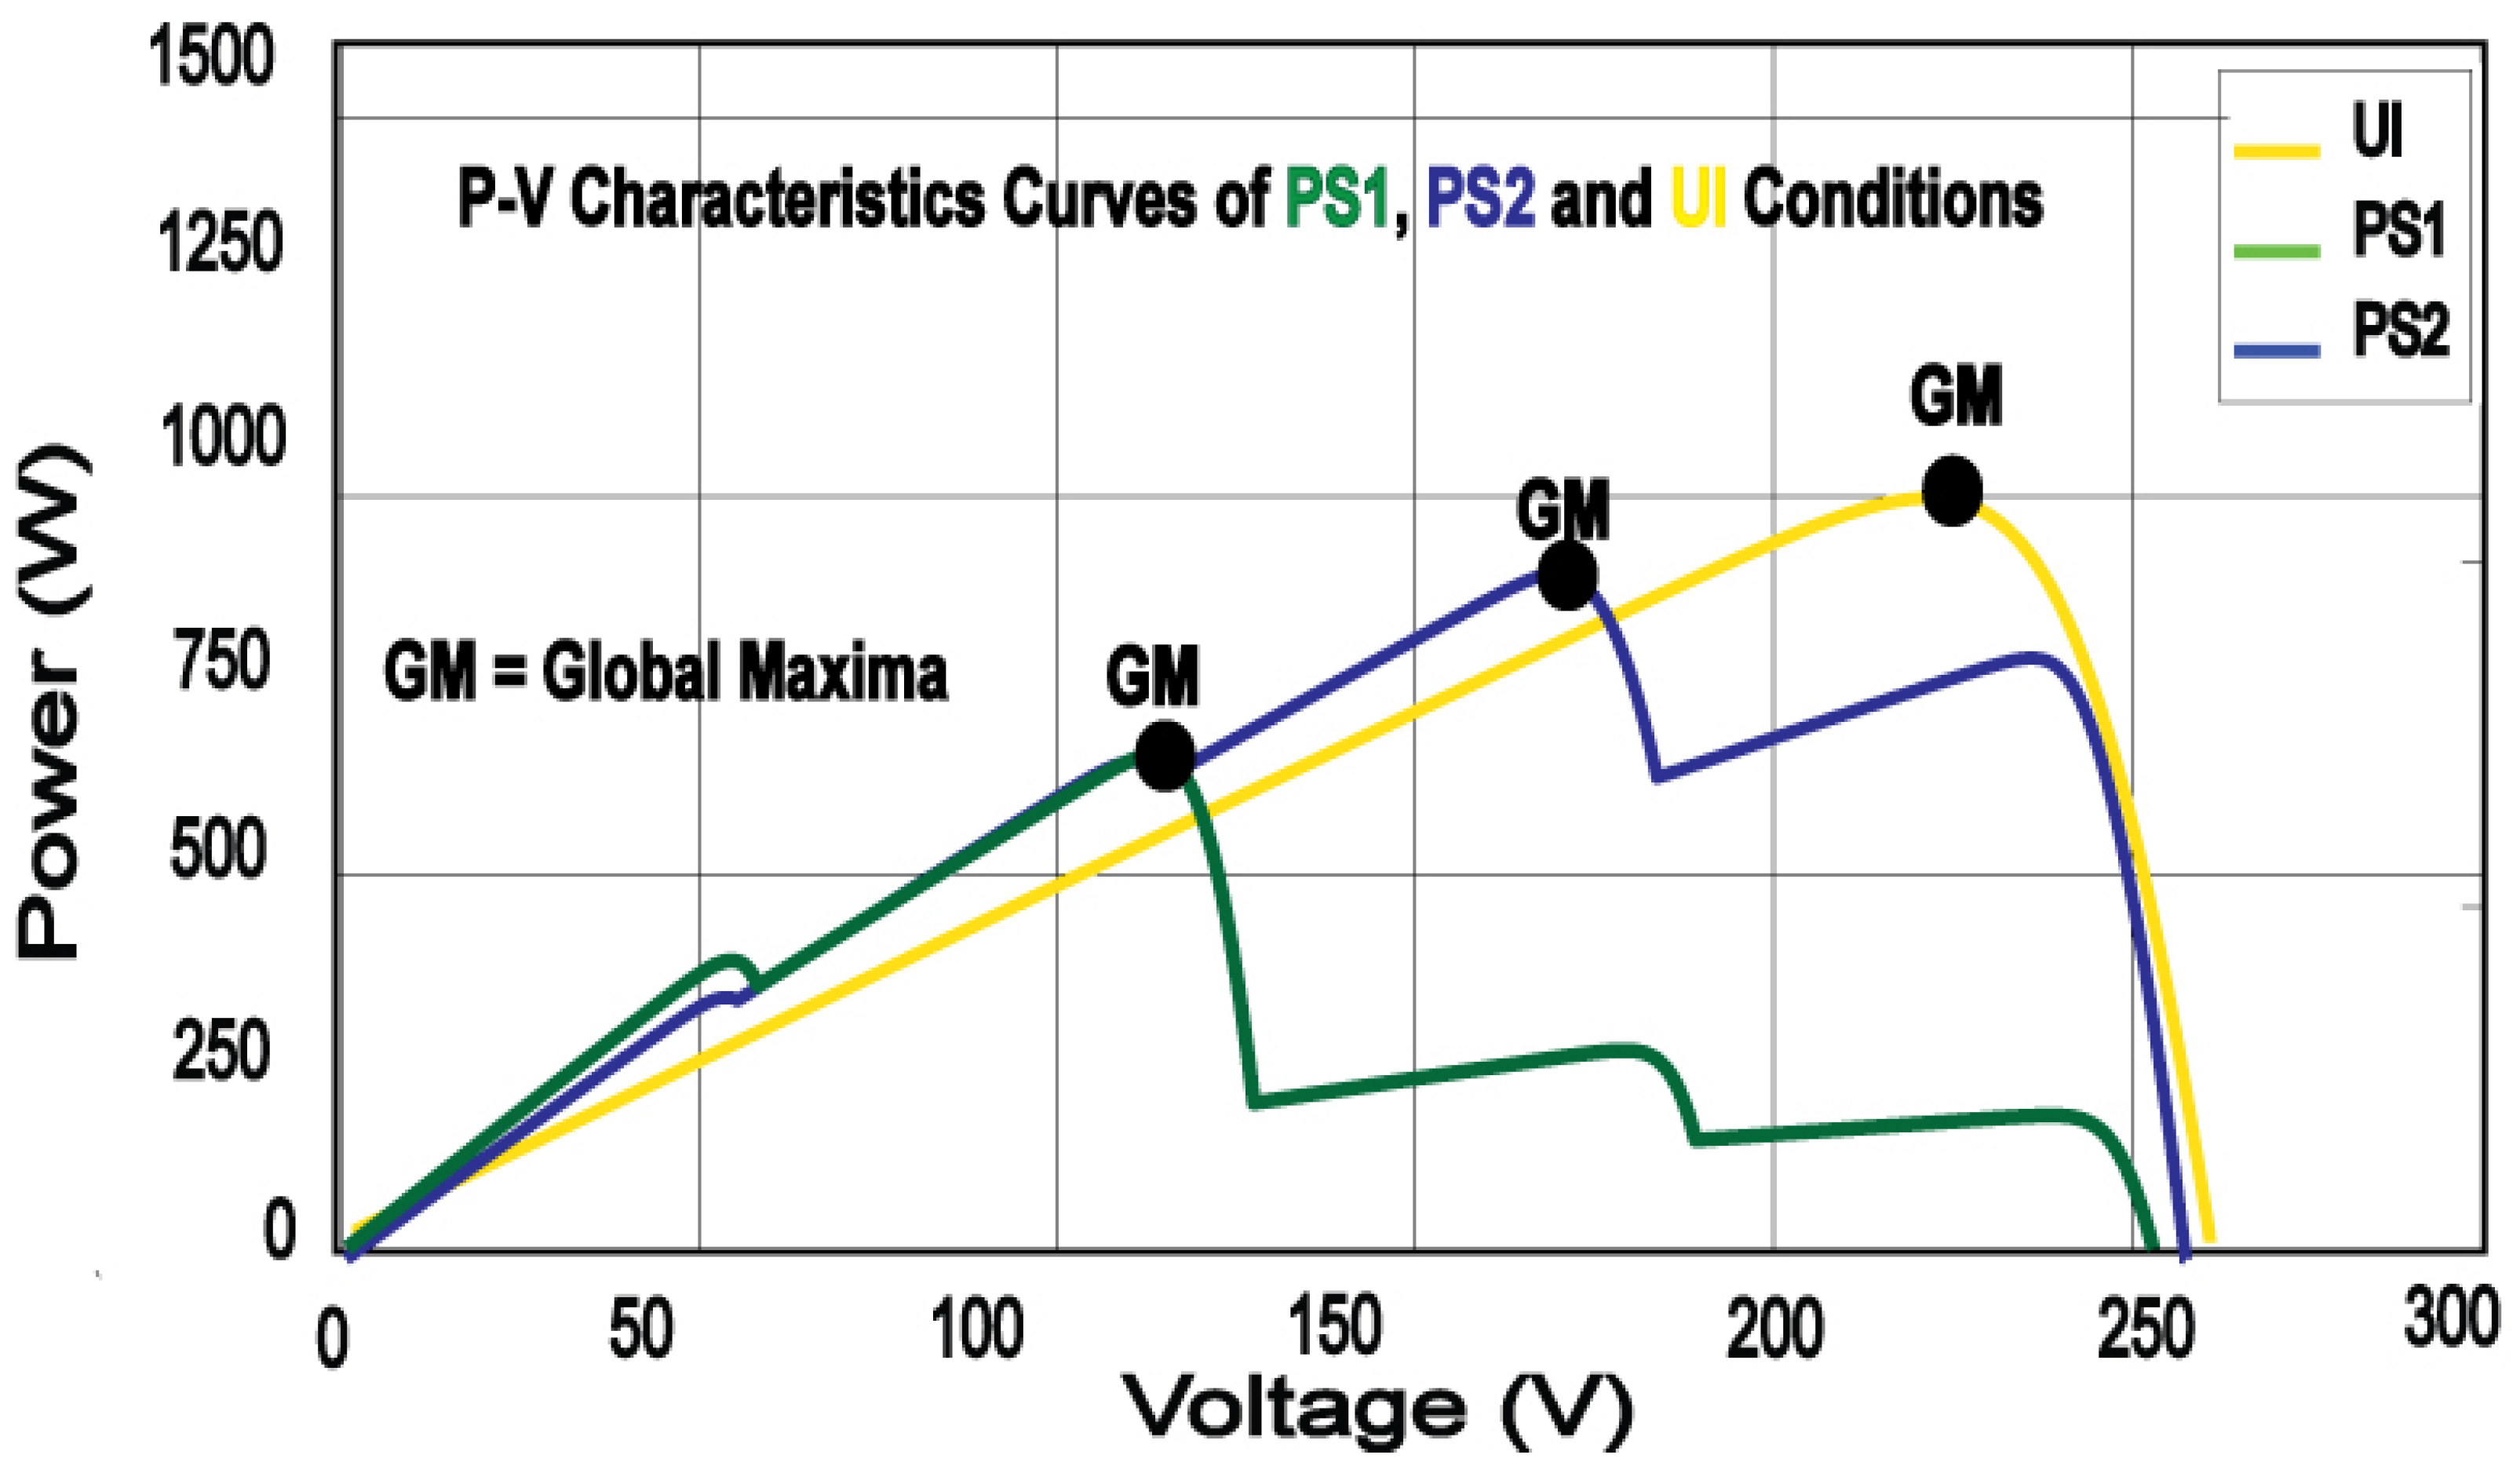
To comprehend the PS detection mechanism of the InC-DFO technique, it is important to figure out the I-V curve relationship of a single diode PV cell. The complete P-V curves of the PV system are shown in
Figure 6 that consist of UI, PS1, and PS2 conditions.
For this aim, an equivalent circuit model is examined. We calculate the value of
from (5).
where ‘
K’ stands for Boltzmann constant, ‘
T’ is expressed as the temperature of the photovoltaic cell and
G represents the irradiance. If the value of
T is remaining constant and
G is assumed to be varying then
rewritten as follow:
is the photovoltaic current at standard testing condition i.e., 1000 W/m
at 25 °C. From [
41], taking into consideration that maximum current
exists in the vicinity of
, Equation (
22) can be written as
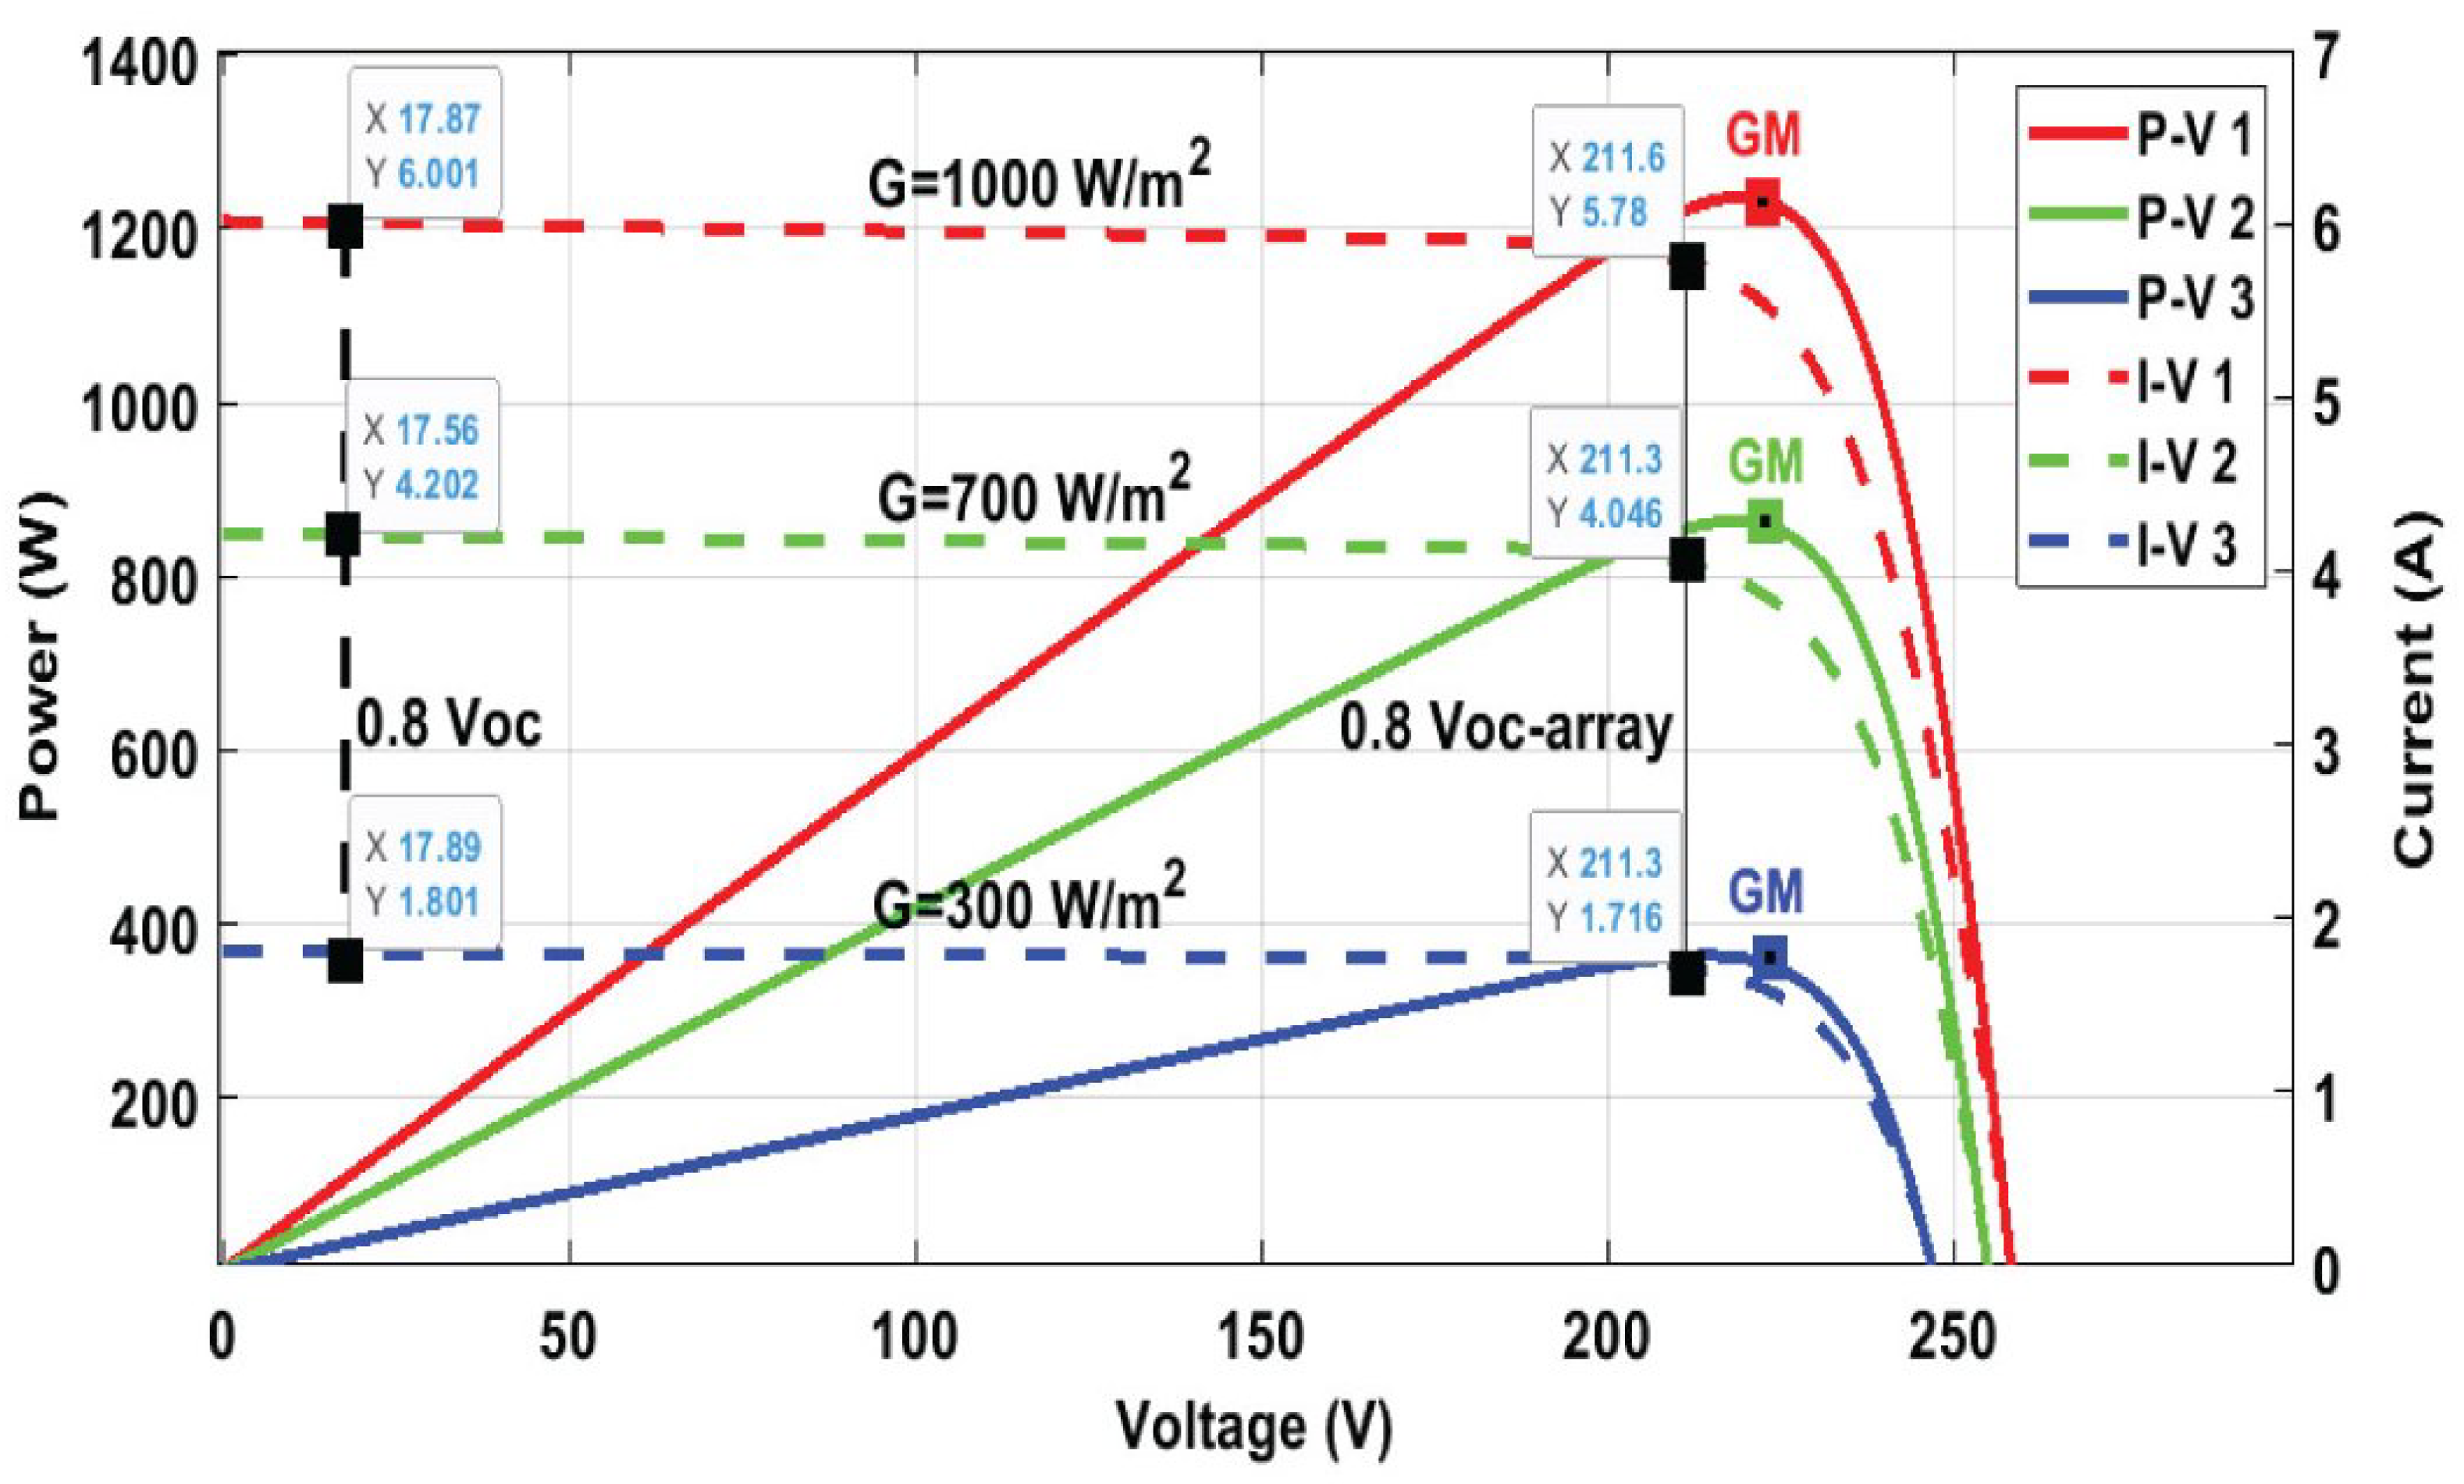
The detection strategy of InC-DFO takes
and
points on I-V curves of the Sun Power SPR-315E-WHT-D module and their specifications are given in
Table 1. The irradiance values that are chosen from the I-V curve are demonstrated in
Figure 7.
When values of G drops from 1000 W/m
to 700 W/m
, it is noticed that the ratio of
results as
Respectively, the same outcomes could be drawn during the change in MPP current ratio when G falls from 1000 W/m
to 700 W/m
, i.e.,
It is observed from the (24), that the measured values of irradiance at
and
are approximately equal. In [
41],
conceals near the 0.8 open-circuit voltage of a selected array
and
is in the region of 0.8 open-circuit voltage
of a module. Consequently,
and
may be denoted as
and
, respectively. So, (24) could be written using these terms:
MPPT records the corresponding currents as and when they take a sample at and respectively. Values of G are determined at and is specified as G-1 and G-2, respectively.
In UI condition, values of G-1 and G-2 are almost identical due to the slope current between
, and
is very small. This phenomenon is clarified in
Figure 7 through the I-V characteristics curve. At 3 different values of G i.e., 1000 W/m
, 700 W/m
and 300 W/m
of PV array, corresponding currents are labeled at
, and
. So, the values of G-1 and G-2 are calculated using (27) at
and
sequentially as follows:
It is concluded from (28) and (29) that G-1 and G-2 values are near to the real value of G like 1000 W/m. Though, (27) is estimated on the basis such that is situated at 0.9 . This consideration is not mandatory correct for all values of G because of creating a mismatch value. In above discussed computation, mismatch value is 23 W/m among G-1 and G-2 at 1000 W/m at 1000 W/m. However, G mismatch value at 700 W/m between G-1 and G-2 is reduced to 12 W/m, whereas at 300 W/m G mismatch value within G-1 and G-2 is decreased closely to zero.
Based on the mismatch values of G, an important conclusion could be constructed that in stage one, InC techniques with variable step size, act as UI conditions for a below specific threshold value of irradiance. This threshold value 40 is calculated by authors [
42] on I-V curves using an extensive survey of ten poly and mono-crystalline different PV modules. Therefore, it could be deduced that if the value of mismatch is greater than 40 W/m
then the PS condition is prevailing and it acts as a UI condition for less than 40 W/m
.
To overcome the problem of power loss, the bio-inspired DFO technique is used in the second stage for searching the GM. InC technique with variable step size initiate in stage one and force the PV energy system to converge to 80 percent of
. once the InC algorithm achieved the
then it triggers the DFO algorithm which settles the PV array to exact MPP. Thus, InC-DFO not only removes the cons of both methods but also searches the MPP at PS and CPS conditions. The flowchart of the proposed InC-DFO algorithm is given in
Figure 8.
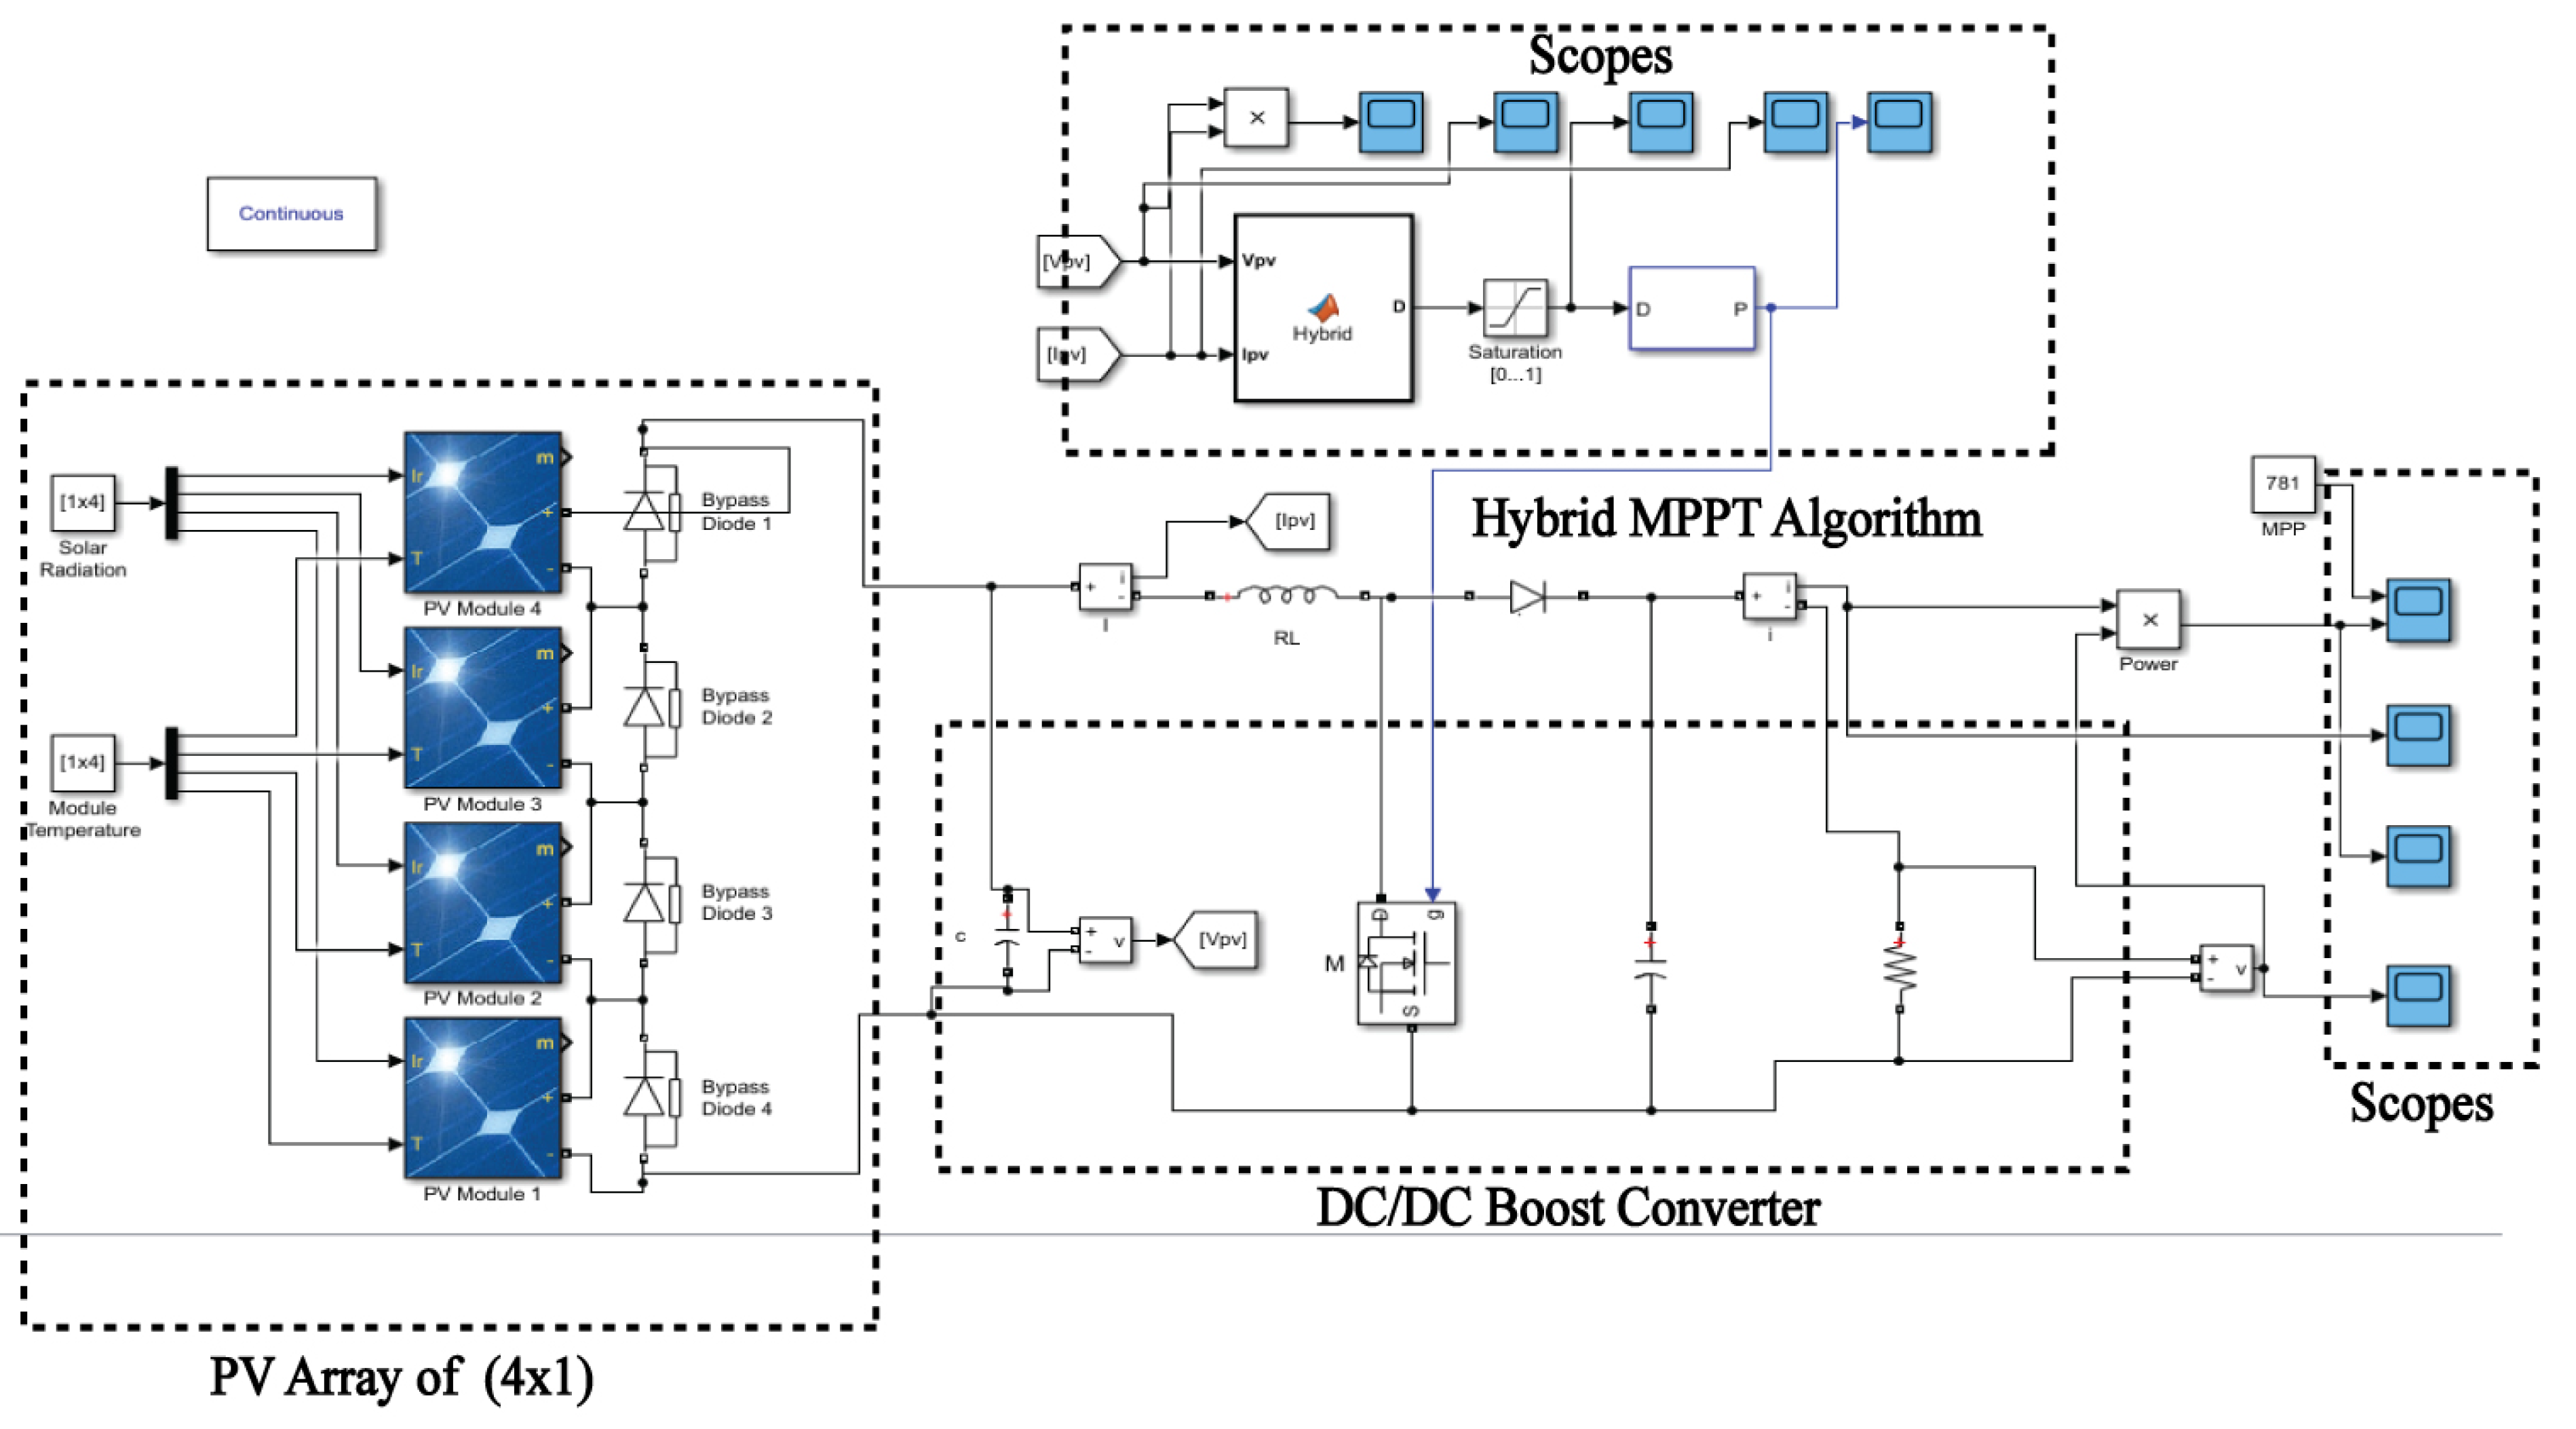
6. Results and Discussion
Four cases are described in this section for all-weather conditions e.g., UI, PS, and CPS conditions. From four cases, one is taken for UI, two for PS, and one for CPS. After different results and trails, 4 distant cases in terms of different irradiance values are chosen for performance calculation of nature-inspired algorithms. A model of PV energy system has been developed on the MATLAB/Simulink software. In a PV energy system model, the rating of a single PV module is given in
Table 1.
All previous algorithms like InC, CS, PSO, DFO, FA, and ACO, and the proposed MPPT Hybrid (InC-DFO) technique are tested on the developed PV model. Four cases are used for testing all MPPT techniques for PV energy systems in which UI condition is illustrated in case 1. PS condition is described in cases 2 and 3. CPS condition expresses in case 4. On the basis of settling and tracking time, current, transients of voltage, power, efficiency, and oscillation, results are analyzed. All four cases and their results are discussed as follows.
6.1. Case 1. Uniform Irradiance Condition
All the modules of the PV system received the same irradiance level in this case and it changes with respect to time. The irradiance pattern is described in
Table 2.
Figure 7 presents the PV energy systems UI curves of P-V and I-V. The pattern of uniform irradiance that is taken is elaborated in
Table 2.
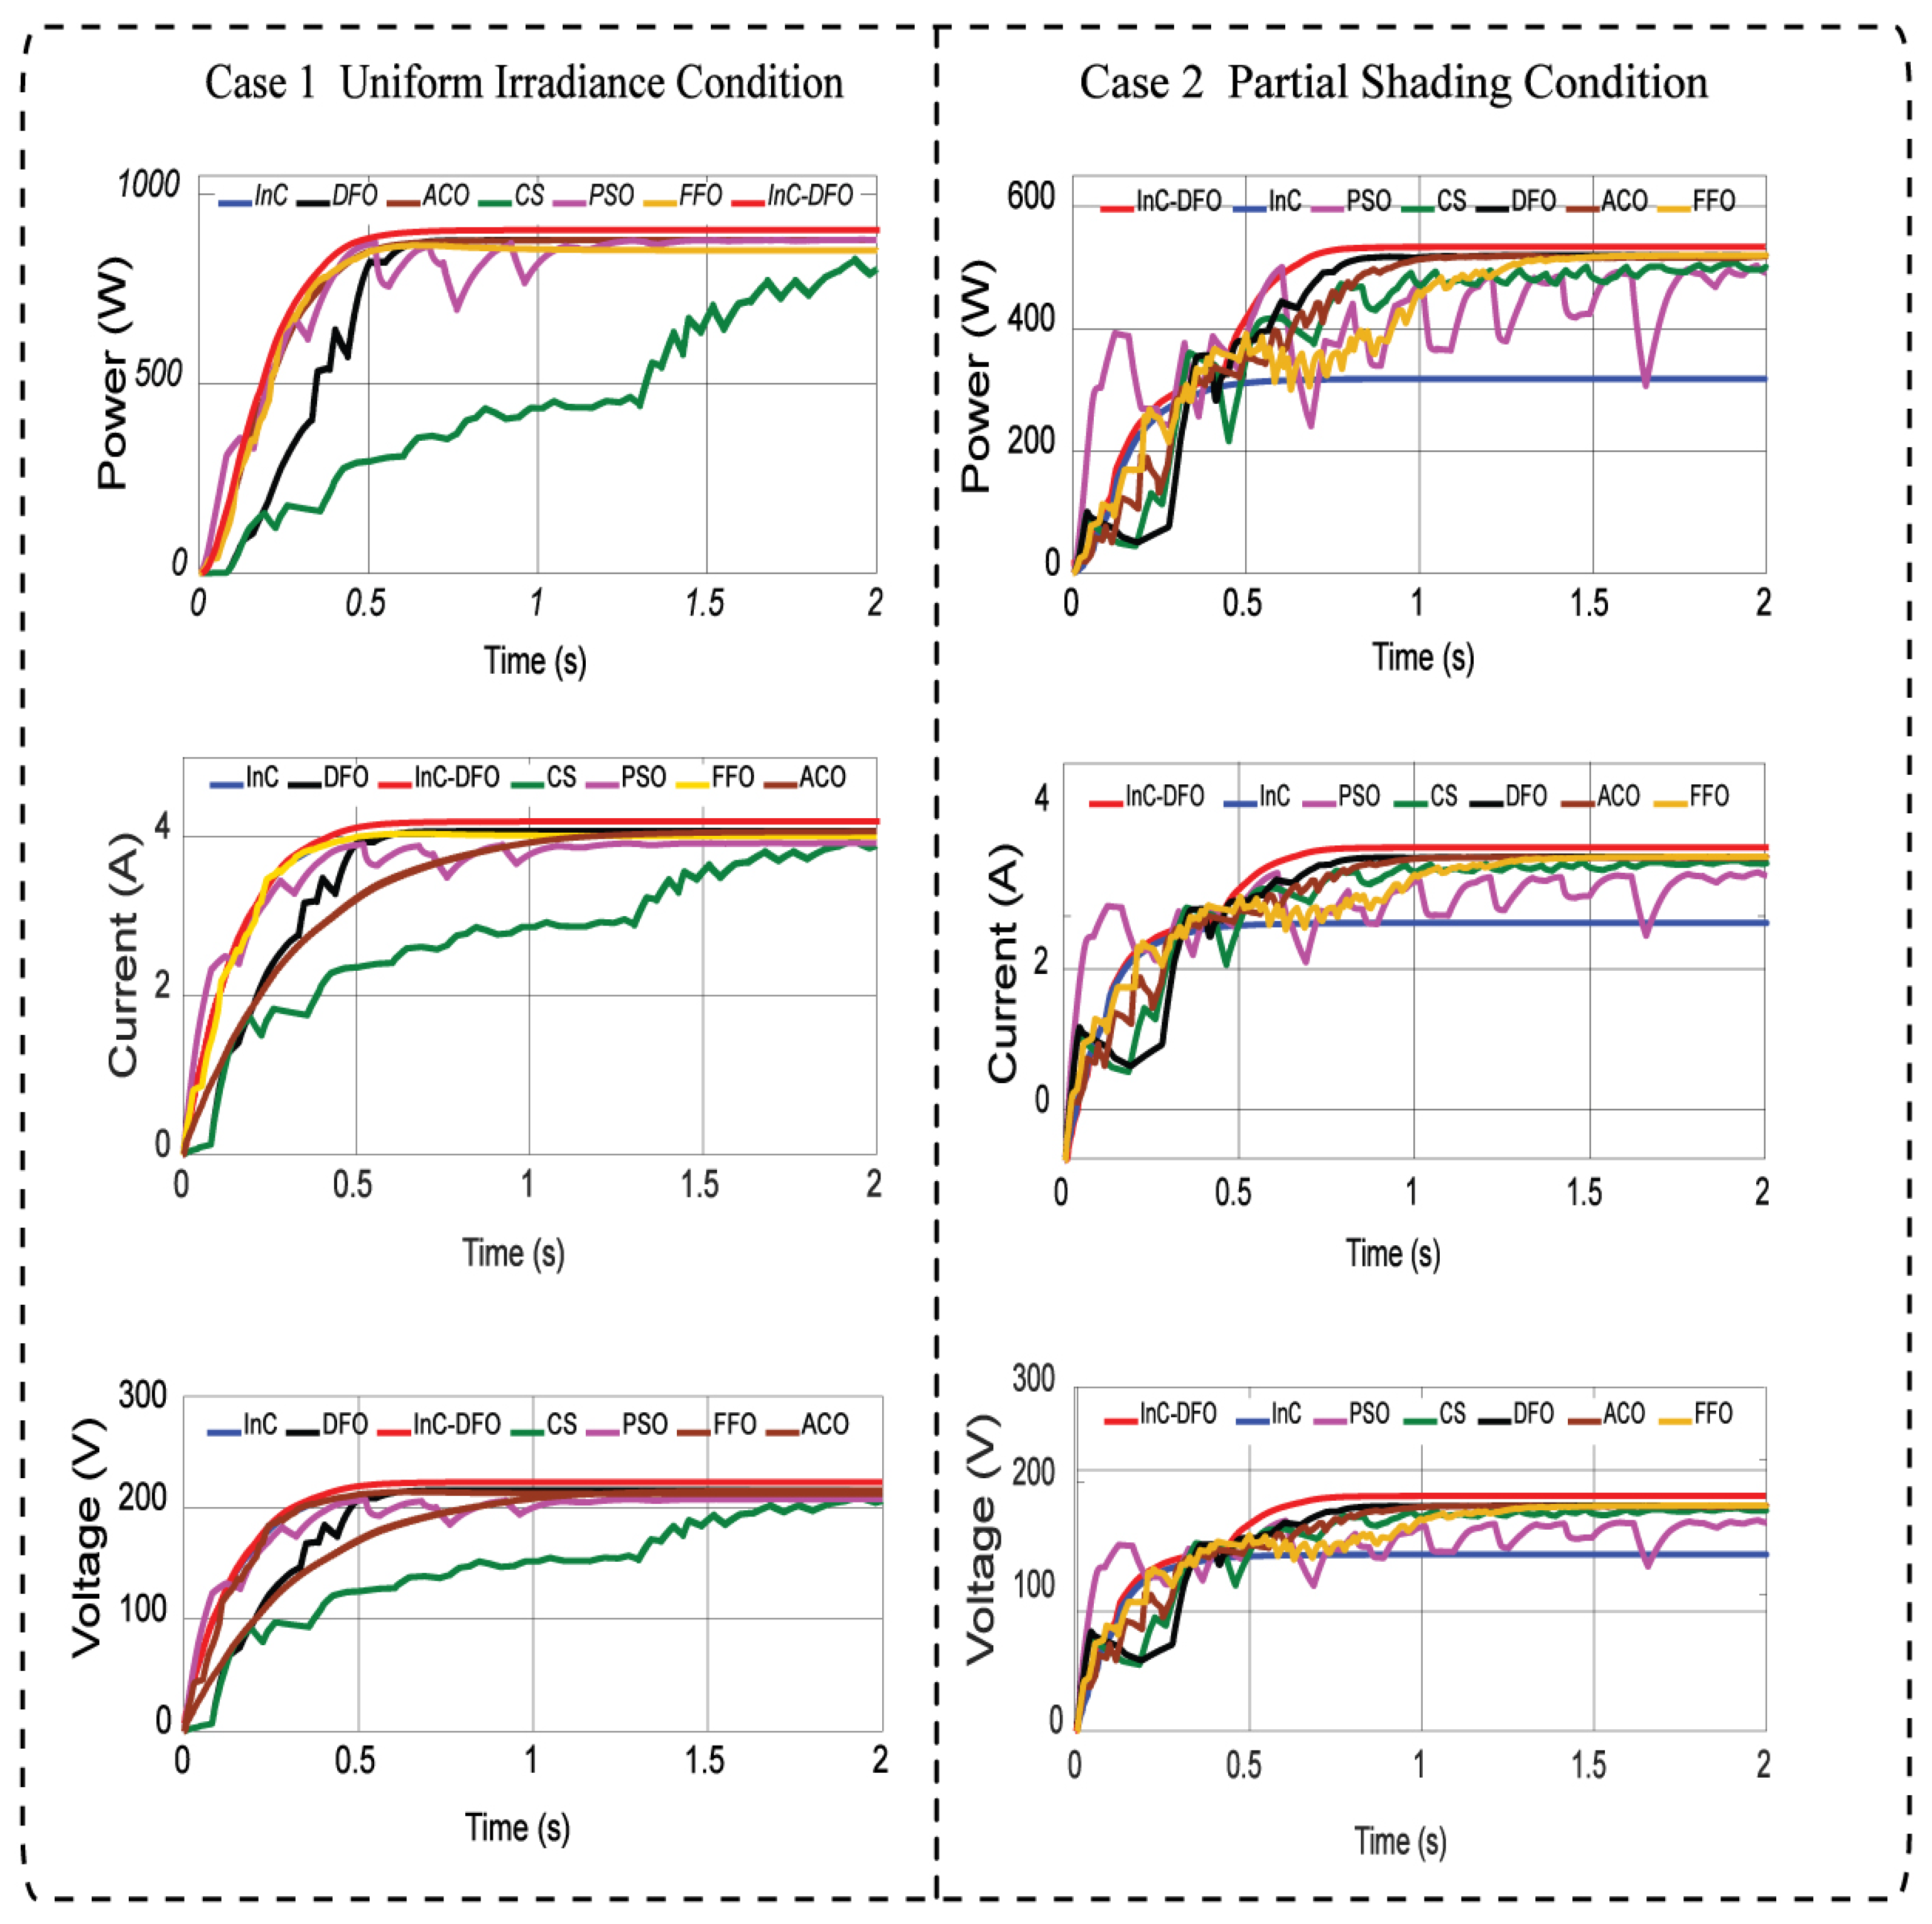
When comparing the power of different techniques, it is observed that the power at GM is 864 W and the highest power tracked at irradiance level is 863.4 W in case of uniform irradiance condition for proposed hybrid (InC-DFO) technique. While comparing the power of all techniques, FA has the lowest power 852 W. The tracked power in the sequence is as follows: . CS algorithm has more oscillation and the highest setting time of 1.94 s. Among all the techniques, FA tracked the least power of 852 W. The proposed hybrid technique saves power loss by reducing the oscillation and enhancing the efficiency of 99.93% of PV energy systems. CS has the highest oscillations that cause power loss when compared to other techniques.
To reduce the oscillation, the value of step size could be reduced that can cause increases in tracking time. The range of step size of the DC to DC boost converter should be between 2 to 5 percent of PV arrays power to balance the efficiency and tracking time. In CS, levy flight causes large fluctuations. It is determined that among all the techniques, the hybrid technique has the largest efficiency, no oscillations, fast-tracking time, least convergence time of 0.50 s, and settling time of 0.59 s.
6.2. Case 2. Partial Shading Condition
In case 2 partial shading is discussed and their irradiance pattern is presented in
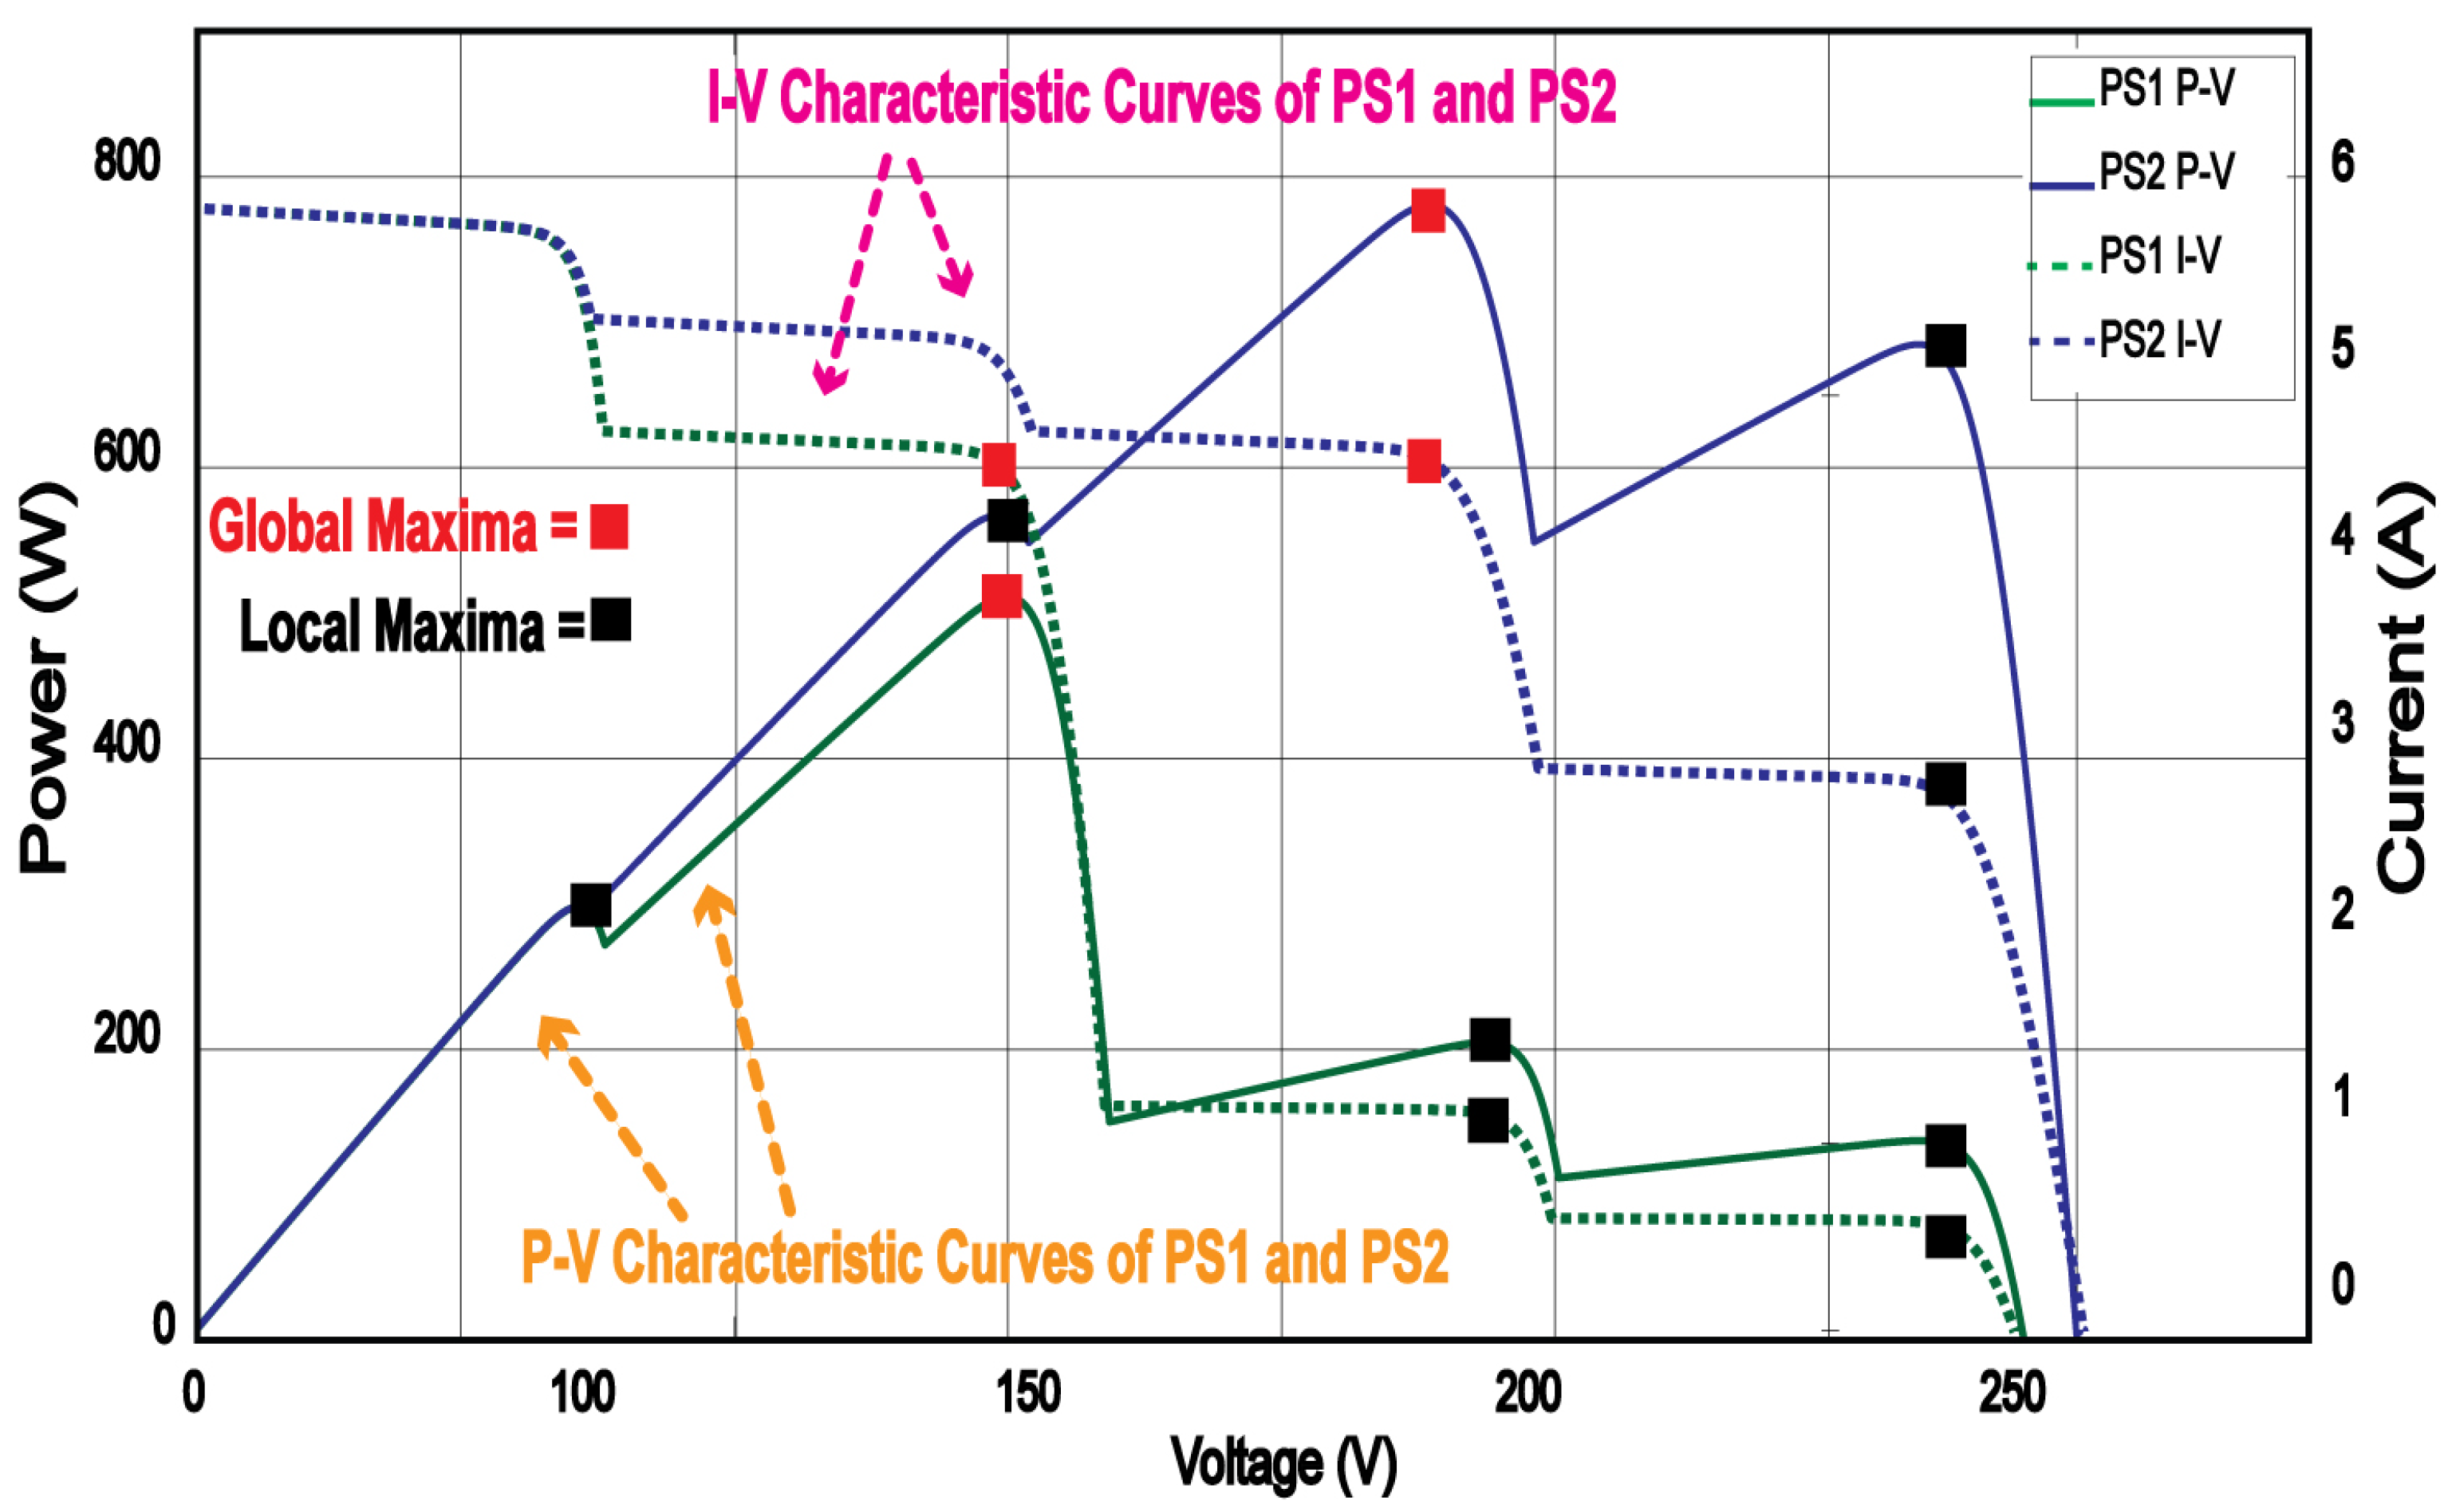
Table 2. Partial shading occurs because of not receiving equal irradiance values by PV arrays. Bypass diodes are used for less-performing diodes due to PS. There are multiple peaks that appear on the I-V and the P-V characteristics curve that can result in complications for searching the peaks. Furthermore, multiple peaks are characterized as a number of LM and single GM. Conventional techniques cannot differentiate between LM and GM that may result in the reduction of power loss. The I-V and P-V characteristic curves of PS cases 2 and 3 are described in
Figure 10. There are three LM and single GM observed on the I-V and P-V characteristics curve. The value of GM for PS1 is 512 W.
The proposed InC-DFO technique successfully obtained the GM value for the PS condition. Power tracked by proposed hybrid and all other DFO, CS, PSO, FA, InC, and ACO techniques are 511.4 W, 509 W, 506 W. 498 W, 325 W, and 507 W, respectively. ACO techniques are stuck on LM1 and cannot find GM. PSO techniques have the highest oscillations and settling time of 1.80 s which results in loss of power and therefore their efficiency also decreases. Conventional InC techniques tracked the lowest power. The settling time of PSO, DFO, InC, Hybrid, CS, FA, and ACO techniques are 1.80 s, 0.75 s, 0.52 s, 0.62 s, 1.78 s, 1.30 s, and 0.93 s, respectively. Power, Current and Voltage comparison of all techniques for Case 1 and Case 2 are shown in
Figure 11.
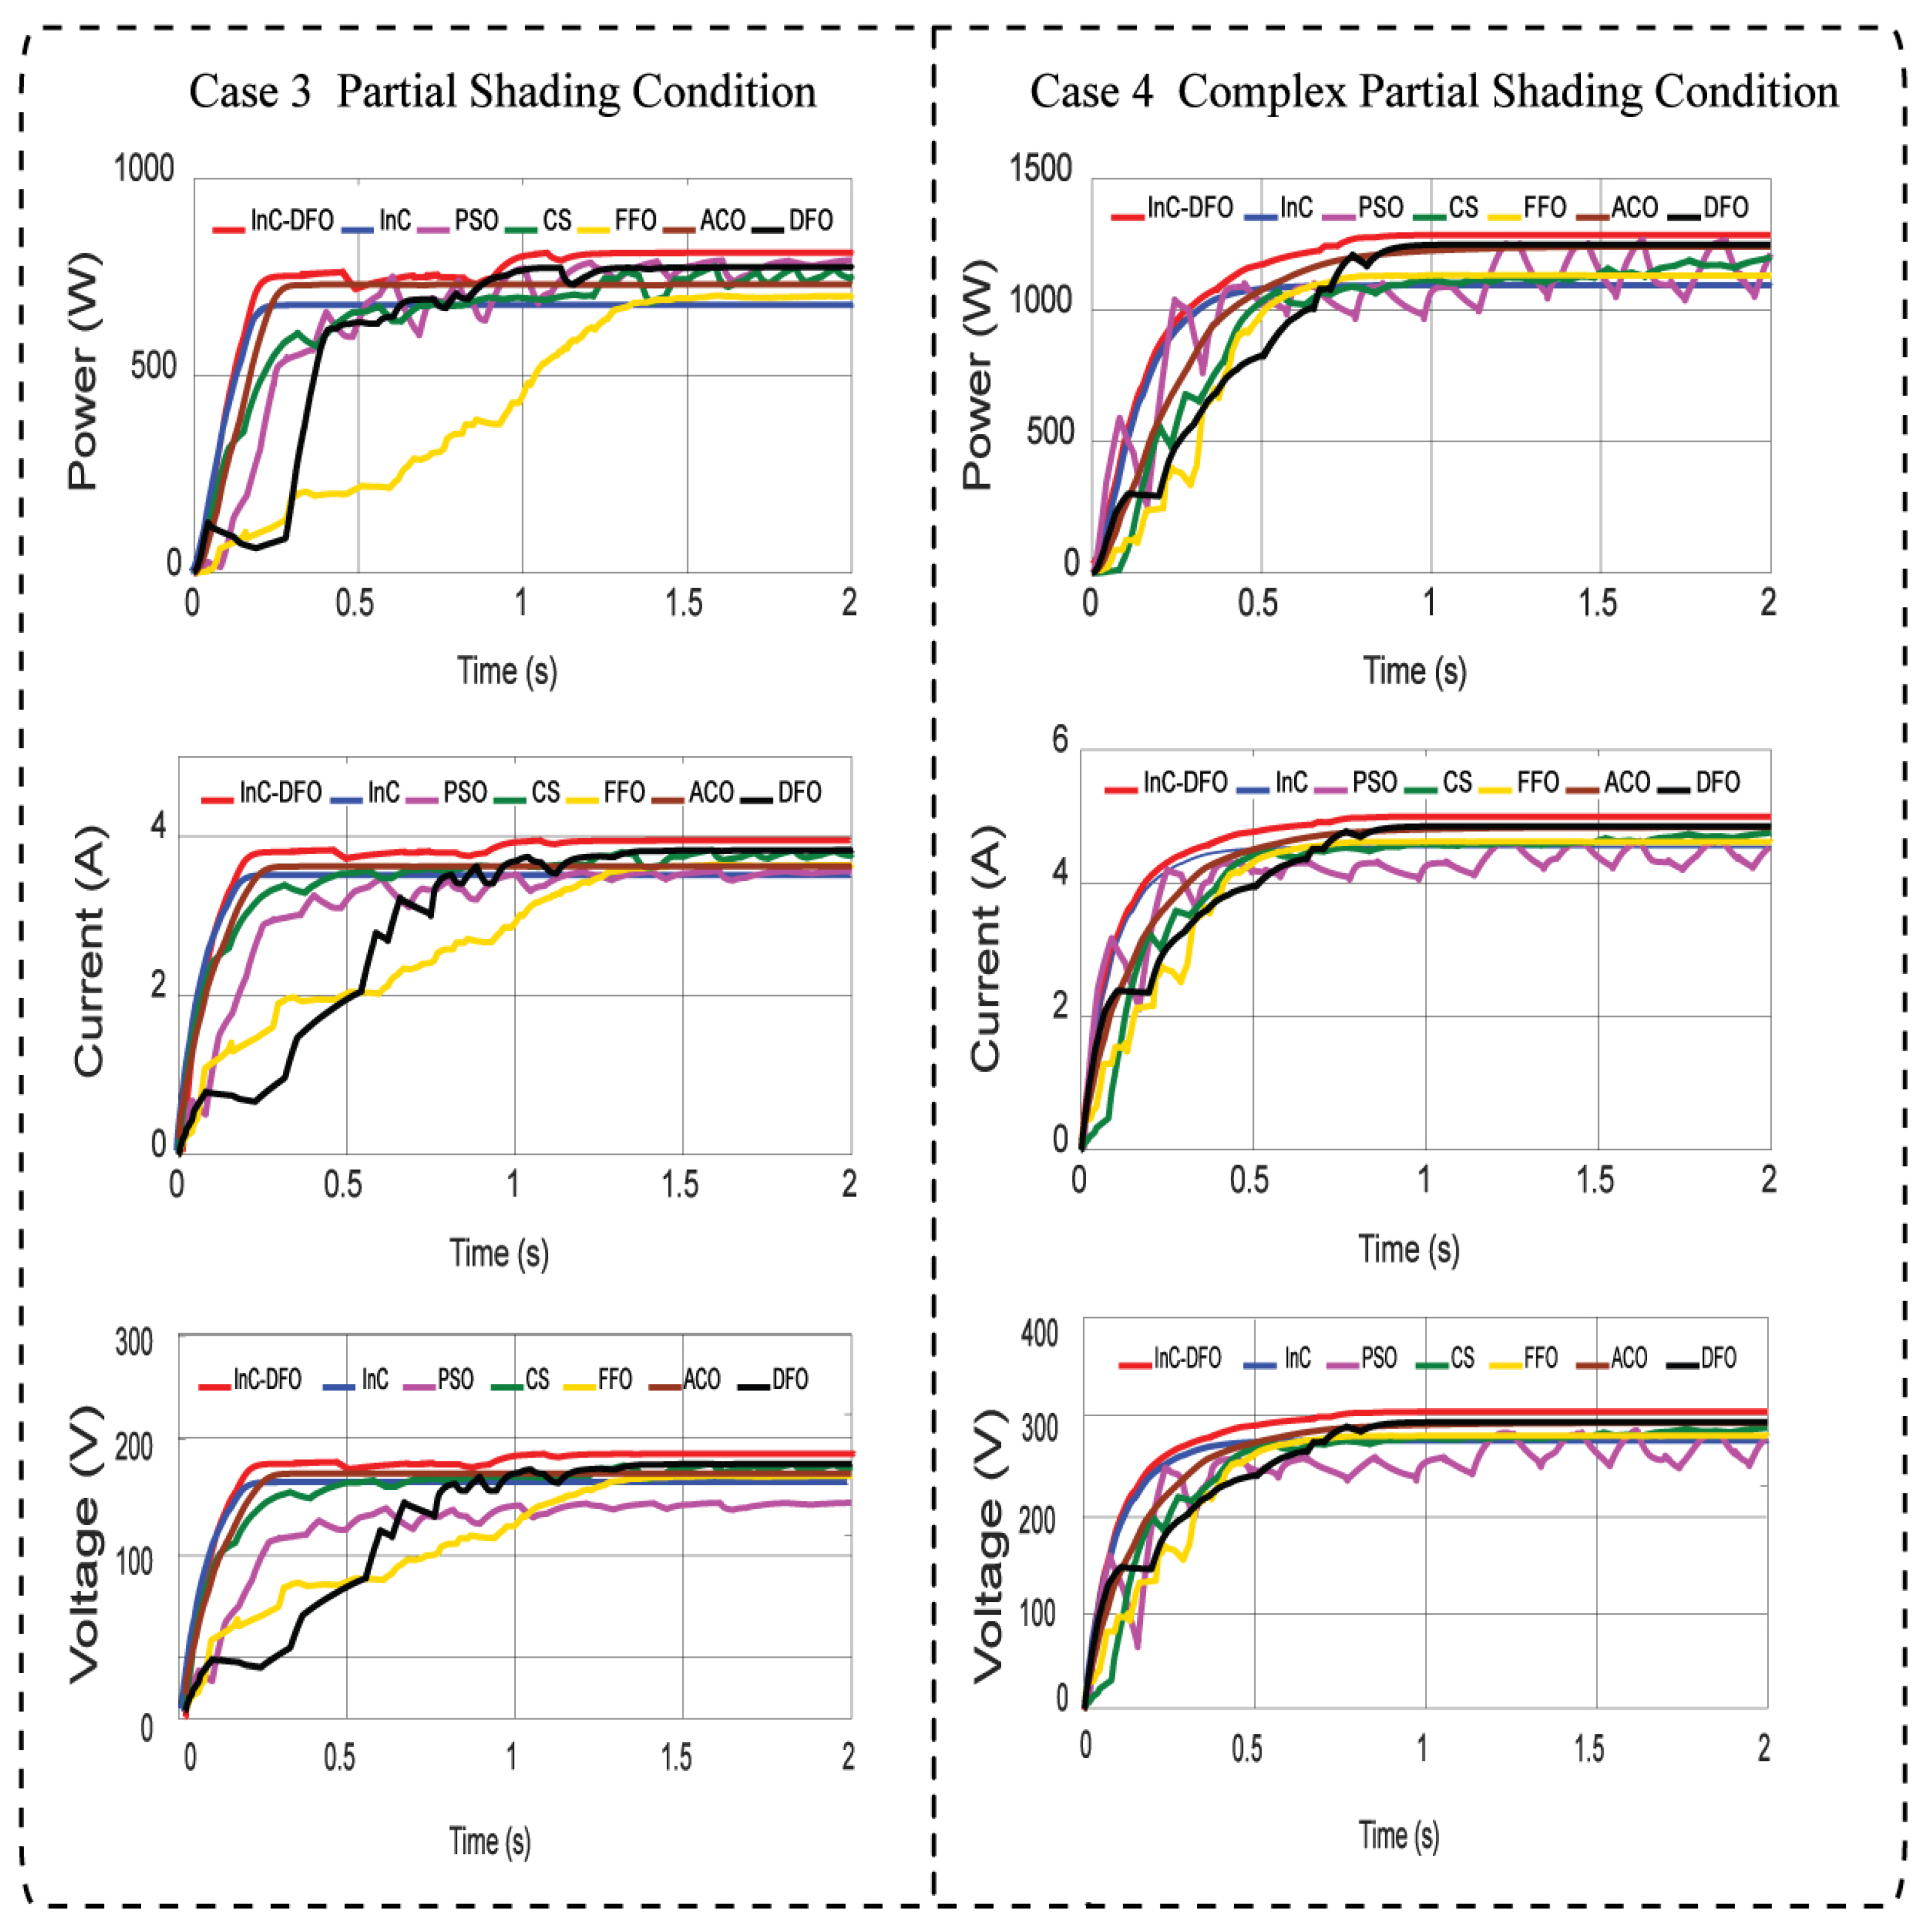
6.3. Case 3. Partial Shading Condition
Case three also represents another PS condition and their irradiance pattern is illustrated in
Table 2. The value of GM is tracked in this case of PS. The Value of GM tracked is 781 W. In case 2 of partial shading, a 4 × 1 PV array is used. The power of the proposed hybrid technique is compared with other DFO, PSO, CS, FA ACO, and InC techniques. Among all the techniques PSO has the highest oscillation and ACO has no oscillation but they cannot find the GM and are stuck on LM. Power loss occurs due to oscillation in the PV system.
The Power of DFO, PSO, CS, FA, InC, ACO, and hybrid techniques are 780 W, 779 W, 770.2 W, 769 W, 712 W, 768 W, and 780.4 W, respectively. InC algorithm shows the lowest efficiency of 91.17 among all the techniques and it has the 2nd lowest convergence time of 0.22 s. The drawback of the InC technique is that it is stuck on LM which results in loss of power. InC technique with variable step size has the lowest settling and convergence time that’s why the proposed hybrid technique uses two stages.
The convergence time of PSO, DFO, InC, InC-DFO, CS, FA and ACO techniques are 1.10 s, 0.53 s, 0.22 s, 0.20 s, 1.41 s, 1.01 s, and 0.31 s, respectively. When comparing all the techniques it is observed that InC has the least convergence time. The settling time of ACO, FA, CS, hybrid, InC, DFO, and PSO are 0.35 s, 1.42 s, 1.93 s, 0.89 s, 0.22 s, 0.73 s, and 1.65 s, respectively. It is noted that the proposed technique presents the lowest settling time that decreases the power losses and enhances the efficiency of the PV energy systems. CS has the highest settling time that may result in loss of power.
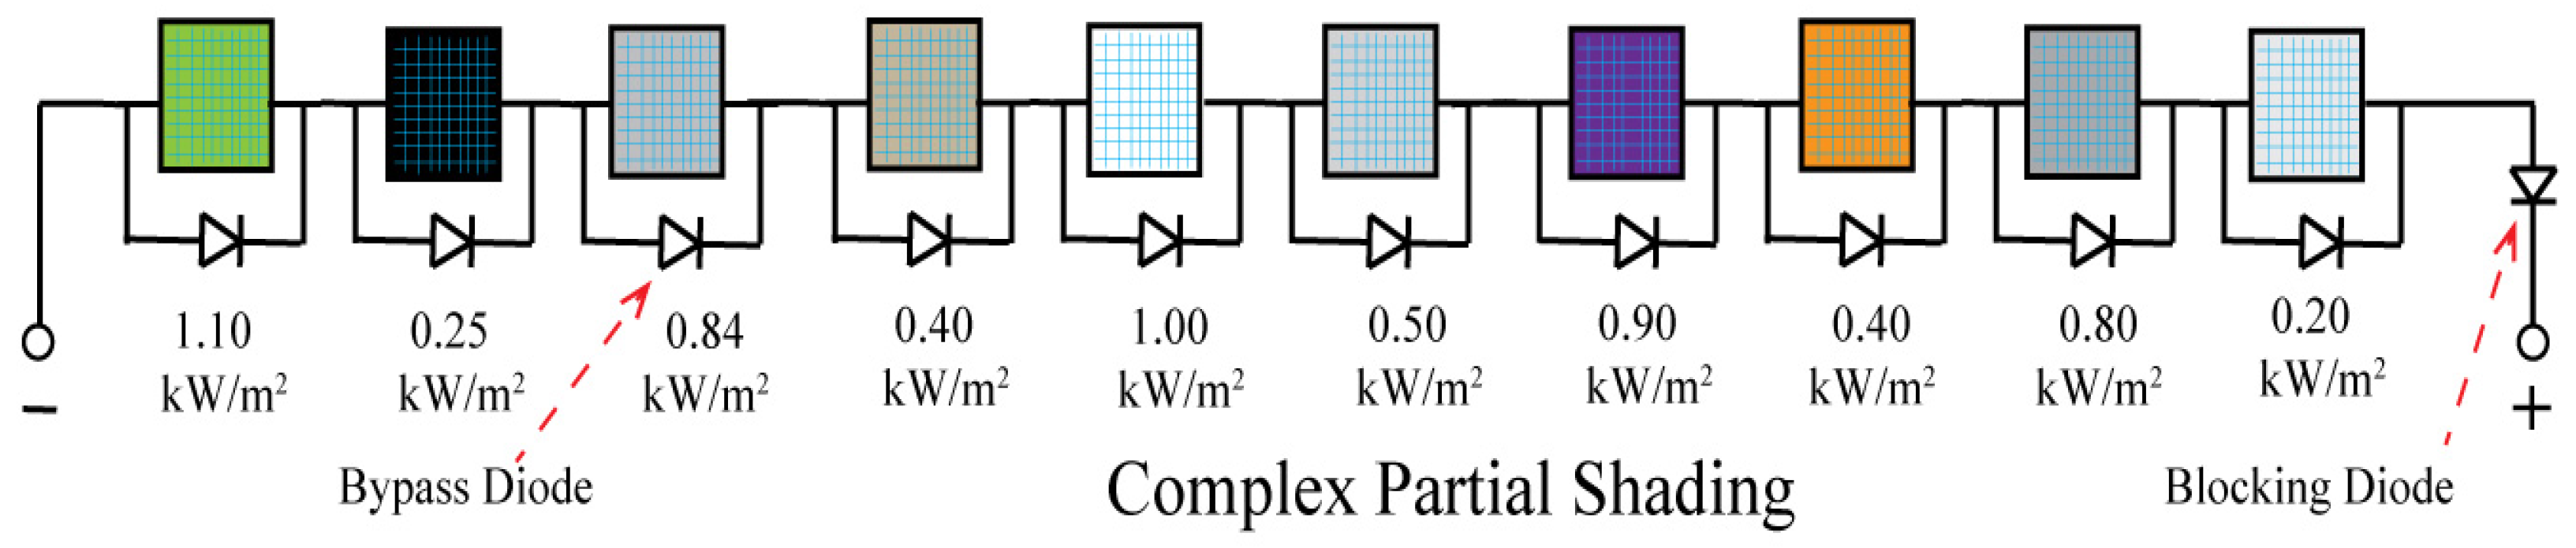
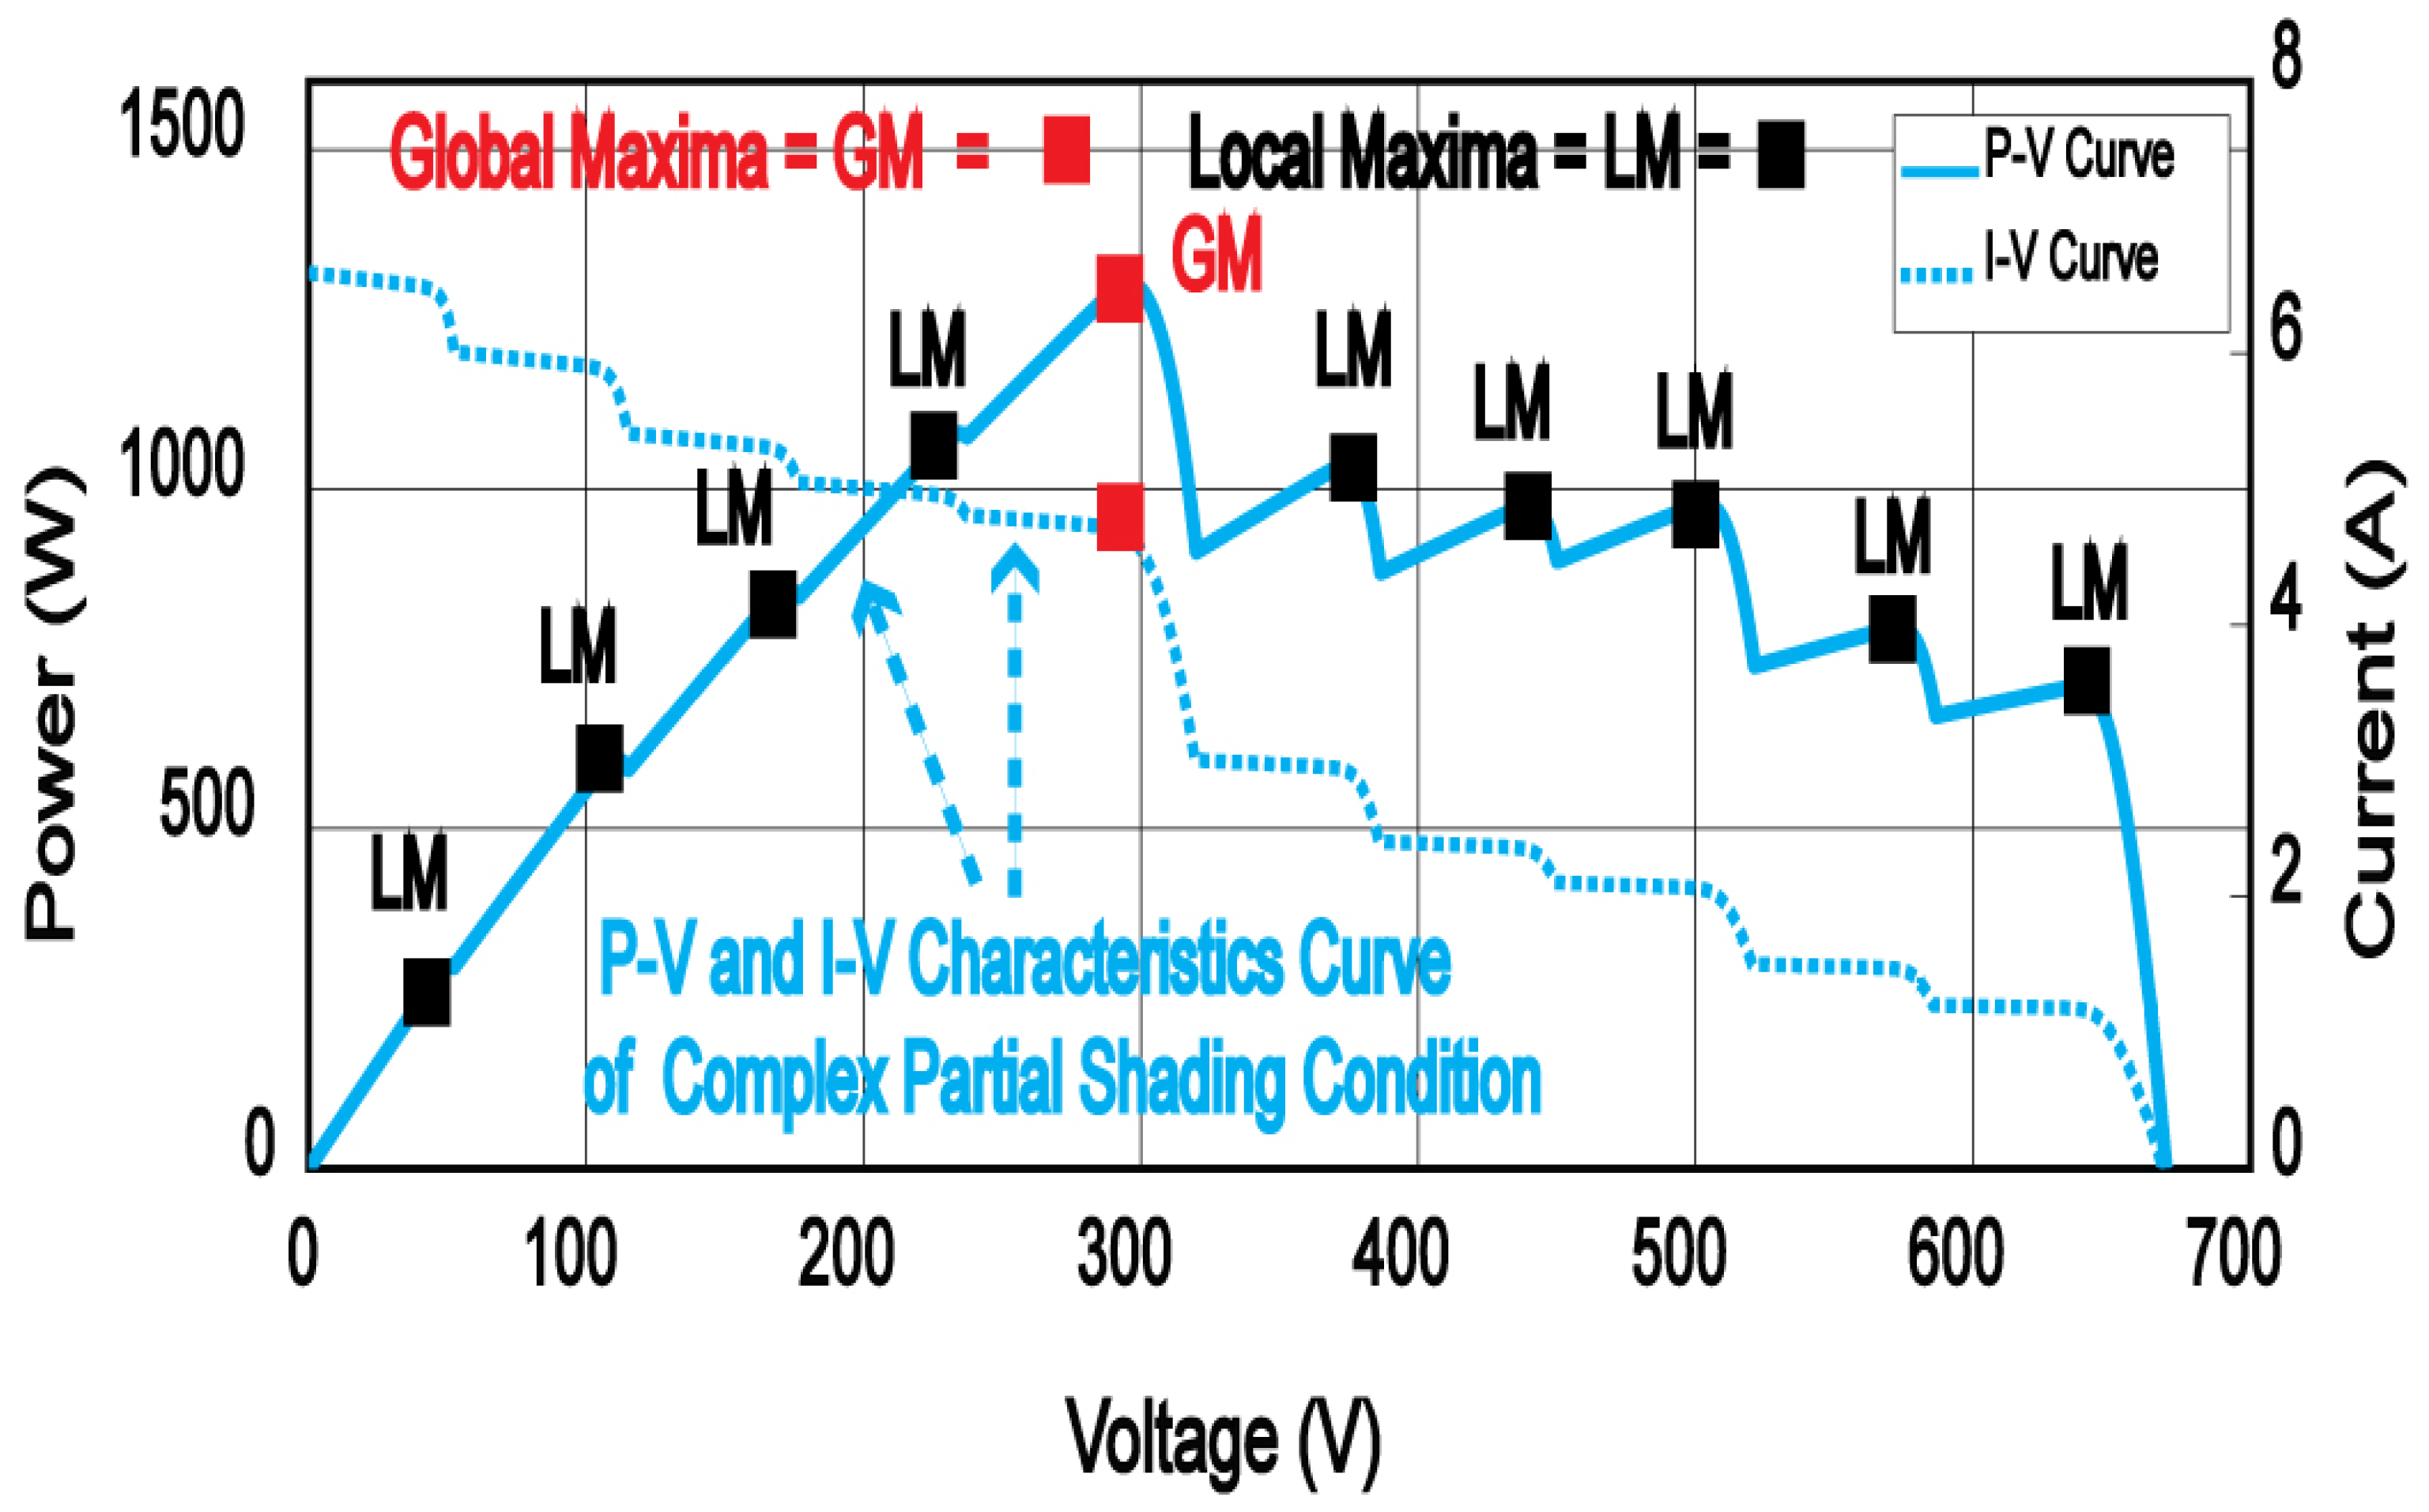
6.4. Case 4. Complex Partial Shading Condition
Condition of CPS presents in case 4 and their irradiance pattern is illustrated in
Table 2.
Figure 12 shows the P-V
I-V characteristics curve of CPS phenomena.
In the CPS case, 10 different ratings of PV modules are taken and they are connected in series. A duty cycle of a DC/DC boost converter is utilized to search the MPPT. The proposed hybrid technique is compared with the other DFO, PSO, CS, FA, ACO, and InC techniques and it is observed that The value of GM in the CPS case is 1250 W.
Power of proposed hybrid and all previous PSO, DFO, InC, hybrid, CS, FA, and ACO techniques are 1246 W, 1248 W, 1094 W, 1249.8 W, 1243 W, 1157 W, and 1247.1 W, respectively. The hybrid algorithm gives the highest power among all the techniques. InC technique with variable step size cannot find the GM and is stuck on LM but it has the lowest convergence and settling time of 0.39 s and 0.45 s, respectively. PSO method shows that it has the highest oscillation among all the techniques that cause the reduction of power loss of the PV system. The settling time of ACO, FA, CS, Hybrid, InC, DFO, and PSO techniques are 1.4 s, 1.80 s, 1.82 s, 0.75 s, 0.45 s, 0.83 s, and 1.91 s respectively. It is noted that the proposed InC-DFO method describes the lowest settling time of 0.75 s. PSO gives a higher oscillation that decreases the power of the PV system. The convergence time of PSO, DFO, InC, hybrid, CS, FA, and ACO techniques are 1.31 s, 0.69 s, 0.39 s, 0.41 s, 0.73 s, 0.52 s, and 0.59 s, respectively.
The proposed method can remove the oscillation of the PSO and CS algorithm, thus increasing the efficiency of the PV energy systems. However, InC gives the lowest efficiency 87.52% because it is not able to find GM and is stuck on any value of LM.
In the case of CPS, the hybrid algorithm achieved the highest efficiency 99.98%. In the first stage, the InC technique is used because of less settling time but it is stuck in local maxima and cannot find the GM. So, in the second stage, we use the DFO that has the highest capability of tracking power. The proposed hybrid technique has zero oscillation and the highest convergence time that results in enhancing the efficiency of the PV system. Power, Current, and Voltage comparison of all techniques for Case 3 and Case 4 are represented in
Figure 13.
To validate the effectiveness of the proposed (InC-DFO) and its comparison with six other MPPT techniques, four different cases of PV array are taken for all weather conditions. Among four cases, one is for UI condition, two cases for partial shading condition (PSC), and one is for CPS condition. On the basis of these four cases, the performance valuation of the PV system is carried out and their numerical analysis is illustrated in
Table 3.
It is observed that the soft computing algorithms are robust, redundant, and highly adaptive. The Conventional InC conductance technique has the lowest convergence time for all weather conditions but it cannot track the GM for 2–3 cases of partial shading. This algorithm is very fast because of its gradient-based control and simplicity and has a low-cost control. InC techniques are only feasible for the UI condition where all the irradiance values of PV modules are the same and it can find GM. However, in the case of PS, this conventional technique has the lowest efficiency among all the other PSO, DFO, Hybrid, CS, FA, and ACO technique.
PS conditions are presented in cases 2 and 3. PSO method has taken more time to settle down at GM when compared with all other techniques. Due to the levy flight, the CS algorithm does not give efficient results at the transient’s state. CS techniques have less oscillation as compared to the PSO method. So, as a result, there will be less power loss with enhanced performance. CPS dealt in case 4 and the proposed hybrid algorithm gives the effective results with the lowest settling and convergence time as compared to the other PSO, DFO, FA, CS, InC, and ACO techniques. In the case of CPS, PSO, and CS technique performance is compromised because they initialized the particles randomly.
For comparative analysis of all presented techniques, the DFO algorithm is included because it has effective unique characteristics like enemy avoidance, coherence, swarms closely spaced interaction. These DFO characteristics help to eliminate the oscillations and present optimized results of the PV energy systems. It is observed that the hybrid (InC-DFO) technique has a higher efficiency among all the comparing techniques and their output is oscillation-free for all-weather conditions. The hybrid technique tackles the steady-state and transient response successfully.
The result shows better performance compare to the results shown in the paper [
45]. The settling time of PSO, DFO, InC, Hybrid, CS, FA, and ACO techniques are 1.80 s, 0.75 s, 0.52 s, 0.62 s, 1.78 s, 1.30 s, and 0.93 s, respectively for PS1 condition and power tracked by proposed hybrid and all other DFO, CS, PSO, FA, InC, and ACO techniques are 511.4 W, 509 W, 506 W. 498 W, 325 W, and 507 W, respectively. The convergence time of the PS2 condition for PSO, DFO, InC, InC-DFO, CS, FA, and ACO techniques are 1.10 s, 0.53 s, 0.22 s, 0.20 s, 1.41 s, 1.01 s, & 0.31 s, correspondingly. When comparing all the techniques it is observed that InC has the least convergence time. The settling time of ACO, FA, CS, hybrid, InC, DFO, and PSO are 0.35 s, 1.42 s, 1.93 s, 0.89 s, 0.22 s, 0.73 s, and 1.65 s, respectively. It is noted that the proposed technique presents the lowest settling time that decreases the power losses and enhances the efficiency of the PV energy systems. CS has the highest settling time that may result in loss of power. The Power of DFO, PSO, CS, FA, Inc, ACO, and hybrid techniques are 780 W, 779 W, 770.2 W, 769 W, 712 W, 768 W, and 780.4 W, correspondingly. It is noted that the proposed technique presents the lowest settling time that decreases the power losses and enhances the efficiency of the PV energy systems. In CPS conditions the convergence time of PSO, DFO, InC, hybrid, CS, FA, and ACO techniques are 1.31 s, 0.69 s, 0.39 s, 0.41 s, 0.73 s, 0.52 s, and 0.59 s, appropriately. Power of proposed hybrid and all previous PSO, DFO, InC, hybrid, CS, FA, and ACO techniques are 1246 W, 1248 W, 1094 W, 1249.8 W, 1243 W, 1157 W, and 1247.1 W, respectively. The hybrid algorithm gives the highest power among all the techniques. From
Table 3, it is observed that it has the lowest convergence and settling time. The proposed algorithm tracks the GM efficiently and gives maximum efficiency of 99.93%, 99.88%, 99.92%, and 99.98% in all operating conditions due to their two-stage running phenomena.
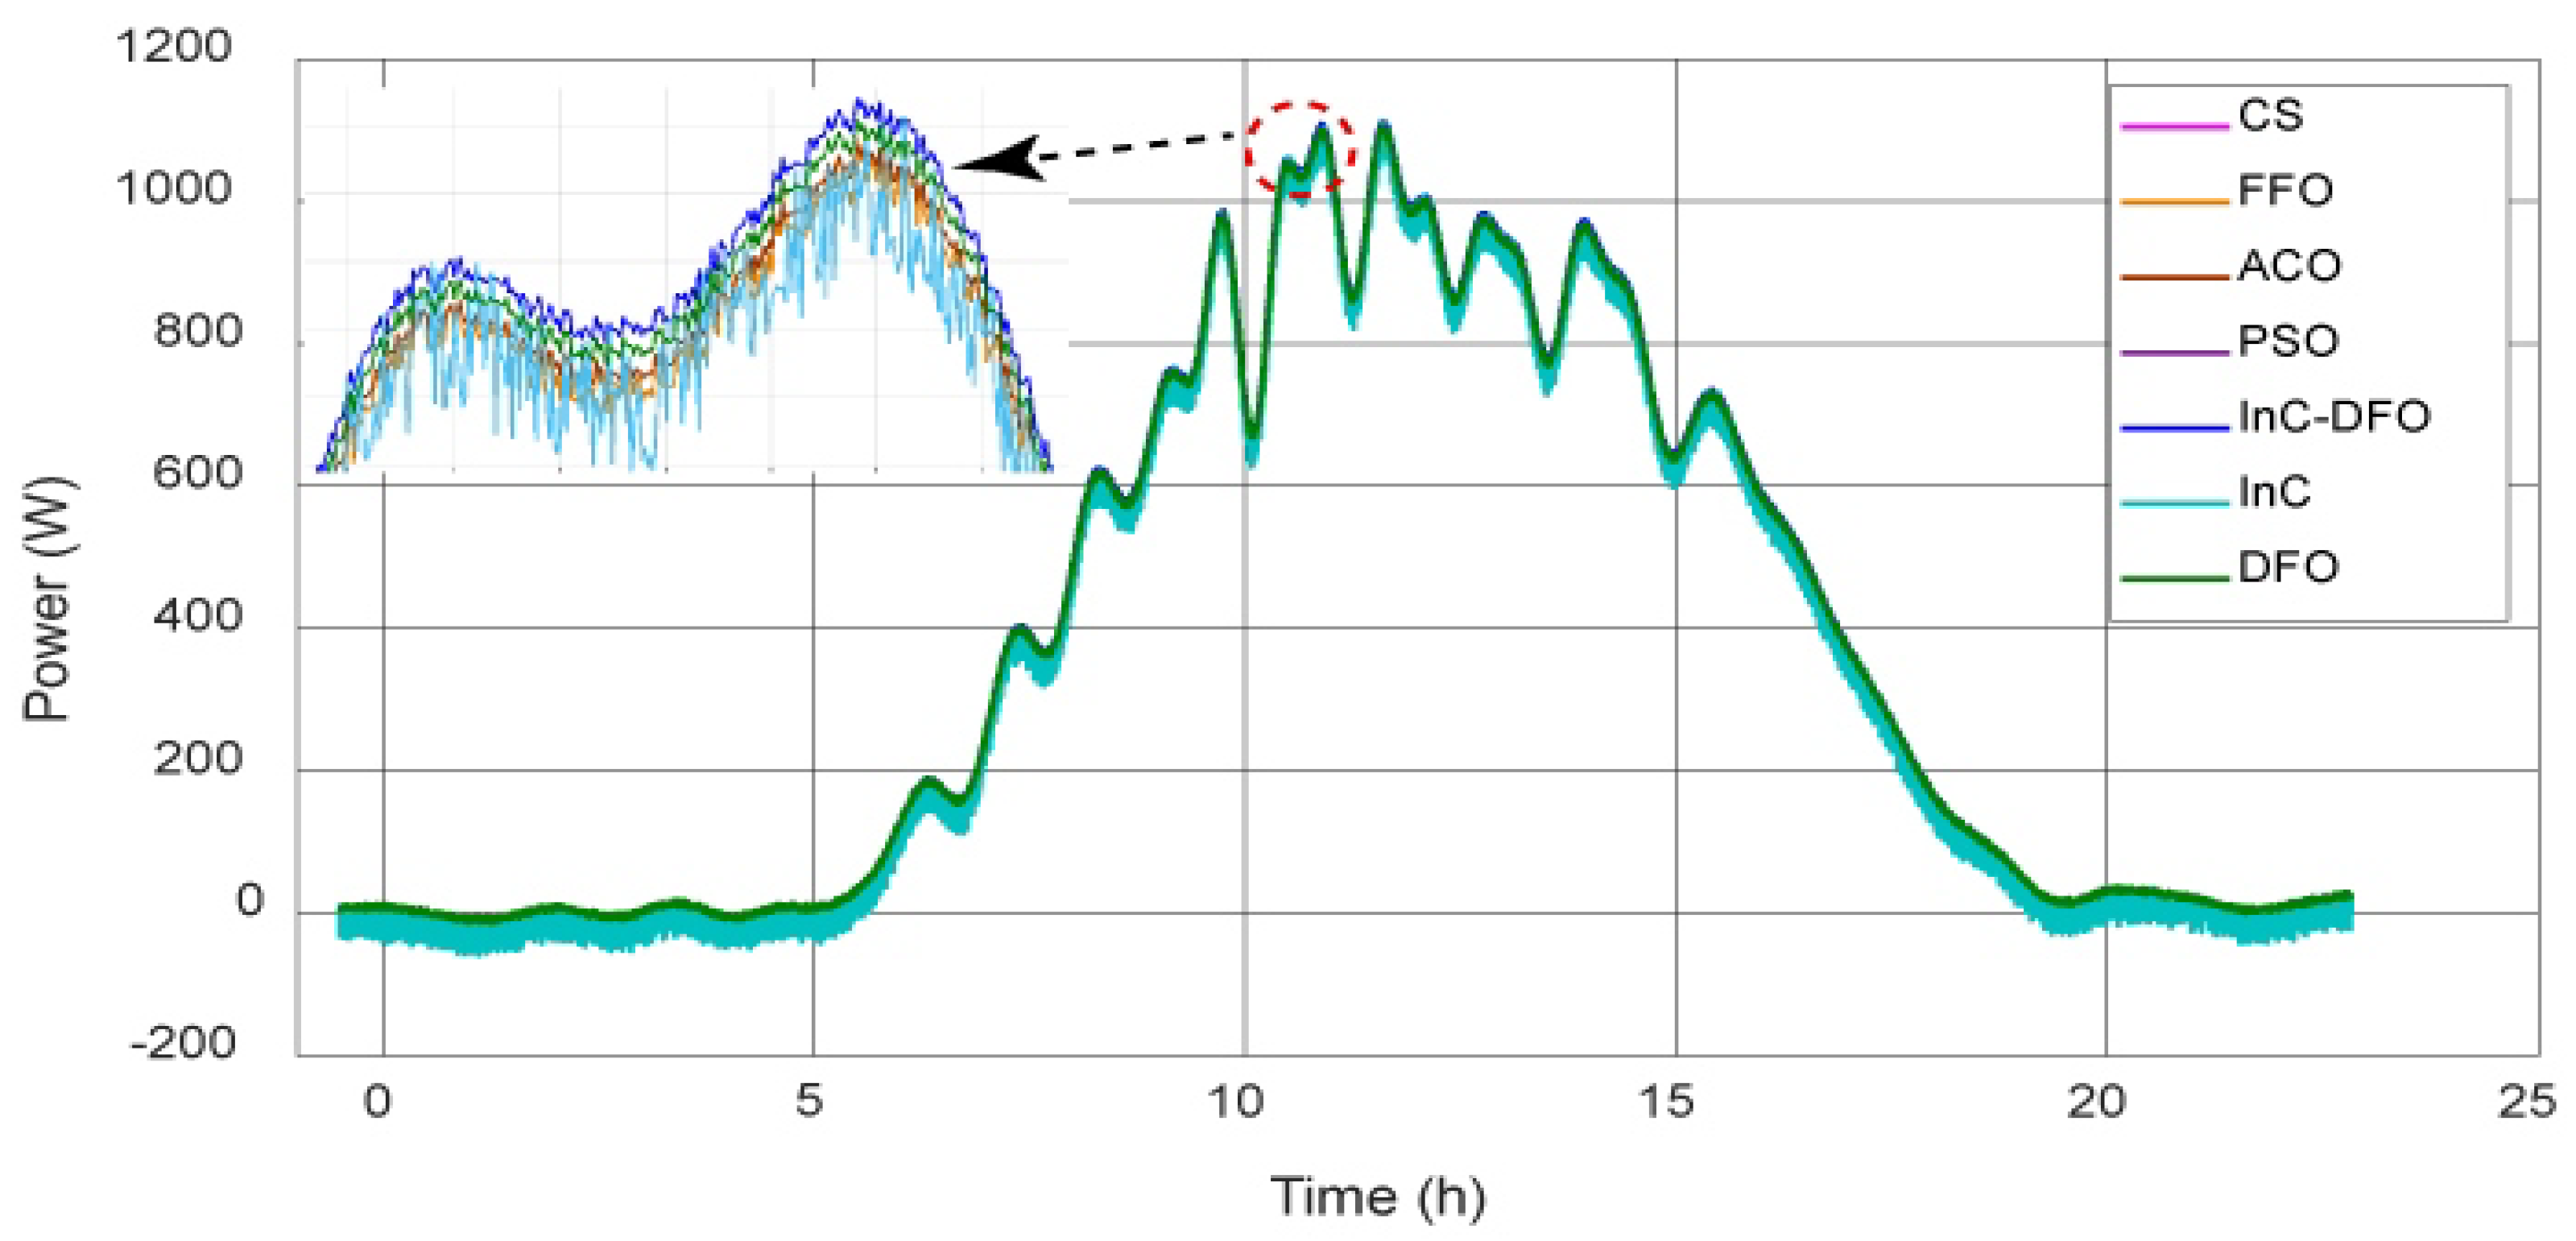
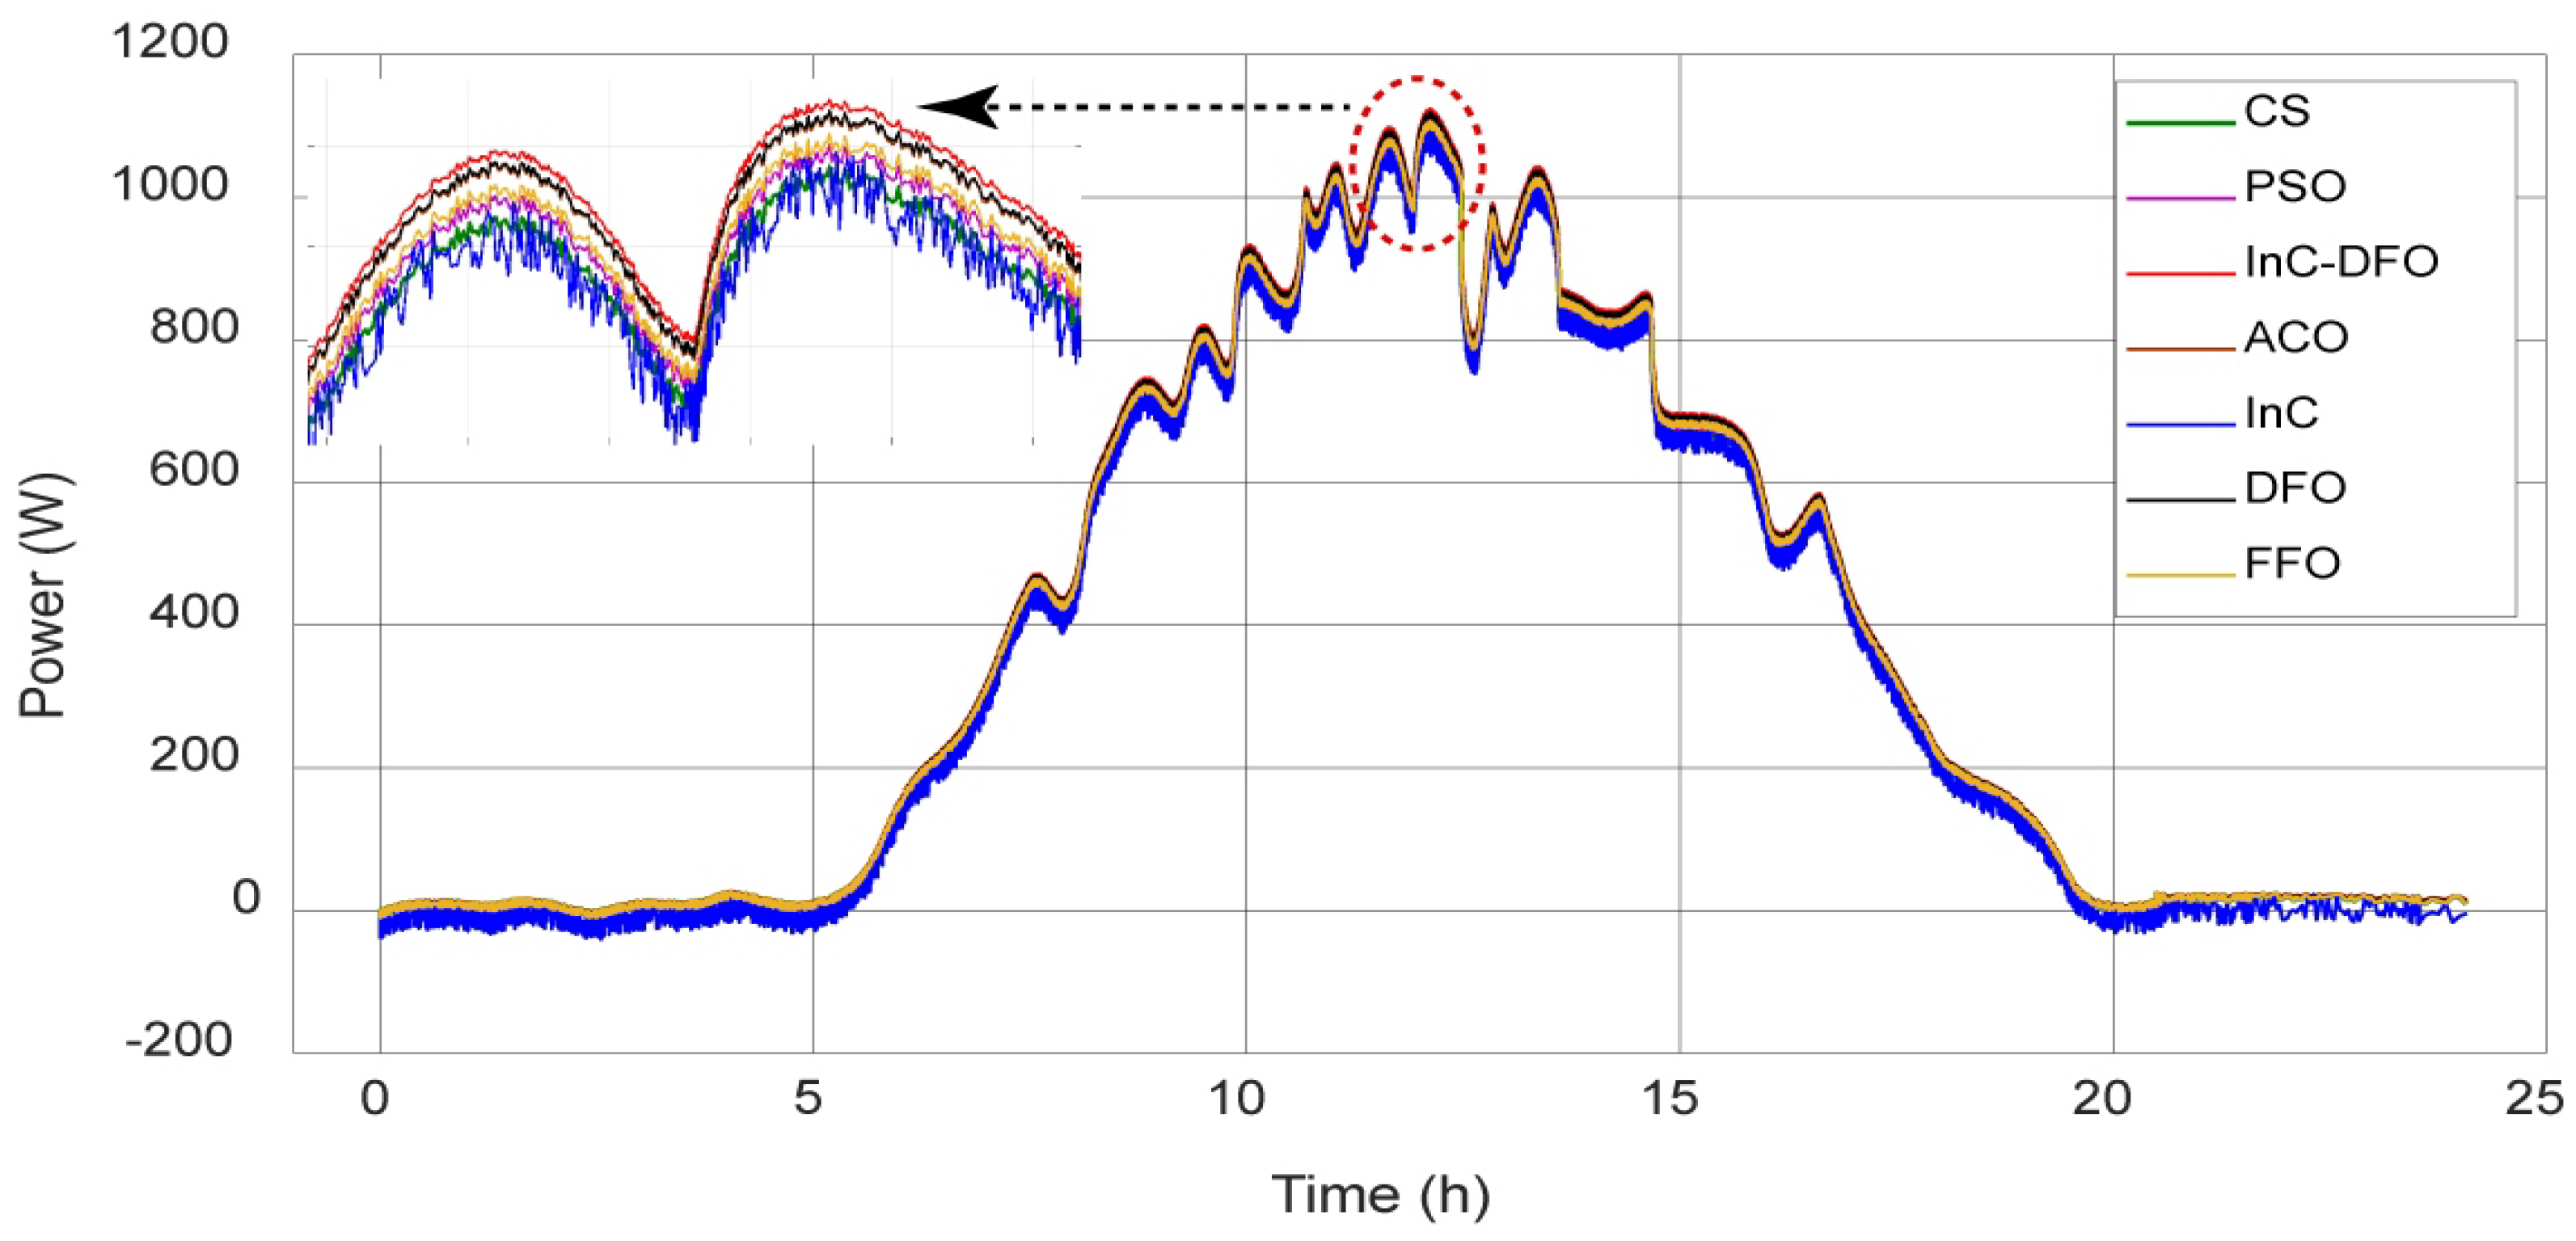
6.5. Case 5. Field Atmospheric Data of Beijing
Several factors are used to demonstrate the PV system’s feasibility. Solar PV systems are commonly used in open regions where they are exposed to adverse weather conditions. Case 5 is all about a field study on a Chinese city, namely Beijing. Field atmospheric data are used to assess the proposed InC-DFO MPP searching method in real-world situations. Seasonal temperatures and irradiation levels are available from the Chinese meteorological agency (CMA) [
46]. Total direct sunlight temperature and irradiance of two seasons are considered throughout the course of a day. The PV system consists of 4 × 1 arrays, each rated at 315.072 watts, for an installed capacity of 1260.288 watts. The data provides information on weather factors such as temperature and irradiance of the PV system. Transients of The 24-h have a 10-min resolution. Maximum power obtained during a 24-h period is used to determine the efficiency of the MPP tracking InC-DFO algorithm.
Table 4 shows the results of Case 5. Summer is probably the most productive season in Beijing, having peak production power of 897.2 W between 10 a.m. and 3 p.m. In the fall, the highest hour of average power is 811 W. Spring and winter are the least useful seasons in terms of power achievement. Beijing is located at 39.9042 North latitude and 116.4074 East latitude. According to the findings in all-weather situations, the InC-DFO algorithm gathers the most power.
Figure 14 and
Figure 15 demonstrate a comprehensive examination of the InC–DFO algorithm collected power with, ACO, FA, DFO, InC, PSO, and CS in Beijing over the course of 24 h in the summer and spring. The results demonstrate that the proposed InC–DFO algorithm delivers better results and is more efficient.


 ,
, 


