Article

Effect of Grating Ruling Machine System Errors on Grating Spectral Performance

College of Optoelectronic Engineering, Changchun University of Science and Technology, Changchun 130022, China
*
Author to whom correspondence should be addressed.
Appl. Sci. 2022, 12(19), 10174; https://doi.org/10.3390/app121910174
Submission received: 15 September 2022 / Revised: 1 October 2022 / Accepted: 7 October 2022 / Published: 10 October 2022

Abstract

:
Grating groove functions scalar theory can describe the light source through the grating interference and diffraction effect of the physical phenomenon of splitting light. It can be used to represent the distribution of the complex amplitude of the illumination light source on the diffraction screen under the action of the diffraction grating and display the information on the diffracted light position and intensity distribution. As a result, the effect of groove error on the intensity of grating ghost lines and stray light is analyzed. This paper presents an energy solution and analysis of the grating periodic groove error utilizing the grating scalar diffraction theory. Based on this, the effect of the core components of the grating ruling machines, such as screw and worm gear, on the stray light and ghost line of the grating is analyzed. Finally, the random groove error is analyzed. The analysis results show that the worm gear error is an important reason for the appearance of ghost lines in the machine ruling grating, and the lead screw error and random grooving error are the main reasons for the stray light produced by the grating. We optimize the worm gear, lead screw, and error compensation system of the grating ruling machine to effectively improve the ruling quality of the grating.

1. Introduction

The diffraction grating is a kind of dispersive element with periodic spatial structure [1], which is widely used in military, astronomy, nuclear energy, aerospace, and civil fields due to its advantages of high precision [2,3,4,5,6]. In recent years, with the development of grating fabrication technology, diffraction grating has gradually overtaken the dispersive prism in the field of spectroscopy and become the core dispersive element of spectroscopic instruments. The main manufacturing methods of diffraction gratings are mechanical ruling and holographic etching [7,8]. For some special gratings, such as infrared laser gratings with low groove density and all mid-step gratings, the mechanical ruling method must be used because of the deep groove lines and the strict requirements on the groove shape [9,10]. Due to the processing characteristics of the mechanical ruling, the undesirability of the mechanical instrumentation makes a periodic error in the actual position of the ruling grating, which leads to a change in the distribution of spectral lines in the diffraction spectrum, i.e., ghost lines [11]. At the same time, due to grating defects, there will be stray light that does not satisfy the grating equation, satisfies the grating equation but is not using diffraction levels, and it is the most important component of stray light in spectroscopic instruments. Therefore, making high-performance gratings is one of the cores of developing high-precision spectroscopic instruments [12].
The systematic error of the grating ruling machine affects almost all grating performance indexes except diffraction efficiency (diffraction efficiency is mainly determined by grating groove type, depending on grating design parameters and ruling process, etc.), such as diffraction wavefront quality, resolution capability, guard line, ghost line, stray light, etc. Therefore, domestic and foreign grating ruling machine researchers have put a lot of research efforts into how to reduce the systematic error of grating ruling machines. Harrison et al. made mechanical corrections to the ruling carriage system of the MIT-A machine [13,14]; Ding et al. quantitatively analyzed the influence of ruling error on diffraction spectrum, diffraction order, wavefront error, ghost line intensity, stray light intensity, etc., proposed a method to analyze ruling error from the perspective of diffraction efficiency [15]; Li et al. analyzed the influence of equidistant line bending and line position error of mechanically ruling grating on the spectral properties of plane grating. Accordingly, the grating ruling machine ruling system was modified [16]; to reduce groove error, Mi et al. proposed a new ruling-tool carriage system based on aerostatic guideways and proposed a completely closed-loop servo-control system with a new optical measurement system [17].
The accuracy and stability of the laser interferometer measurement system have a great influence on the grating alignment error, so researchers have done a lot of related research work. Yao et al. adopted the V-type laser interferometer to measure the relative axial displacement of the screw shaft and added the axial displacement compensation in the control algorithm [18]; Yu et al. calculated the average linear curvature error of the grating using a symmetrical order diffracted wavefront and used interference control to adjust the real-time displacement of the platform [19]; Cong et al. investigated the effect of incident light angles on mosaic grating errors in the optical path for grating replication and mosaic [20]; Yang et al. proposed a new method for separation detection and correction of mosaic errors in mosaic gratings based on two detection lights with the same diffraction order but different incident angles [21]; Lu et al. established the mathematical model of diffraction wavefront and mosaic error of grating. Using the ZYGO interferometer for real-time quantitative measurement, the automatic closed-loop adjustment of mosaic error is realized [22].
In 2019, we proposed an online compensation technique for grating profile errors, which effectively compensates for the influence of grating substrate profile errors on grating wavefront quality [23]. In 2021, by analyzing the influence of the groove displacement error and the yaw error caused by the indexing system on the grating resolution capability, the error was corrected by modifying the structure of the grating ruling machine workbench [24]. But for the grating ruling machine ruling system error and grating ruling machine itself single error for grating performance index research has not been systematically studied. To solve this problem, this paper investigates the impact of each error on the grating ruling machine and proposes a deterministic correction scheme to improve the success rate and efficiency of the grating ruling. The experimental results verify the accuracy and effectiveness of the proposed method. The main contributions of this paper are as follows:
(1)
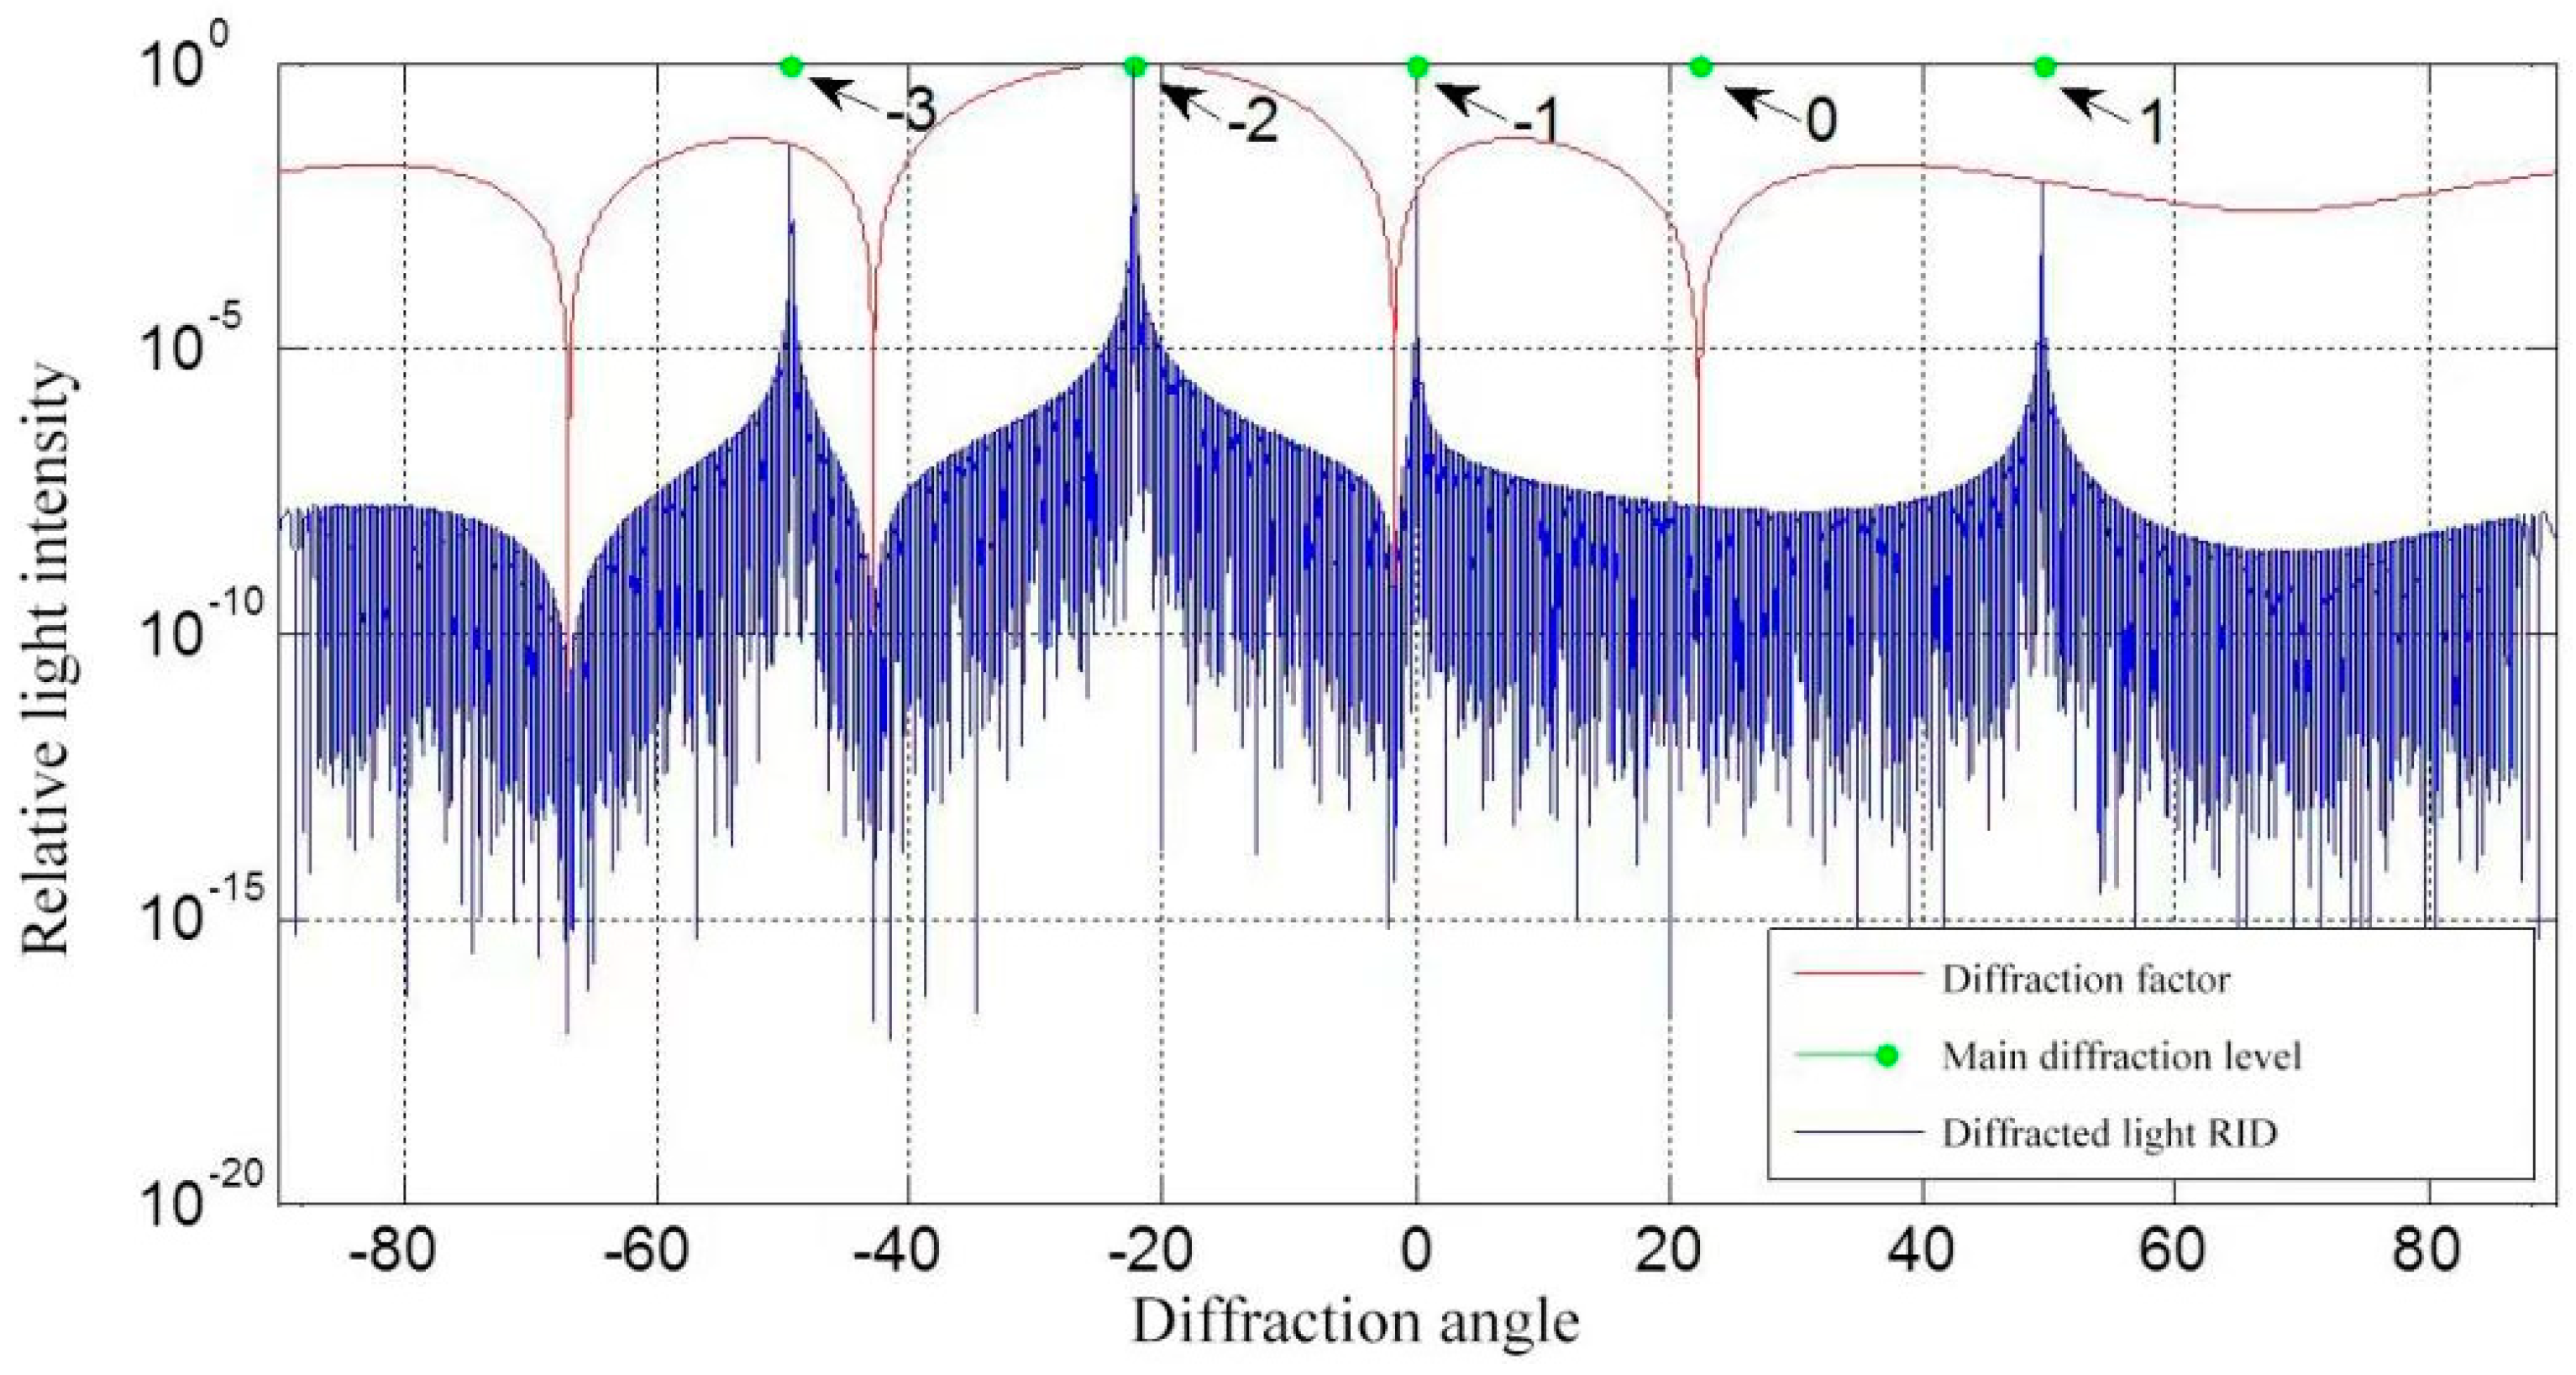
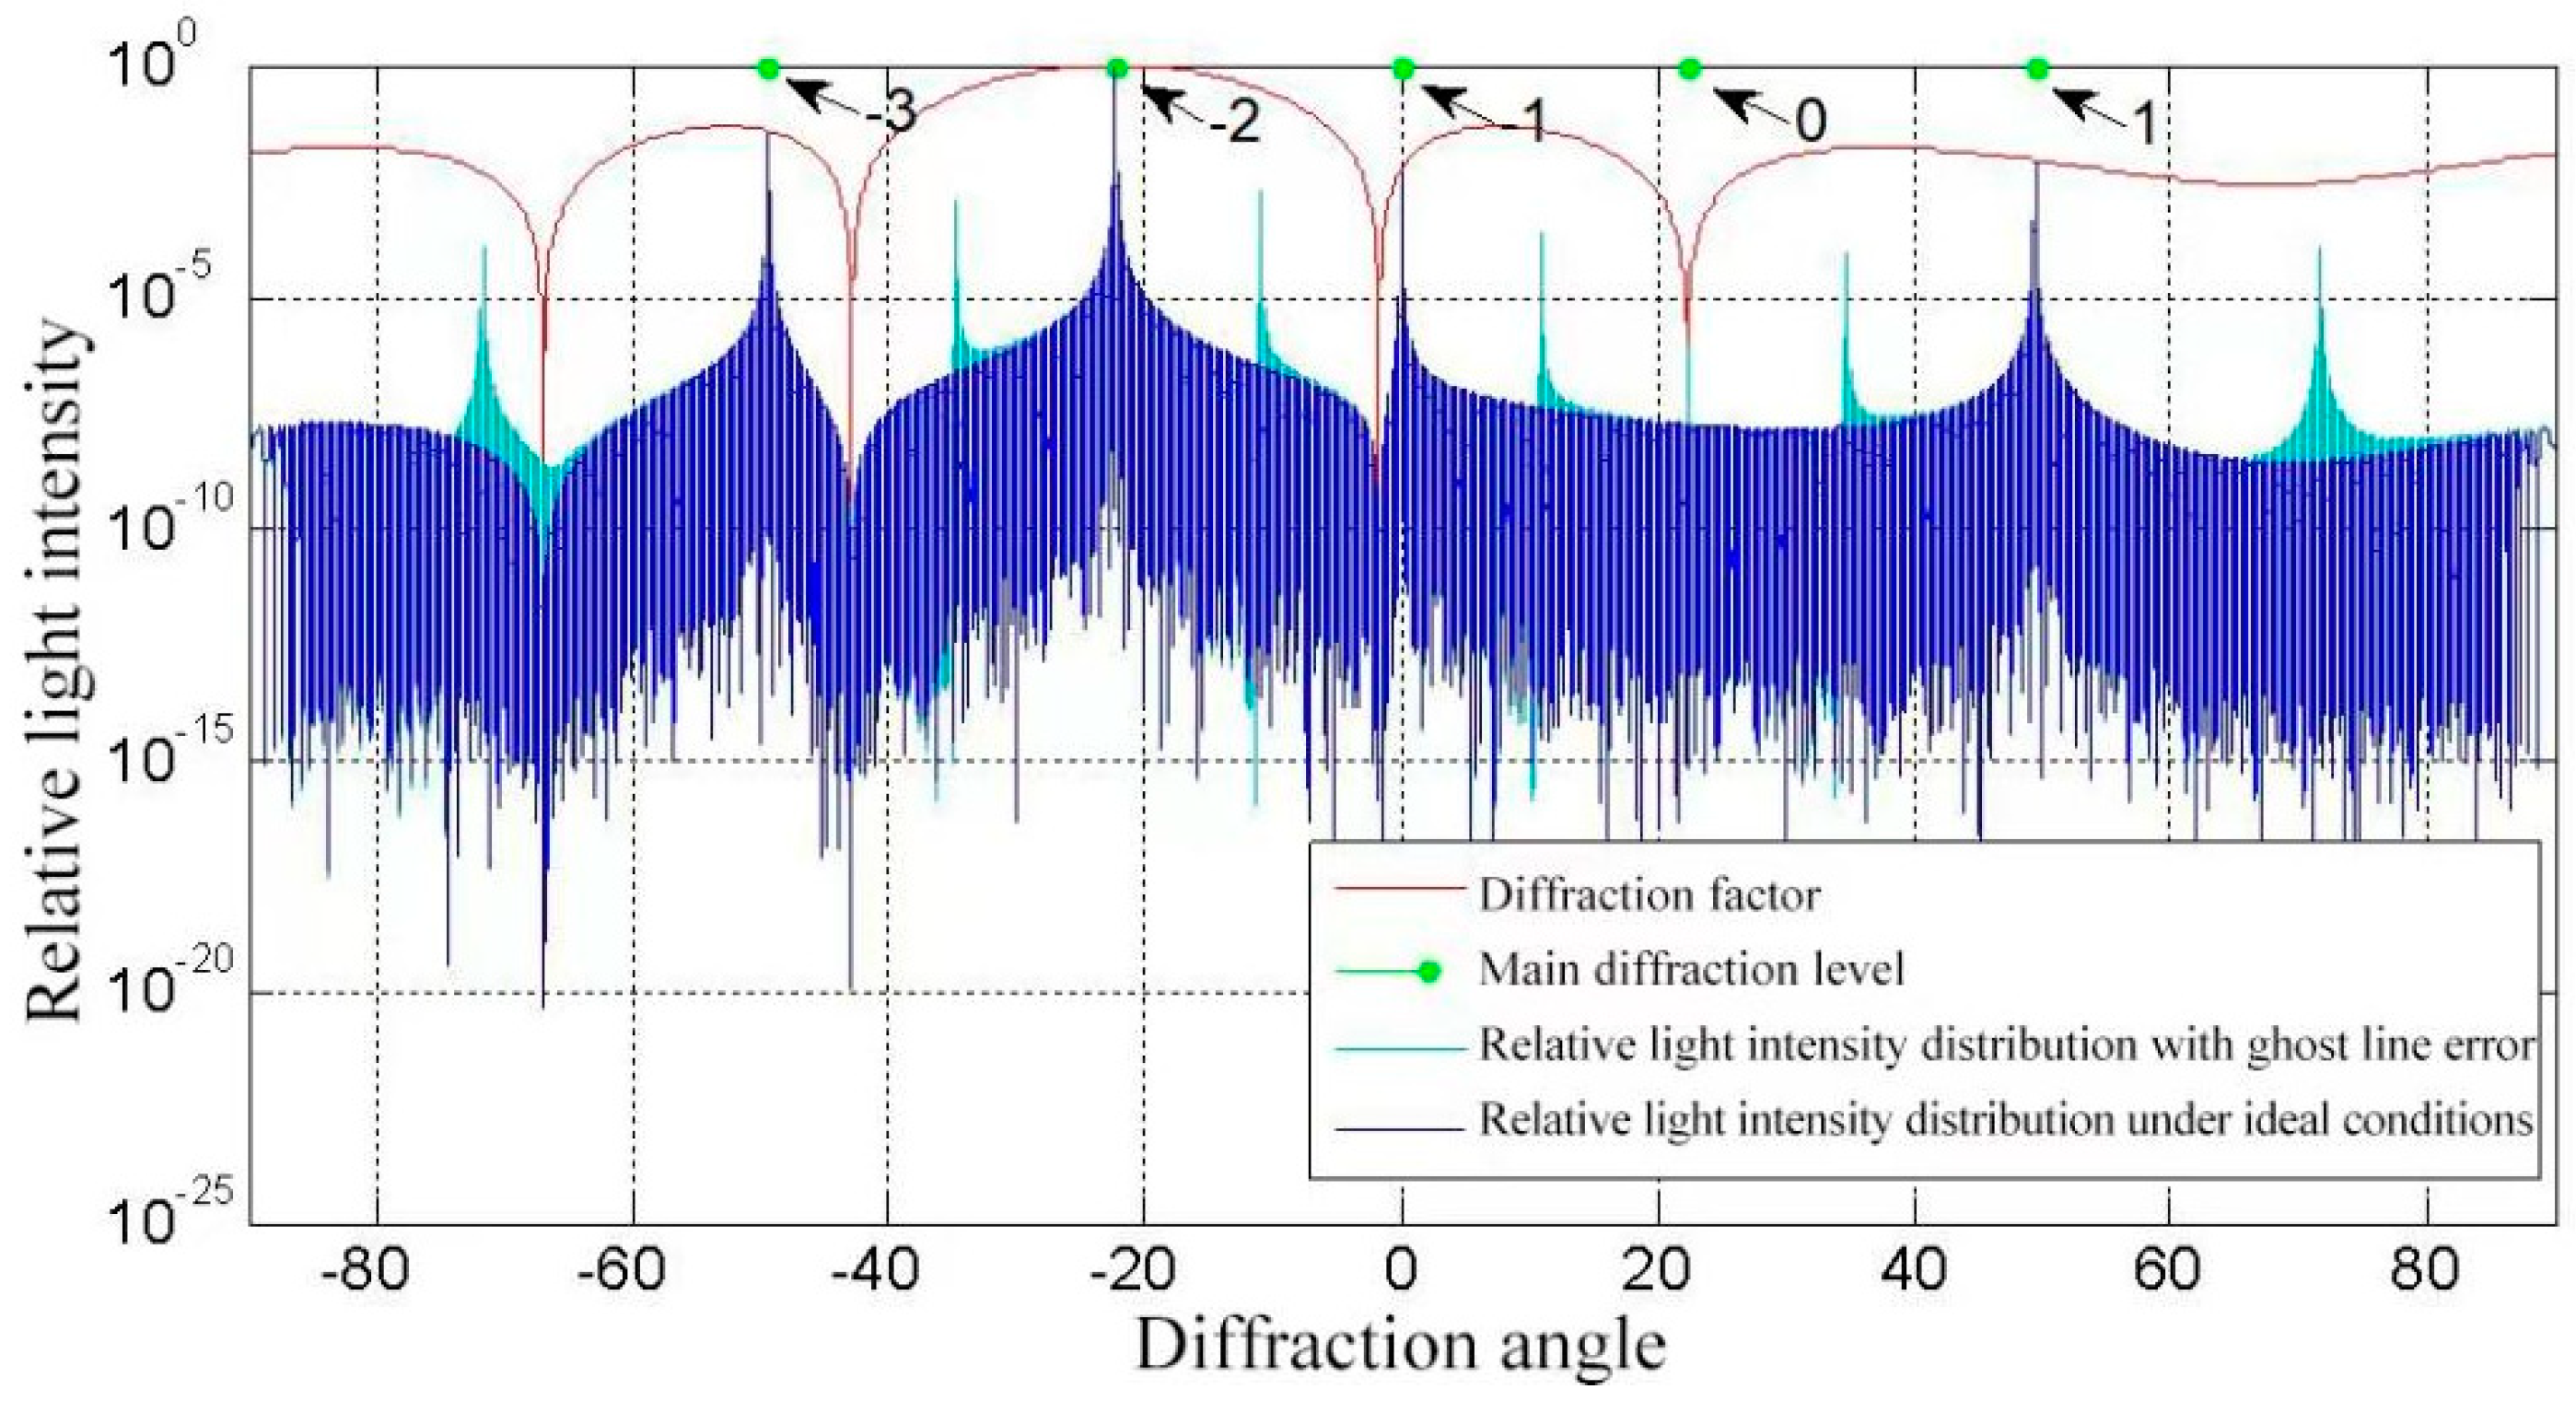
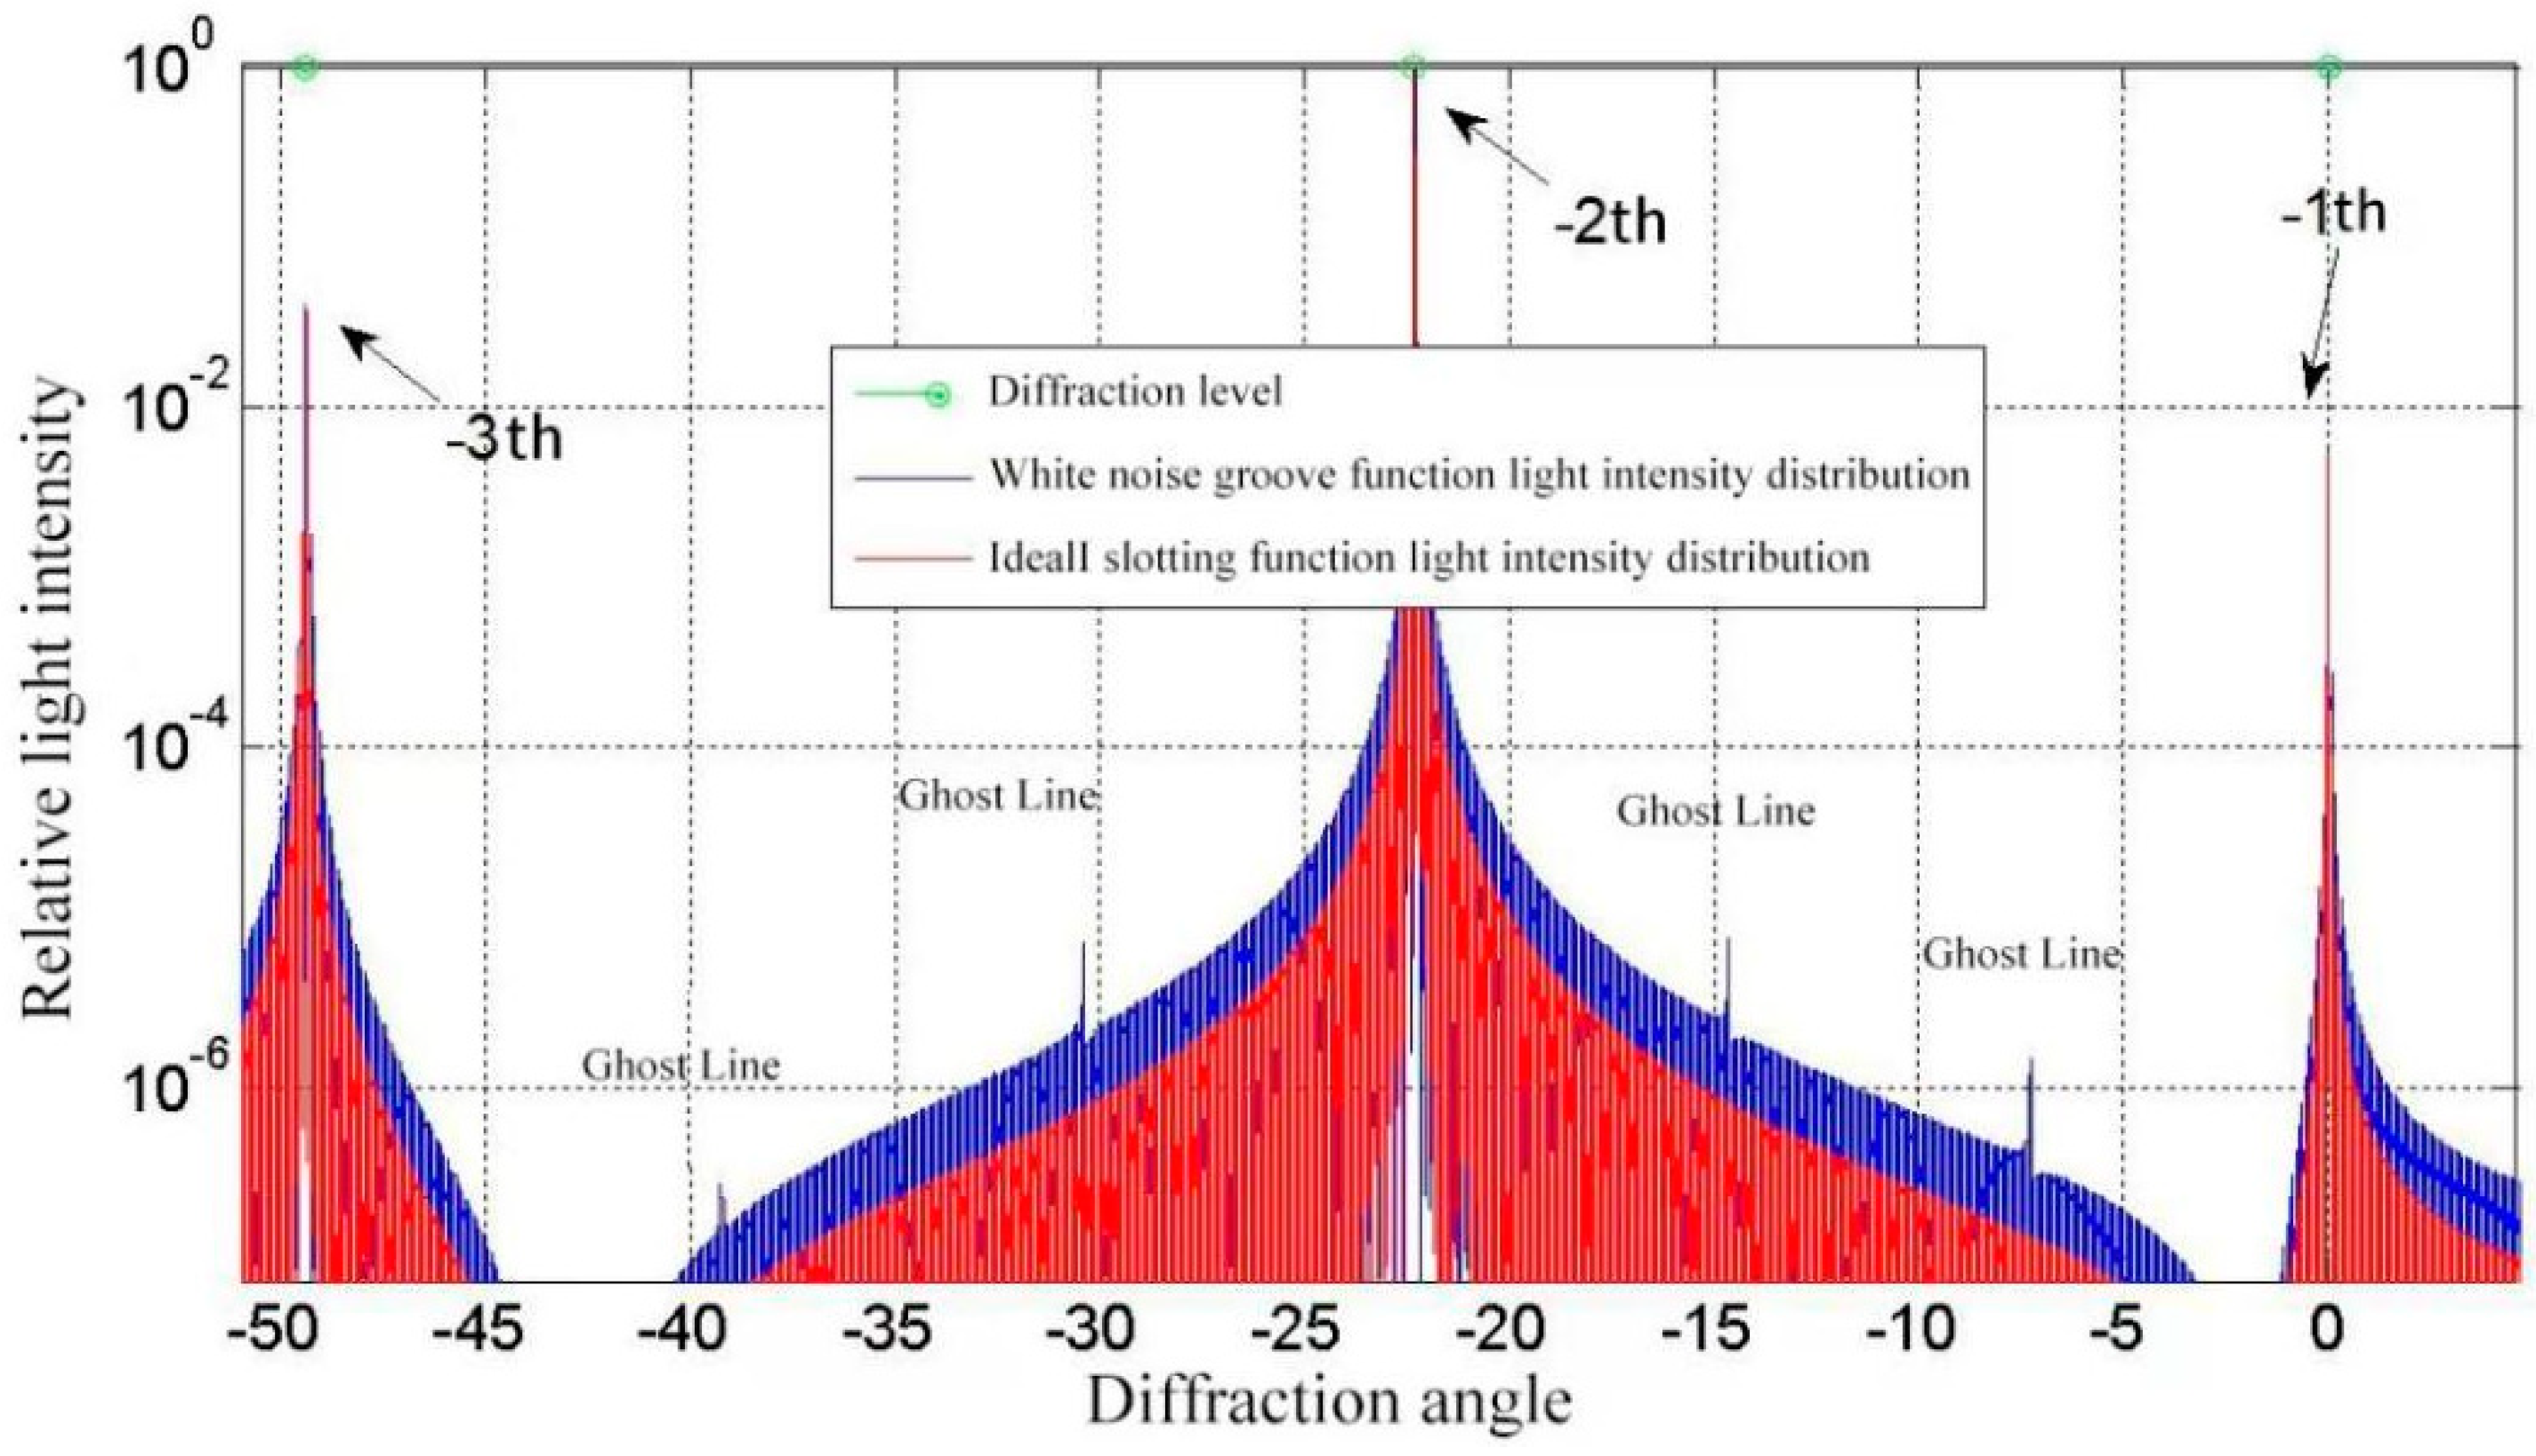
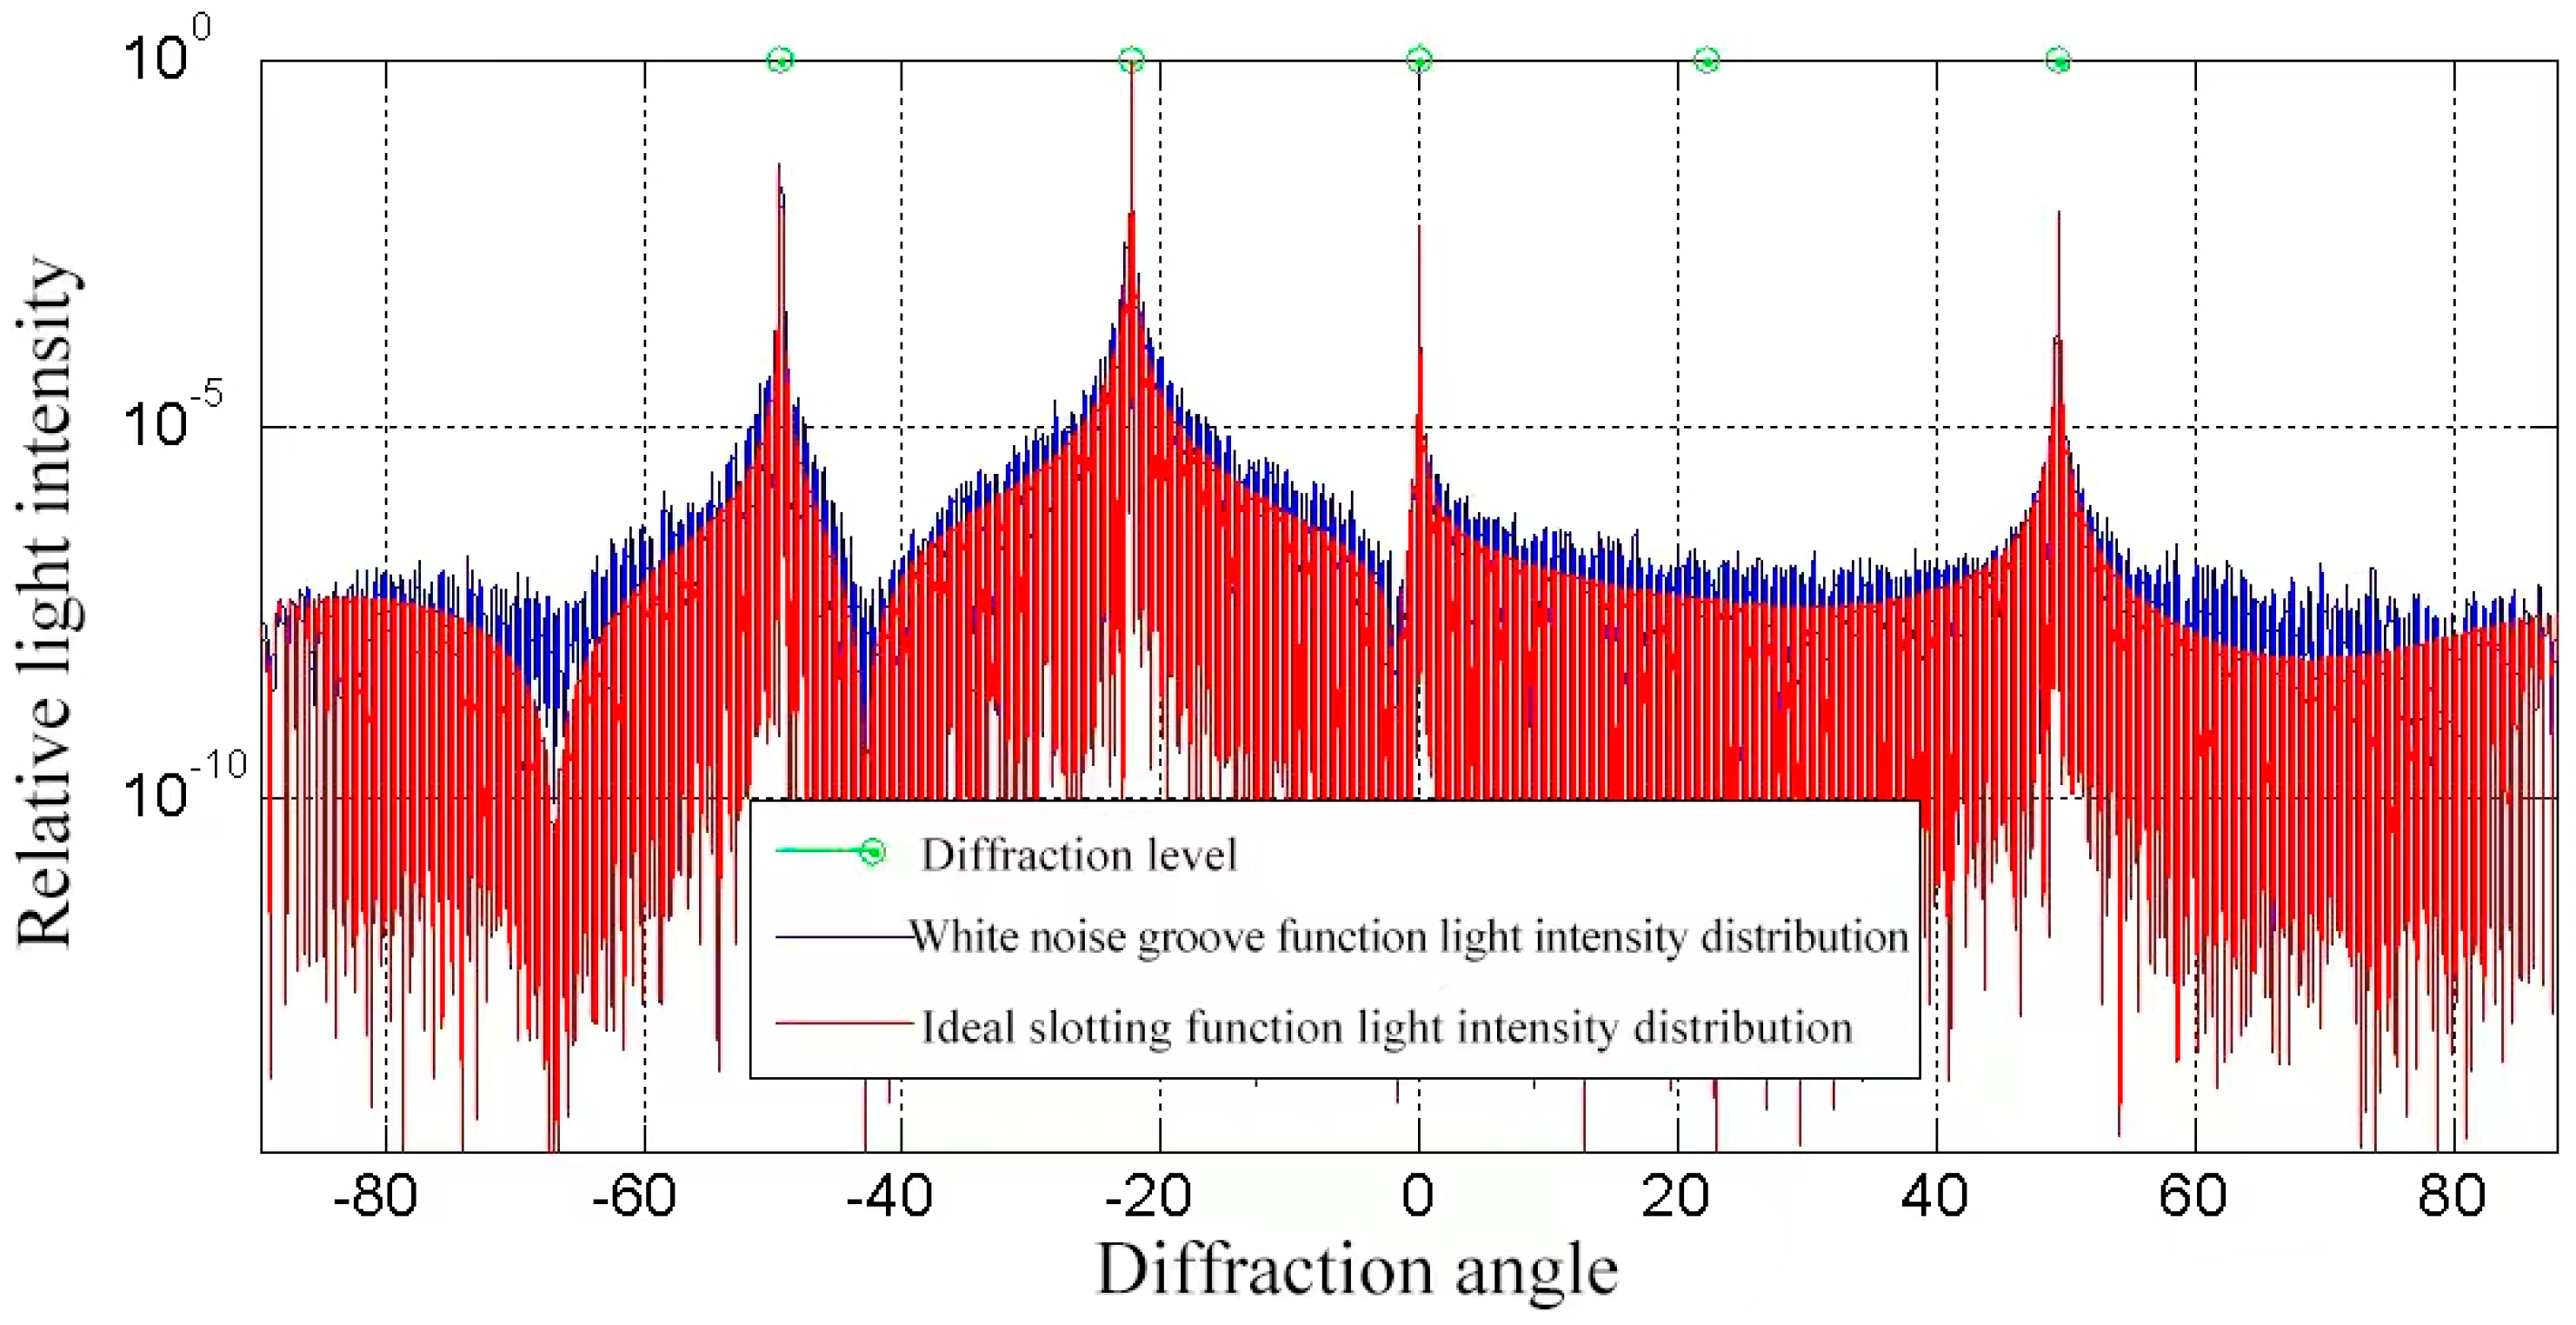
Based on the scalar diffraction theory of grating groove function, the physical phenomenon of light source splitting after grating interference and diffraction is described, and the complex amplitude distribution of light source under the action of a diffraction grating on the diffraction screen is obtained. The complex amplitude distribution can give the position and intensity distribution information of the diffraction light and then analyze the influence of the ruling error on the grating ghost line and stray light.
(2)
In order to eliminate the ghost line and stray light error, which affect the grating performance in the grating ruling process, the worm gear and screw are mechanically corrected.
(3)
The measurement’s optical path of random error is established. The grating ruling error is controlled by an active control system, and the error compensation system is optimized. To improve the performance index of the ruling grating.

2. Error Analysis of Grating Ruling Machine

According to the scalar theory of grating groove function, we construct the mapping relationship between grating groove error and grating ghost line and stray light.

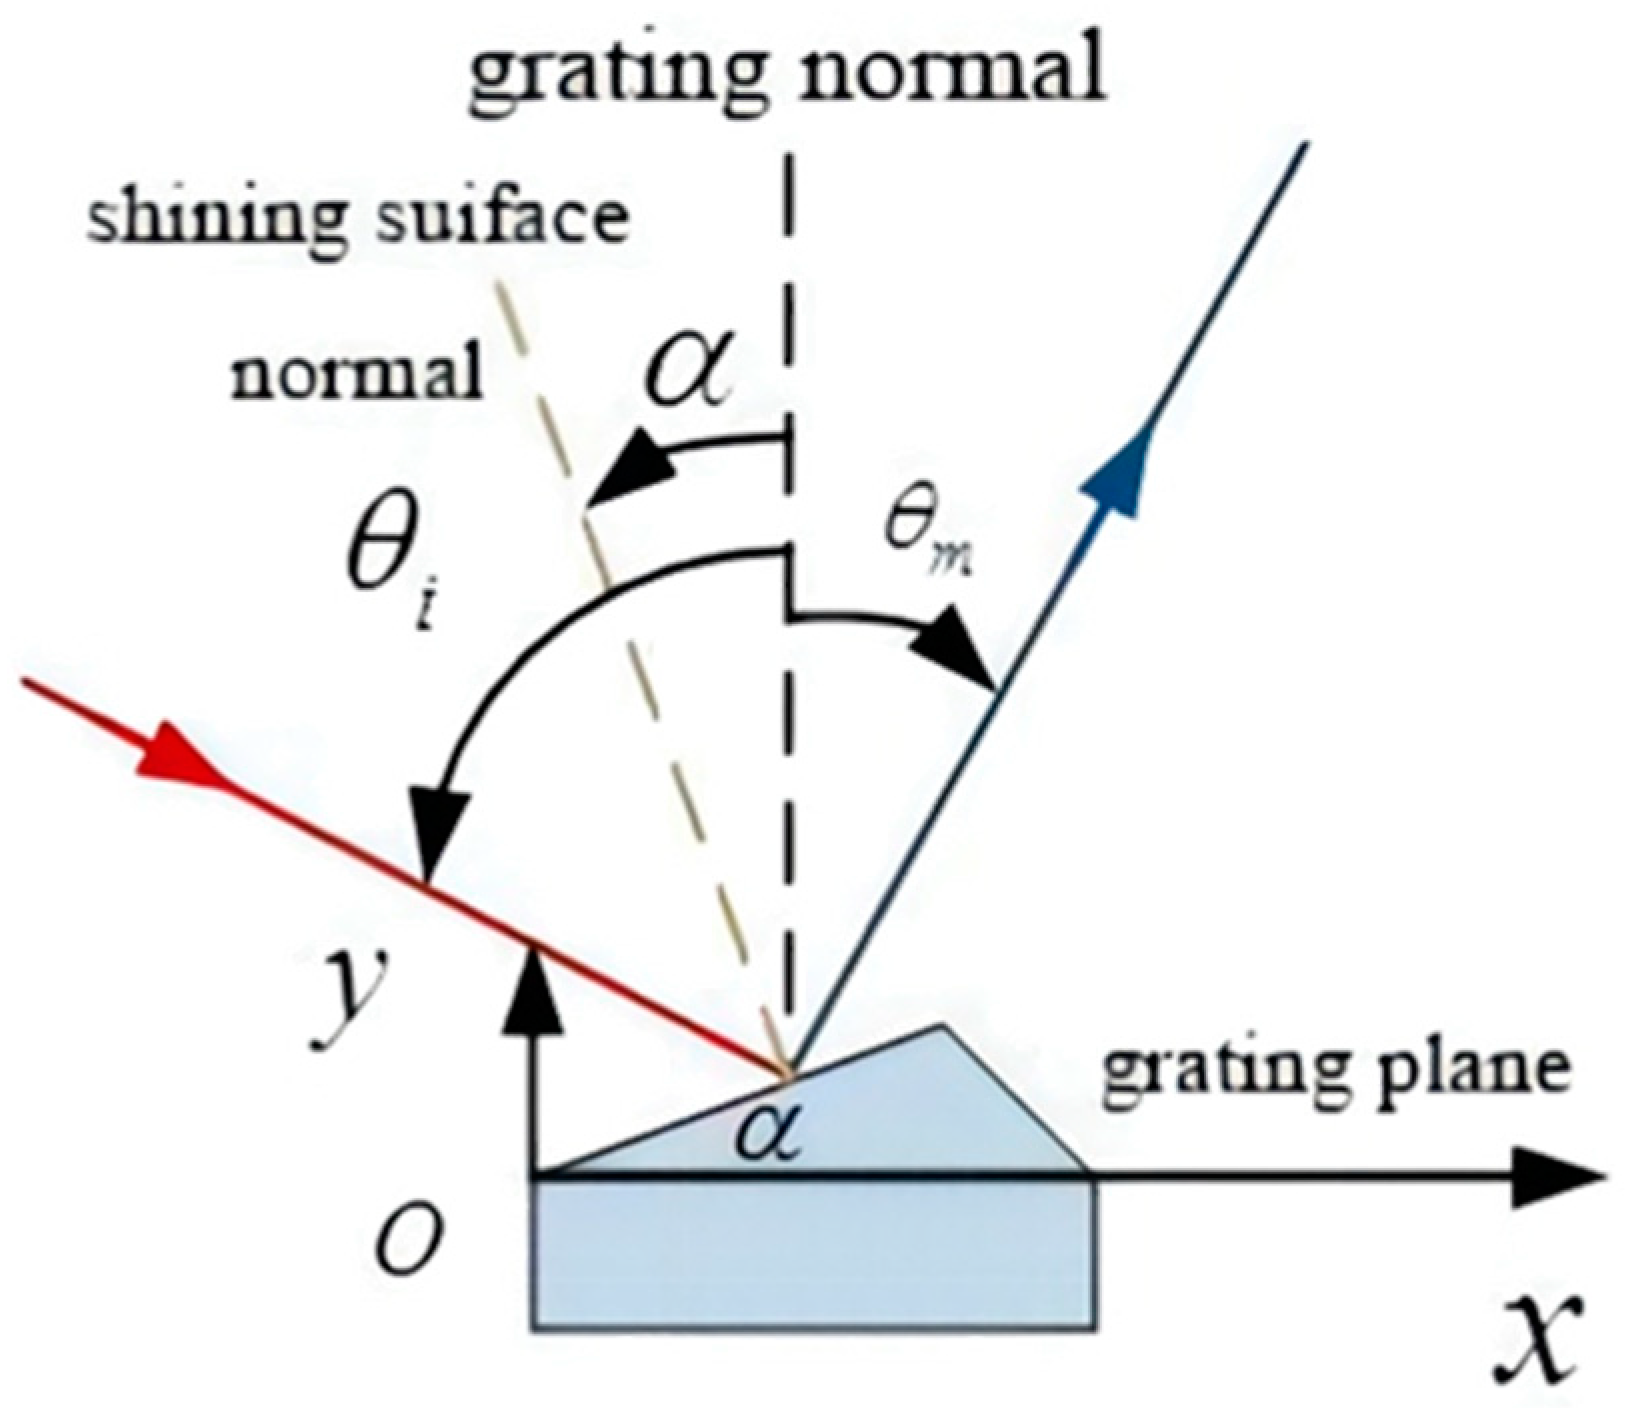
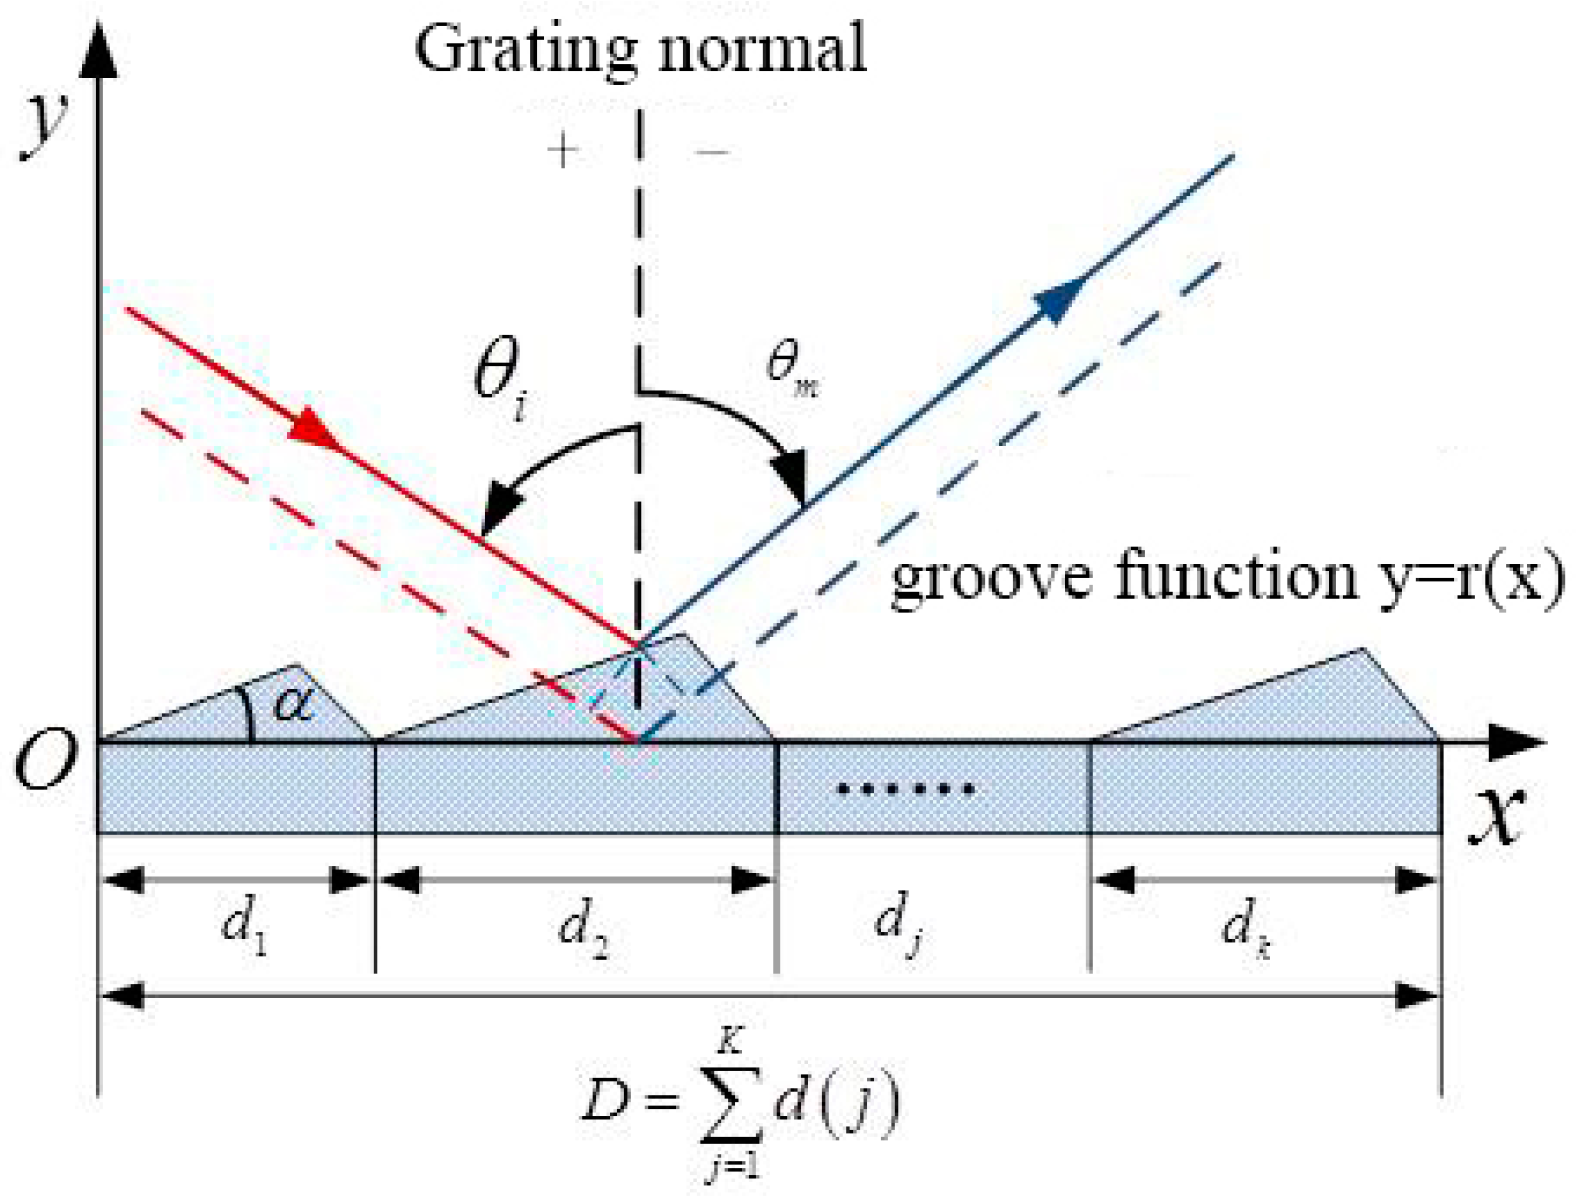
2.1. Ideal Grating Energy Distribution Solution

When a diffraction grating is illuminated by a point laser source, the energy distribution of the grating can be solved by using the Fraunhofer diffraction integral if the following conditions is satisfied.
Z k ( x 1 2 + y 1 2 ) max 2
where Z is the distance between the grating and the diffraction screen, x1 and y1 are the aperture size. When the selected laser diameter is 0.1 mm, λ = 632.8 nm, Z should be greater than 0.4 m. When the Fraunhofer integral conditions are satisfied, the optical vibration distribution function on the diffraction screen depends on the illumination source and the shape of the diffraction hole. That is, the optical vibration distribution function:
U 1 ( x 1 , y 1 , z 1 ) = e ( x 1 , y 1 , z 1 ) t ( x 1 , y 1 , z 1 )
where e ( x 1 , y 1 , z 1 ) is the illumination function of the light source and t ( x 1 , y 1 , z 1 ) is the transmission function of the diffraction hole.
The diffraction grating groove shape and the established coordinates are shown in Figure 1. Let the reflectivity of the groove be 1, the effective reflective surface width be a, the length of the groove be infinite, the direction of the ruling width be along the x direction, and the aperture function be r e c t ( x α ) . However, the phase of the reflected light at different points in a groove is different, so each reflected light should be multiplied by a phase factor. According to the geometric relationship, the phase function of the first grating groove can be found as
ϕ ( x ) = 2 π ξ x
where ξ = 1 λ tan α ( cos θ i + cos θ m ) . The equivalent transmission function of the first grating groove is then
r 1 ( x ) = r e c t ( x a ) e i ϕ ( x )
The latter grating groove is equivalent to the first grating groove translation along the x-axis; if the grating groove spacing is d, then the transmission function of the latter grating groove general formula is
r N ( x ) = r e c t ( x a ) e i ϕ ( x ) δ ( x ( N 1 ) d )
Then the total transmission function of N grating grooves is
r ( x ) = r 1 ( x ) + r 2 ( x ) + + r N ( x ) = r e c t ( x a ) e i 2 π ξ x m 1 N δ ( x ( m 1 ) d )
If the illumination source is incident obliquely in the xoz plane with a monochromatic plane wave of amplitude 1, and the angle with the z-axis is θ . The illumination function is
e ( x ) = e i 2 π u 0 x
where u 0 = sin θ i λ . According to Equation (2), the optical vibration distribution in the grating plane is
U 1 ( x ) = ( r e c t ( x a ) e i 2 π ξ x m = 1 N δ ( x ( m 1 ) d ) ) e i 2 π u 0 x
According to Equation (8), the vibration distribution of diffracted light on the diffraction screen is
U ( u ) = c ( r e c t ( x a ) e i 2 π ξ x m = 1 N δ ( x ( m 1 ) d ) ) e i 2 π u 0 x
Equation (9) can be simplified to obtain
U ( u ) = c a sin c ( a ( u u 0 ξ ) ) ( sin π N ( u u 0 ) d sin π ( u u 0 ) d )
Therefore, the relative light intensity distribution can be calculated as
I ( u ) = I 0 sin c 2 ( a ( u u 0 ξ ) ) ( sin π N ( u u 0 ) d sin π ( u u 0 ) d ) 2
Equation (11) consists of diffraction factor sin c 2 ( a ( u u 0 ξ ) ) 2 and interference factor ( sin π N ( u u 0 ) d sin π ( u u 0 ) d ) . When the grating diffraction energy is maximized, both the interference factor and diffraction factor are required to be maximized. For the condition that the interference factor is a maximum value
u u 0 = m d
After substituting the grating parameters, we get
d ( sin θ m sin θ i ) = m λ
Equation (13) is the grating equation, which determines the position of each maximum. The condition for the maximum interference factor is u u 0 = ξ , the grating parameters are substituted to obtain
sin θ m sin θ i = tan α ( cos θ i + cos θ m )
After the triangular operation of the above equation, it can be obtained that
θ m = θ i + 2 α
According to Equation (15), the conditions for the maximum value of grating diffraction can be obtained, as shown in Figure 2. It can be observed that the condition is that the diffraction light is the strongest when the incident light and the diffraction light are reflected relative to the blazed mirror.
Equation (11) is applied to solve the diffraction spectrum distribution of the ideal grating. The grating parameters are shown in Table 1.
The relative intensity distribution (RID) of the diffracted light can be solved, as shown in Figure 3.
According to Figure 3, it can be observed that the diffraction grating has five levels of −3, −2, −1, 0, and 1. Among them, level 0 is just eliminated due to the superposition of the maximal value of the interference factor and the minimal value of the diffraction factor.

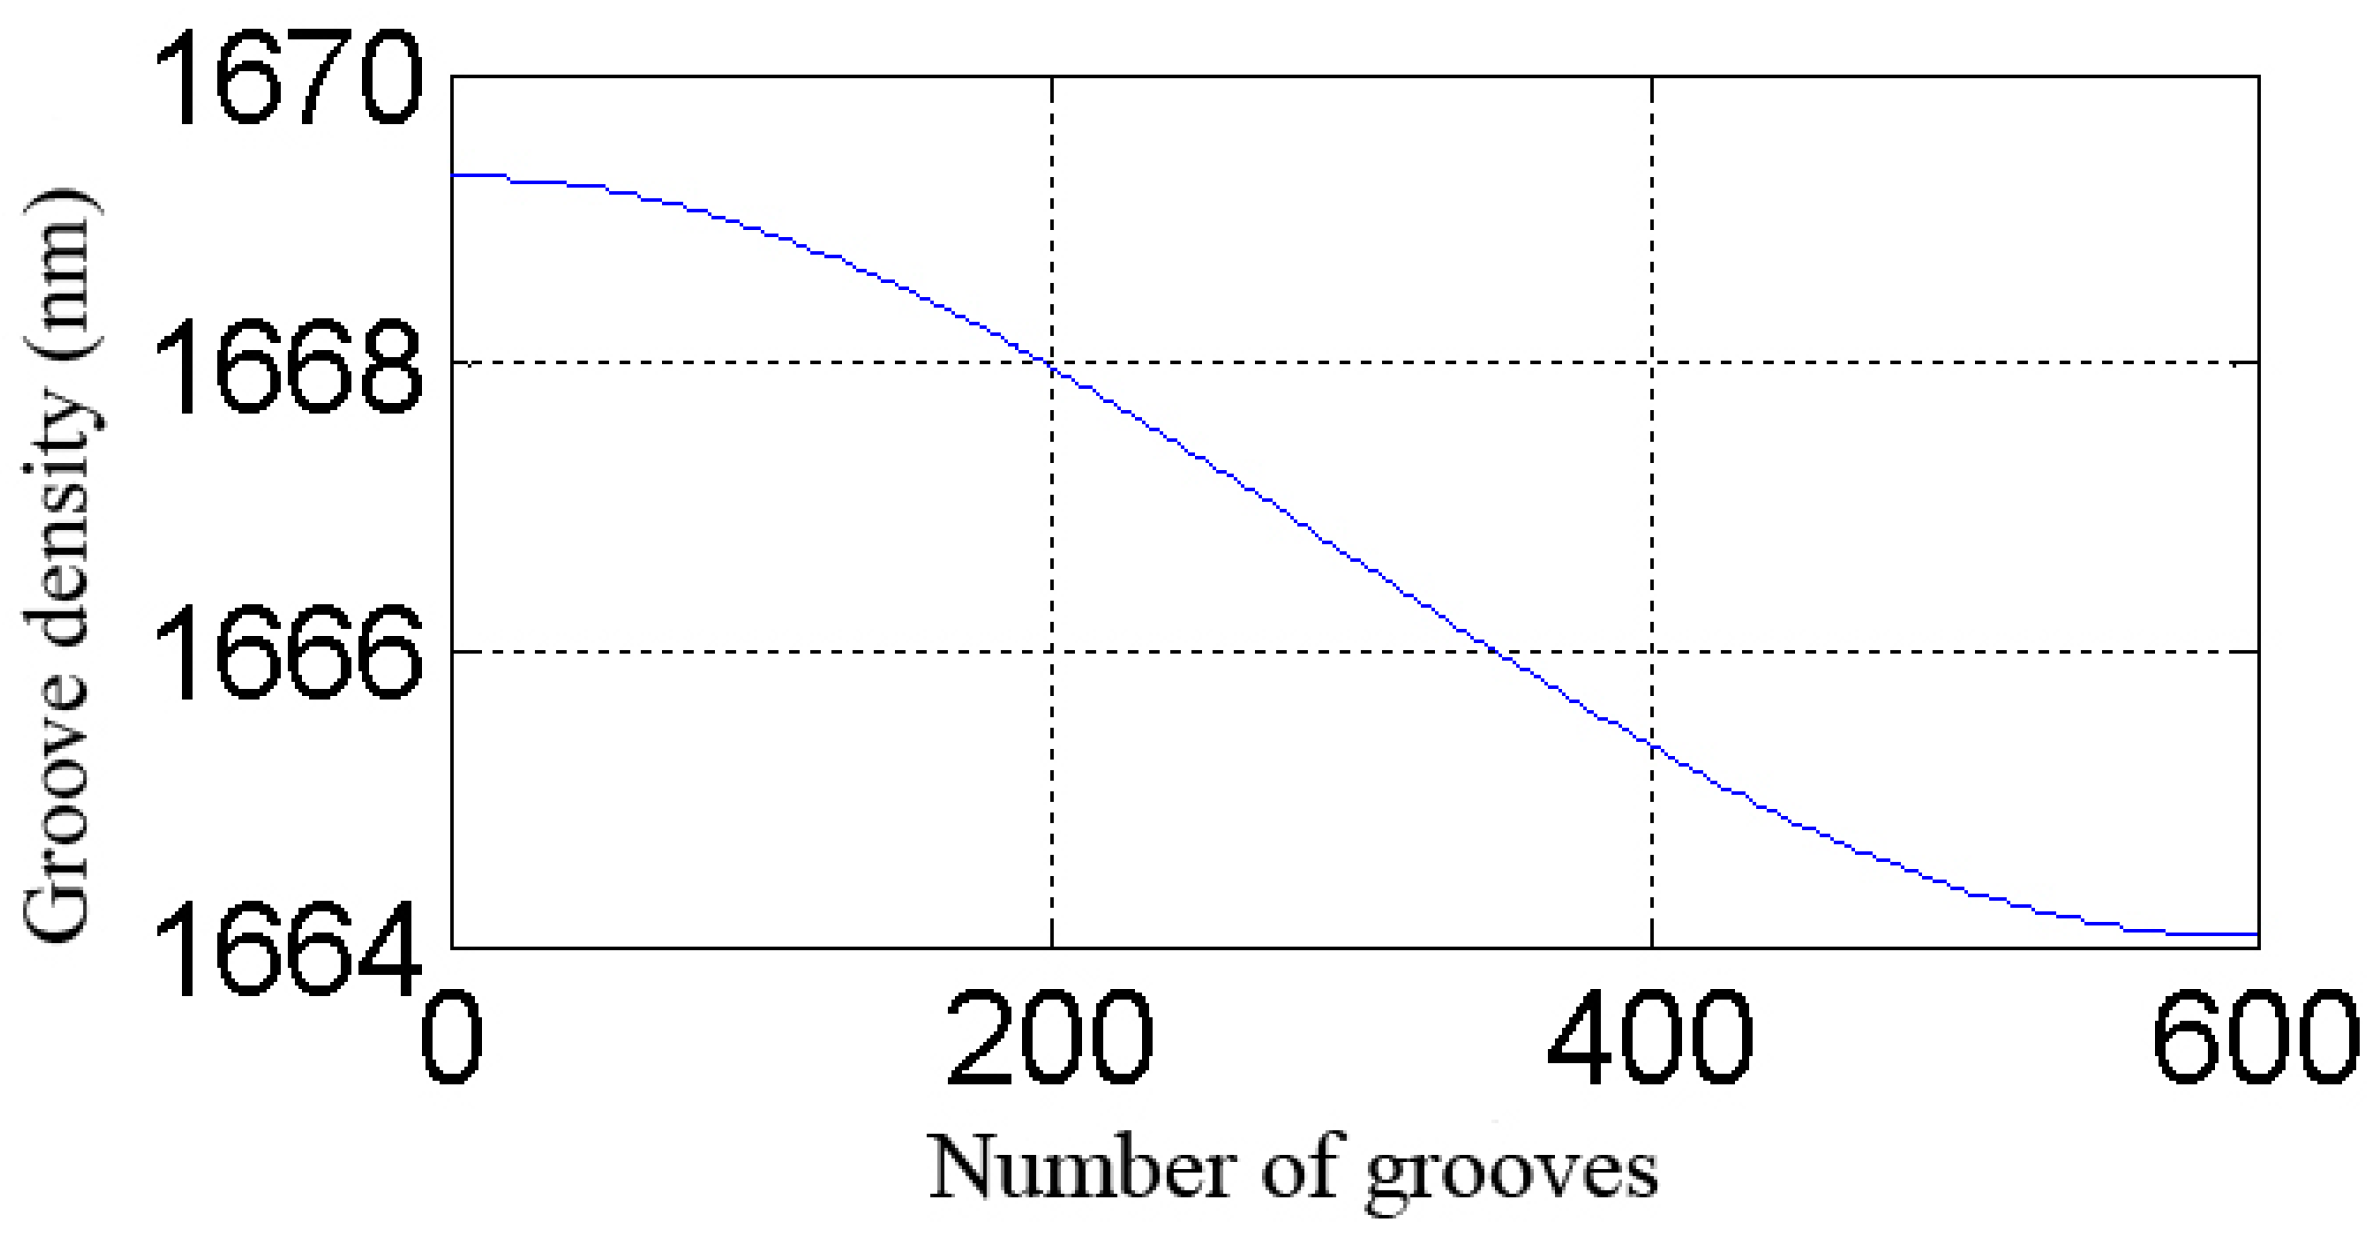
2.2. The Impact of Periodic Grooving Errors on Grating Performance Indicators

For any ghost line type diffraction grating, as shown in Figure 4, assume that k grooves constitute one ghost line period. In a period, the grating groove spacing distribution is d 1 , d 2 , , d k , then the grating constant corresponding to the ghost line period is
D = j = 1 K d ( j )
According to Figure 4, the groove transmission function within the late unit ghost line can be written as
r ( x ) = i = 1 k r e c t ( x ( j = 1 i 1 d ( j ) + d i 2 ) d i ) e i 2 π ξ ( x j = 1 i 1 d ( j ) )
Substituting Equation (17) into Equation (10), we can solve for the complex amplitude distribution function for N ghost line periods after simplification as
U ( u ) = c i = 1 k ( d i e i 2 π ξ j = 1 i 1 ( d j ) e i 2 π ( j = 1 i 1 ( d j ) + d i 2 ) ( u u 0 ξ ) sin c ( d i ( u u 0 ξ ) ) ) sin π N ( u u 0 ) D sin π ( u u 0 ) D
The above equation consists of the phase expansion factor d i e i 2 π ξ j = 1 i 1 ( d j ) e i 2 π ( j = 1 i 1 ( d j ) + d i 2 ) ( u u 0 ξ ) , diffraction factor sin c ( d i ( u u 0 ξ ) ) and interference factor sin π N ( u u 0 ) D sin π ( u u 0 ) D of the sub-groove function, which is different from the ideal grating, and the phase expansion factor of the sub-groove function will determine the location and intensity of the ghost line distribution. Based on Equation (18), the light intensity distribution function can be solved as
I ( u ) = | c i = 1 k ( d i e i 2 π ξ j = 1 i 1 ( d j ) e i 2 π ( j = 1 i 1 ( d j ) + d i 2 ) ( u u 0 ξ ) sin c ( d i ( u u 0 ξ ) ) ) sin π N ( u u 0 ) D sin π ( u u 0 ) D | 2
Equation (19) is applied to solve the diffraction spectrum distribution of the grating with ghost lines. The grating parameters are shown in Table 2.
The relative intensity distribution of the diffracted light is plotted as shown in Figure 5.
According to Figure 5, it can be observed that there are five levels of this diffraction grating: −3, −2, −1, 0, and 1. Due to the presence of ghost lines in the middle of the two levels, the 0 level, which originally had no light, also has a light intensity distribution due to the phase expansion factor of the grating sub-groove function. The existence of ghost lines seriously affects the normal use of diffraction gratings and needs to be eliminated in the ruling process.

2.3. Effect of Screw Error on Grating Spectral Performance

For the grating ruling machine, the screw and worm gear machining error, and the random error of the grating ruling process directly affects the spectral performance of the ruling grating.

2.3.1. Influence of Lead Screw Error on Grating Performance

Assuming that the lead of the lead screw is 1 mm, the error period is 1 mm, and according to the sine function distribution, the amplitude limit is 500 nm. For gratings in Table 1, the period error distribution function of the groove is shown in Figure 6.
According to Equation (19) and based on MathWorks MATLAB R2019b for Linux (MathWorks, Natick, MA, USA) software, the diffracted light distribution can be calculated, as shown in Figure 7.
It can be observed from Figure 7 that the periodic error of the screw does not produce obvious ghost lines, but only enhances the stray background of the diffracted light distribution. Therefore, the screw error is one of the causes of the grating stray light.

2.3.2. Effect of Worm Gear Error on Grating Spectral Performance

For the grating ruling machines, the worm gear error will also affect the ruling accuracy of the grating. In order to analyze the influence of the worm gear error on the ruling quality of the grating, we assume an error for the worm gear, as shown in Figure 8, and then according to Equation (19), the grating diffraction spectrum distribution with the worm gear error can be obtained, as shown in Figure 9.
The calculation yields the diffracted light distribution, as shown in Figure 9. From this figure, it can be observed that there are two ghost lines of unequal intensity in the two main diffraction levels, and the ghost line distribution form and the grating line error form are consistent, so it can be concluded that the worm gear error is an important reason for the appearance of ghost lines in the machine ruling grating. The development of the grating ruling machine should pay special attention to the processing accuracy of the worm gear and error distribution cycle to avoid the generation of ghost lines affecting the quality of the grating ruling.

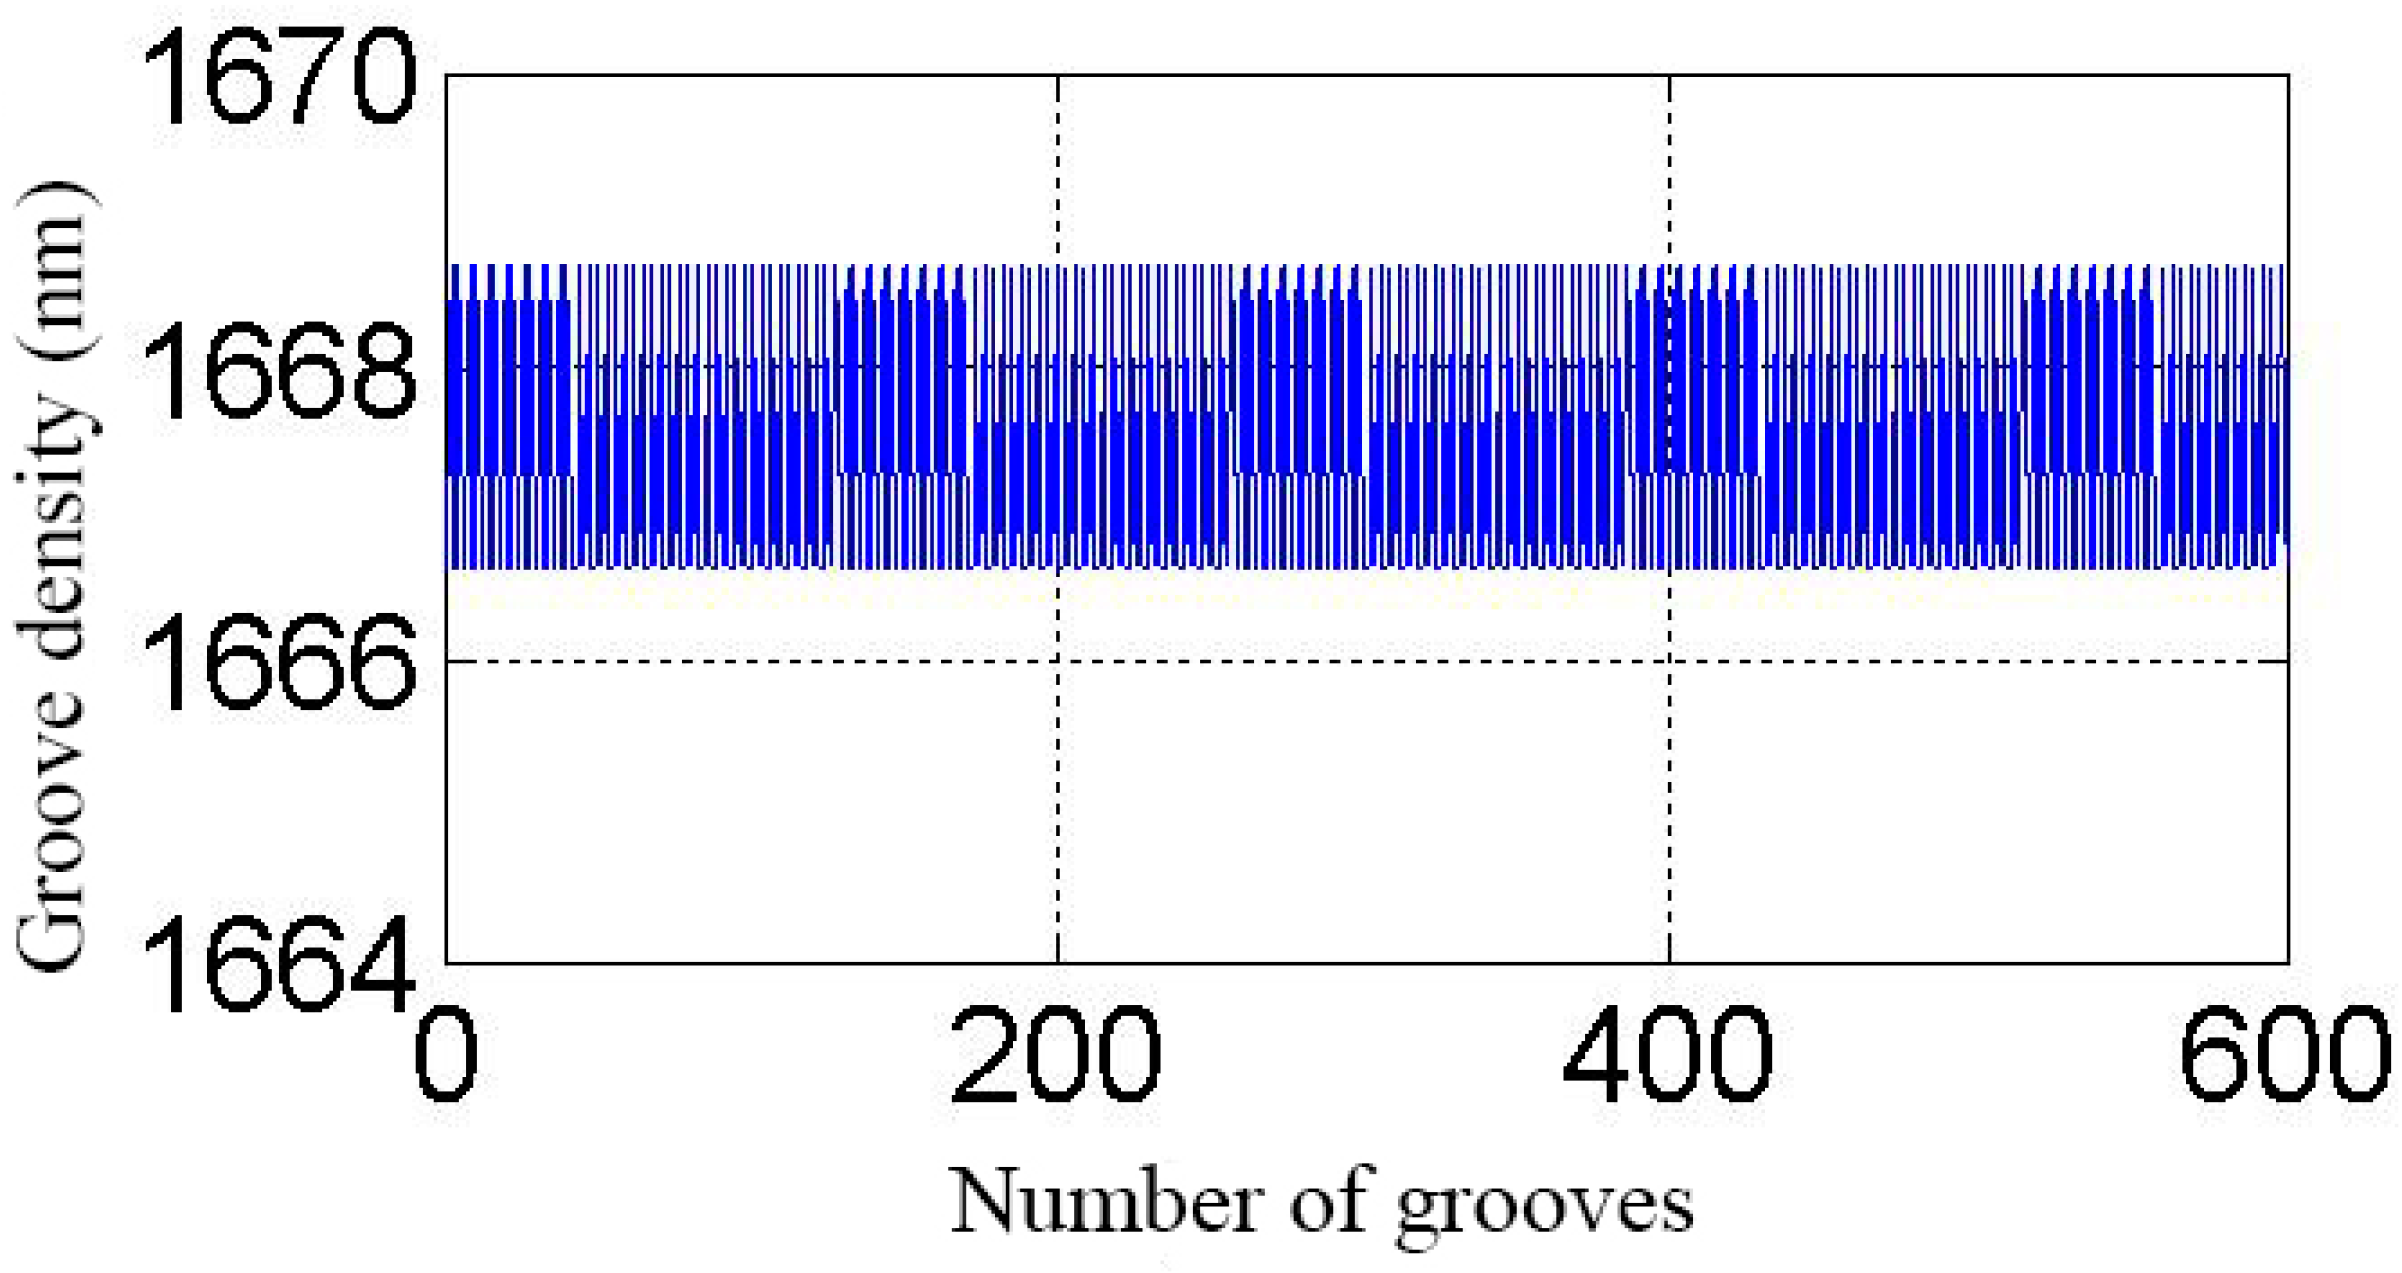
2.3.3. The Random Grooving Error on Spectral Performance

Assuming that the distribution of the grating groove is: d 1 , d 2 , , d k , based on Equation (10), can be obtained from the complex amplitude distribution function is
U ( u ) = c i = 1 m ( d i e i 2 π ξ j = 1 i 1 ( d j ) e i 2 π ( j = 1 i 1 ( d j ) + d i 2 ) ( u u 0 ξ ) sin c ( d i ( u u 0 ξ ) ) )
Compared with Equation (18), it can be observed that there is no interference factor in the complex amplitude distribution of random groove error, and the position of each maximum is determined by the phase expansion factor ( d i e i 2 π ξ j = 1 i 1 ( d j ) e i 2 π ( j = 1 i 1 ( d j ) + d i 2 ) ( u u 0 ξ ) sin c ( d i ( u u 0 ξ ) ) ) and diffraction factor sin c ( d i ( u u 0 ξ ) ) . According to Equation (20), the light intensity distribution function is
I ( u ) = | c i = 1 m ( d i e i 2 π ξ j = 1 i 1 ( d j ) e i 2 π ( j = 1 i 1 ( d j ) + d i 2 ) ( u u 0 ξ ) sin c ( d i ( u u 0 ξ ) ) ) | 2
The diffraction spectrum distribution of grating with random error is solved by Equation (21). The grating parameters are shown in Table 3.
The relative intensity distribution of the diffracted light is plotted as shown in Figure 10.
According to Figure 10, it can be observed that the diffraction grating still has five levels of −3, −2, −1, 0, and 1, but the stray light background is significantly enhanced between the levels. Therefore, the random groove error has a large impact on the stray light of the ruled grating.

3. Grating-Groove Error Correction
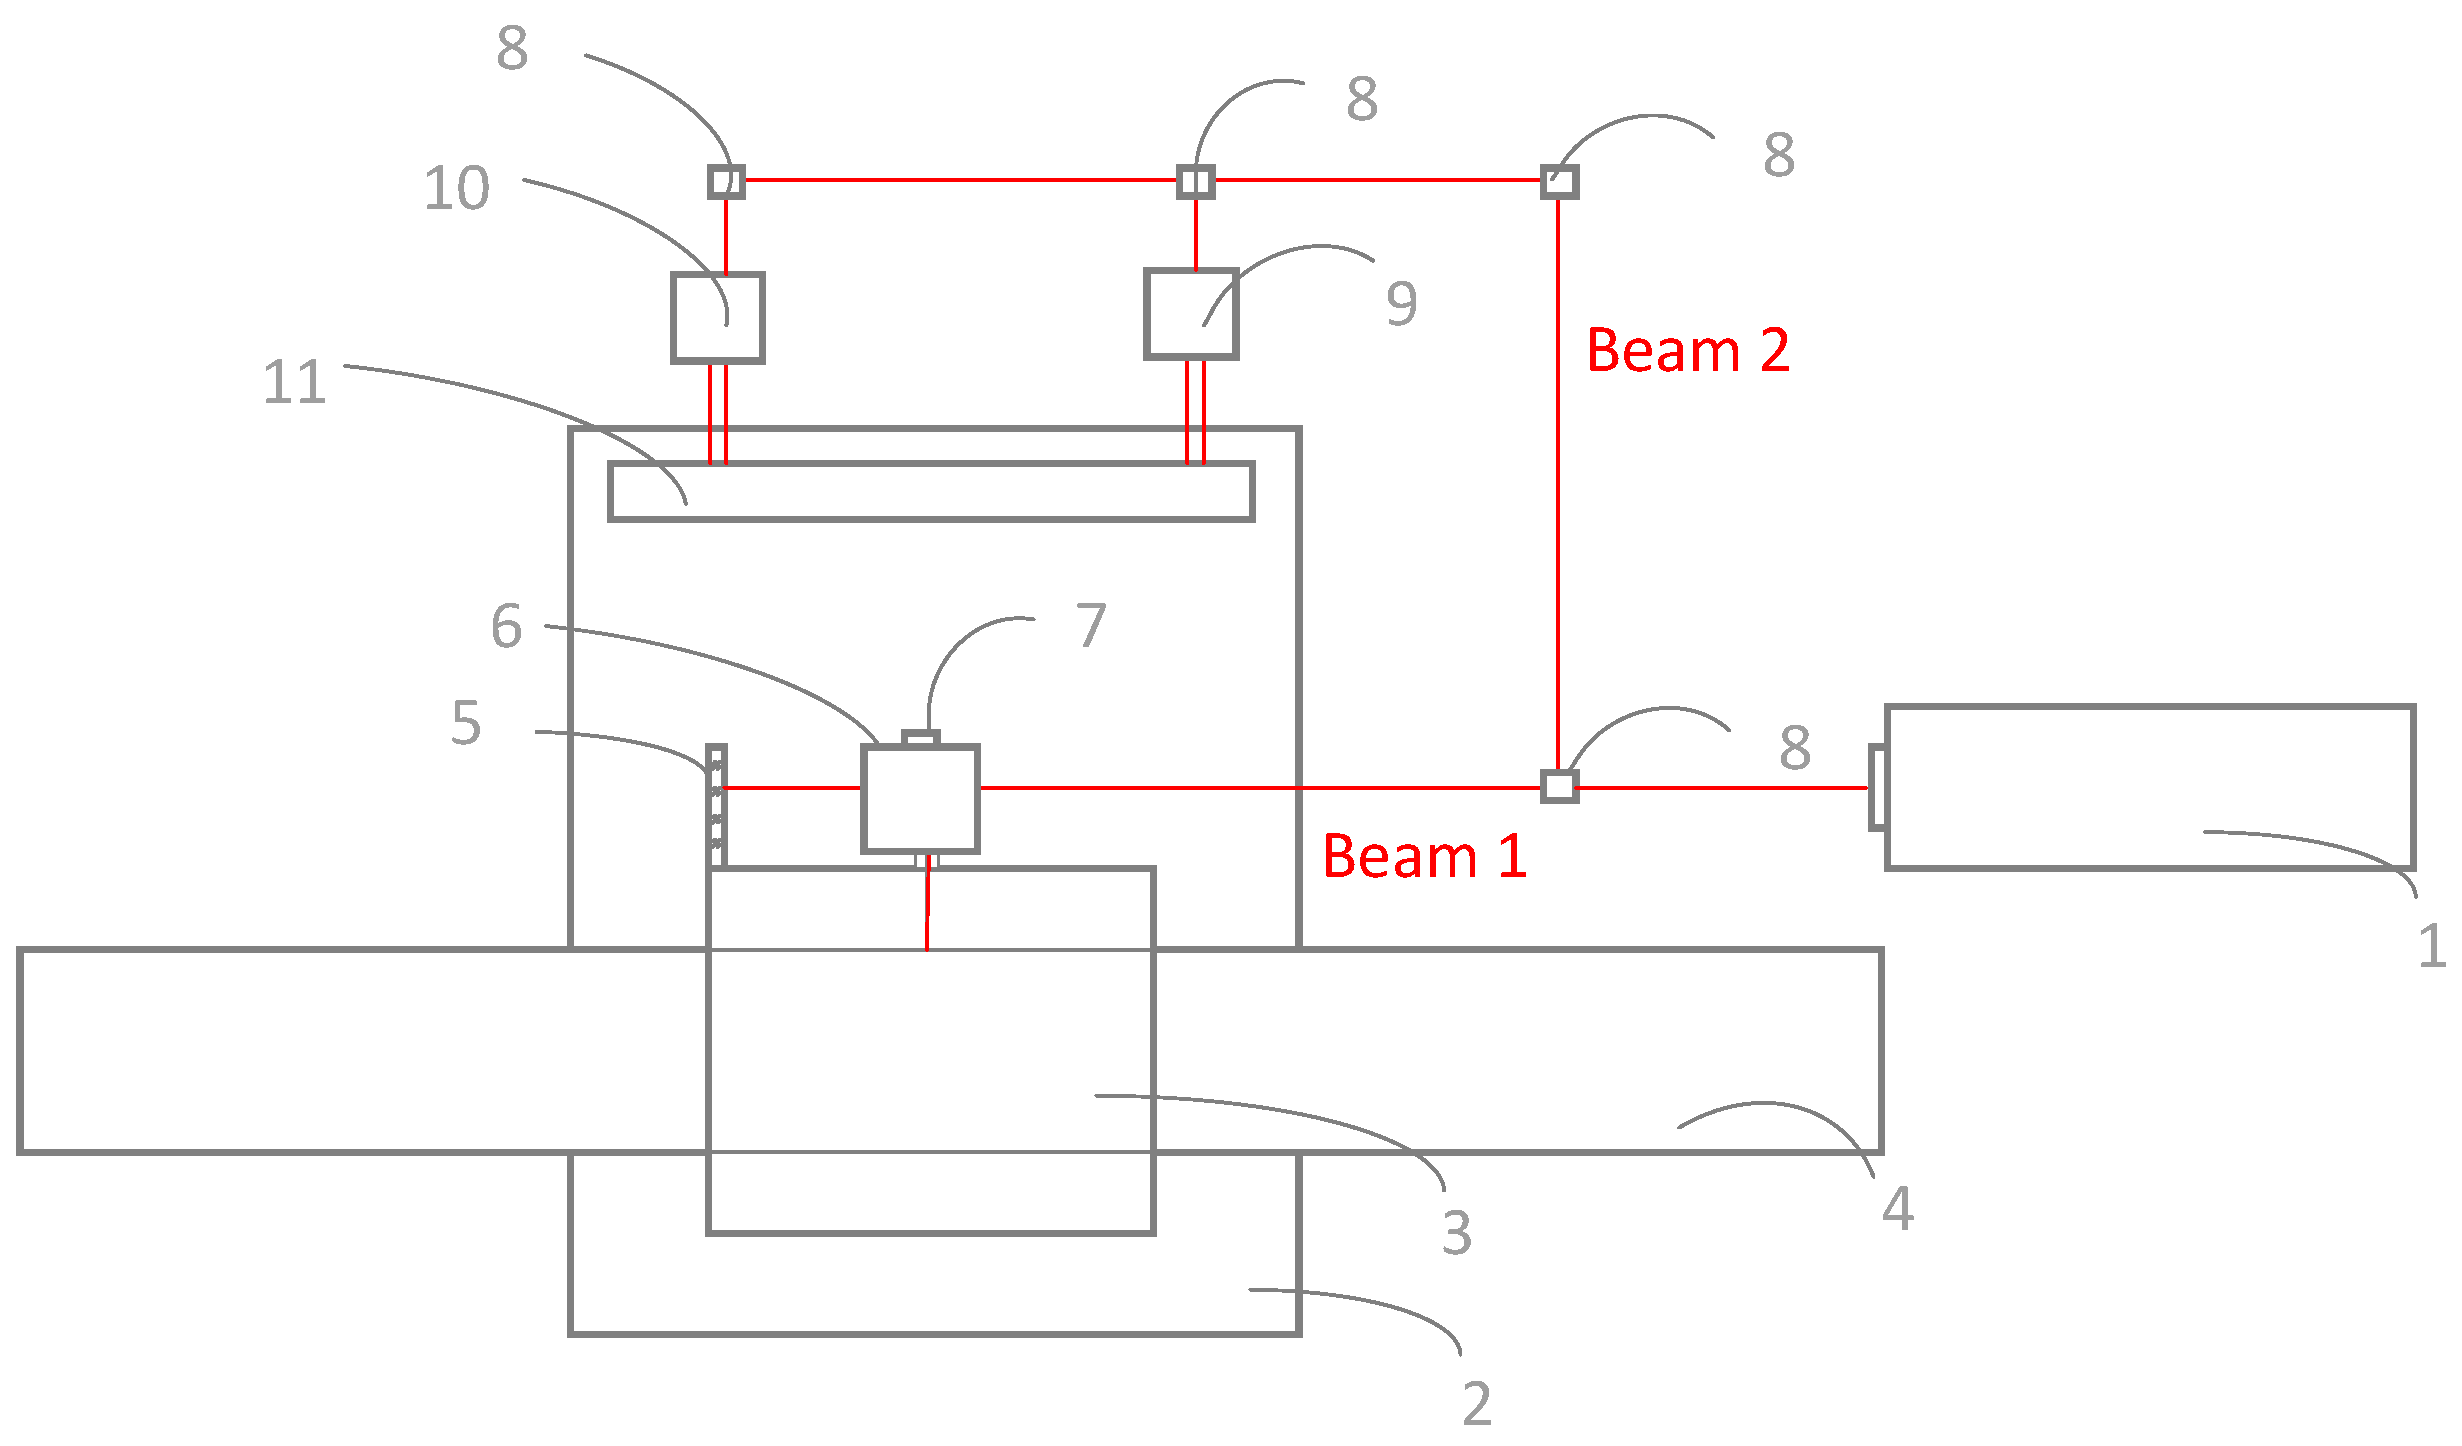
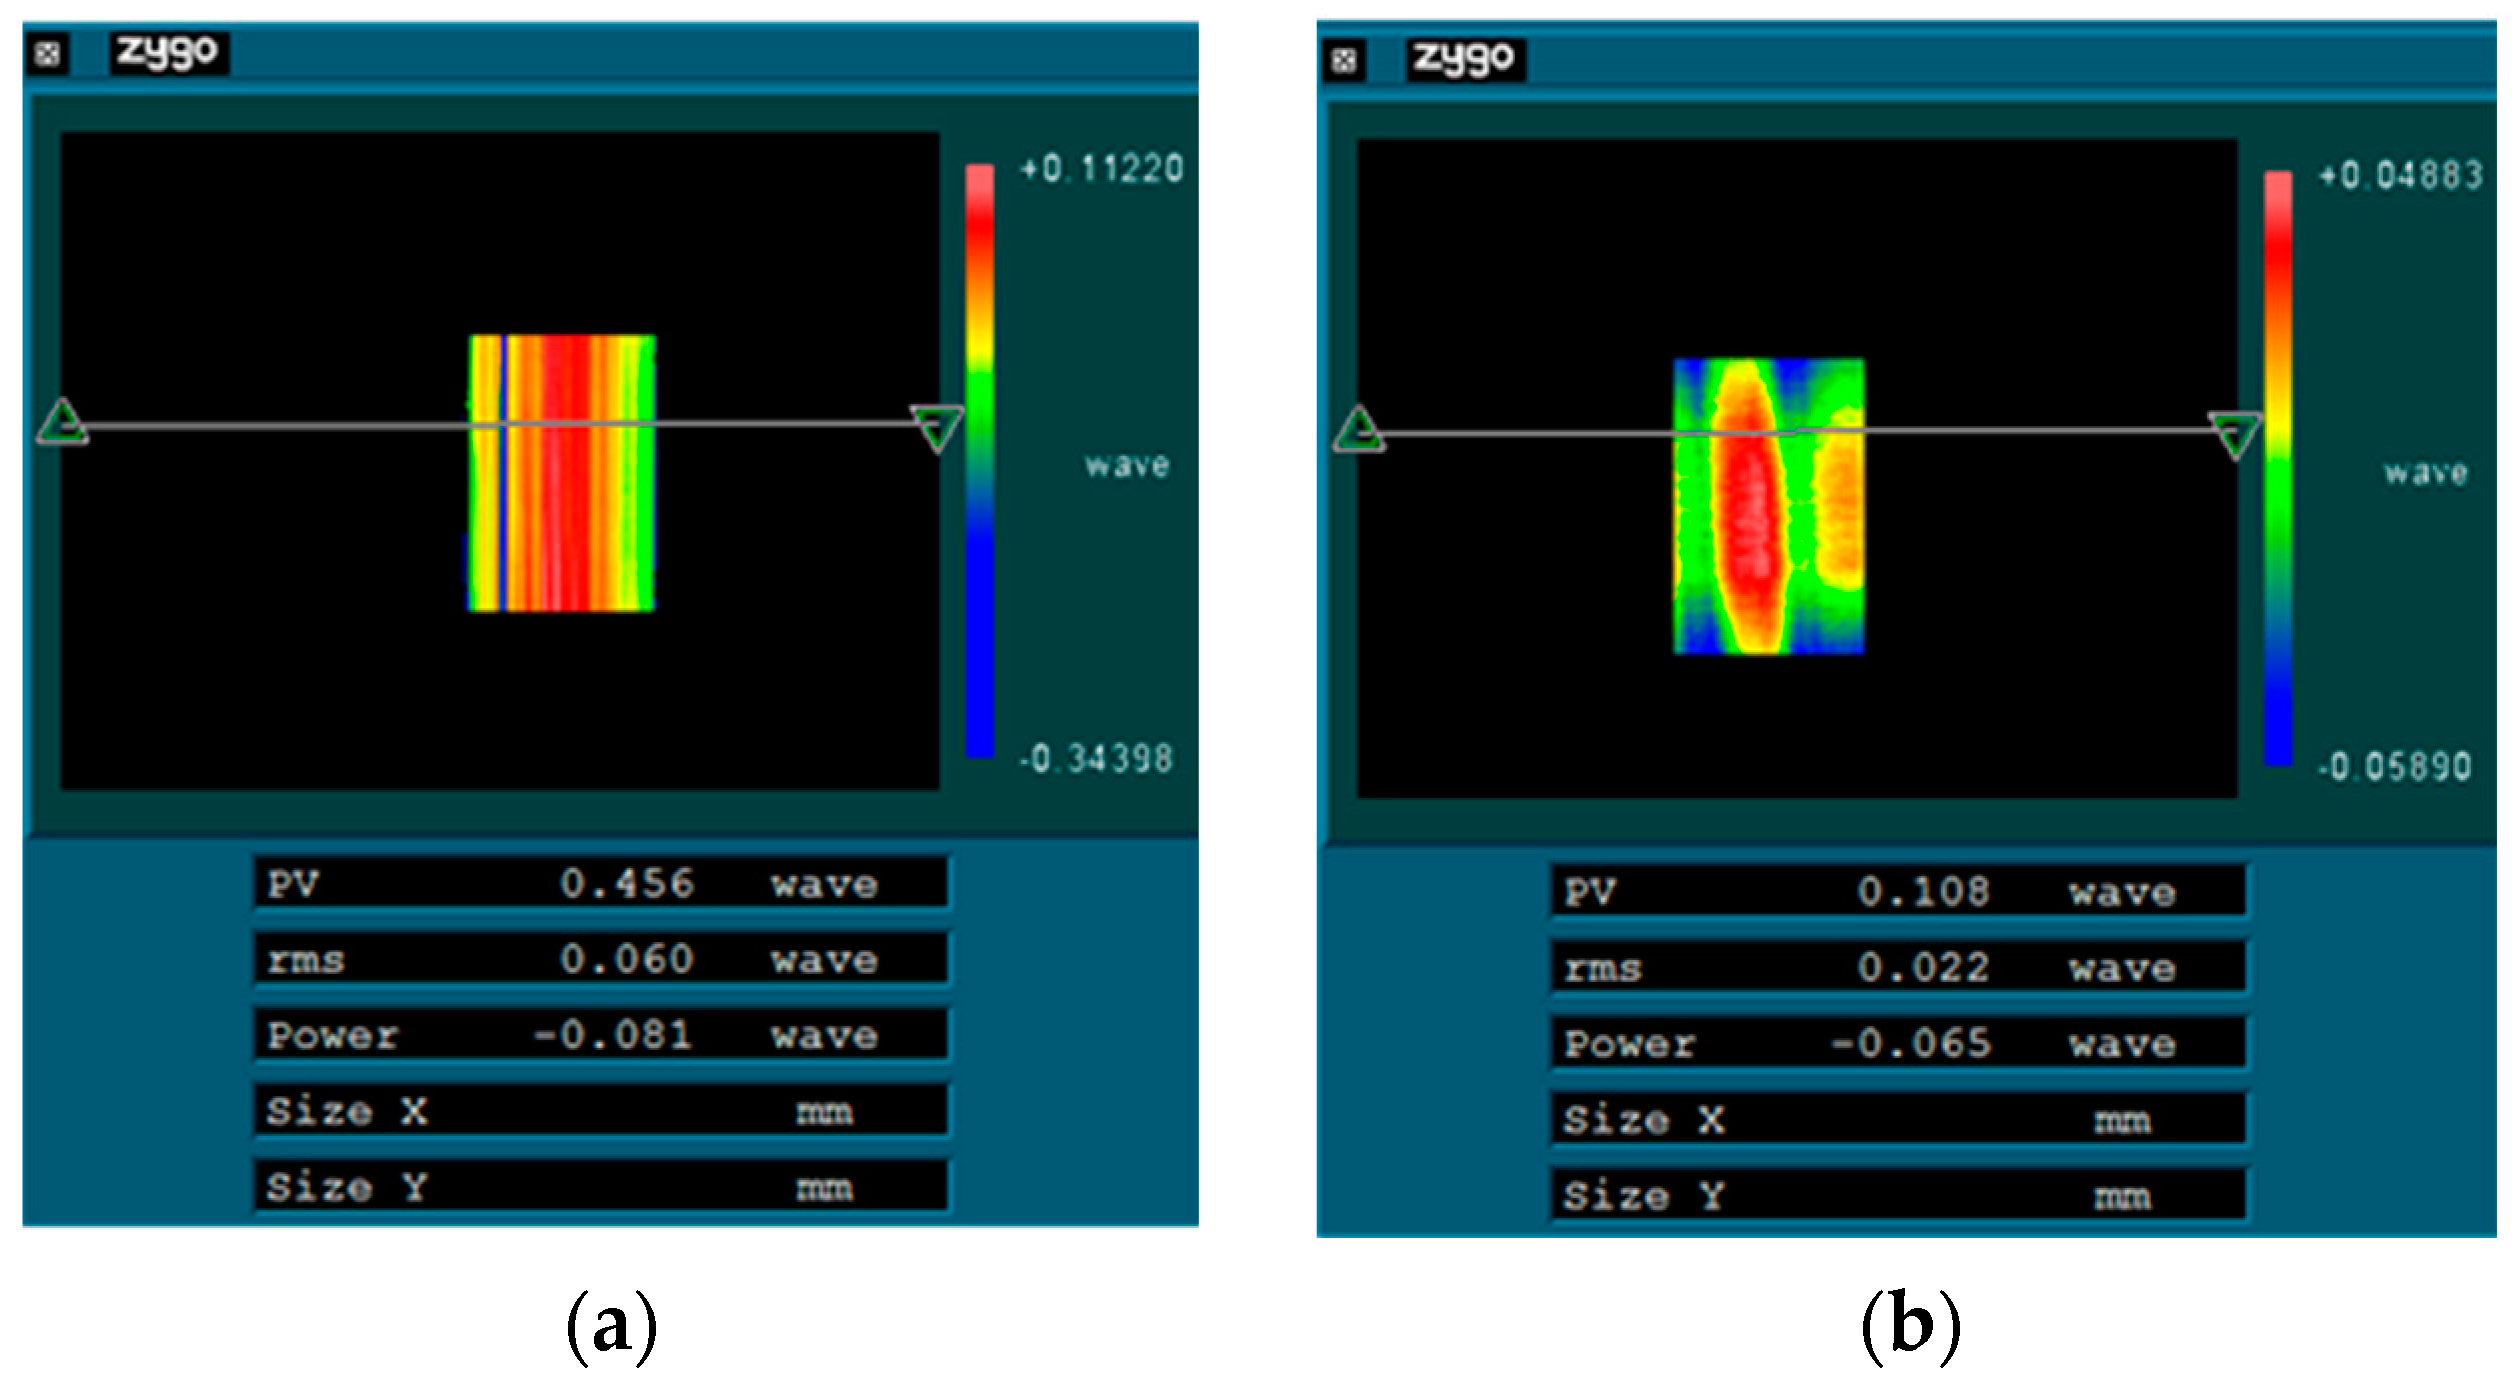
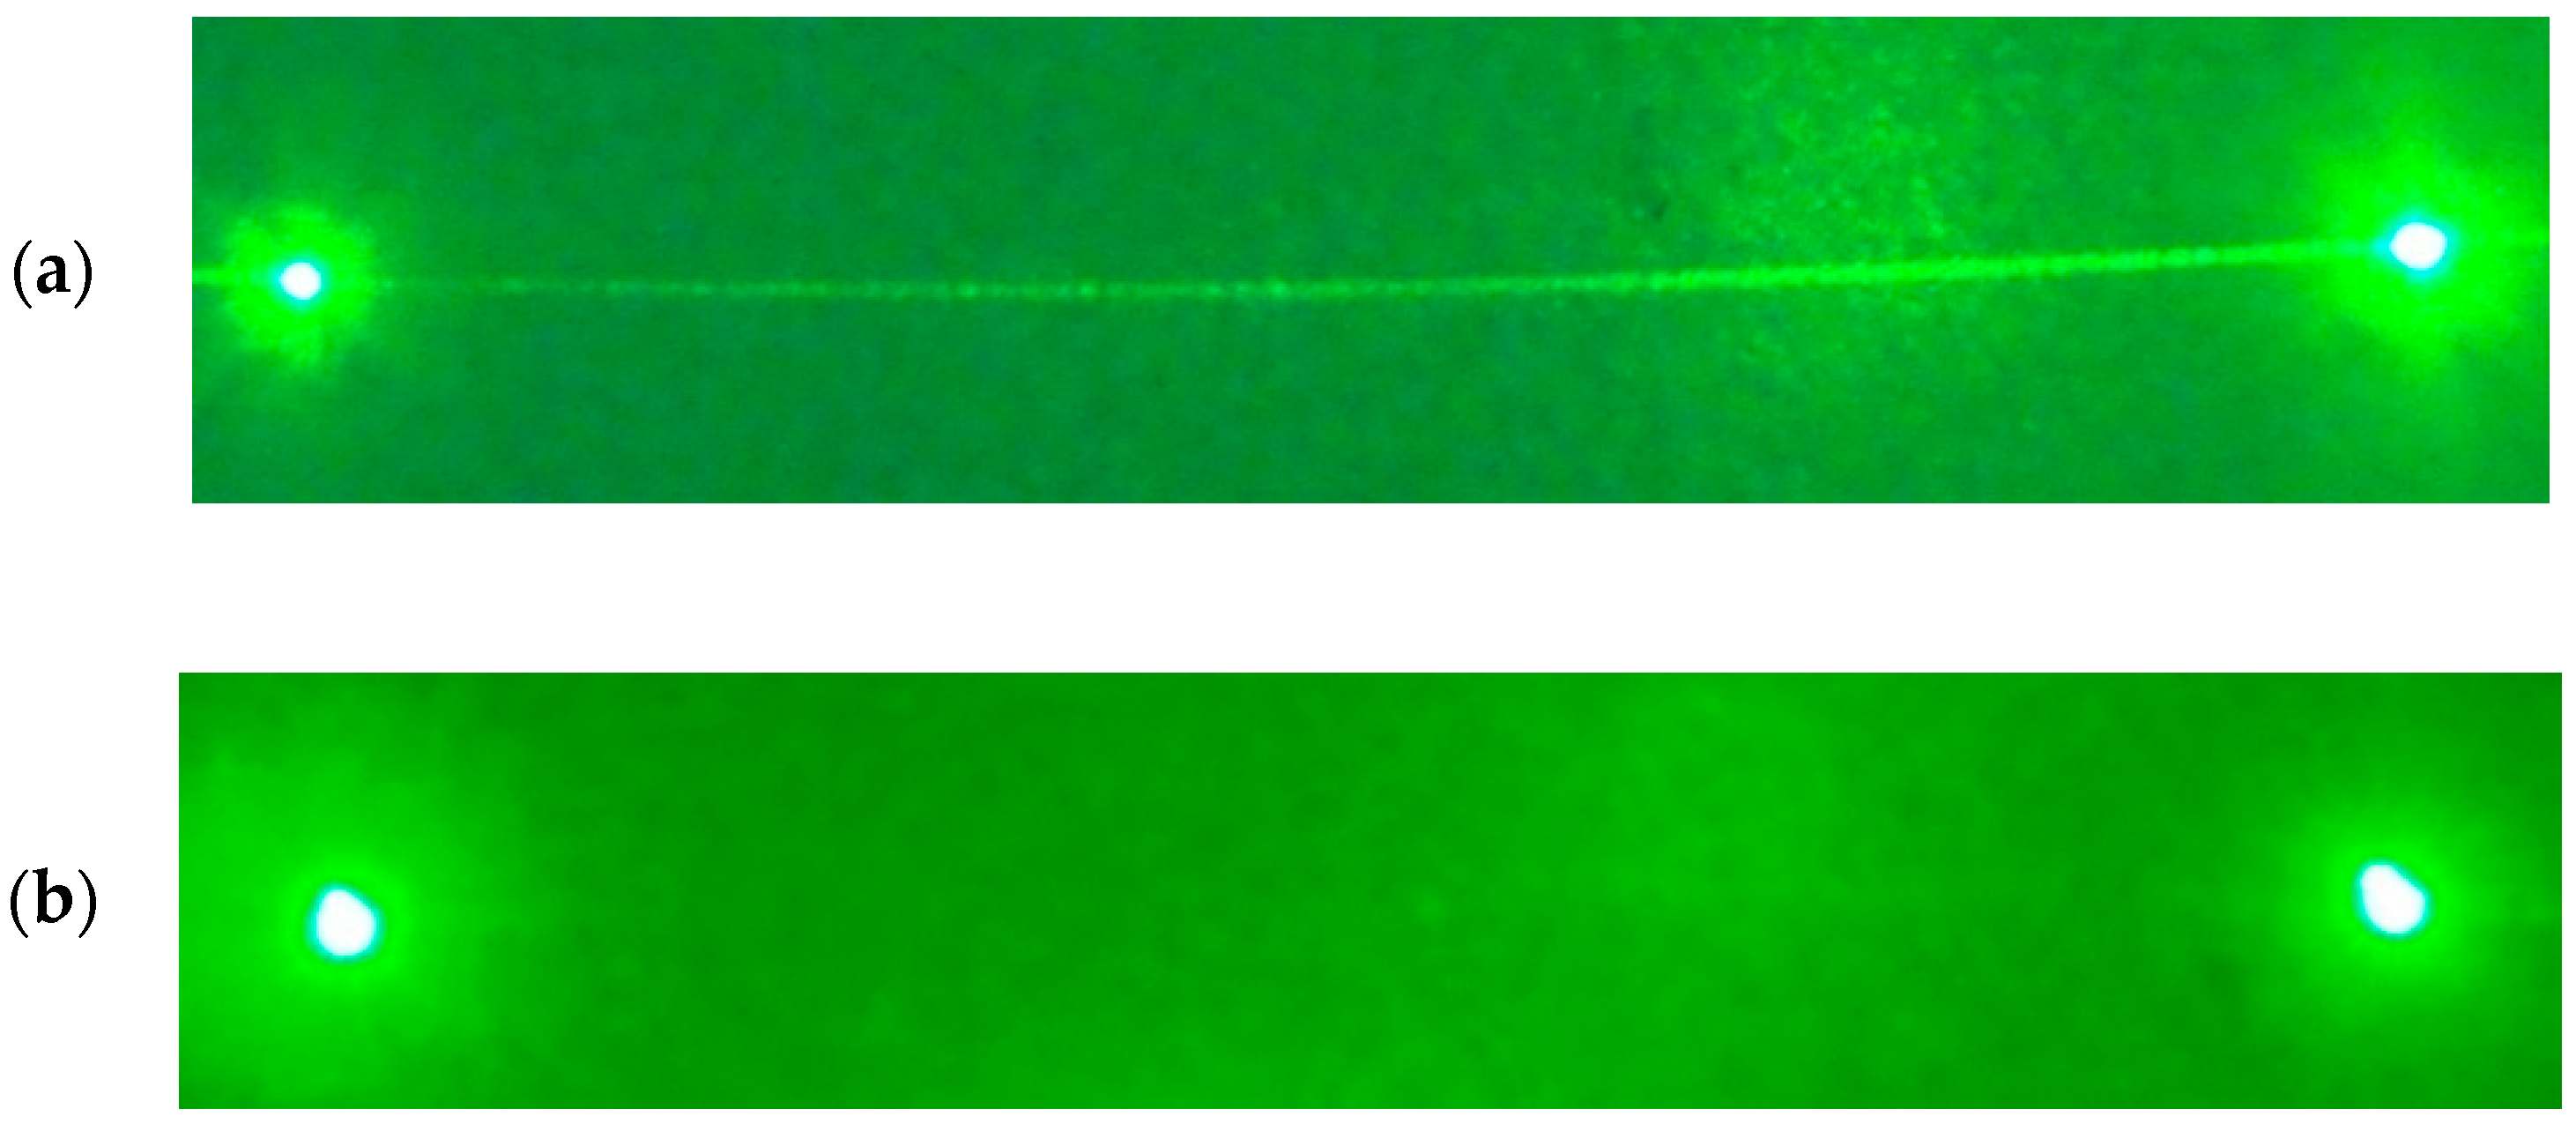
Based on the above analysis results, the main factors affecting the grating spectral performance index are the grating ruling machine itself, worm gear error, screw error, and the random error generated during the grating movement.
In order to eliminate the ghost lines and stray light errors that affect the grating performance index during the grating ruling process, the research group further developed the worm gear vice, as shown in Figure 11. The worm gear we selected reached the international Grade 3 manufacturing accuracy. In the 750 mm stroke range, the cumulative error of the selected screw and nut does not exceed 4 μm, and the pitch period error does not exceed 0.2 μm, as shown in Figure 12. At the same time, the active control system is used to control the grating groove error, to improve the performance index of the ruled grating.
The active control system of the grating ruling machine, as shown in Figure 13, the device mainly consists of a blank bearing seat, an interferometer, a piezoelectric ceramic lifting tool (z-axis), a reference mirror, and a piezoelectric ceramic control tool (x-axis).
We built a random error measurement optical path, as shown in Figure 14. The light emitted by the laser passes through the beam splitter 8. One beam is used as beam 1 to measure the random error caused by the ruling system, and the other beam is used as beam 2 to measure the random error caused by the indexing system [25].
In optical path 1, one beam, f1, is incident on the reference glass 5 as the reference light, and the other beam, f2, is incident on the quartz guide 4 as the measurement beam to measure the ruling error caused by the change of the quartz guide face shape and the saddle slider pitch and twist error. Since the measurement mirror is a quartz guide, the reference surface of the quartz guide is not coated and its reflectivity is low. In order to get the highest contrast of the interference fringe after the reference light and the measurement light is coherent, the reference mirror is selected as a glass with a face shape accuracy better than λ/10, while the other side will be polished as gross glass to reduce the influence of the reflected light on the reference beam and improve the contrast of the interference fringe. In optical path 2, the spectroscope divides the optical path into two beams, which enter interferometer 9 and interferometer 10, respectively. During the movement of the ruling carriage, the quartz guide is bent by the lateral force of the saddle-type slider. The instability ruling system causes the distance of the ruling carriage mounting plate relative to the quartz guide to change, making the ruling system produces random errors. The measurement signal and the reference signal are processed, and the number of pulses N1 is calculated by the counter. At the same time, during the one-way feed motion of the grating ruling machine table, the number of pulses N2 is calculated by the counter after processing the measurement signal and reference signal due to the non-parallelism of the guide rail and the random error factor in the ruling process. Finally, the random error displacement L in the grating ruling process is calculated by Equation (22) as the random error correction amount.
L = λ 4 0 t ( Δ f 1 + Δ f 2 ) × d t = ( N 1 + N 2 ) λ 4

4. Experiment

In order to verify the correction effect after correction by the grating ruling system, we conducted two sets of grating ruling comparison experiments. Firstly, two 79 g/mm medium-step gratings were ruled, both with a ruling area of 800 mm × 90 mm. One of them was not compensated for the error, and the intensity of the grating ghost lines and stray light was measured to be 10−3 after the ruling, and the diffraction efficiency of the −36 diffraction order of the medium-step grating was less than 30% with a diffraction wavefront of 0.456 λ (λ = 632.8 nm), as shown in Figure 15a. The other grating was ruled with error compensation, the measured grating ghost line intensity was less than 10−5, and stray light intensity was less than 10−4. The diffraction efficiency of its −36 diffraction order was better than 50% with a diffraction wavefront of 0.108 λ, as shown in Figure 15b.
Next, two 600 g/mm conventional gratings were ruled, both with a ruling area of 40 mm × 25 mm. The stray light from the grating without error compensation forms bright lines between the two diffraction stages, as shown in Figure 16a, with a maximum stray light intensity above 10−3 and a diffraction efficiency of less than 70% for the −1 diffraction order grating. The stray light intensity of the error-compensated grating reaches the order of 10−5, and the diffraction efficiency of the −1 diffraction order grating is better than 80%. The diffraction wavefronts of the two gratings are shown in Figure 17. From Figure 17, the diffraction wavefront mass of the grating before and after error compensation is reduced from 0.207 λ to 0.101 λ (λ = 632.8 nm).
Through two groups of comparative experiments, it can be observed that the error sources affecting the spectral performance of the grating are corrected, and then the grating ruling experiment can be verified. The modified grating ruling machine can effectively improve the spectral performance of the grating after the ruling.

5. Conclusions

This thesis starts from the scalar theory of grating groove function, firstly describes the physical phenomenon of a light source by grating interference and diffraction, deduces the information of complex amplitude distribution and intensity distribution of illumination light source on diffraction screen under the action of a diffraction grating. Analyzes the influence on the grating performance of the screw error, worm gear error, and the random error which is generated by the ruling process. The results show that the error of worm gear makes the grating produce a ghost line and the screw error and random error are the main reasons for stray light in the grating. In this case, we chose worm gear and screw for a grating ruling machine, built the measuring optical path of the random error, and optimized the error compensation system. By the experiment of the grating ruling, the quality of grating has been obviously improved.

Author Contributions

Conceptualization, C.Y.; methodology, C.Y.; software, C.Y. and X.C.; writing—original draft preparation, C.Y. and X.C.; writing—review and editing, C.Y. and X.C.; funding acquisition, C.Y. All authors have read and agreed to the published version of the manuscript.

Funding

This research was funded by the National Natural Foundation of China, grant number 61905024.

Institutional Review Board Statement

Not applicable.

Informed Consent Statement

Not applicable.

Data Availability Statement

Not applicable.

Acknowledgments

The authors express their appreciation for the financial support of the National Natural Foundation of China, grant number 61905024. Our thanks go to the editors and reviewers for their efficient work.

Conflicts of Interest

The authors declare no conflict of interest.

Definition

ZDistance between grating and diffraction screen
UOptical vibration distribution function
ϕGrating groove phase function
rGrating groove transmission function
eLight source illumination function
tDiffraction hole transmission function
IOptical-intensity distributed-function
DGrating constant
aEffective reflector width of grating groove
θ i Incident angle
θ m Diffraction angle
αBlaze angle
mDiffraction order
N Number of grating grooves
d Grating groove spacing
m Grating diffraction order
λ Blaze wavelength

References

  1. Bao, G.; Li, P. Diffraction Grating Theory. In Maxwell’s Equations in Periodic Structures; Springer: Berlin/Heidelberg, Germany, 2022. [Google Scholar]
  2. Chen, Z.; Özbek, A.; Rebling, J.; Zhou, Q.; Deán-Ben, X.L.; Razansky, D. Multifocal structured illumination optoacoustic microscopy. Light Sci. Appl. 2020, 9, 1473–1481. [Google Scholar] [CrossRef] [PubMed]
  3. Xu, C.; Zhao, Y.; Zeng, L. Low-stray-light gratings fabricated with scanning exposure method based on Lloyd’s mirror for a high-contrast near-eye display in augmented reality. Appl. Opt. 2022, 61, 5626–5632. [Google Scholar] [CrossRef]
  4. Zhai, Z.; Cao, Q.; Gao, T.; Liu, D.; Lv, Q.; Wang, Q.; Xiong, Z.; Feng, W. Beam shaping with high energy utilization and uniformity using gradient orthogonal gratings. Appl. Opt. 2021, 60, 5104–5109. [Google Scholar] [CrossRef] [PubMed]
  5. Fernández-Ruiz, M.R.; Carballar, A. Fiber Bragg Grating-Based Optical Signal Processing: Review and Survey. Appl. Sci. 2021, 11, 8189. [Google Scholar] [CrossRef]
  6. Li, Y.-L.; Wang, D.; Chu, F.; Lee, S.-D.; Zheng, Y.-W.; Wang, Q.-H. Tunable liquid crystal grating based holographic 3D display system with wide viewing angle and large size. Light Sci. Appl. 2022, 11, 188. [Google Scholar] [CrossRef]
  7. Zhang, B.; Wang, Q.; Shen, N.; Ding, H. Experimental investigation and numerical analysis of mechanical ruling for an Aluminum-Coated Diffraction Grating. J. Manuf. Sci. Eng. 2017, 139, 021003. [Google Scholar] [CrossRef]
  8. Pan, Q.; Chen, X.; Zhou, J.; Zhao, Z.; Shen, Q. Design and measurement of convex grating in conical diffraction Offner spectrometer. Opt. Eng. 2019, 58, 025109. [Google Scholar] [CrossRef]
  9. Gao, J.; Chen, P.; Wu, L.; Yu, B.; Qian, L. A review on fabrication of blazed gratings. J. Phys. D Appl. Phys. 2021, 54, 313001. [Google Scholar] [CrossRef]
  10. Liu, X.-Q.; Cheng, R.; Zheng, J.-X.; Yang, S.-N.; Wang, B.-X.; Bai, B.-F.; Chen, Q.-D.; Sun, H.-B. Wear-resistant blazed gratings fabricated by etching-assisted femtosecond laser lithography. J. Lightwave Technol. 2021, 39, 4690–4694. [Google Scholar] [CrossRef]
  11. Heusinger, M.; Banasch, M.; Zeitner, U.D. Rowland ghost suppression in high efficiency spectrometer gratings fabricated by e-beam lithography. Opt. Express 2017, 25, 6182–6190. [Google Scholar] [CrossRef]
  12. Chen, H.-K.; Ni, Z.-J.; Huang, Y.-S.; Xu, B.-L.; Zhang, D.-W. Low-stray-light concave holographic gratings processed by combining the methods of photoresist hot-melting and oxygen-ion ashing. Appl. Opt. 2020, 59, 3942–3950. [Google Scholar] [CrossRef] [PubMed]
  13. Harrison, G.R. The Production of Diffraction Gratings I. Development of the Ruling Art. J. Opt. Soc. Am. 1949, 39, 413–426. [Google Scholar] [CrossRef]
  14. Harrison, G.R. Interferometric Control of Grating Ruling with Continuous Carriage Advance. J. Opt. Soc. Am. 1955, 45, 112–120. [Google Scholar] [CrossRef]
  15. Ding, W.; Huao, Y.; Zhang, D. Analysis of the ruling error requirements for echelle grating. Guangdian Gongcheng Opto-Electron. Eng. 2013, 40, 68–75. [Google Scholar]
  16. Li, X.; Qi, B. Influence and Revising Method of Machine-Ruling Grating Line′s Curve Error, Location Error on Plane Grating′ Performance. Chin. J. Lasers 2013, 40, 0308009. [Google Scholar]
  17. Mi, X.; Yu, H.; Yu, H.; Zhang, S.; Li, X.; Yao, X.; Qi, X.; Wan, Q. Correcting groove error in gratings ruled on a 500-mm ruling engine using interferometric control. Appl. Opt. 2017, 56, 5857–5864. [Google Scholar] [CrossRef]
  18. Yao, X.; Cui, J.; Yu, H.; Qi, X.; Mi, X.; Jiang, Y.; Wang, M.; Li, X. An improved accuracy-measuring method in manufacturing the lead screw of grating ruling engine. Precis. Eng. 2017, 49, 344–353. [Google Scholar] [CrossRef]
  19. Yu, H.; Li, X.; Zhu, J.; Yu, H.; Qi, X.; Feng, S. Reducing the line curvature error of mechanically ruled gratings by interferometric control. Appl. Phys. B 2014, 117, 279–286. [Google Scholar] [CrossRef]
  20. Cong, M.; Qi, X.; Mi, X.; Yu, H.; Li, X.; Lu, Y. Influence of incident light angles on mosaic grating errors in optical path for grating replication and mosaic. Opt. Precis. Eng. 2017, 25, 3027–3033. [Google Scholar] [CrossRef]
  21. Yang, G.; Qi, X.; Mi, X.; Zhang, S.; Yu, H.; Yu, H.; Li, X. Separation detection and correction of mosaic errors in mosaic gratings based on two detection lights with the same diffraction order and different incident angles. Opt. Lasers Eng. 2020, 139, 106281. [Google Scholar] [CrossRef]
  22. Lu, Y.; Qi, X.; Mi, X.; Shan, J.; Yu, H.; Li, X.; Lu, Y. Detection and Calculation of Mosaic Grating Error Based on Wavefront Method. Acta Opt. Sin. 2016, 36, 0505001. [Google Scholar]
  23. Yang, C.; Yu, H.; Li, X. Real time monitoring technology for full aperture grating diffraction wavefront with high frequency error. Opt. Commun. 2019, 452, 428–433. [Google Scholar] [CrossRef]
  24. Yang, C.; Guo, J.; Yue, L. Error analysis of a ruled grating and mechanism optimization of a grating ruling machine. Appl. Opt. 2022, 61, 91–100. [Google Scholar] [CrossRef] [PubMed]
  25. Mi, X.; Zhang, S.; Qi, X.; Yu, H.; Yu, H.; Lin, Y.; Yao, X.; Jiang, S.; Zhou, J. Effect of the changes in refractive index of air on grating diffraction wavefront. Opt. Commun. 2020, 457, 124716. [Google Scholar] [CrossRef]
Figure 1. Diffraction grating groove shape and coordinates.
Applsci 12 10174 g001
Figure 2. Conditions for the maximum value of grating diffraction.
Applsci 12 10174 g002
Figure 3. The relative intensity distribution of diffracted light.
Applsci 12 10174 g003
Figure 4. Schematic diagram of the ghost line groove error model.
Applsci 12 10174 g004
Figure 5. The relative intensity distribution of diffracted light.
Applsci 12 10174 g005
Figure 6. The distribution function of the period of the unit ghost line in the groove.
Applsci 12 10174 g006
Figure 7. The relative intensity distribution of diffracted light.
Applsci 12 10174 g007
Figure 8. The distribution of grooving period error caused by the worm error with Amplitude of 2 nm and Period of 3 groove.
Applsci 12 10174 g008
Figure 9. The relative intensity distribution of diffracted light.
Applsci 12 10174 g009
Figure 10. The relative intensity distribution of diffracted light.
Applsci 12 10174 g010
Figure 11. The physical diagram of worm gear vice.
Applsci 12 10174 g011
Figure 12. Machining completed for the preferred screw.
Applsci 12 10174 g012
Figure 13. Structural Diagram of the active tool control system.
Applsci 12 10174 g013
Figure 14. Optical path diagram of measuring system. 1. Laser; 2. inner carriage; 3. slider; 4. quartz guide rail; 5. ground glass; 6. interferometer A; 7. tool system; 8. beam splitter; 9. interferometer B; 10. interferometer C; 11. measuring mirror.
Applsci 12 10174 g014
Figure 15. Wavefront comparison of 79 g/mm mid-step grating before and after error compensation: (a) no error compensation; (b) with error compensation.
Applsci 12 10174 g015
Figure 16. Physical view of stray light measurement of grating: (a) without error compensation; (b) with error compensation.
Applsci 12 10174 g016
Figure 17. Wavefront comparison of 600 g/mm conventional grating before and after error compensation: (a) no error compensation; (b) with error compensation.
Applsci 12 10174 g017
Table 1. Diffraction grating parameters.
Groove DensityWavelengthBlaze AngleBlaze LevelError Distribution
600 g/mm632.8 nm22°−2−10 nm, 10 nm, ⋯
Table 2. Diffraction grating parameters.
Groove DensityWavelengthBlaze AngleBlaze LevelError Distribution
600 g/mm632.8 nm22°−2−10 nm, 10 nm, ⋯
Table 3. Diffraction grating parameters.
Groove DensityWave LengthBlaze AngleBlaze LevelError Distribution
600 g/mm632.8 nm22°−2White noise, extreme values ± 10 nm
Publisher’s Note: MDPI stays neutral with regard to jurisdictional claims in published maps and institutional affiliations.

