1. Introduction
In this study, we analyzed the crack growth characteristics of rubber, which accounts for about 90% of the materials that constitute tires. Among these materials, the tire tread rubber of the tire tread comes into contact with the ground the most; thus, it is easily worn out. Throughout the years, research studies investigating the fracture behaviors and characteristics of rubber in different ways have been actively conducted, with researchers considering metals, such as aluminum, iron, and steel, and viscoelastic materials, such as plastic, rubber, and particle hardening composites. Several studies exploring the breaking energy of composite materials, such as natural rubber or tire rubbers, with viscoelastic properties, fracture mechanical properties, and crack resistance, have also been conducted.
Overseas, Rivlin et al. [
1] theoretically tested and revealed that the tearing energy of rubber varies depending on the size and location of the crack. However, when studying natural rubber, it is difficult to apply particle-reinforced composites, such as tire rubber, due to various variables and conditions. Schapery [
2,
3,
4] presented the theory of predicting the behavior of viscoelastic materials and the theory of initiation and growth of viscoelastic cracks as tests after their application to non-linear viscoelastic materials. The authors also compared the test results. Kakavas [
5] verified the mechanical properties of ammonium perchlorate by employing stress relief and creep tests. Bencher et al. [
6] analyzed the relationship between fracture toughness and crack propagation by conducting a fracture toughness test of a center-cracked sheet specimen based on changes in the temperature and test speed. Liu [
7,
8,
9] studied the strain distribution and growth behavior of the crack tip when a solid propellant with a crack received tensile force using linear fracture mechanics in fracture dynamics. A certain pattern was inserted into the cracked specimen to conduct a test, and changes in pattern movements were recorded and analyzed. The test results yielded the stress expansion coefficient and crack growth rate. In the crack progress test of the cracked specimen, it was found that the crack growth appeared repeatedly in stages. In addition, the deformation of surface energy was analyzed using X-rays.
In Korea, Kim Ho et al. [
10,
11] attempted to formulate tearing energy to predict the life of rubber materials by interpreting Rivlin’s test results through ABAQUS. However, the results presented were a comparison of the results analyzed through ABAQUS and theory, and there was no comparison or verification made with the actual test results. The following research on digital image correlation was actively performed. Na Sung-hyun et al. [
12,
13] analyzed the crack resistance characteristics of particle-strengthening composite propellants through a digital image correlation. A fracture toughness test using a wedge splitting test (WST) (a non-linear fracture behavior test) was carried out by assuming the particle-strengthening composite as a linear viscoelastic material. The results and the strain fields required for evaluating the crack resistance behavior were visualized by using the digital image correlation method. The test temperature attained ranged from 50 °C to −60 °C. In addition, a WST and a destructive energy evaluation of particle-strengthening composite materials were conducted. The effects of breaking energy, crack progression, and temperature on the crack tip opening displacement (CTOD) obtained from the WSTs were studied. The speed was 50 mm/min. The room temperature was 50 °C, and the other temperatures were −40 °C and −60 °C. The fracture energy was obtained from the split load-CMOD graph. It was found that the temperature increased with a decrease in temperature, and the strength at −60 °C increased due to the influence of the glass transition temperature, thus exhibiting brittle behavior. The strain field was analyzed using the digital image correlation method can be used to measure the displacement, deformation, and deformation rate of a structure by capturing images. Lee Jeong-won et al. [
14] conducted a study on the characteristics of the destruction energy and displacement field of a particle-strengthening composite material by the digital image correlation method. The fracture energy and displacement field characteristics of this material were analyzed. The fracture energy at each temperature was calculated by performing a WST under the room temperature condition, −40 °C, and −60 °C. The displacement field and strain field were studied by visualization through the digital image correlation method. The fracture energy decreased as the temperature decreased. The surface displacement field was similar at room temperature. However, at −40 °C and −60 °C, it was greatly reduced due to the brittle behavior. It was found that as the temperature decreased, the range of the strain field also decreased [
14]. Hong Sang-hyun et al. [
15] evaluated the destructive behavior of particle-strengthening composite materials using digital image correlation and performed a WST to evaluate its fracture behavior. To analyze crack resistance, both the CTOD and CTOA were used. The tests were performed under various temperature conditions, such as 60 °C, room temperature, −20 °C, −40 °C, and −60 °C, and three evaluation rates—5, 50, and 500 mm/min—were employed. In addition, the digital image correlation method was used to analyze the strain field for the crack tip. It was found that the fracture energy increased as the temperature decreased, and the crack resistance increased with an increase in load speed. Kim Wan-doo et al. [
16,
17,
18] conducted material testing and studied the properties of non-linear materials for the finite element analysis of rubber components.
The materials used in this study were carbon black, natural rubber, synthetic rubber, and rubber used in tire treads, with the addition of various rubber-based chemicals. The process could be defined as a type of rubber particle-hardening complex. The tire tread rubbers were the parts that had come into contact with the ground during their usage. The parts were always exposed to repeated deformation by rotation and external impacts. Thus, the tire treads could have cracked at any time. The types of cracks occurring in tires can be largely divided into two types: mechanical and chemical cracks. Mechanical cracks are thick and long and are mainly caused by strong external impacts, while chemical cracks are caused by conditions such as fluctuating temperatures, vehicle conditions, ultraviolet exposure, and aging. It is imperative to perform fracture mechanical experiments on crack growth following the cracking of tire rubber. The purpose of the experiment was to obtain the fracture mechanical properties of materials with different crack characteristics through the stress expansion coefficient and crack progress speed and analyze the effect of speed. Based on the results, the fracture dynamic parameters, crack growth characteristics, and fracture progress regions for each tire tread rubber can be analyzed to define the fracture dynamic characteristics for each material by speed.
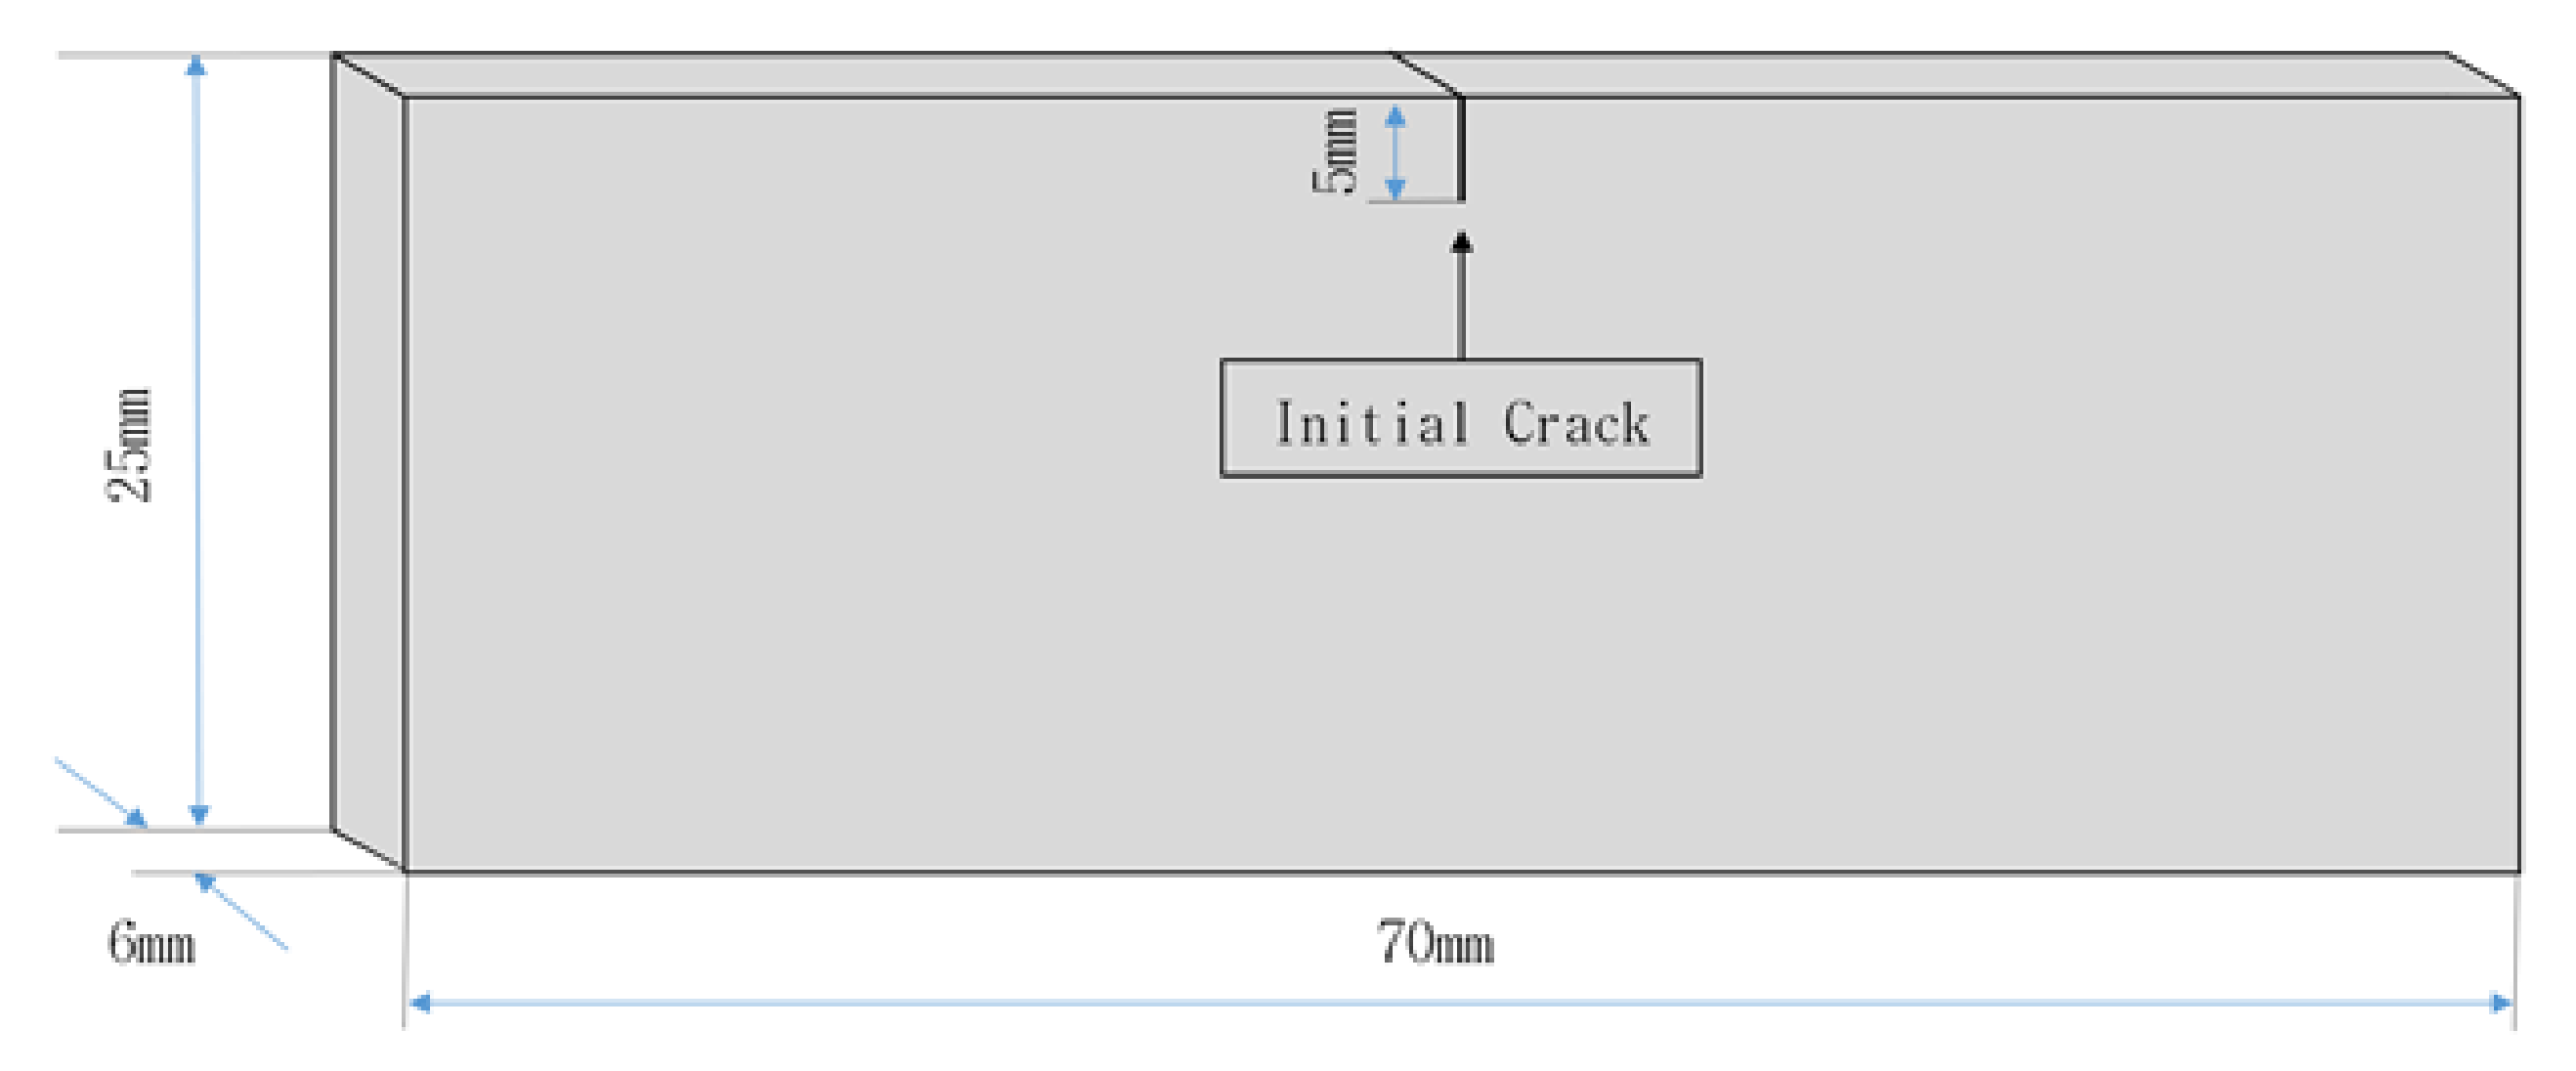
In this study, tensile test pieces with cracks were inserted into three types of rubber materials. The experimental results were analyzed through image analysis by capturing 1 cut per 100 ms of video using a camera to observe the deformation behavior of the specimen surface. Through these images, the crack front opening displacement, which is a fracture toughness parameter to simulate non-uniform crack progress (a characteristic of viscoelastic material), was measured, and the crack front opening angle was obtained based on this result. Further, the fracture progress region was analyzed by visualizing the strain field of the specimen surface through digital image correlation. These results are expected to be basic research to clarify the growth characteristics when cracks occur on the tread surface of finished tires.
2. Theoretical Background
2.1. Crack Tip Opening Displacement (CTOD) and Crack Tip Opening Angle (CTOA)
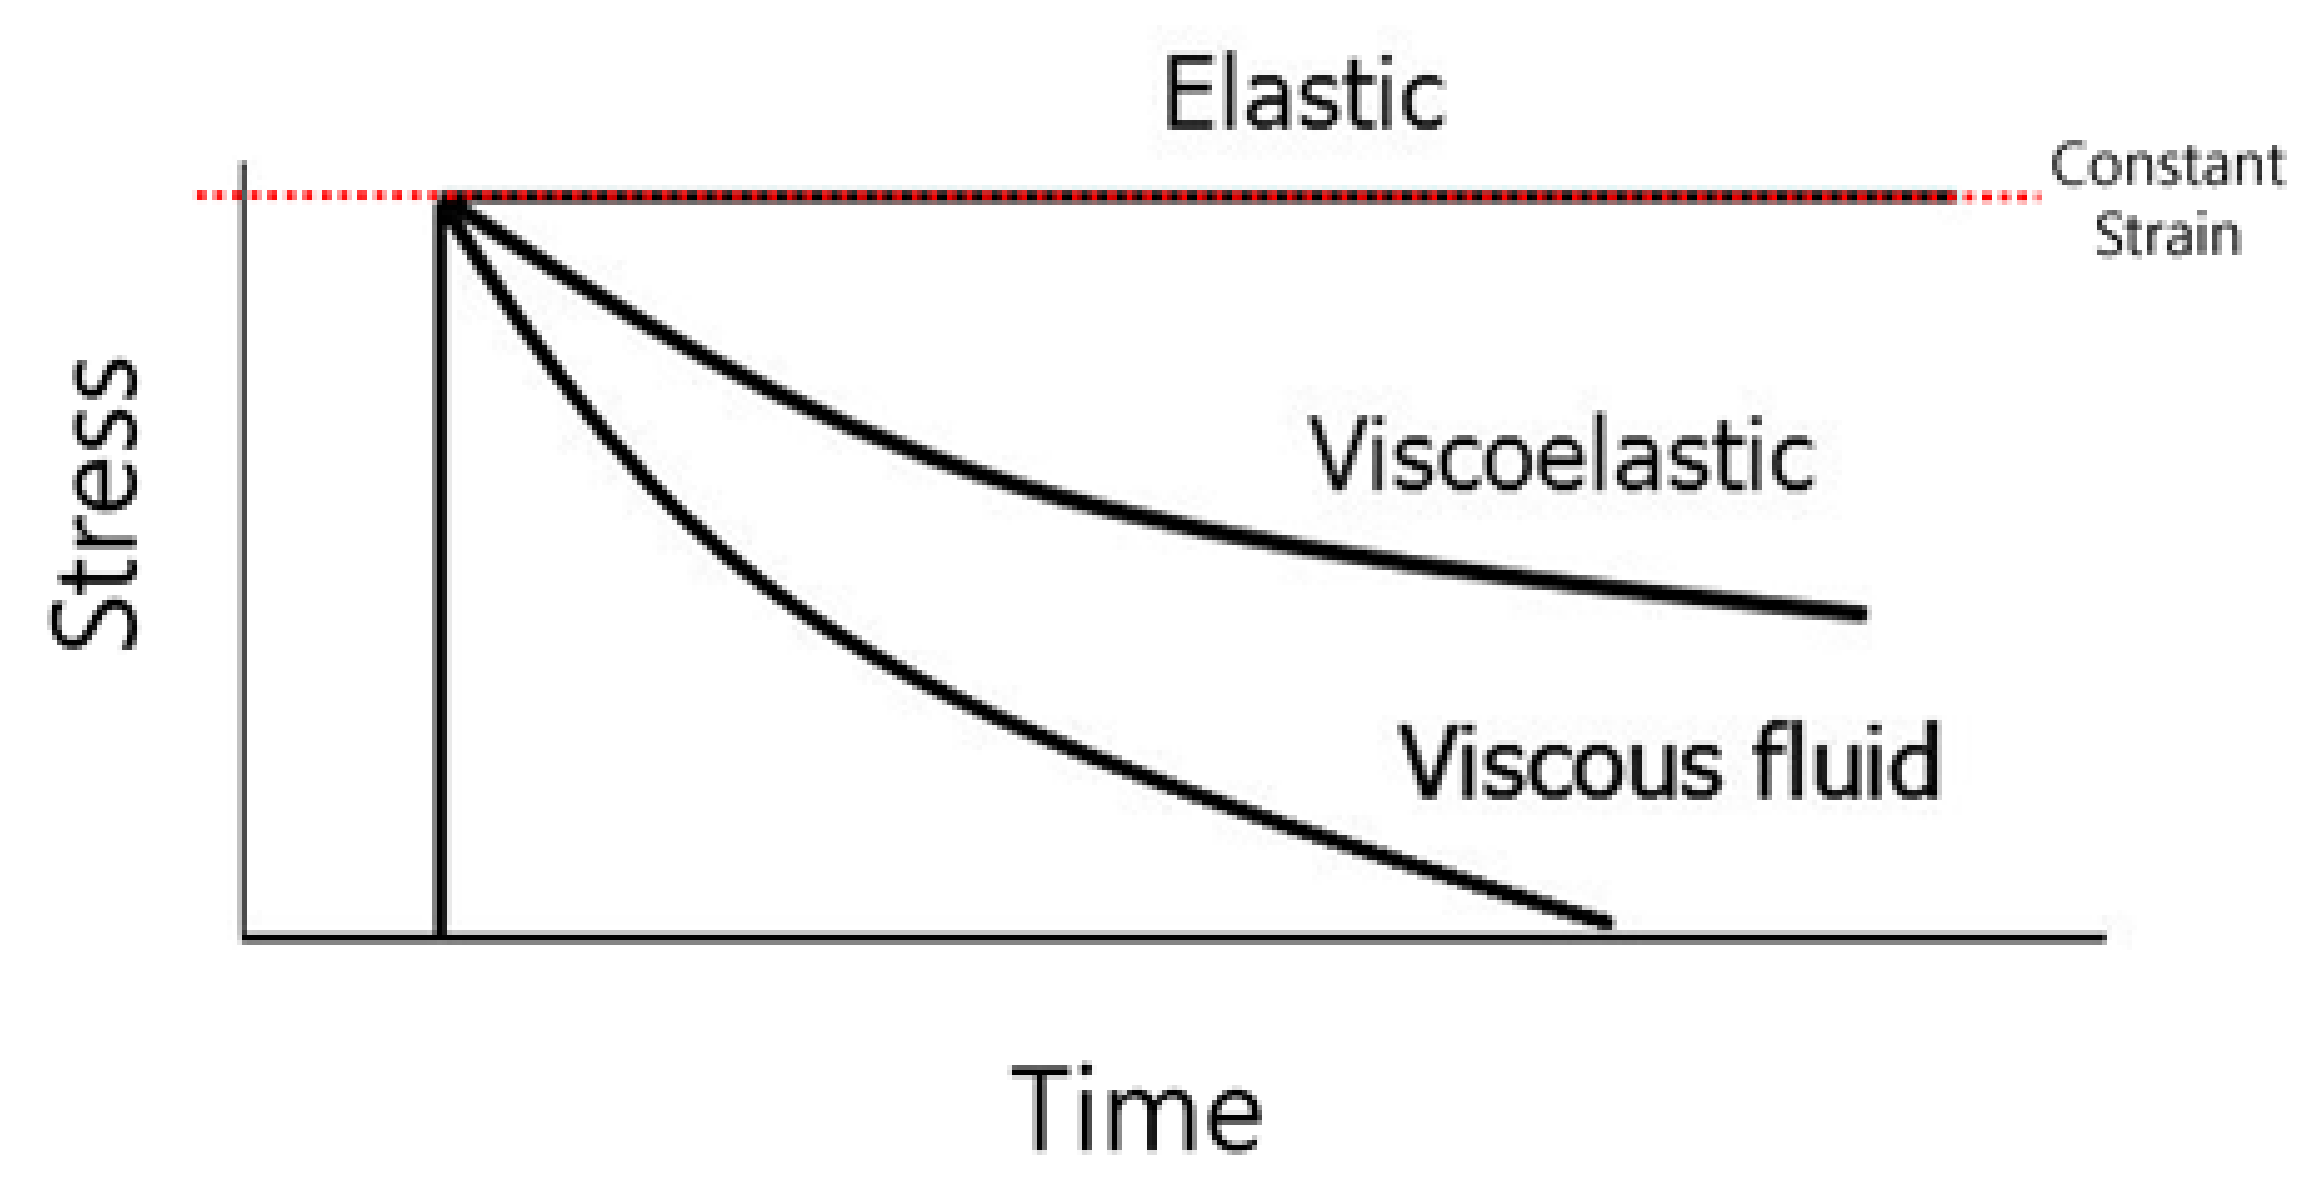
When a tire rubber with both viscosity and elasticity receives a load from the outside, the deformation of viscosity and elasticity occurs simultaneously. This phenomenon is called stress relaxation. If the body is elastic, it is restored to its original state upon load removal. However, in the case of viscoelastic materials, the restoration occurs gradually. In other words, this is a phenomenon wherein a certain amount of load is instantaneously applied to cause deformation, and when the applied load is removed, the stress maintaining the current strain is gradually relieved over time. Due to these characteristics, the stress relief characteristics of viscoelastic materials can be investigated to better understand the crack progress behavior of tire rubber.
Figure 1 shows the stress–time graph of a viscoelastic material based on its elasticity, viscoelasticity, and viscosity angular characteristics over time. It can be seen that the stress of viscoelasticity gradually becomes relieved over time.
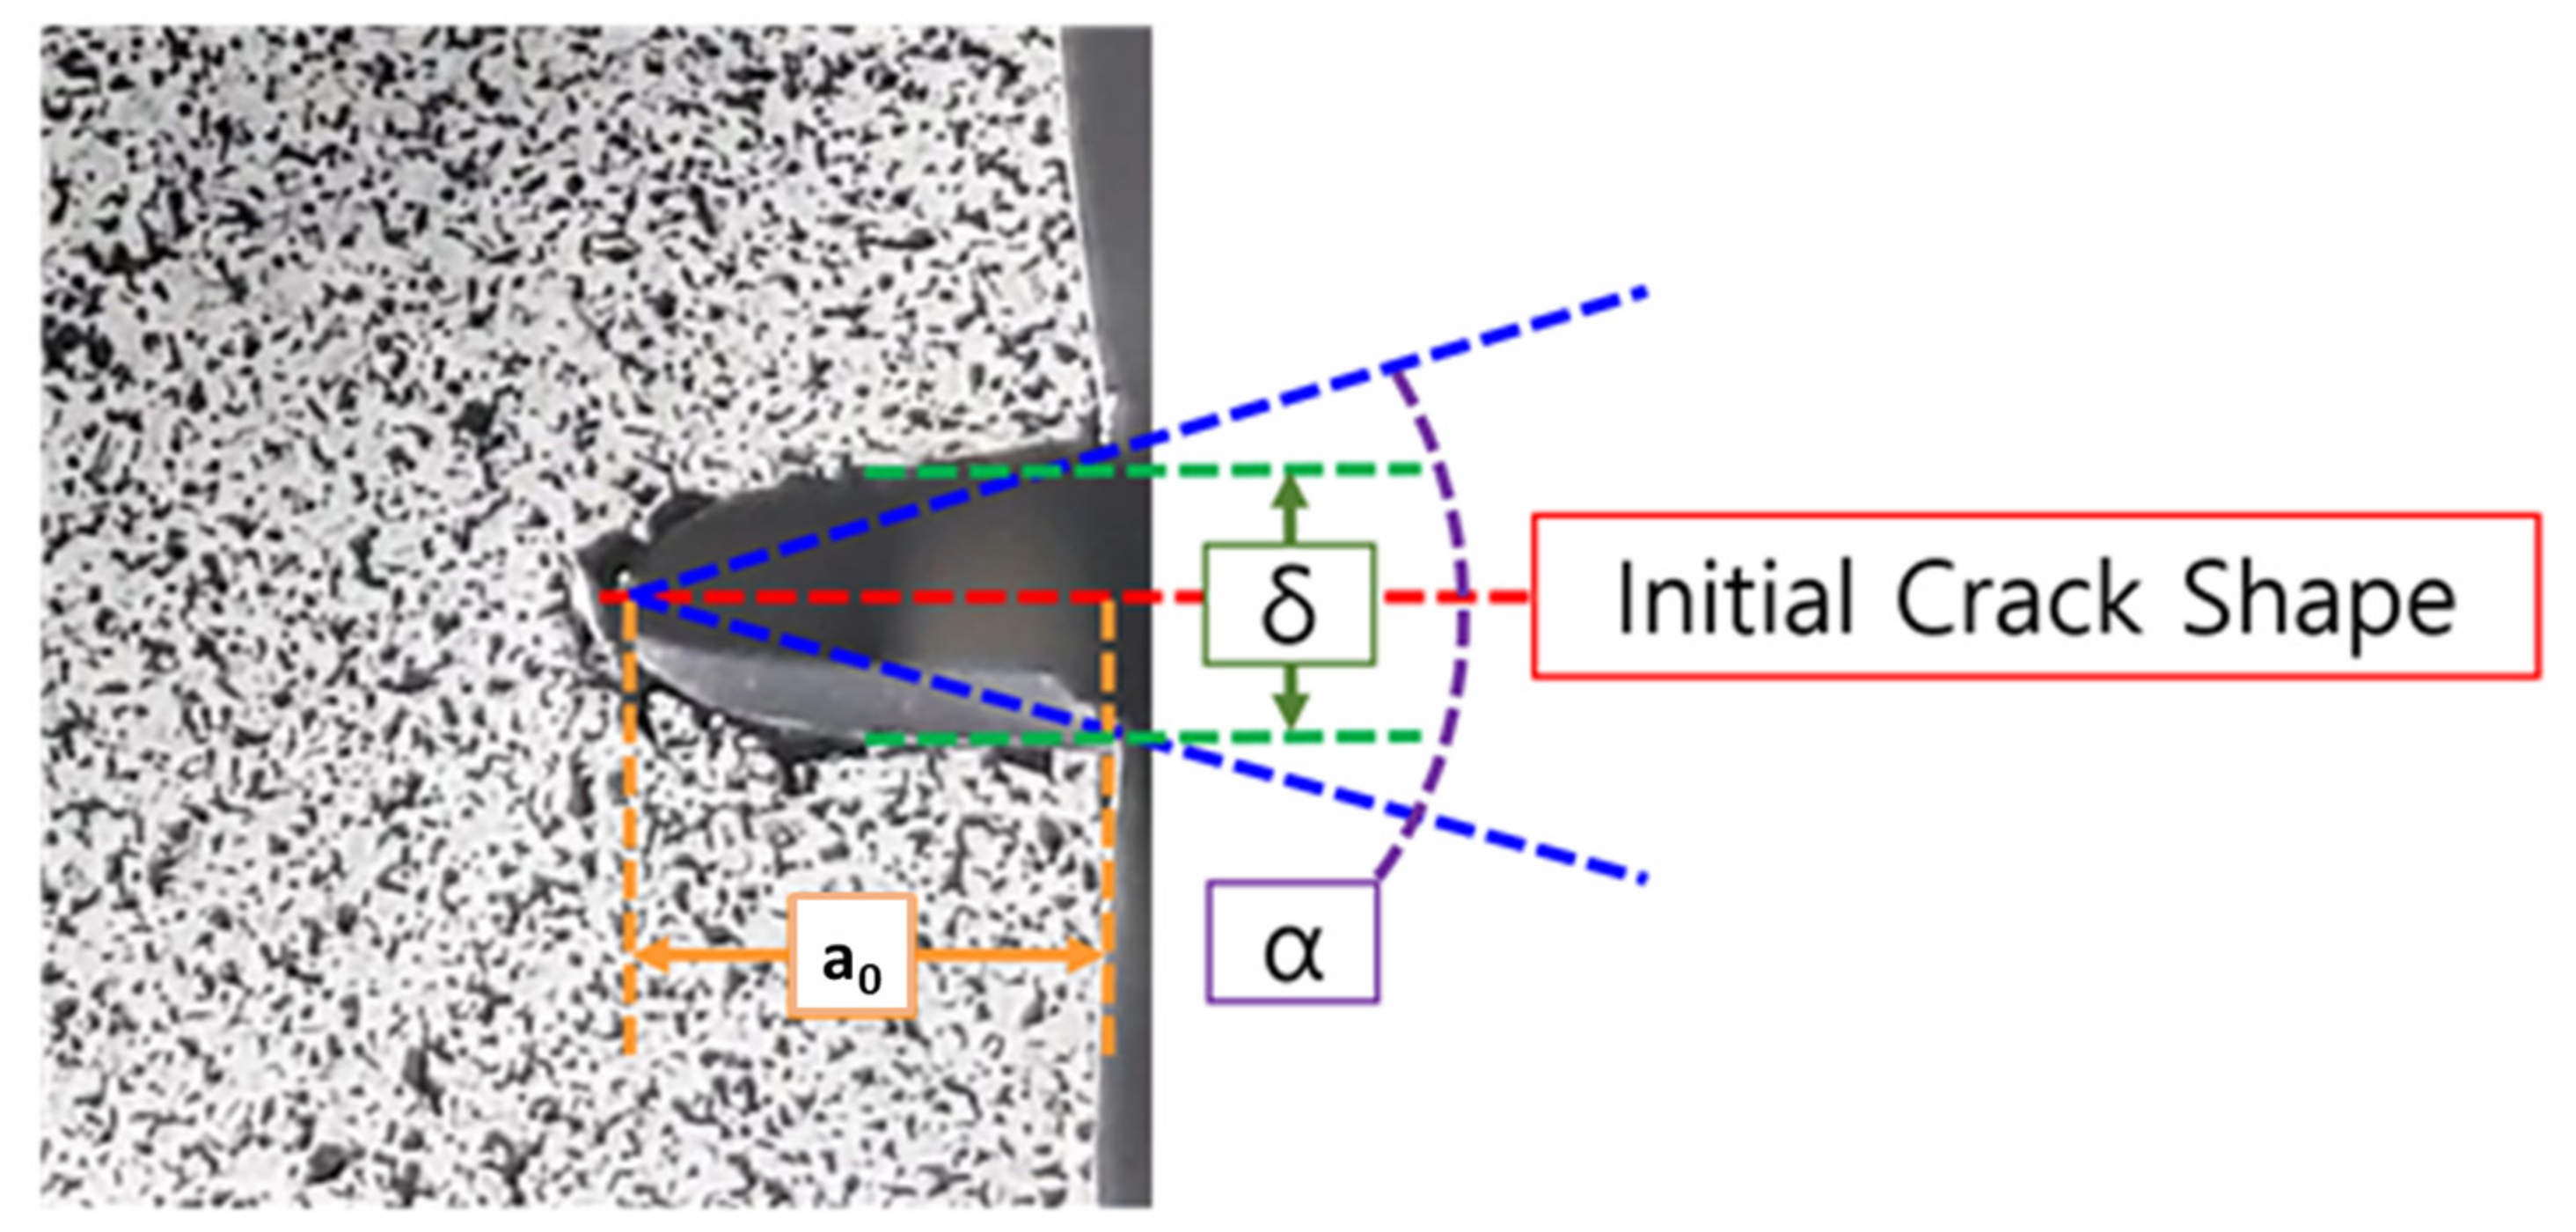
The crack tip open displacement was proposed by Irwin [
19]. The CTOD represents the distance between cracks and refers to a phenomenon in which initial cracks are caused by external forces. When this value reaches the material’s intrinsic value or a certain distance, the crack begins to grow.
The governing equation of the above CTOD is as follows:
where
δ is the CTOD and is being used as one of the parameters under the international standards.
G is the energy release rate, and
σys is the yield strength. This study measured the CTOD and analyzed it by using the digital image correlation method.
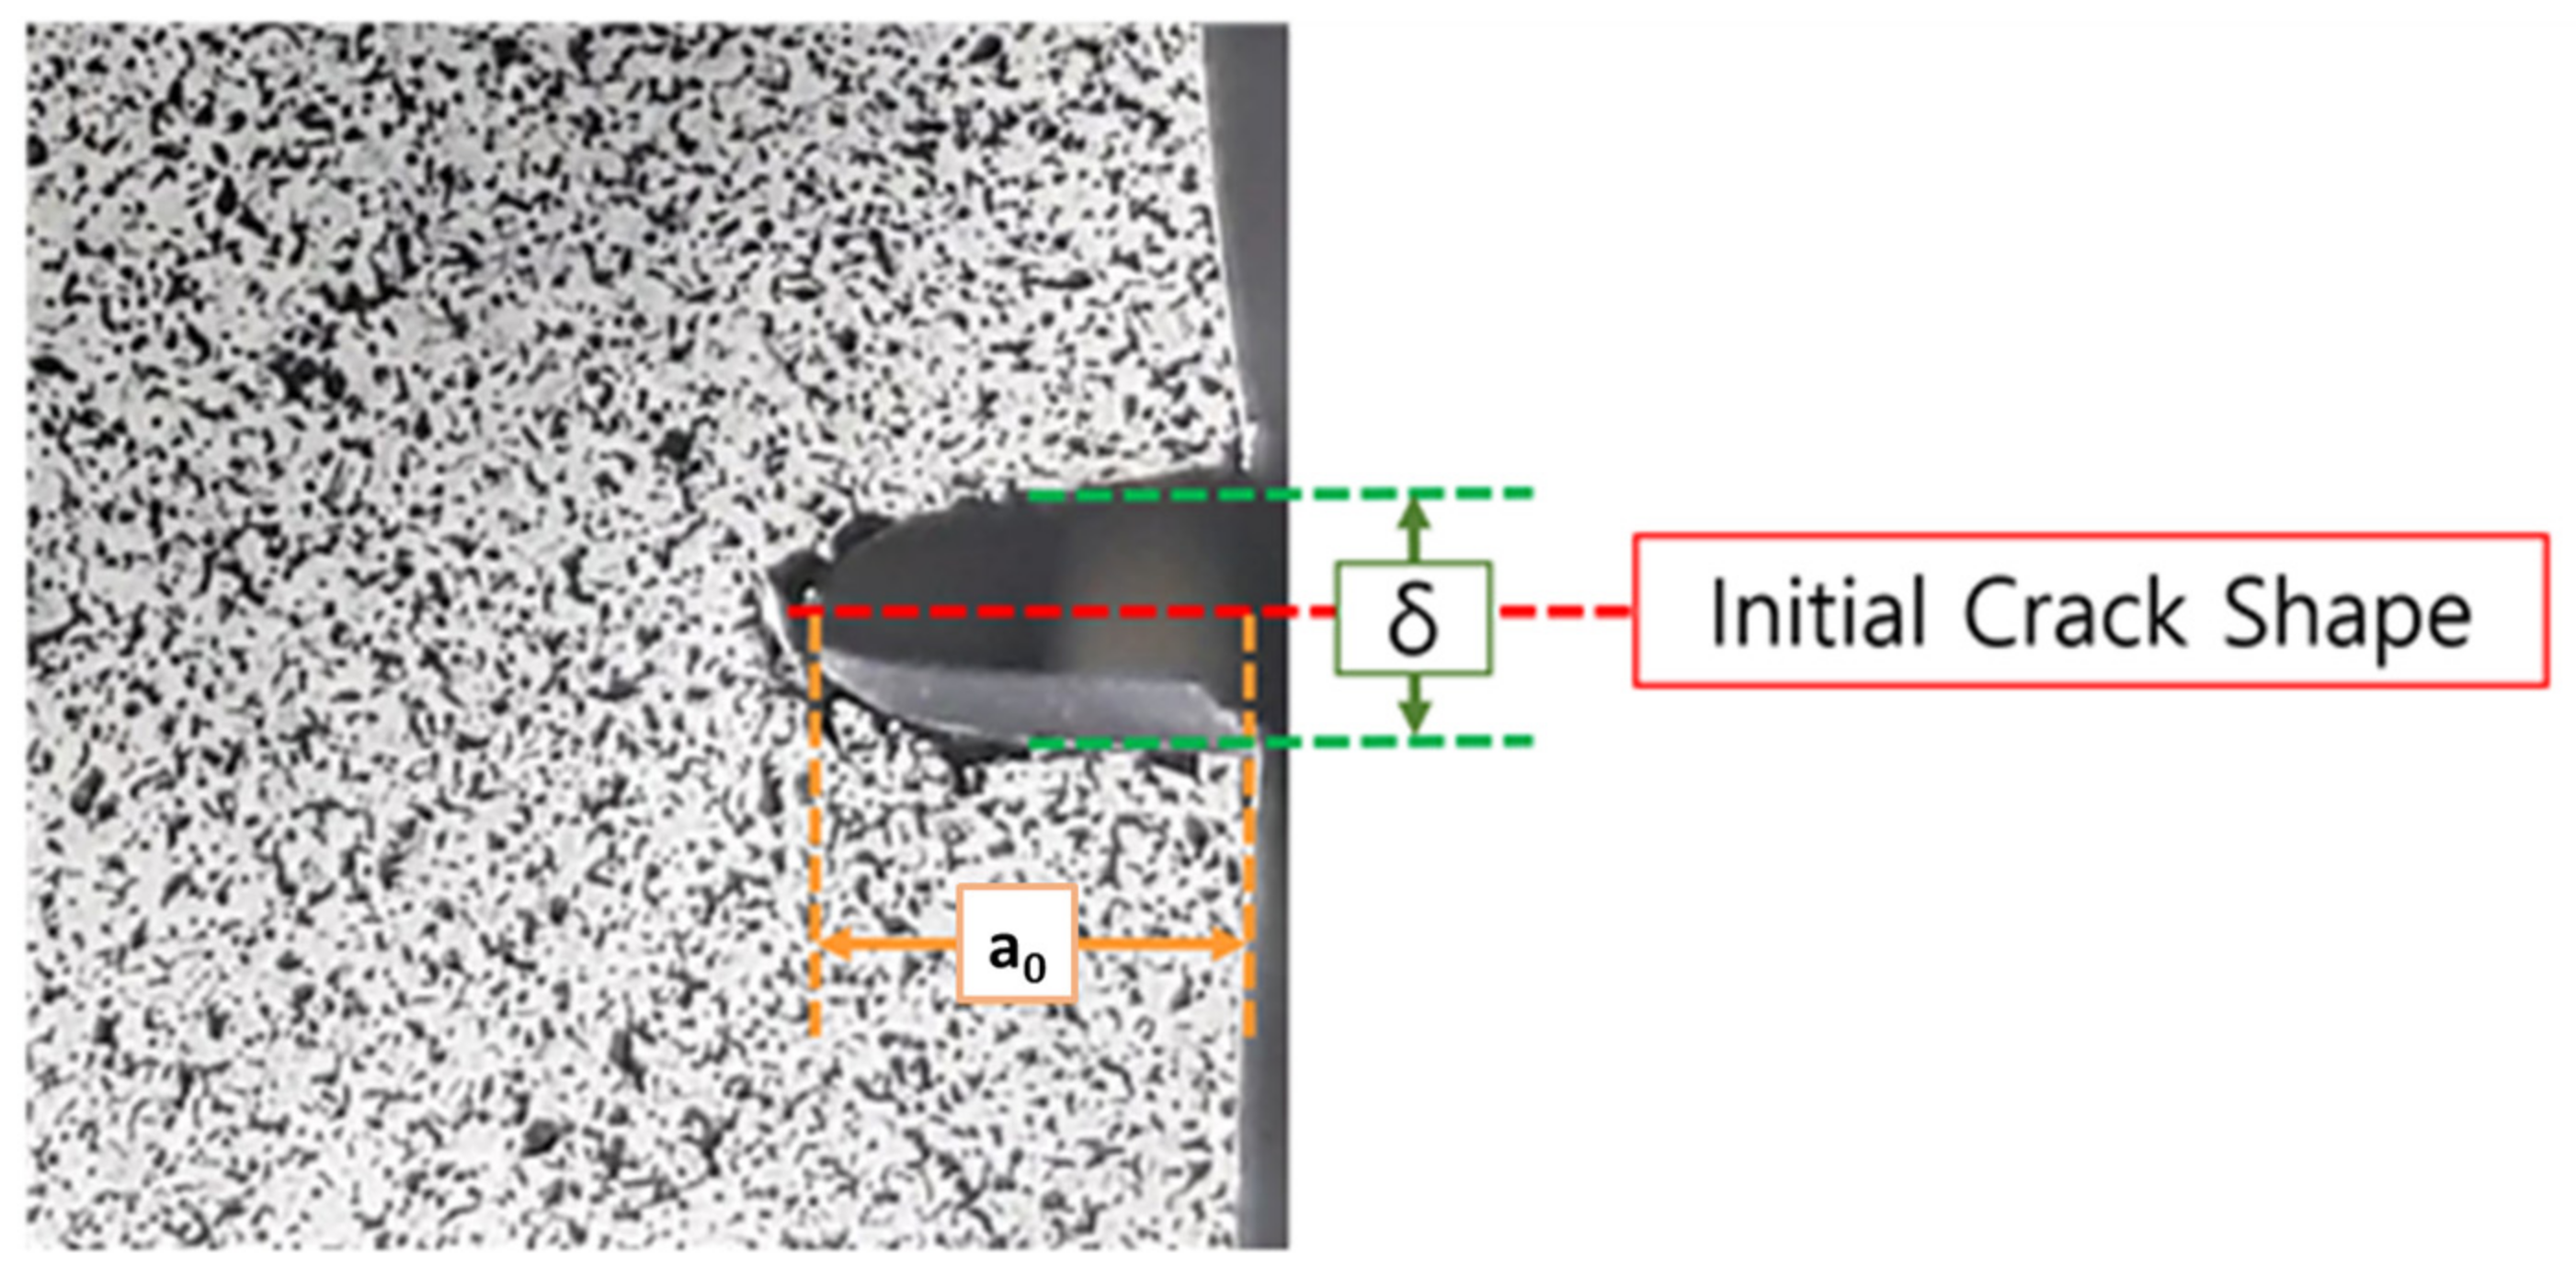
In
Figure 2,
δ is the CTOD and
a0 is an initial crack.
The advantage of the CTOA is that it can be determined through simple mathematical calculations and without any complicated theories. In addition, the CTOA reveals the non-linear and discontinuous behavior due to heterogeneity and stress relief properties, which are characteristics of viscoelastic objects. The CTOA is excellent when it comes to expressing this non-linear behavior.
The governing equation of the above CTOA can be given by
where α denotes the CTOA. Viscoelastic and super-elastic rubber occur from microcracks.
In
Figure 3, α represents the CTOA and
a0 denotes the initial crack length.
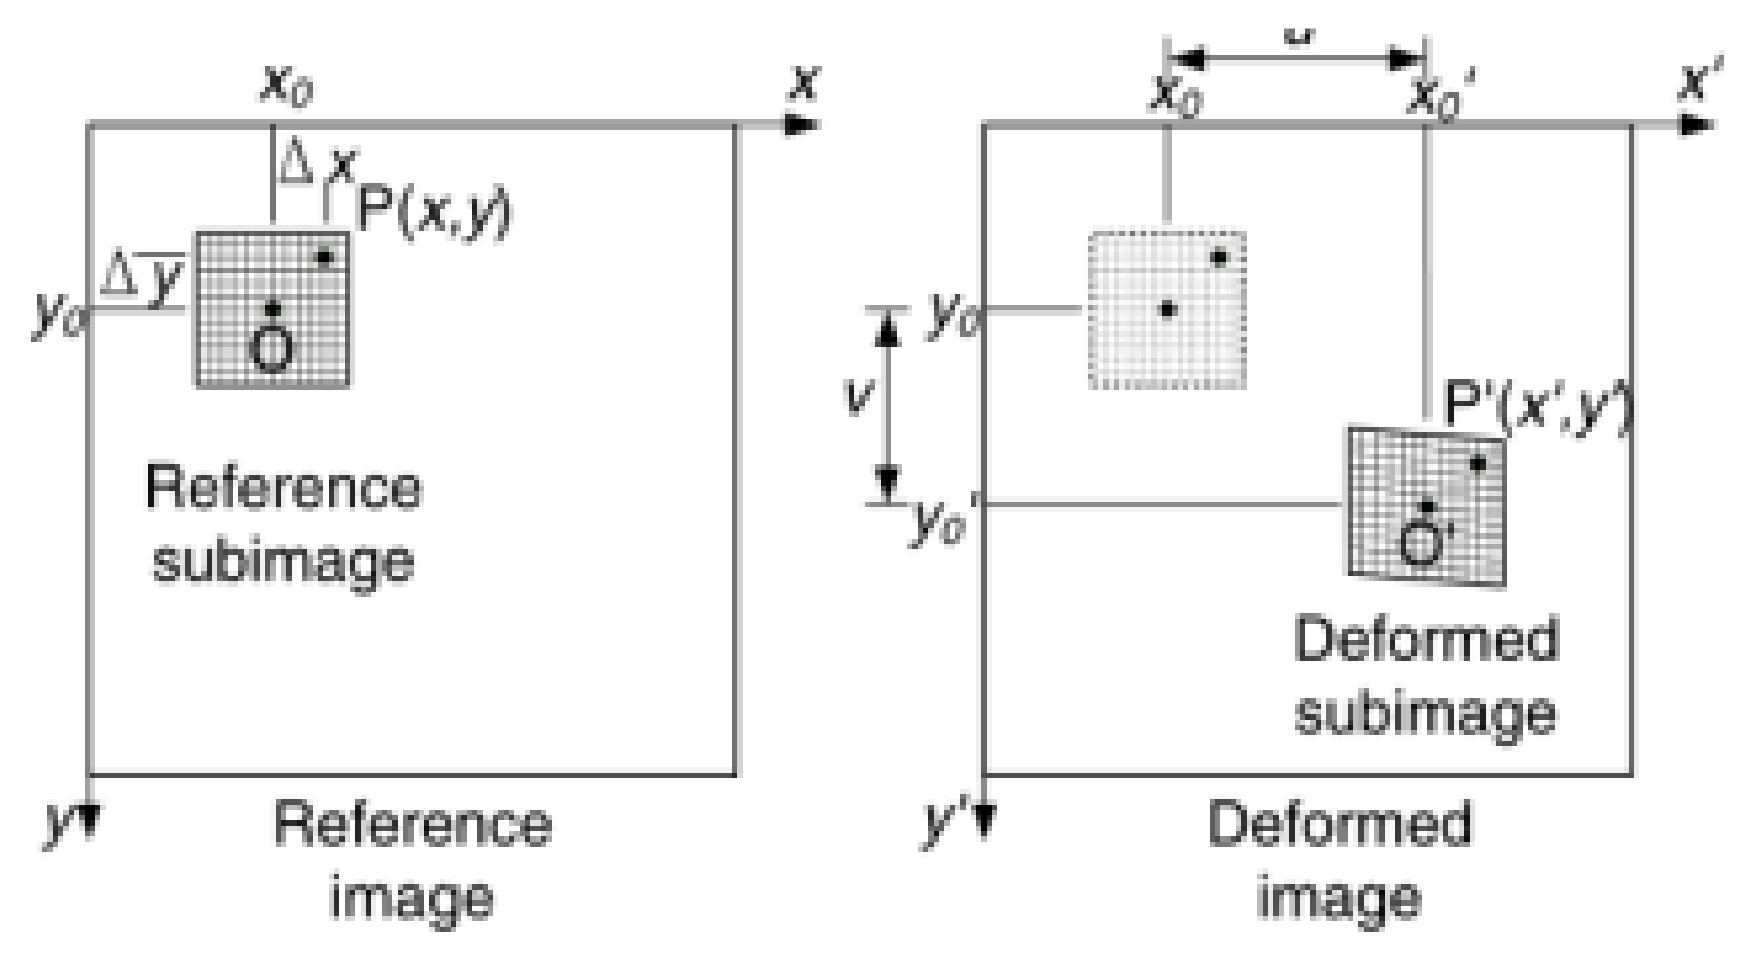
2.2. Digital Image Correlation Method
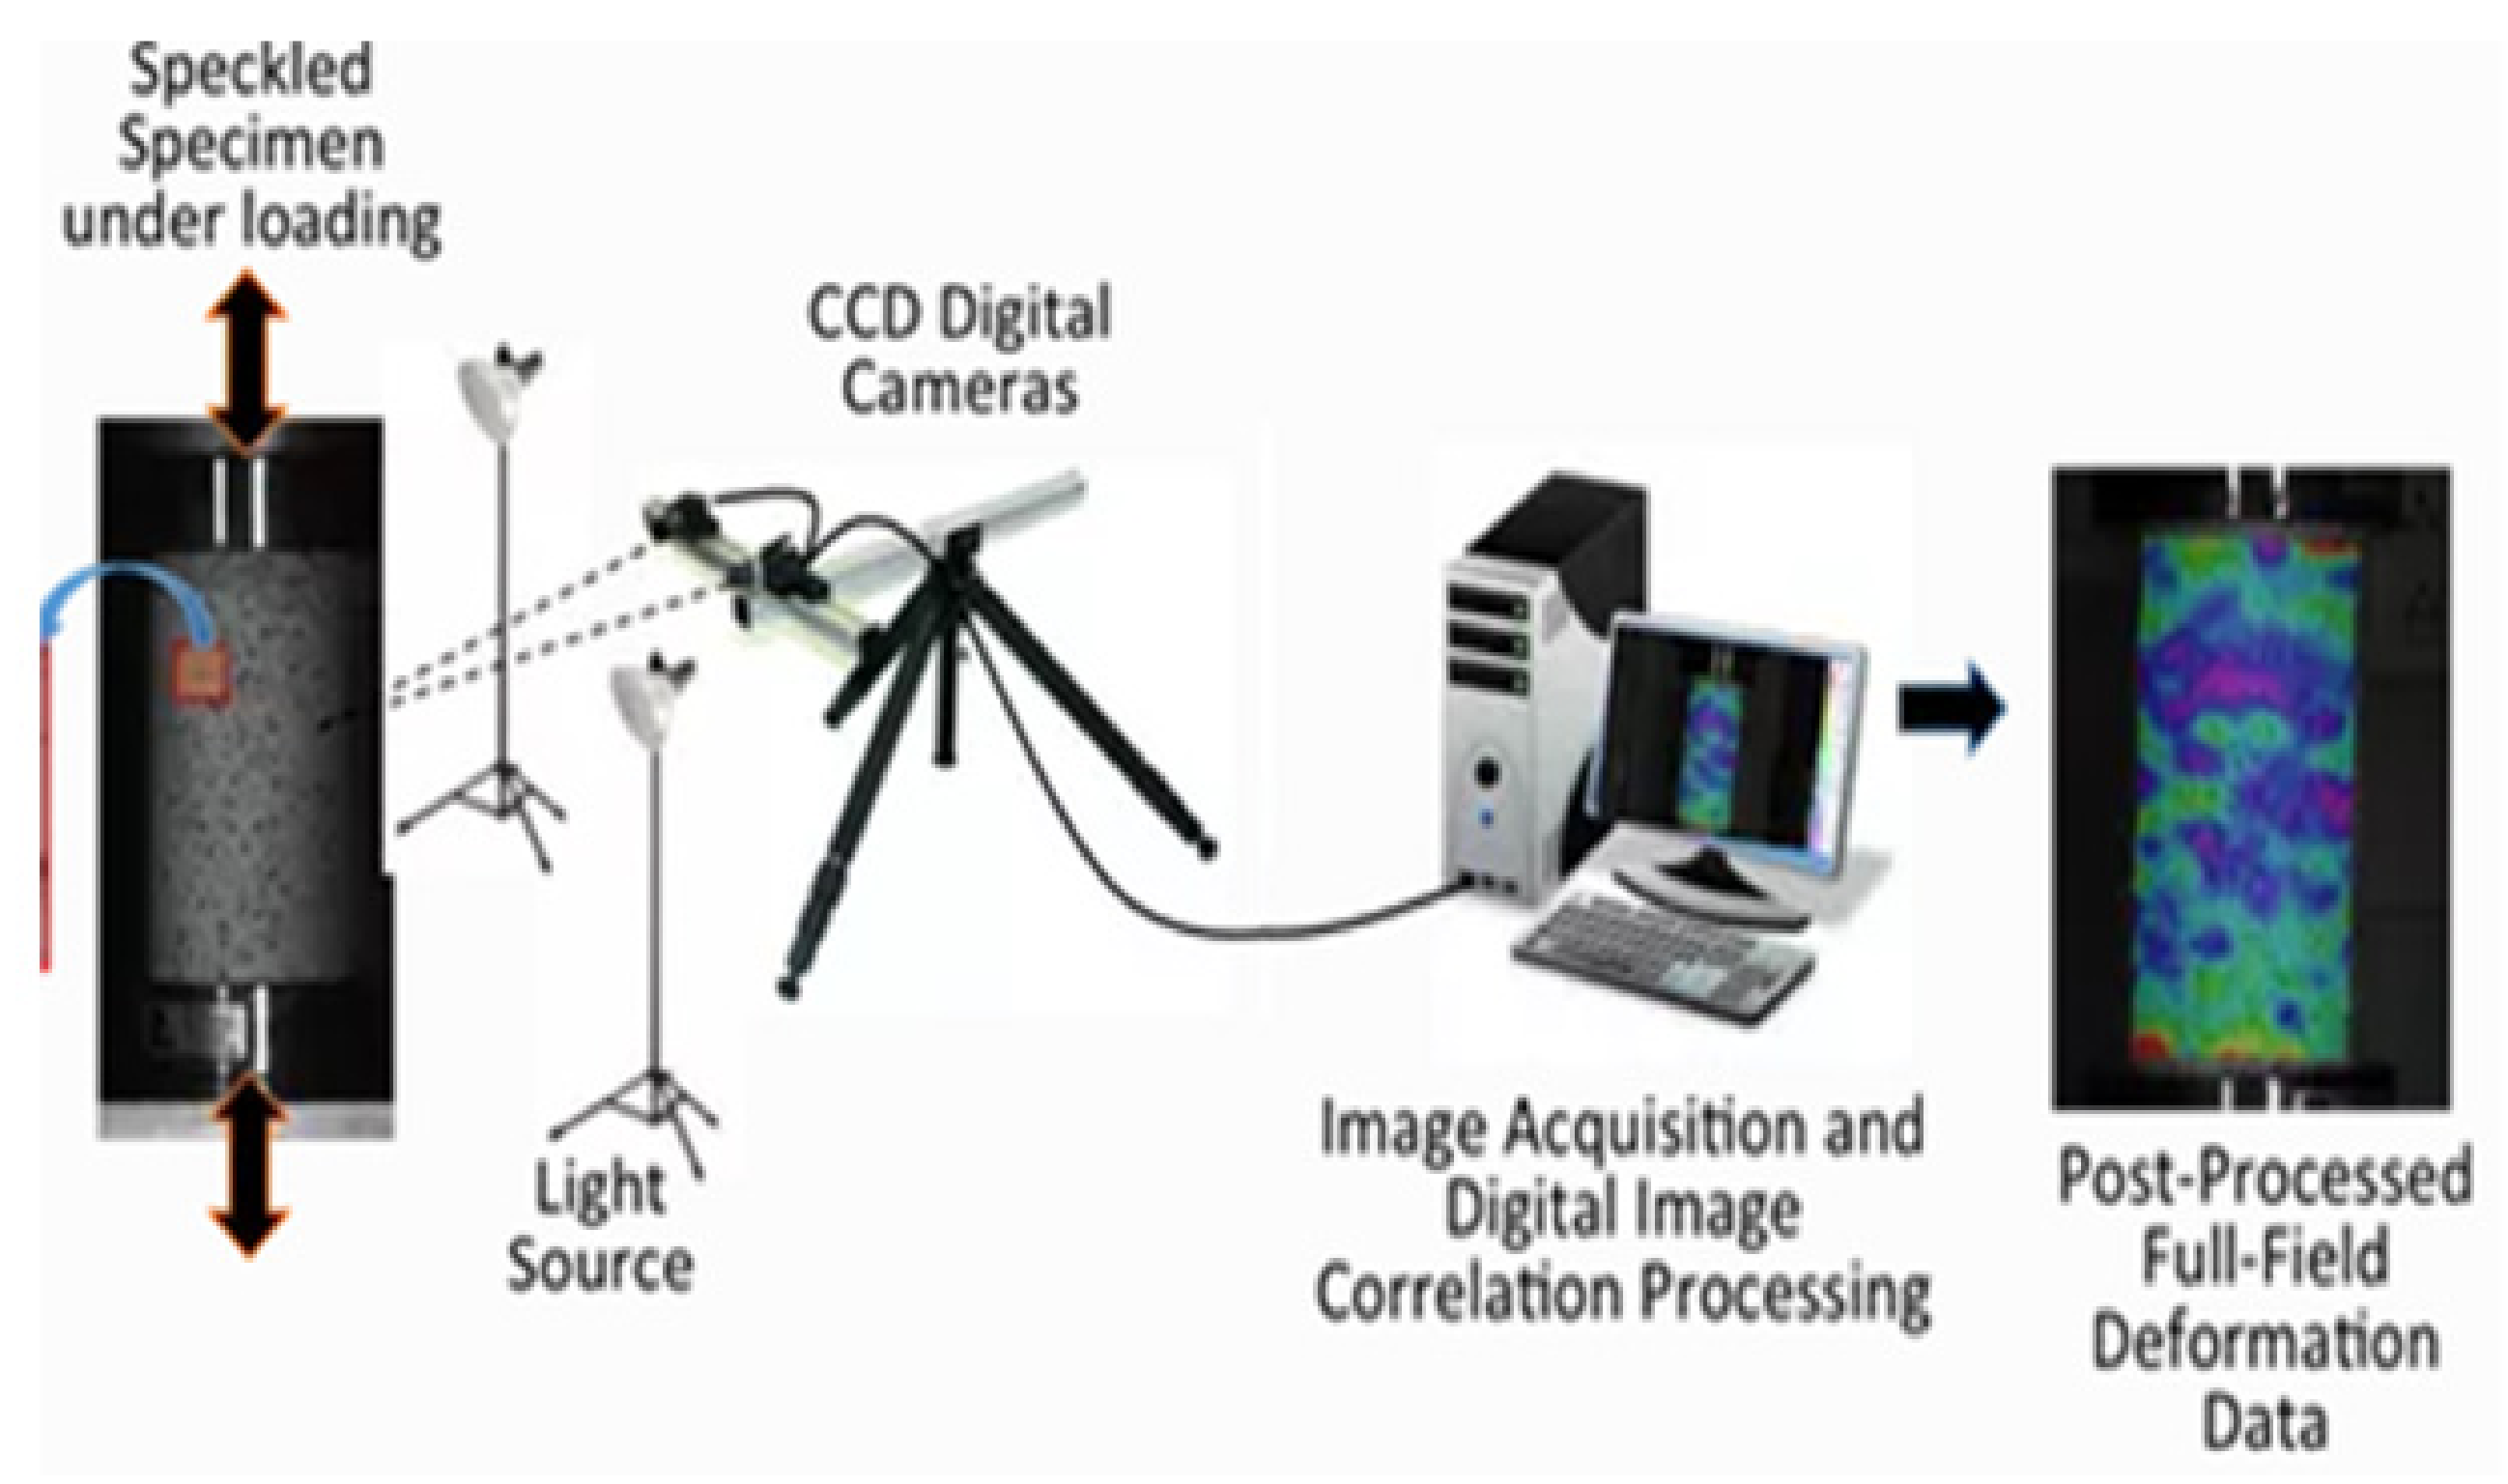
The digital image correlation method can be used to measure the displacement, deformation, and deformation rate of a structure by capturing images of the disorder patterns of a structure with a camera using a non-contact optical method and then comparing the images before and after deformation. By tracking images before and after the deformation of the speckle pattern applied to the specimen, the modified distance can be found by grasping the correlation with the amount of change that can be determined through the following two equations (Equations (3) and (4)):
where
and
are the distances from points P to O, and
and
denote the mean movements in the
and
directions.
Figure 4 schematically shows the changes before and after deformation.
Vector () is a displacement vector and can be expressed through Equation (5). It is a correlation coefficient.
2.3. Fracture Progress Region
The fracture progress region for a particle hardening complex, such as tire tread rubber, is distributed as a non-linear region, unlike metals that are mostly distributed as linear regions. The reasons it is formed as a non-linear region are as follows. First, due to the non-homogeneity of the material, a non-linear region occurs inevitably, unlike metals with high homogeneity. In addition, due to the influence of fine cracks, crack progression occurs simultaneously at various locations. This plays a role in reducing the energy released from the crack tip. At the same time, since the crack region increases non-linearly, more fracture energy is absorbed. Therefore, in the case of particle hardening complexes, such as tire treads, the fracture behavior of the fracture progression region at the crack point inevitably exhibits a condition wherein stable fracture behavior cannot occur as in linear elastic fracture mechanics. In other words, unstable behavior is shown, which makes it difficult to predict the destructive behavior, e.g., the path and location of the crack. Therefore, if the strain field of the specimen surface is checked through the digital image correlation method, the fracture behavior of the nonlinear fracture progression region can be analyzed.
4. Experimental Results and Discussion
4.1. Results for Tensile Test
It could be observed that rubber, a viscoelastic composite, exhibited ductility. It also showed brittleness depending on the temperature. However, rubber is basically a viscoelastic material with ductility. Since carbon black was included to satisfy the characteristics of the finished product, the physical properties of rubber, which were elastic, underwent a change; thus, the tire exhibited characteristics different from those of general natural rubber. As described above, tire rubber with both viscosity and elasticity shows the stress relaxation phenomenon, and deformation occurs by a certain amount of load in a moment. When the applied load is removed, the stress maintaining the current strain is gradually relieved over time. Consequently, tire rubber, in general, exhibits non-linear behavior.
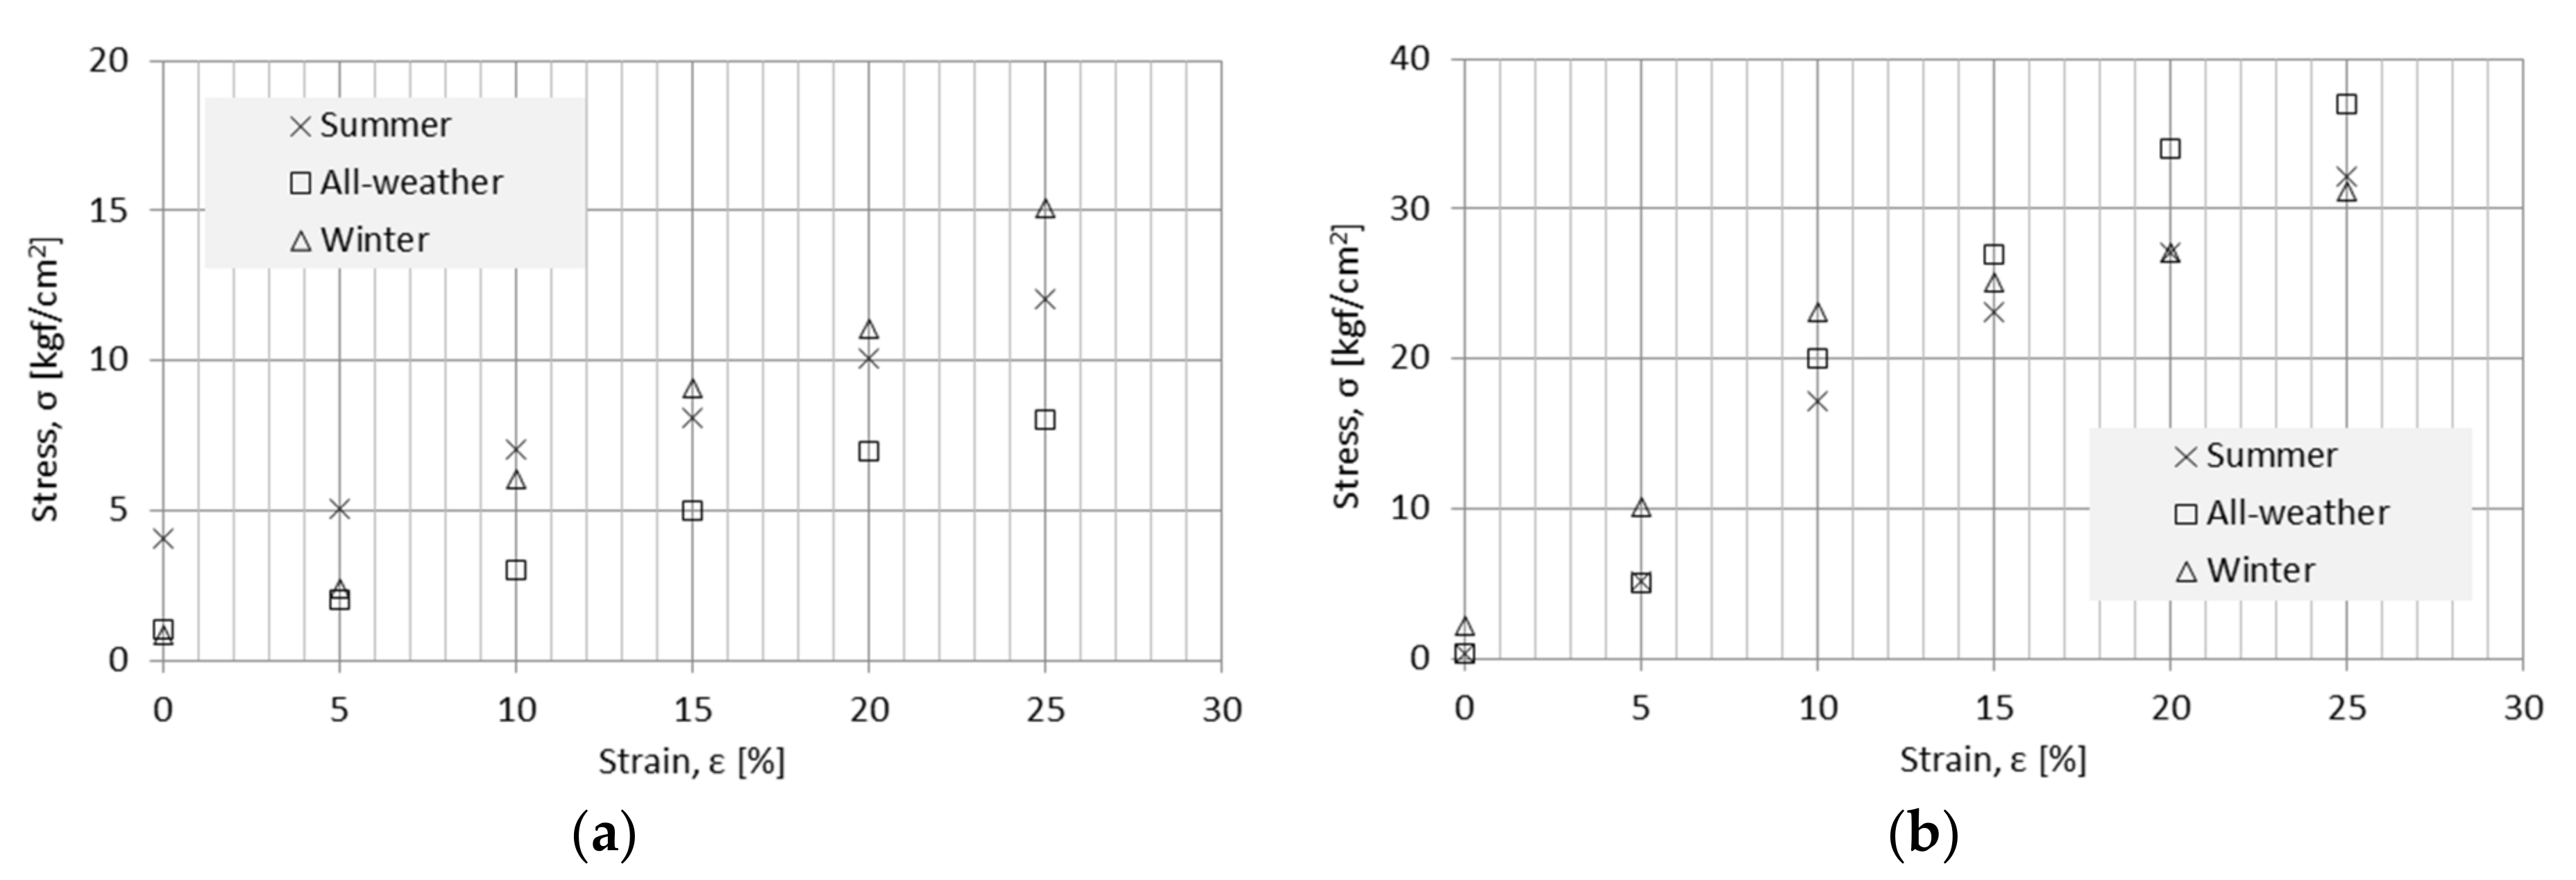
Figure 7a,b show the stress–strain diagrams obtained from the tensile tests with load speeds of 5 mm/min and 50 mm/min for summer, all-weather, and winter specimens. It was predicted that the stress would be high in the summer specimen with high hardness; on the contrary, large stress was required for the winter specimen.
As shown in
Figure 7a, at the speed of 5 mm/min, the load required for deformation for the all-weather specimens in the 10% initial strain section was lower due to the influence of hardness and elastic modulus than for the summer or winter specimens. For the winter specimens, the required load at the beginning of the test was similar to the all-weather specimens, but the required load increases rapidly compared to the all-weather specimens. In addition, in the case of the summer specimen, the load required was higher than that of all-weather and winter in the initial strain section, but it can be seen that the winter specimen reverses when the strain exceeds 15%.
As shown in
Figure 7b, at the speed of 50 mm/min, the load required for deformation for the winter specimen in the 10% initial strain section required a larger load than the summer or all-weather specimens. In the subsequent sections, the increasing slope of the stress–strain diagram for the winter specimen was lower than that for the other specimens, meaning that a large deformation could be continuously caused even under small loads. In other words, when the load resisting the tension of the rubber material itself exceeded a certain section, the physical result values of the winter and summer specimens were reversed. In the tensile section, before the initial strain of about 10%, the tensile resistance was large, but it easily increased when the initial strain of the load exceeded 10% of the load. Therefore, when the winter specimen passed through the initial strain section compared to the summer specimen, the crack progress accelerated.
4.2. Results of Crack Tip Opening Displacement
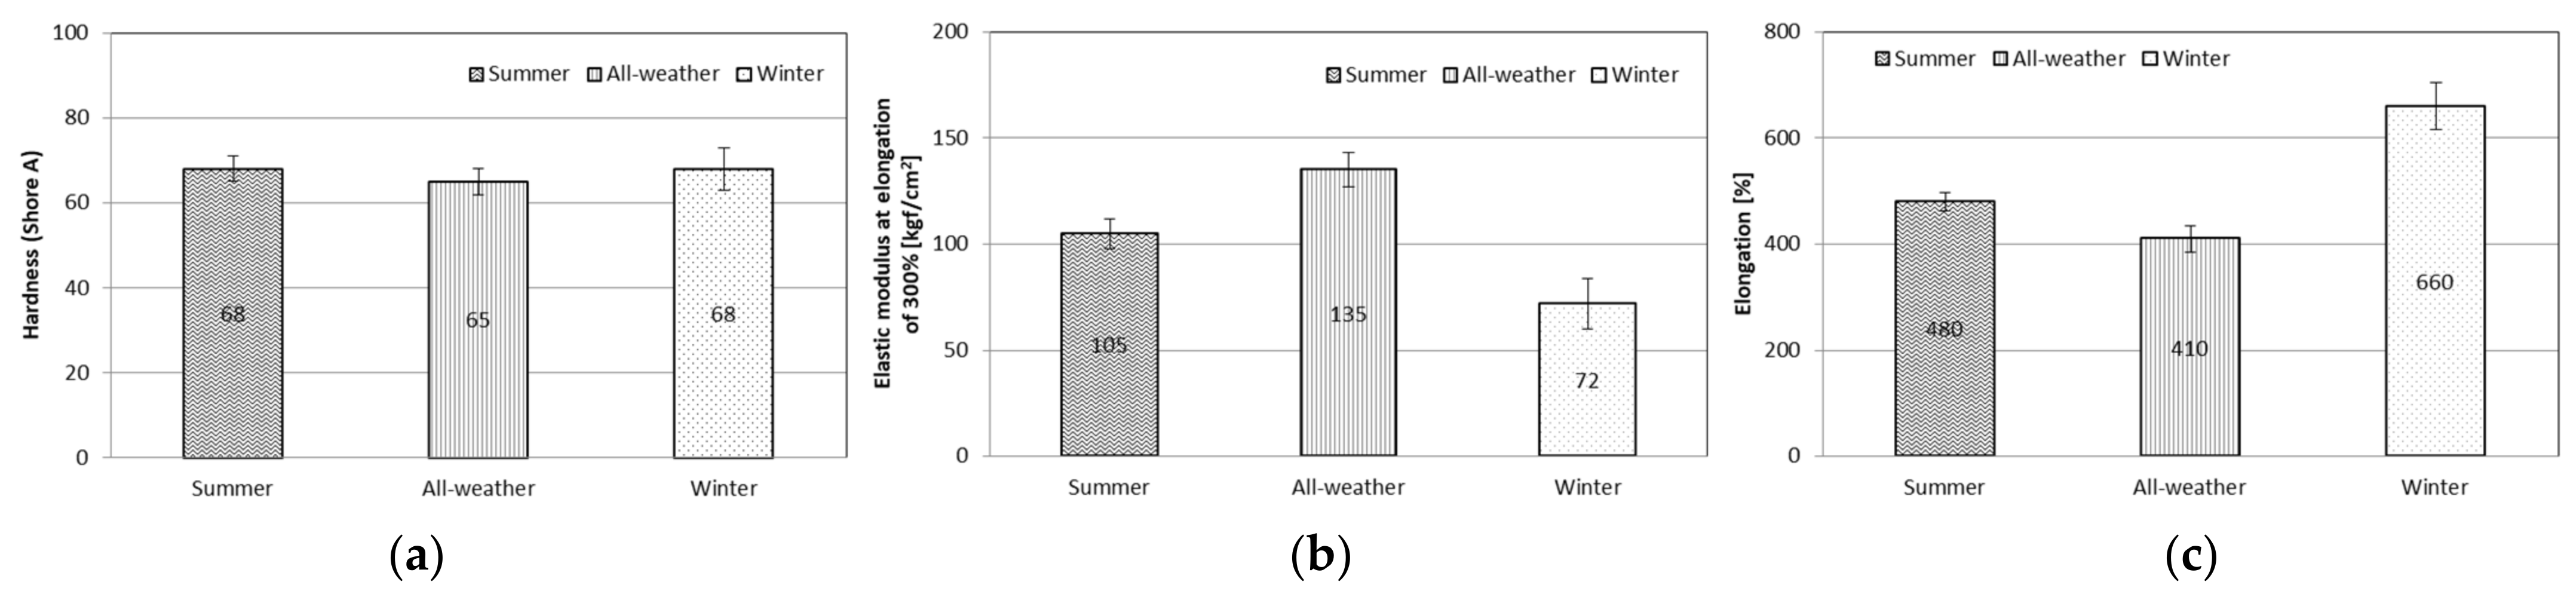
Figure 8a–c summarize the hardness, elastic modulus, elongation at 300% of the tensile test, and the related standard deviation for the three types of specimens at the room temperature (25 ± 3 °C) test. Moreover,
Figure 8c is the maximum elongation shown on the graph equal to the elongation at the break. According to the results, the hardness of the winter specimen was the same as that of the summer specimen and was less than that of the all-weather specimens. However, at 300% of the tensile test for the winter specimens, the modulus of elasticity was 33 kgf/cm
2 lower than that of the summer specimens and 63 kgf/cm
2 lower than that of the all-weather specimens.
Further, for the winter specimens, elongation was 180% higher than that of the summer specimens and 250% higher than that of the all-weather specimens.
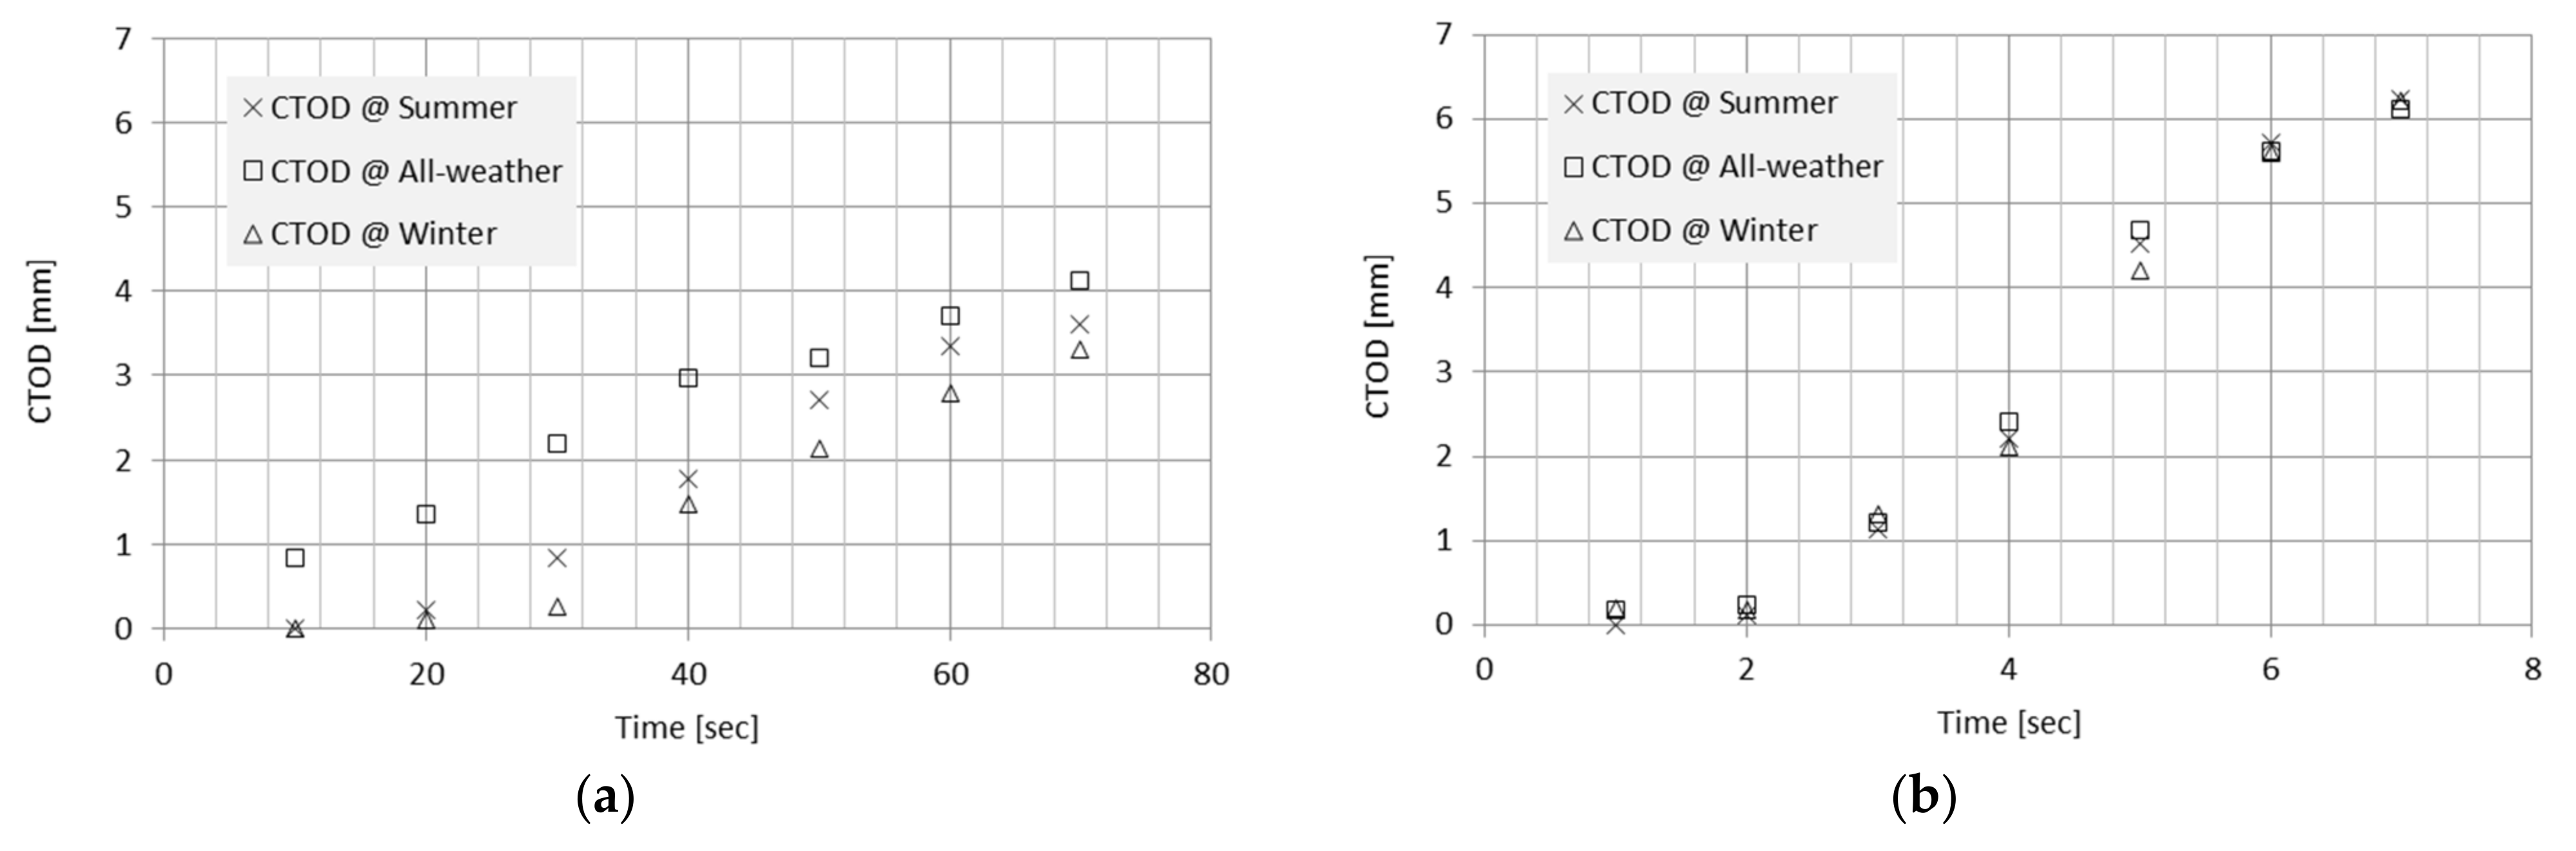
Figure 9a,b show the CTOD for each specimen based on the time taken to analyze the images collected by the camera during the tensile test, at speeds of 5 mm/min and 50 mm/min, using the digital image correlation method. Due to the characteristics of viscoelastic and super-elastic materials, the CTOD increased infinitely over time. Cracks, such as those in metals and fine cracks, occurred around the initial crack tip. In other words, fine tearing occurred discontinuously and unevenly.
Figure 9a shows the CTOD of the three types of rubber at the low-speed condition of 5 mm/min. It was confirmed that the CTOD of the three types of rubber exhibited non-linear behavior. This difference can be attributed to the difference in performance, derived from the constituent elements of each material. It can be said that the effect of elastic modulus played a major role rather than the effect of the hardness or elongation at the low speed of 5 mm/min.
In the case of the all-weather specimens, the growth of the CTOD was about 62% faster until the 35-s section compared to the summer and winter specimens. However, after 35 s, the CTOD growth rate of the summer and winter specimens increased rapidly, reducing the difference to about 10%. In other words, it can be interpreted that the hardness of the all-weather specimens was low, which was disadvantageous for CTOD growth. It also had a larger value than the summer and winter specimens. After increasing by a certain amount or more, it was found that the CTOD growth rate of the summer and winter specimens was faster than that of the all-weather specimens due to the elastic modulus and elongation. In other words, the mechanical properties of the material, such as elastic modulus, elongation, and strength, had an absolute effect at the speed of 5 mm/min.
Figure 9b shows the CTOD of the three types of rubber at 50 mm/min, the high-speed condition. At the high-speed condition of 50 mm/min, all types of rubbers exhibited non-linear behavior, but the growth trend was similar.
Regardless of the type of specimen, the CTOD increased rapidly in the section from about 2 s to about 6 s after the start of the experiment, and this increasing trend reduced after 6 s. Once the crack began to open up, it indicated that destruction could occur rapidly due to the influence of speed. In other words, at 50 mm/min, the destructive behavior was expected to appear differently under the influence of the external environment, such as temperature and road conditions, rather than the characteristics of the compound.
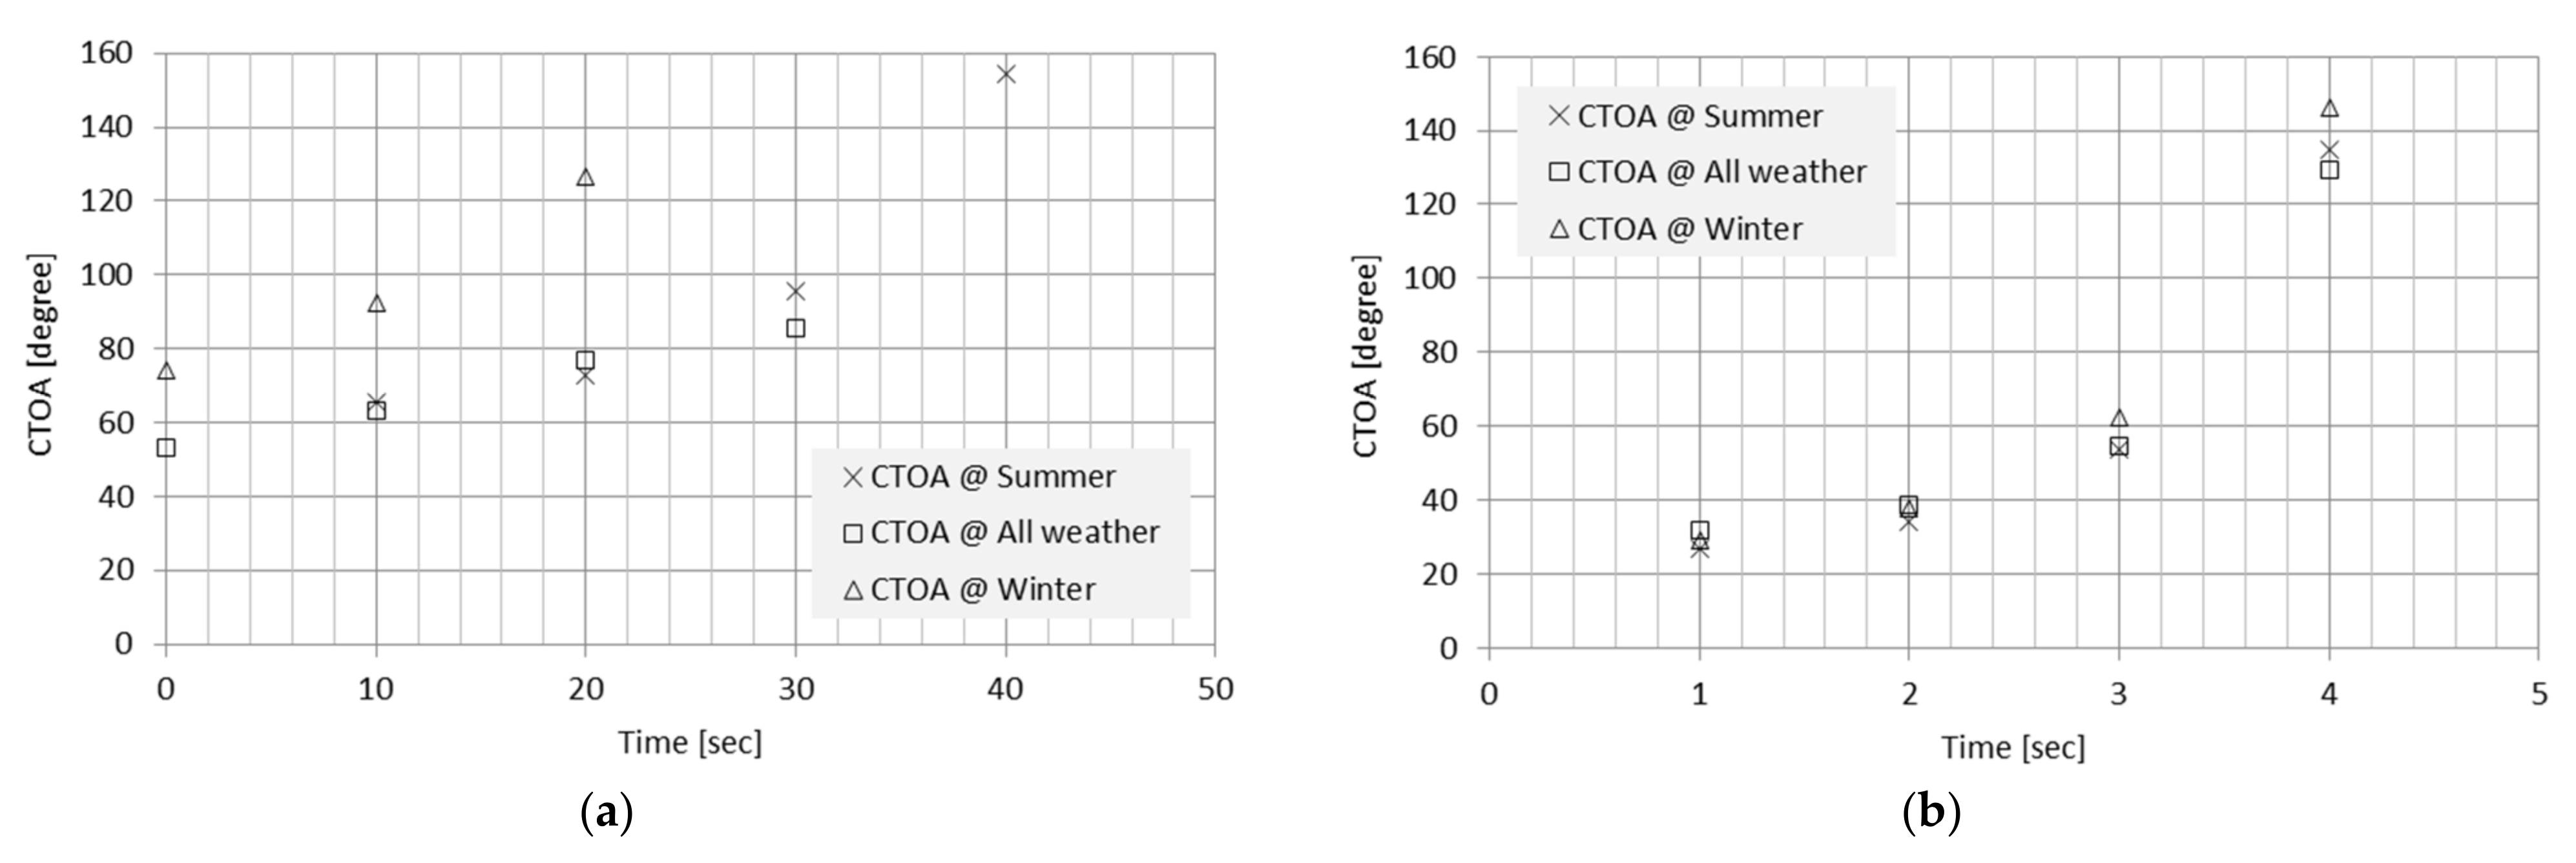
4.3. Results of Opening Angle of Crack Tip
Figure 10a,b show the CTOA according to the test speed. The growth of microcracks was measured with a vernier caliper, and the CTOA was calculated by substituting it into a mathematical equation as described above. In addition, the critical CTOA was considered at the room temperature set in the previous study [
13]. Further, considering the characteristics of tire rubber and assuming that no cracks progressed, such as that in metals and fine cracks, the critical CTOA was assumed to be 90°.
Figure 10a shows a test speed of 5 mm/min; the critical CTOA was reached in the order of winter, summer, and all-weather specimen. In other words, when chemical cracks occurred, there was a difference in time with regard to attaining the critical CTOA for each rubber due to the difference in rubber properties. The faster the time, the more vulnerable it was in terms of safety. It was shown that the winter specimen with the lowest elastic modulus reached the critical CTOA at about 20 s, which was followed by the summer specimen at about 30 s, and the all-weather specimen after 40 s. All specimens appeared to be greatly affected by the elastic modulus, not the hardness and elongation.
On the other hand,
Figure 10b shows the test speed of 50 mm/min; the critical CTOA was reached in the order of winter, summer, and all-weather specimens, which was similar to the results of the previous 5 mm/min, but the difference was less than about 10%. In other words, similar to the previous CTOD ‘all specimens’, it can be said that it was more vulnerable to the influence of the external environment than the influence of the physical properties of rubber. The time and angle for reaching the critical CTOA can be applied as destruction parameters of cracks for rubber materials in the future.
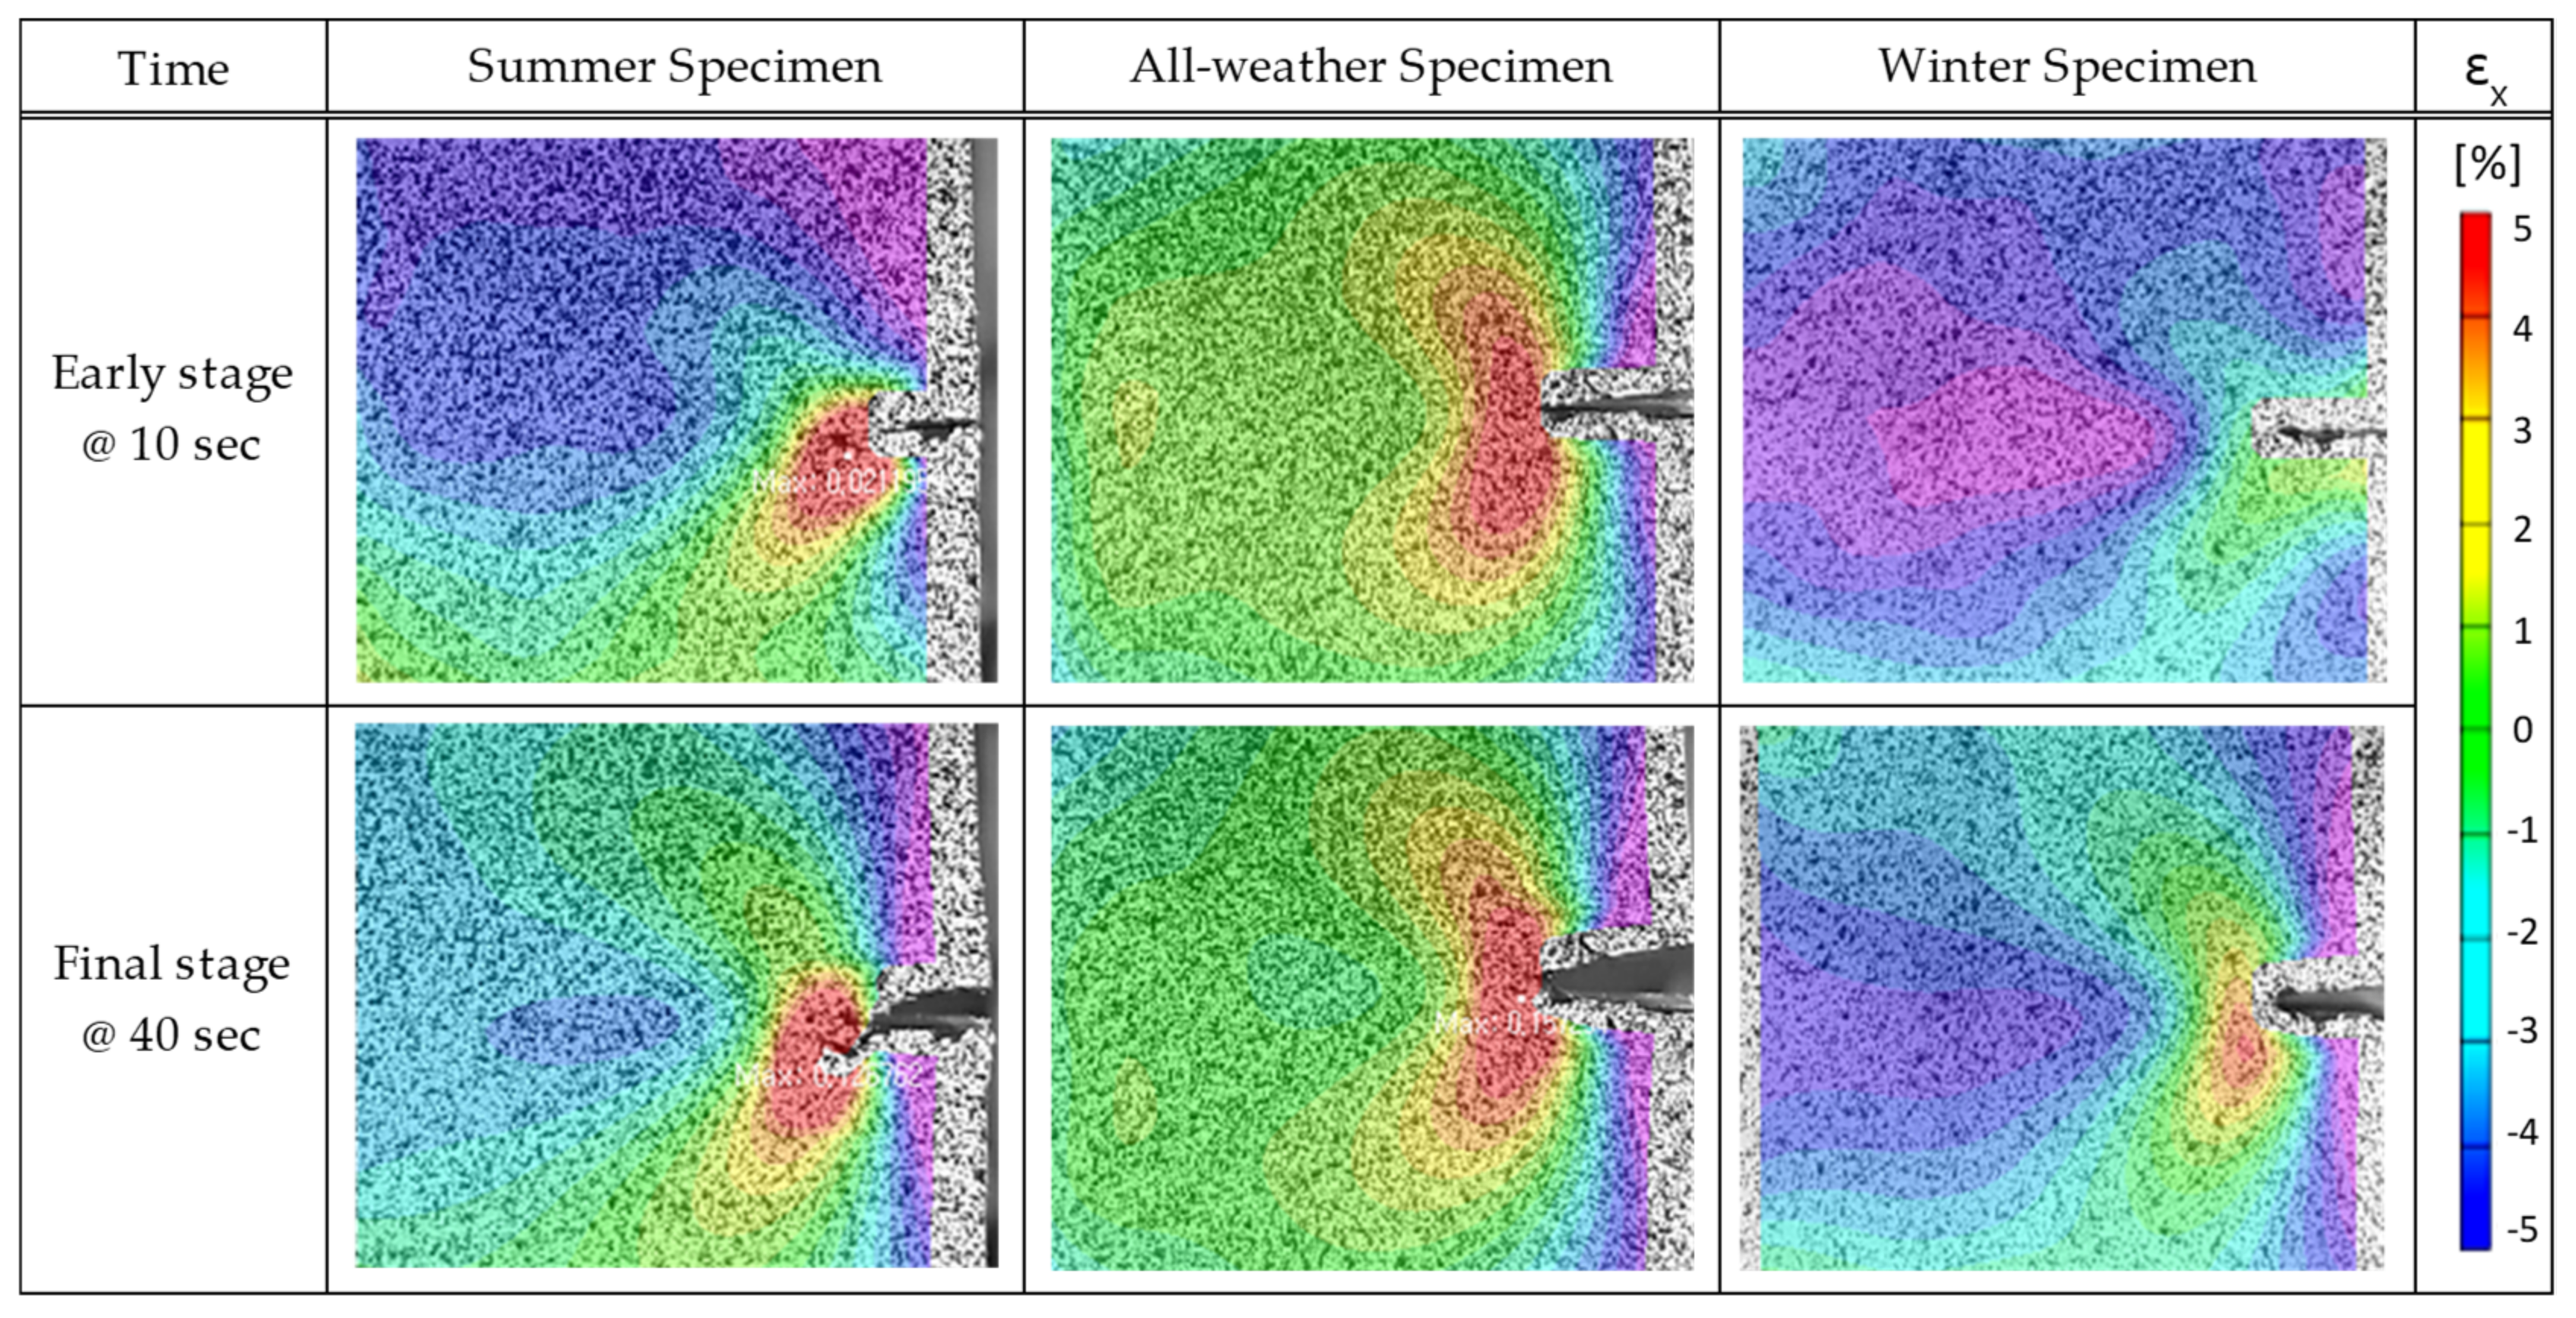
4.4. Strain Energy Distribution
Figure 11 and
Figure 12 show the strain distributions over time of the change in the fracture progression region for each material at the speeds of 5 mm/min and 50 mm/min, the two types of test conditions, using digital image correlations. The maximum strain field in the fracture progression region was a plastic region shape based on general yield and had a shape similar to the strain shape of mode I in the open displacement of metal materials [
18]. However, the strain shape of the viscoelastic material, a particle-strengthening composite material such as tire rubber, appeared to assume the overall elastic strain shape rather than plastic deformation when a certain level of stress was applied.
The following characteristics were observed under the low-speed condition of the test speed of 5 mm/min in
Figure 11.
In the case of the summer specimens, the strain was smaller than that of the all-weather specimen. Although it was not in the form of the maximum strain field, it could be seen that the maximum strain field was formed at the end of the crack. Due to the high hardness and elongation, sufficient resilience was generated at the low speed of 5 mm/min, which delayed the expansion of strain, resulting in a smaller destruction area compared to all weather.
In the case of the all-weather specimens, the maximum plane strain among the strain shapes was observed from the beginning of the test over the entire area because the hardness of rubber was lower than that of summer and winter specimens. It was relatively enlarged compared to the summer and winter specimens. Since the resilience, which is one of the characteristics of viscoelastic objects, was easily offset due to its low hardness, the destruction progress area expanded from the beginning for the all-weather specimen than for the summer and winter specimens. This means that when the fracture began to occur, the deformation in the all-weather specimen began to occur at the fastest rate.
In the case of the winter specimens, the compound comprised a composition ratio that was completely different from that of the summer and all-weather specimens; thus, the progress shape of the destruction area was greatly different. The strain field of the winter specimen surface was the least deformed of the three specimens. However, the strain was less than that of the summer specimens, and the shape of the generated strain field showed the shape of the maximum elastic strain. Therefore, when a crack occurred, the rate of growth slowed down.
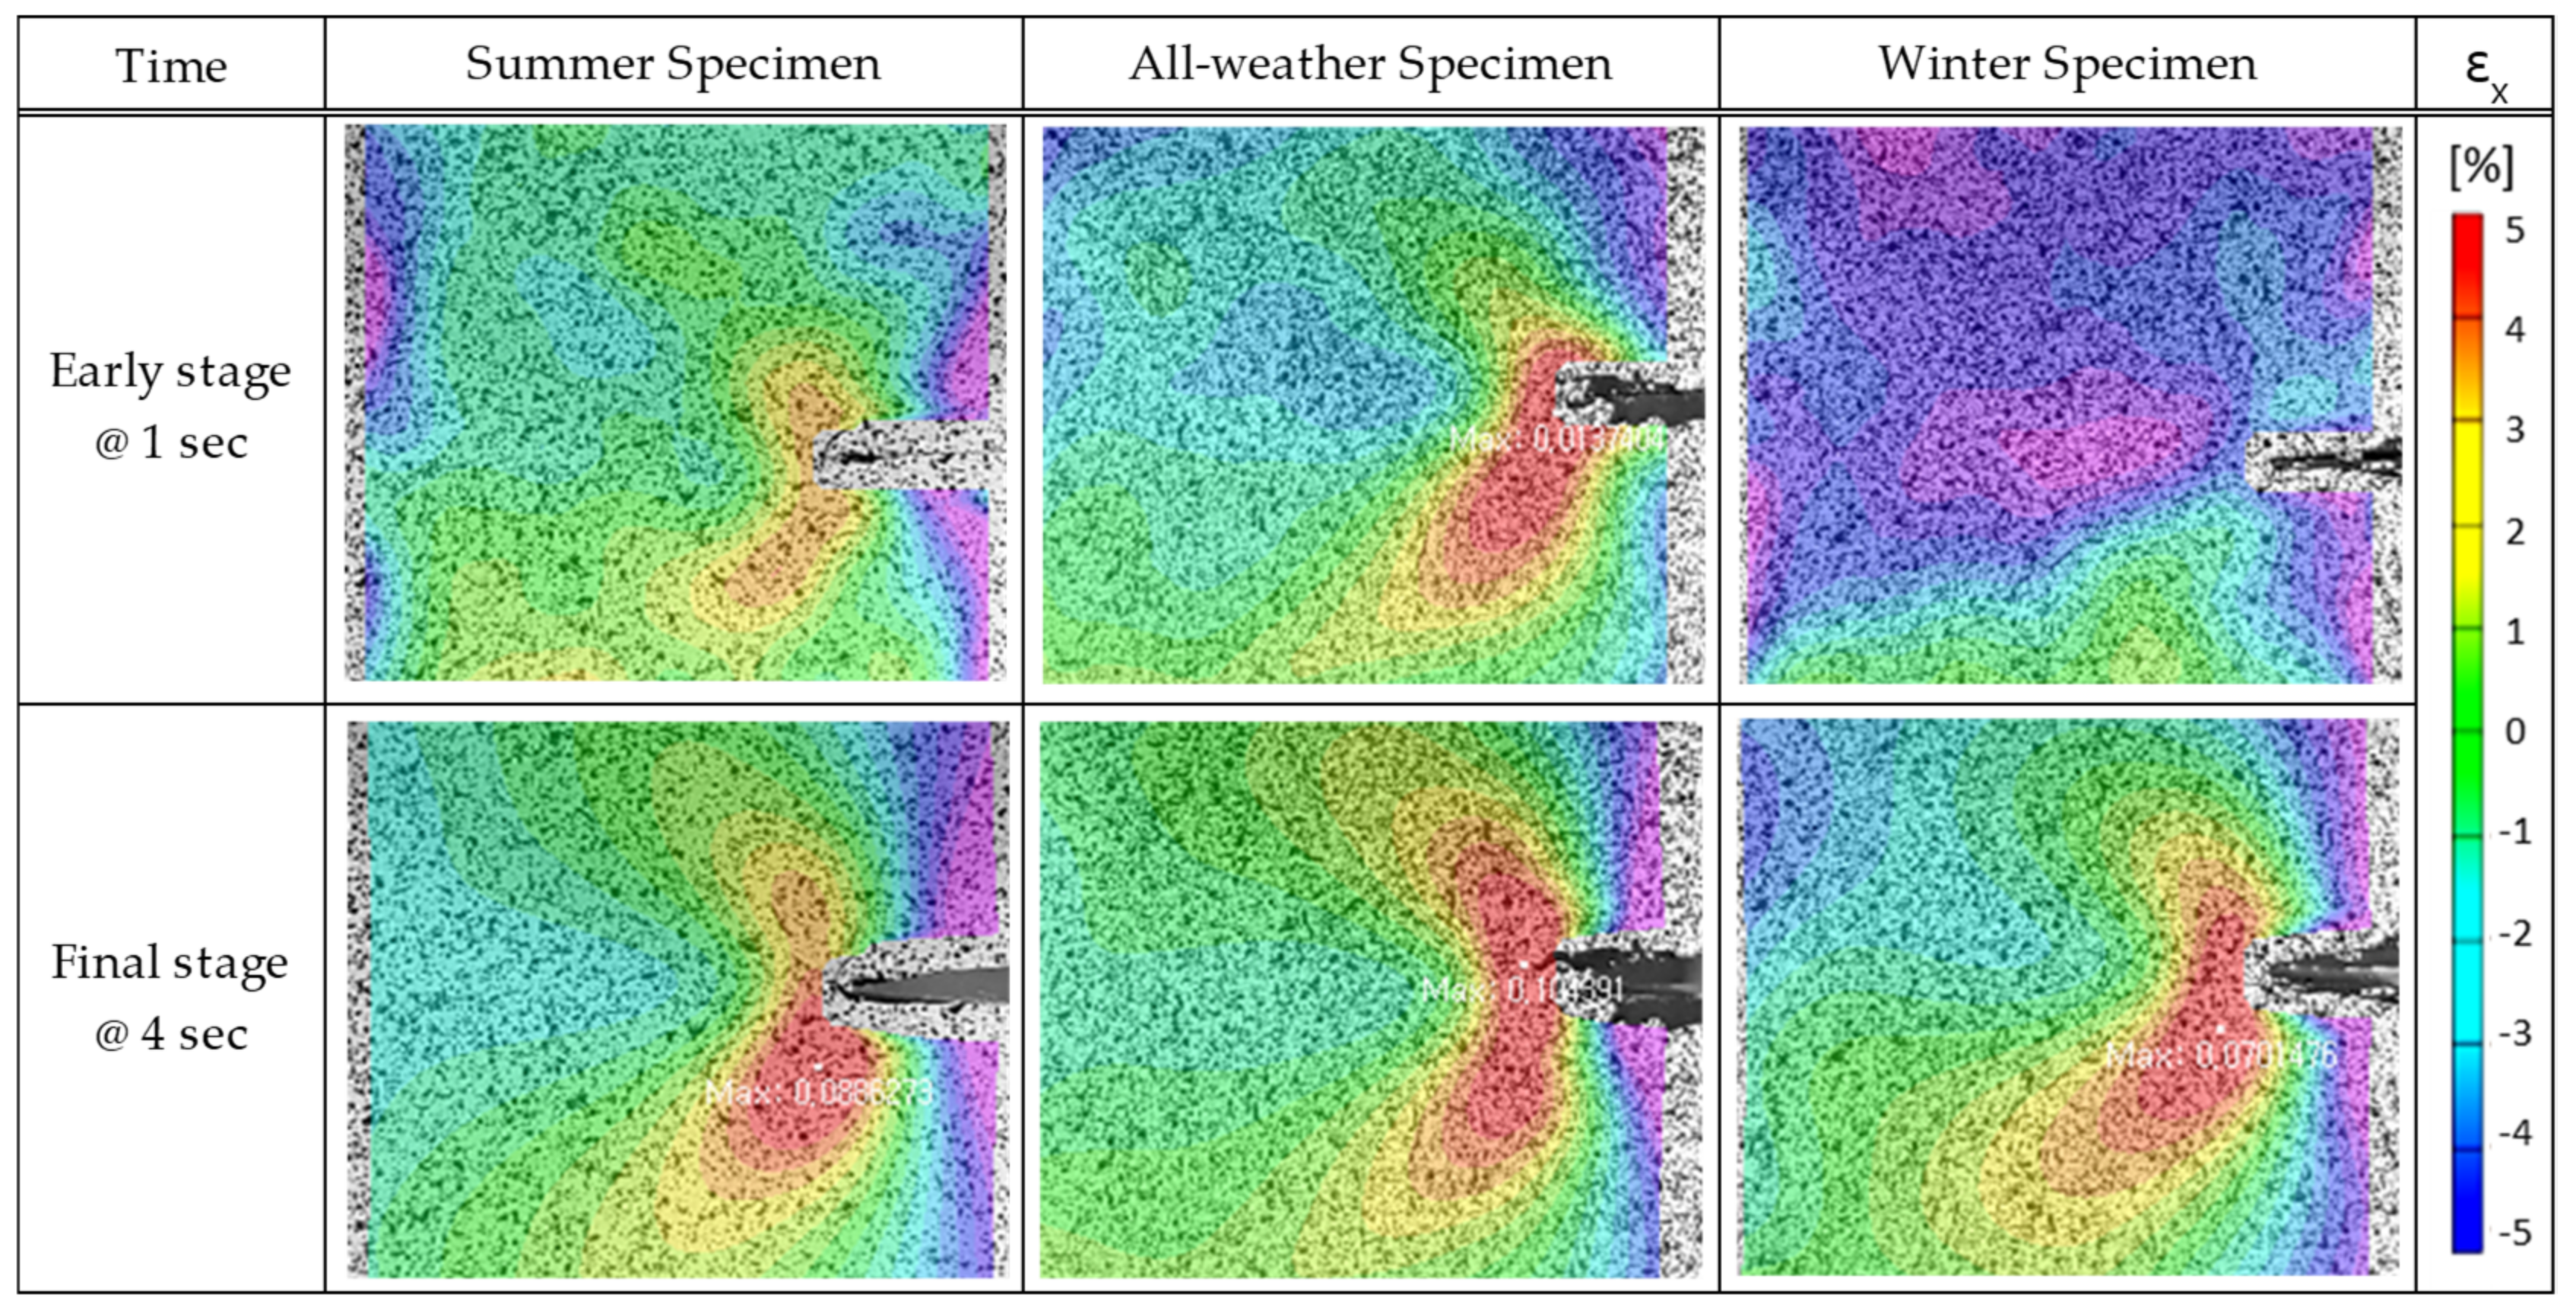
The high-speed test conditions of 50 mm/min in
Figure 12 showed a different pattern from the low-speed one. In the case of the summer and all-weather specimens, parallax occurred due to an absolutely lower elongation than in the winter specimens, and the final shapes of all three types of specimens were the same as the maximum strain shapes of the elastic strain. In other words, the strain field expanded to the maximum before the stress relaxation behavior or resilience occurred due to the influence of speed. The following characteristics appeared under the high-speed conditions of 50 mm/min.
In the case of the summer specimen, the results were slightly different from that of the lower speed in that the deformation rate occurred faster compared to the winter specimen. Similar to the summer specimen of low-speed, the strain region tended to grow gradually, i.e., the growth of the crack point was faster than the winter specimen.
In the case of the all-weather specimens, the results obtained were similar to the low-speed conditions. Since the strength of the rubber was low, the elastic deformation rate based on yield was observed over the entire area from the beginning, indicating that the movement at the end of the crack grew relatively fast compared to the other specimens.
In the case of the winter specimen, different results were obtained compared to those obtained under low-speed conditions. First, the strain region shape was larger compared to the low-speed condition, and it changed in the same manner as the elastic strain shape, such as in the summer specimen. In other words, it indicated that the growth rate of the cracks was more likely to increase and destroy the specimen; in particular, it was disadvantageous compared to the speed increase in the summer specimen.
5. Conclusions
In this study, the three types of complexes used had different hardness values, elastic moduli, and elongations depending on the composition ratio. All three types exhibited different mechanical properties.
Since tires are rubber complexes, it is unreasonable to set the tear energy suggested by previous researchers as a fracture parameter from a fractural epidemiological point of view. The following conclusions can be drawn from the results.
- (1)
From the tensile test of the crack specimen, the initial stress values of the summer and all-weather specimens were expected to be higher in the initial elastic region, but the initial stress of the winter specimen was higher. This means that different results were obtained depending on the mechanical properties of the tire rubber.
- (2)
At the low speed of 5 mm/min, which is a chemical crack condition, the CTOD was mainly influenced by the elastic modulus rather than by the hardness and elongation. After the initial elastic region, the elastic modulus and elongation were affected. In addition, the same trend was observed in the CTOA. At the high speed of 50 mm/min, which is a mechanical crack condition, the CTOD was destroyed before the restoring force (which is a rubber characteristic) acted. In other words, the low speed was influenced by the compound, and the high speed was predominantly influenced by the speed.
- (3)
From the fracture progression region observations made through digital image correlation, the maximum strain field of the fracture progression region had a shape similar to the strain shape in the load mode I of destruction. In the low-speed fracture region, the maximum elastic strain field was attained in the order of all-weather, summer, and winter specimens. In the case of low speed, different maximum strain shapes were exhibited due to the mechanical properties of rubber. Even in the high-speed fracture region, the maximum elastic strain field was reached in the order of all-weather, summer, and winter specimens, but unlike in the low-speed condition, the same strain field was shown in all specimens.
Therefore, it could be observed that the tire rubber was vulnerable to speeds that occurred during cracking. In other words, it is believed that chemical cracks can be prevented by considering the CTOD and critical CTOA when developing tread compounds. However, mechanical cracks are difficult to predict only by tuning the characteristics of the compound. Therefore, it is important to ensure sufficient thickness for each part as well as tread thickness when designing tires.
However, not all destructive factors for rubber were identified by these results alone. If studies on repeated loads, e.g., fatigue and compressive forces, such as shocks, are conducted later, rubber that has been pre-verified for destruction from a compound’s development stage can be applied to finished tires and, eventually, safer tires can be developed. In addition, further research will be needed to compare the tread crack characteristics of finished tires by each season.


