Article

The Heritability of Upper Airway Dimensions Using MRI Scans in Twins

1
Medical Imaging Centre, Semmelweis University, 1085 Budapest, Hungary
2
Wythenshawe Hospital, Manchester University NHS Foundation Trust, Manchester M13 9WL, UK
3
Division of Infection, Immunity and Respiratory Medicine, University of Manchester, Manchester M13 9PL, UK
*
Author to whom correspondence should be addressed.
Appl. Sci. 2022, 12(15), 7646; https://doi.org/10.3390/app12157646
Submission received: 17 June 2022 / Revised: 18 July 2022 / Accepted: 26 July 2022 / Published: 29 July 2022
(This article belongs to the Section Applied Biosciences and Bioengineering)

Abstract

:
Introduction: Obstructive sleep apnea (OSA) is a common disorder characterized by the repetitive collapse of the upper airways during sleep, most likely in the oropharyngeal region. Anatomical factors significantly contribute to the disease development; however, the heritability of the upper airway dimensions, which lead to the collapsibility of the upper airways, is less known. In the current study, we aimed to quantify the impact of heritable and environmental factors on the upper airway dimensions in twins using magnetic resonance imaging (MRI). Methods: We completed head and neck MRI imaging on 110 (66 monozygotic and 44 dizygotic, age median and Q1–Q3: 53 (44–63.75) years) adult twins from the Hungarian Twin Registry. We completed cephalometric, soft tissue and fatty tissue space measurements on T1- and T2-weighted images in sagittal, coronal and axial planes. For the analysis of the genetic and environmental, the determination of the measured parameters was performed with an ACE twin statistical model. Results: We found a strong genetic determination in the anteroposterior diameter of the tongue and the thickness of the submental fatty tissue of the neck. Other parameters of the tongue, soft palate and uvula have shown moderate heritability, while we found strong environmental determination in the thickness of the parapharyngeal fatty tissue, the thickness of the pharyngeal wall, and the smallest diameter of the posterior upper airways. Conclusion: Our twin study can help better understand the genetic and environmental background of anatomical structures involved in the development of sleep apnea.

1. Introduction

Obstructive sleep apnea (OSA) is a chronic disorder which is caused by the repetitive collapse of the upper airways during sleep [1]. It is the most common sleep-related breathing disorder affecting 36 million—1 billion people between the ages of 30–69 globally [2,3]. Multiple factors may contribute to the development of OSA, most importantly male gender, older age, obesity, and the upper airway anatomy [4,5]. Early diagnosis is important, as the untreated disease is associated with daytime and nighttime symptoms, reduced work performance and driving ability, as well as the development of cardiovascular, metabolic, and mental health disease [6,7]. Polysomnography is the gold-standard test in diagnosis; however, it is a complex procedure requiring highly trained experts; therefore, more simple diagnostic tools have been developed for the screening of OSA. These include the STOP-Bang questionnaire, the No-SAS questionnaire, the Berlin questionnaire, and the modified Mallampati Scores or pulse oximetry [8,9,10]. Imaging modalities, such as cone beam CT, ultrasound, and MRI scans can also help determine the cause of the disease and could reveal treatable traits [9,11,12]. Radiological findings in OSA may include narrowed upper airways, accumulation of soft tissue around the upper airways (fat, muscle, tonsils, lymph nodes), pharyngeal tumor or cyst, anomalies of the tongue, soft palate, and mandible [13].
Studies have shown the important role of genetic factors in the pathogenesis of OSA [2,14,15,16]. Several types of craniofacial abnormalities with genetic origin have been associated with a higher prevalence of OSA, such as syndromic craniosynostosis (Apert, Crouzon, and Pfeiffer syndrome), Treacher Collins syndrome, Pierre Robin syndrome, Down’s syndrome, and achondroplasia [17,18,19,20]. Numerous studies have investigated the familial aggregation of craniofacial morphology in patients with sleep apnea and in healthy subjects, as well as using cephalometric measurements [11]. Recently, a genome-wide association study (GWAS) has identified five loci affecting facial morphology in Europeans [14,21]. Twin studies can help identify the genetic and environmental contributions to different phenotypes and diseases. MZ twins share 100% of their genes, while DZ twin pairs share 50% of their segregating genes [22,23]. Analyzing twins, we have recently reported that OSA is 73% heritable [24].
We hypothesized that the anatomic structures of the upper airways, which are known to contribute to the onset of OSA, may be heritable. In this case, a known family history of OSA could lead to further studies on the development of an early screening protocol in the possibly affected populations. This could also further prove the role of MRI imaging in the diagnosis of OSA by the detection of possibly treatable anatomic structural abnormalities. On the other hand, stronger environmental determination of the measured structures could reveal additional possible options in the treatment of OSA, such as lifestyle changes, new medications, or muscle training. The aim of our study was to investigate the contribution of heritable and environmental factors of the anatomic features of the head and neck region to the development of OSA in a twin study design.

2. Materials and Methods

2.1. Participants

In this study, we examined 110 healthy adult twins from the Hungarian Twin Registry [25,26], 33 MZ and 22 DZ twin pairs who underwent head and neck magnetic resonance imaging (MRI) scans. We collected the medical history of the subjects, and they filled out questionnaires regarding their health and lifestyle information. Participation was voluntary with the inclusion criteria of age above 18 years. We excluded patients with any contraindications for MRI imaging, such as patients with heart pacemakers, a metallic foreign body, especially around the head and neck region, severe claustrophobia, or current pregnancy.

2.2. MR Imaging

MRI scans were obtained in the Medical Imaging Centre of Semmelweis University. We measured the anatomic structures using MRI scans based on previously published study methods [11,27,28,29]. All of the measurements were executed by a well-trained radiologist blinded to the clinical data. The MRI scans were performed at the Medical Imaging Center of Semmelweis University using a Philips Ingenia 1.5 T (Philips, Amsterdam, the Netherlands) machine. The protocol included a 2D T1 weighted and T2 weighted axial, a 3D FLAIR corona, an fMRI, and a diffusion tensor imaging sequence. The scans were obtained from the posterior nasal spine to the level of the hyoid bone. We instructed the patients to breathe calmly through their nose and to try to avoid swallowing or any movement during the examination. We measured the parameters on T1 and T2 sagittal, coronal, and axial planes using Philips IntelliSpace Portal (Philips Healthcare, Best, the Netherlands) DICOM viewer.
The cephalometric parameters were measured in the mid-sagittal plane, such as the sella-nasion-A point (subspinal) (SNA) and sella-nasion-B point (supramental) (SNB) angles and their differences. We also measured the mandibular and hyoid plane distance and the hyoid and cervical tangent distance. (Figure 1) [27,30].
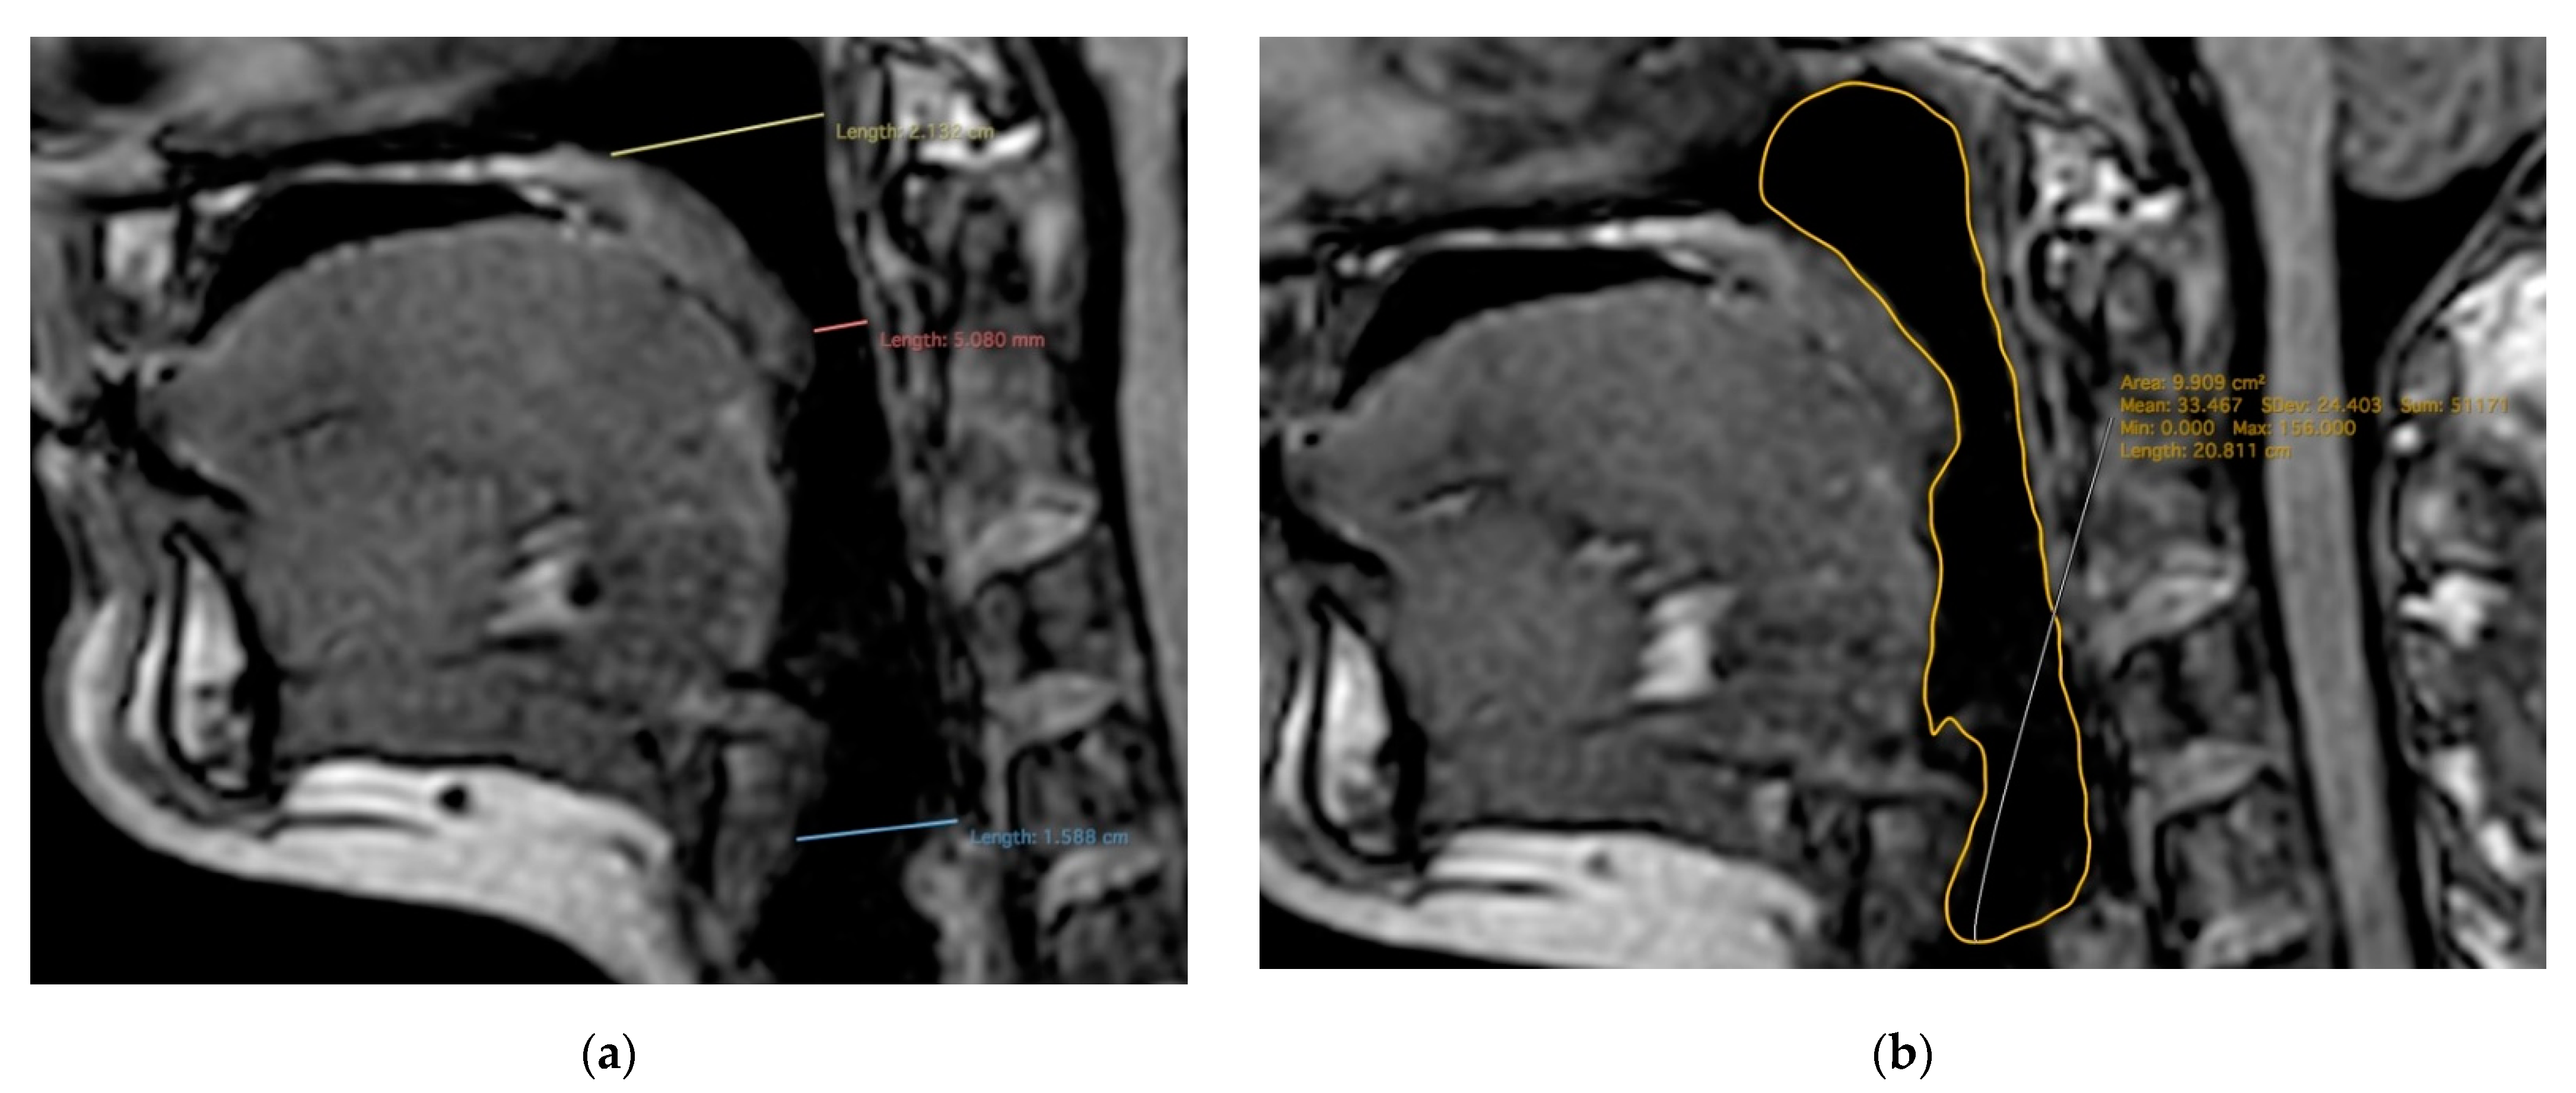
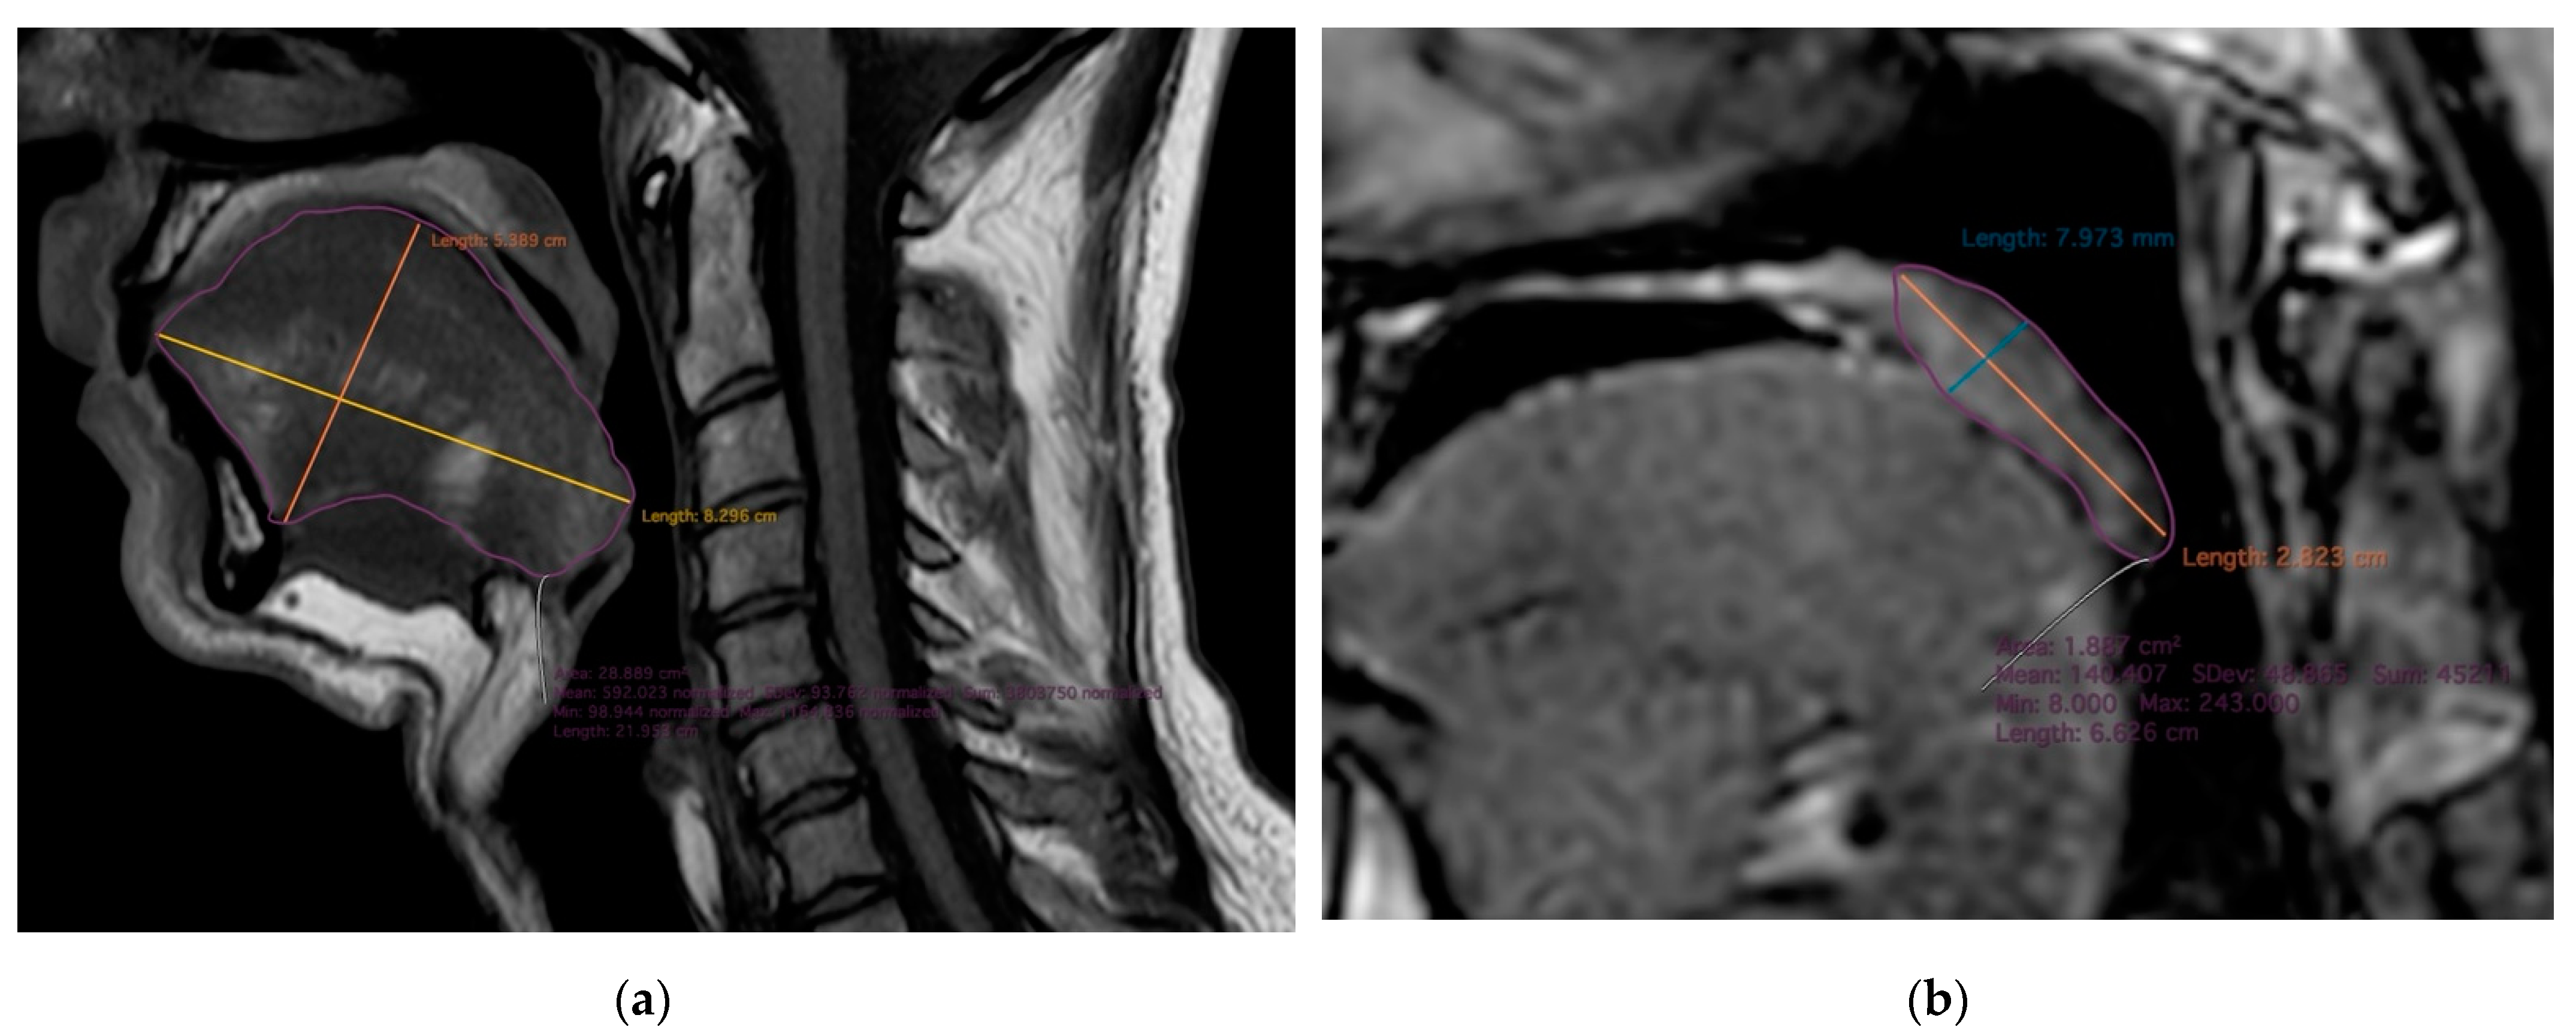
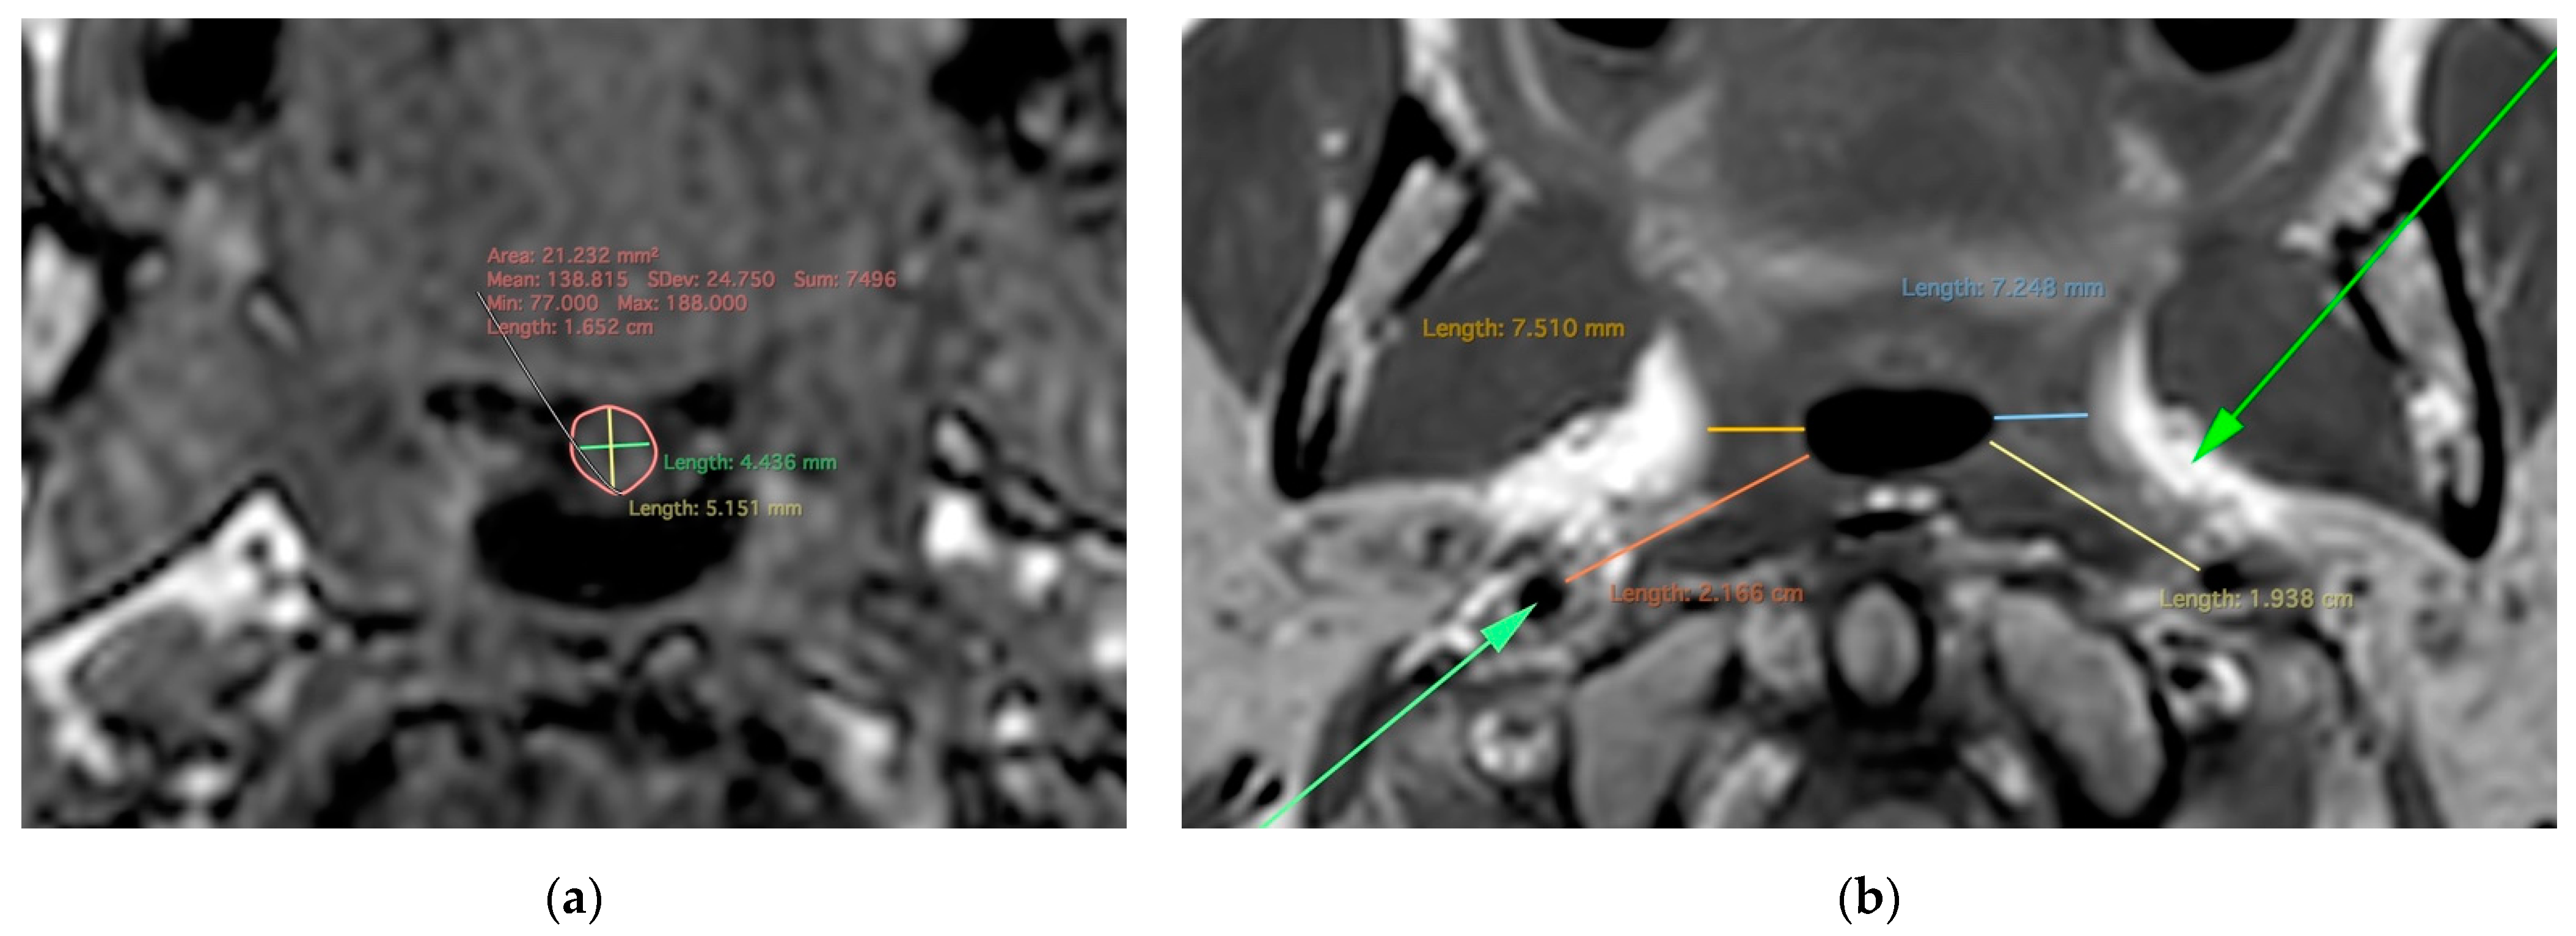
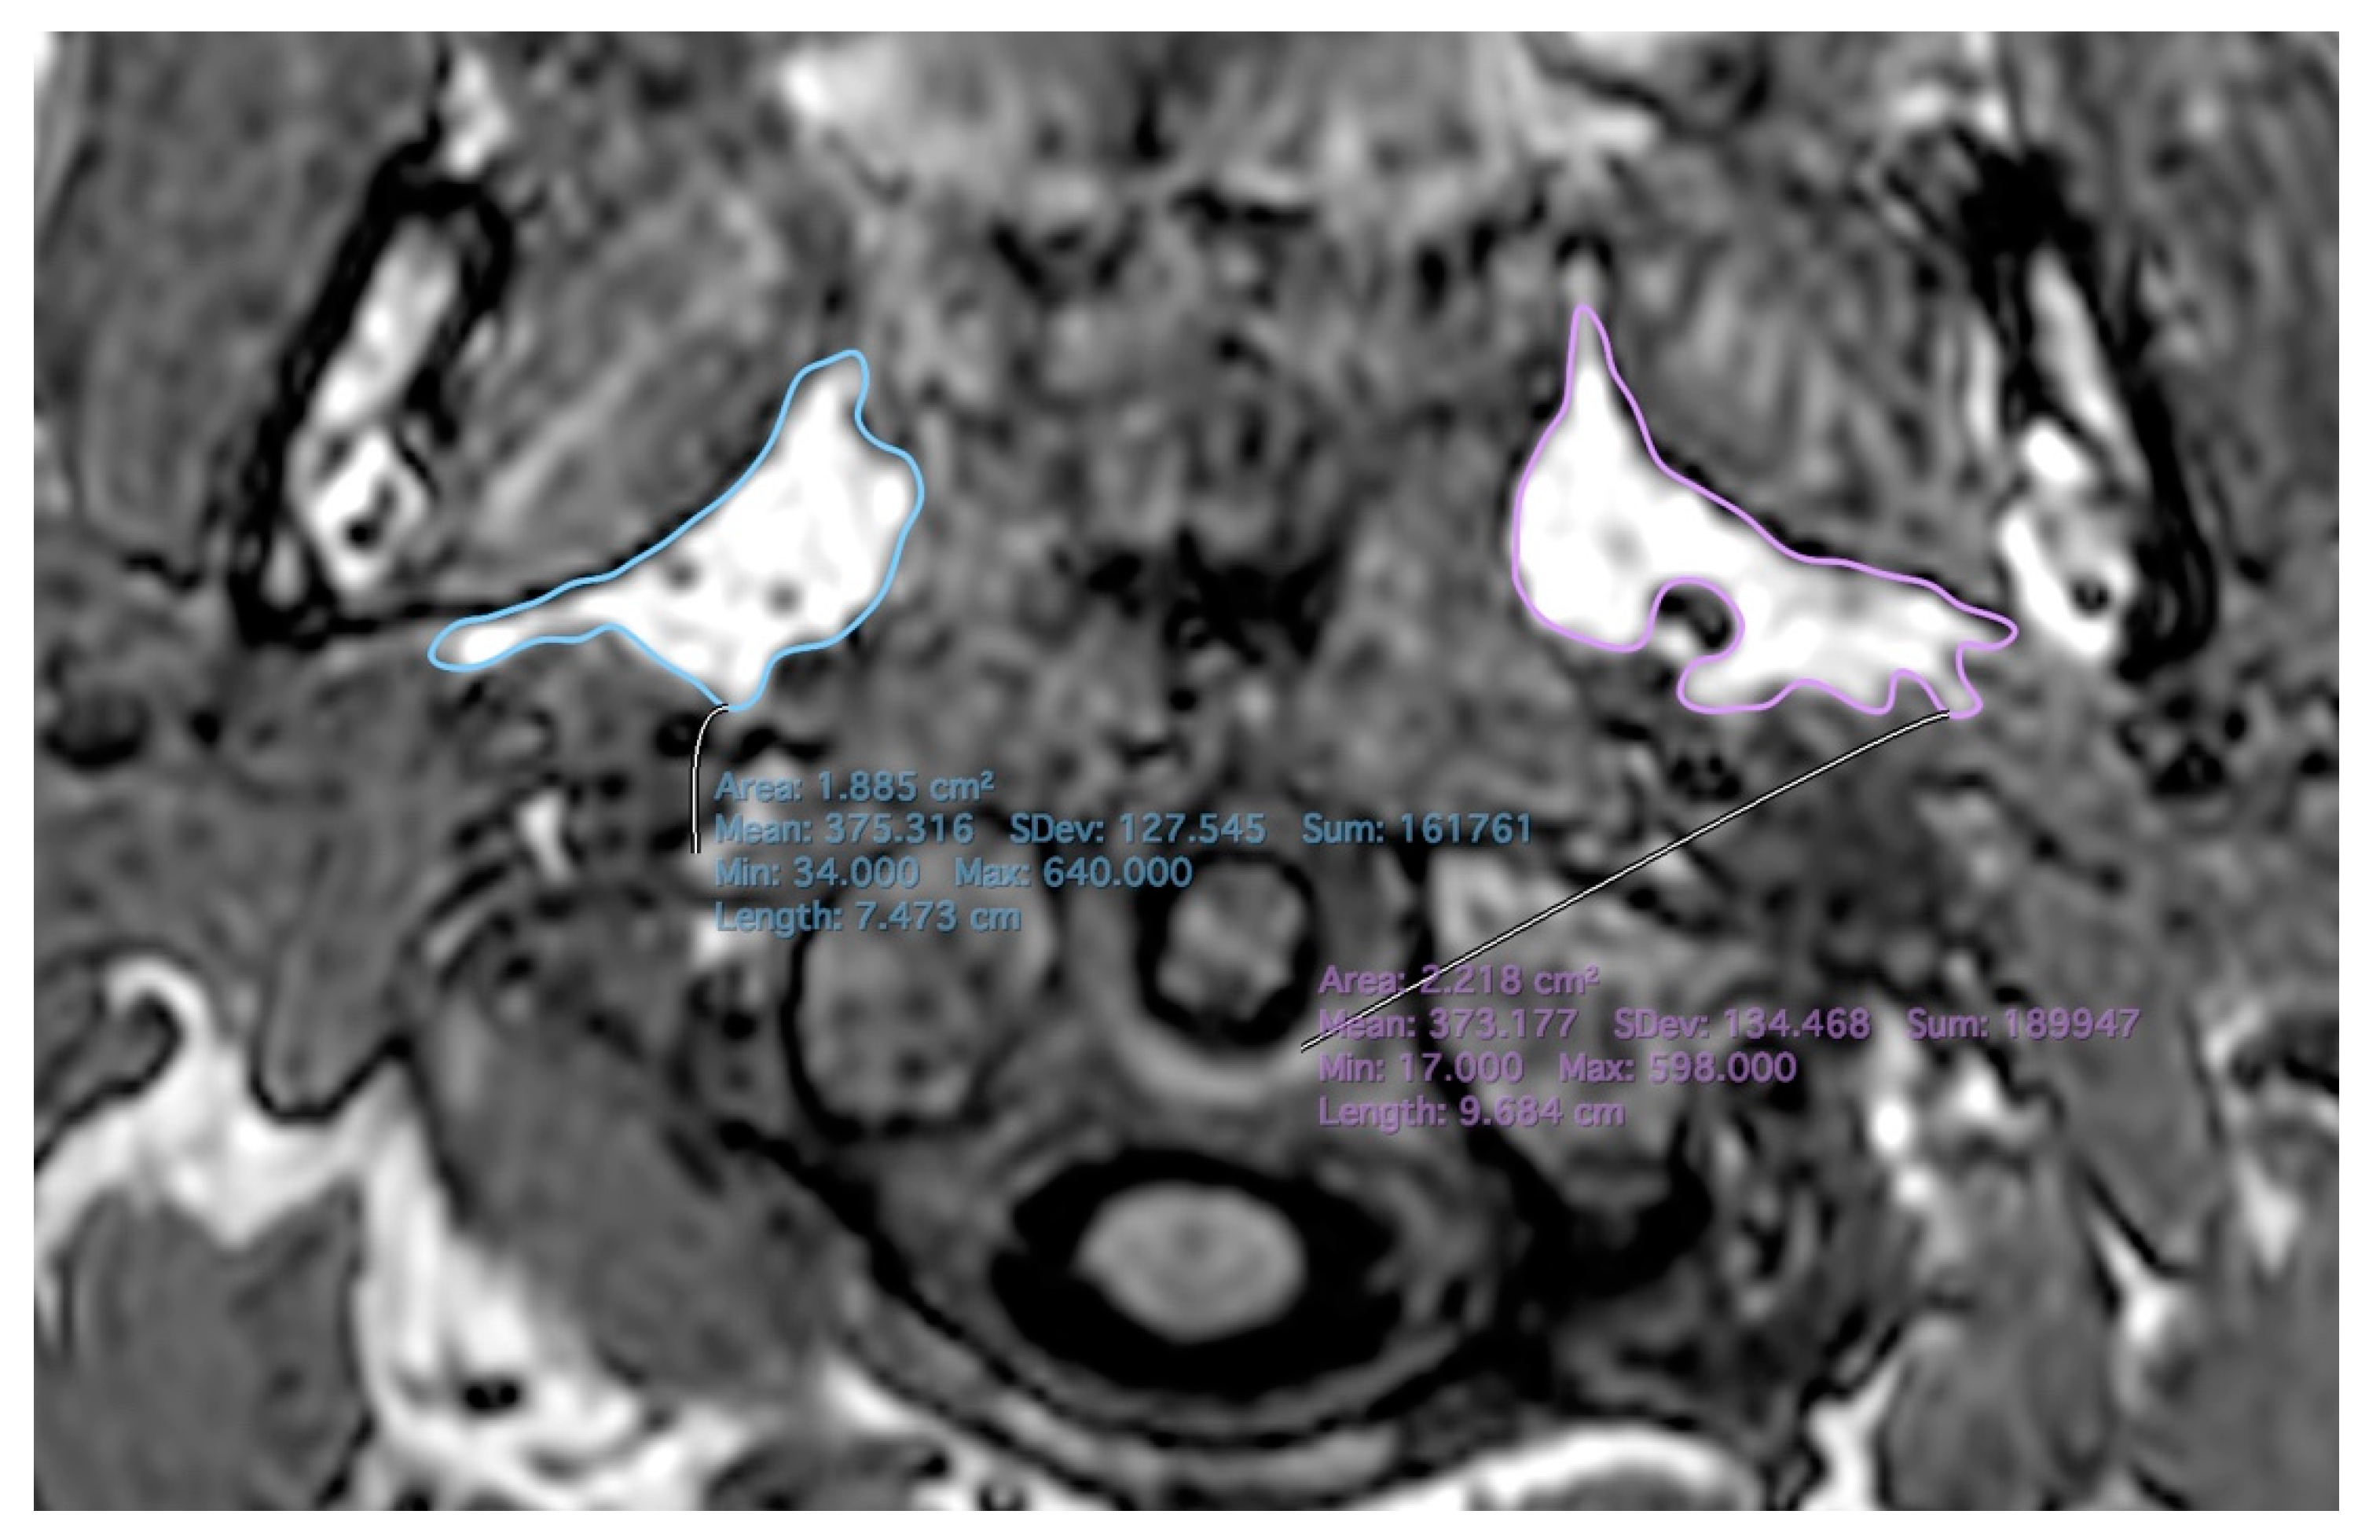
The soft tissue structures were also assessed on the midsagittal plane; we calculated the nasal, occlusal, and mandibular width and the area of the posterior airway space (PAS) [30] (Figure 2). On the same plane, we measured the anteroposterior diameter, thickness, and area of the tongue; we also calculated the maximal axial width of the tongue and calculated a rough approximate volume of the tongue [31] (Figure 3). The length, maximal width, and the area of the soft palate were assessed on the mid-sagittal plane as well, such as the thickness of the uvula (Figure 3). We also measured the width and area of the uvula on the axial plane (Figure 4). After that, we measured the pharyngeal wall thickness from the parapharyngeal fat tissue and from the internal carotid artery as well. We determined the largest extent of the parapharyngeal fat tissue on both sides of their axial plane and calculated their area [32] (Figure 5). We also measured the subcutaneous neck fat tissue thickness as well [1,33].

2.3. Statistical Analysis

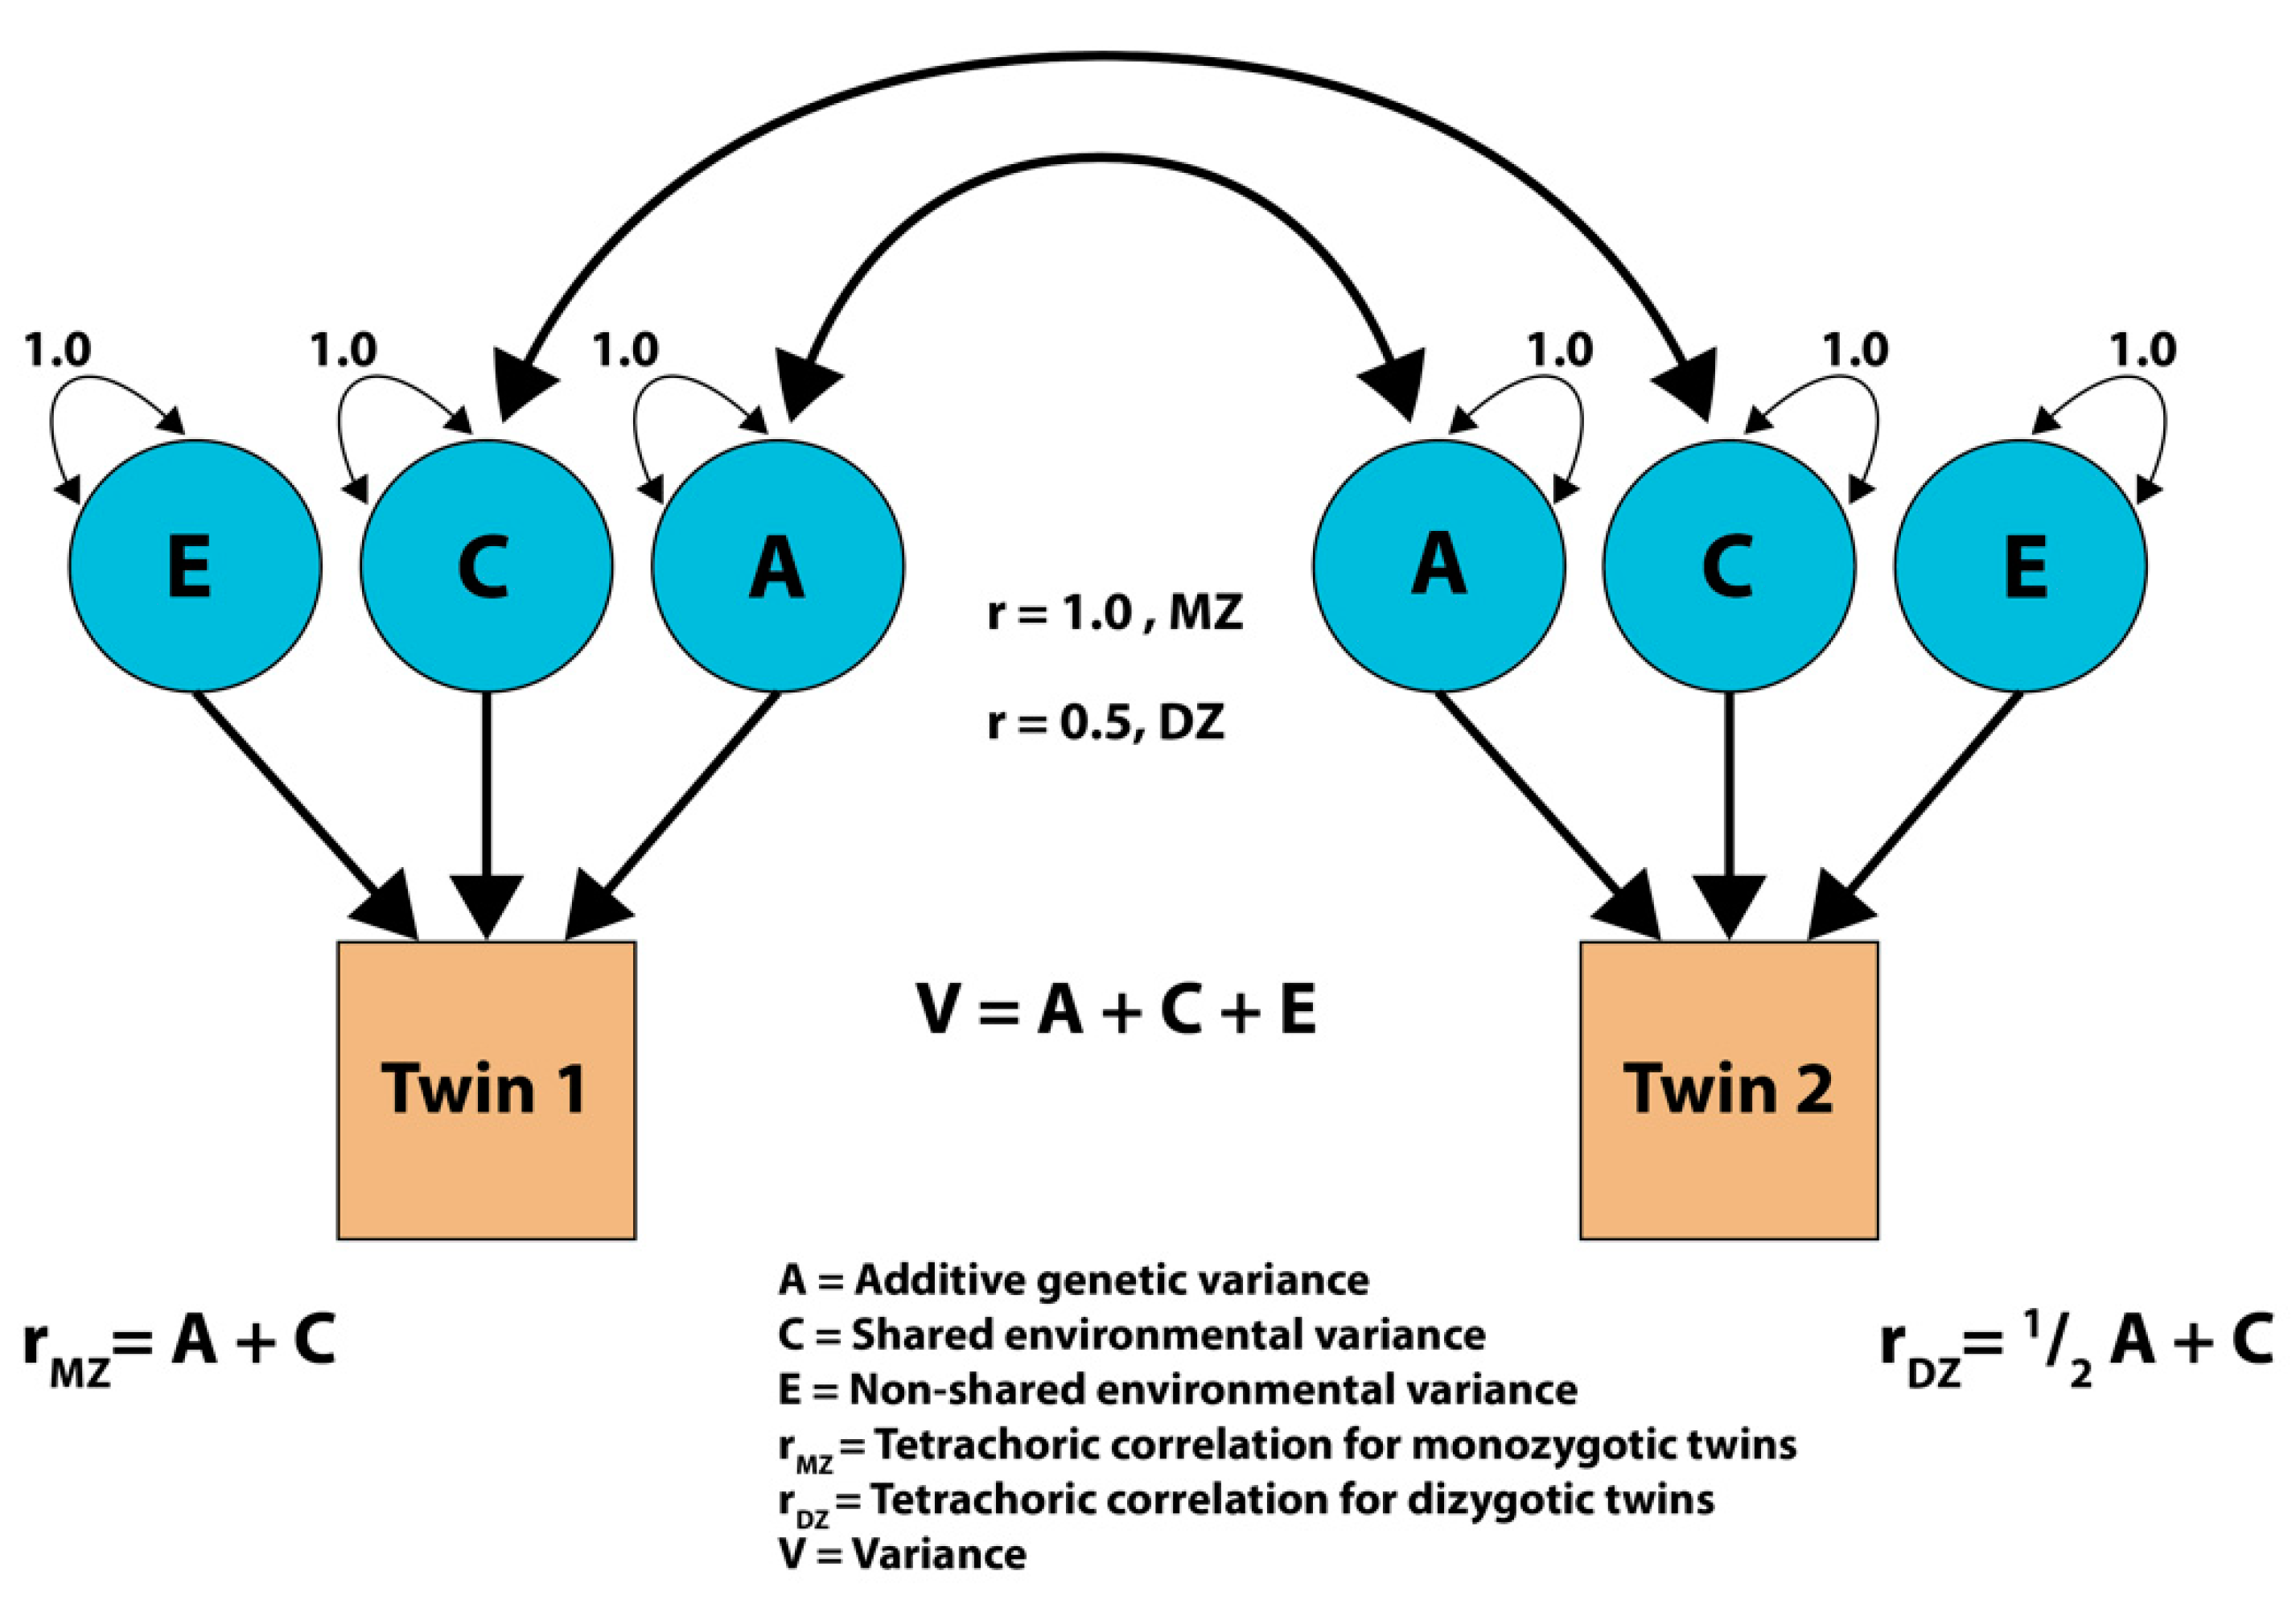
We used the Mann–Whitney U test for the continuous parameters and Fisher’s exact test for contingency parameters to determine any significant differences between the MZ and DZ groups regarding the descriptive data. For the analysis of heritability, we used a classical twin study design. For the estimation of variance, log-transformed values were used for most variables such as mandibular–hyoid distance, hyoid–cervical tangent distance, soft palate length, all measurements of the uvula, tongue volume and area, cervical subcutaneous fat tissue, parapharyngeal adipose tissue areas and pharyngeal wall thickness measured from the fat tissue. Intraclass correlations (within twin pair-correlation coefficients) were calculated to test for the existence of a genetic variance component for each trait; a higher MZ than DZ correlations indicates genetic effects [34]. Then we applied the ACE model to each parameter. This statistical model is a common method used to determine the genetic and environmental background of different phenotypic variations in twin studies. It decomposes the factors into additive genetic variance (A), common or shared environmental factors (C, such as age, socioeconomic status, etc.), and specific or non-shared environmental factors and measurement error (E, factors only affecting one twin, such as diseases or smoking habit) [23,35]. For better visualization, we demonstrate the ACE model as a graphical model (Figure 6). Full ACE model and a series of sub-models were tested regarding each parameter, and to determine the best fitting sub-model, we used the Akaike information criteria (AIC) [36]. Statistical analysis was conducted using R studio, version 1.1.463, and SPSS, version 24 (IBM Corp, Armonk, NY, USA) [37].

3. Results

3.1. Study Population

The descriptive characteristics of the study population (110 twins, age median, and Q1–Q3: 53 (44–63.75) years) are summarized in Table 1. DZ pairs were older (p = 0.002); however, there were no other significant differences between the two groups.

3.2. ACE Model

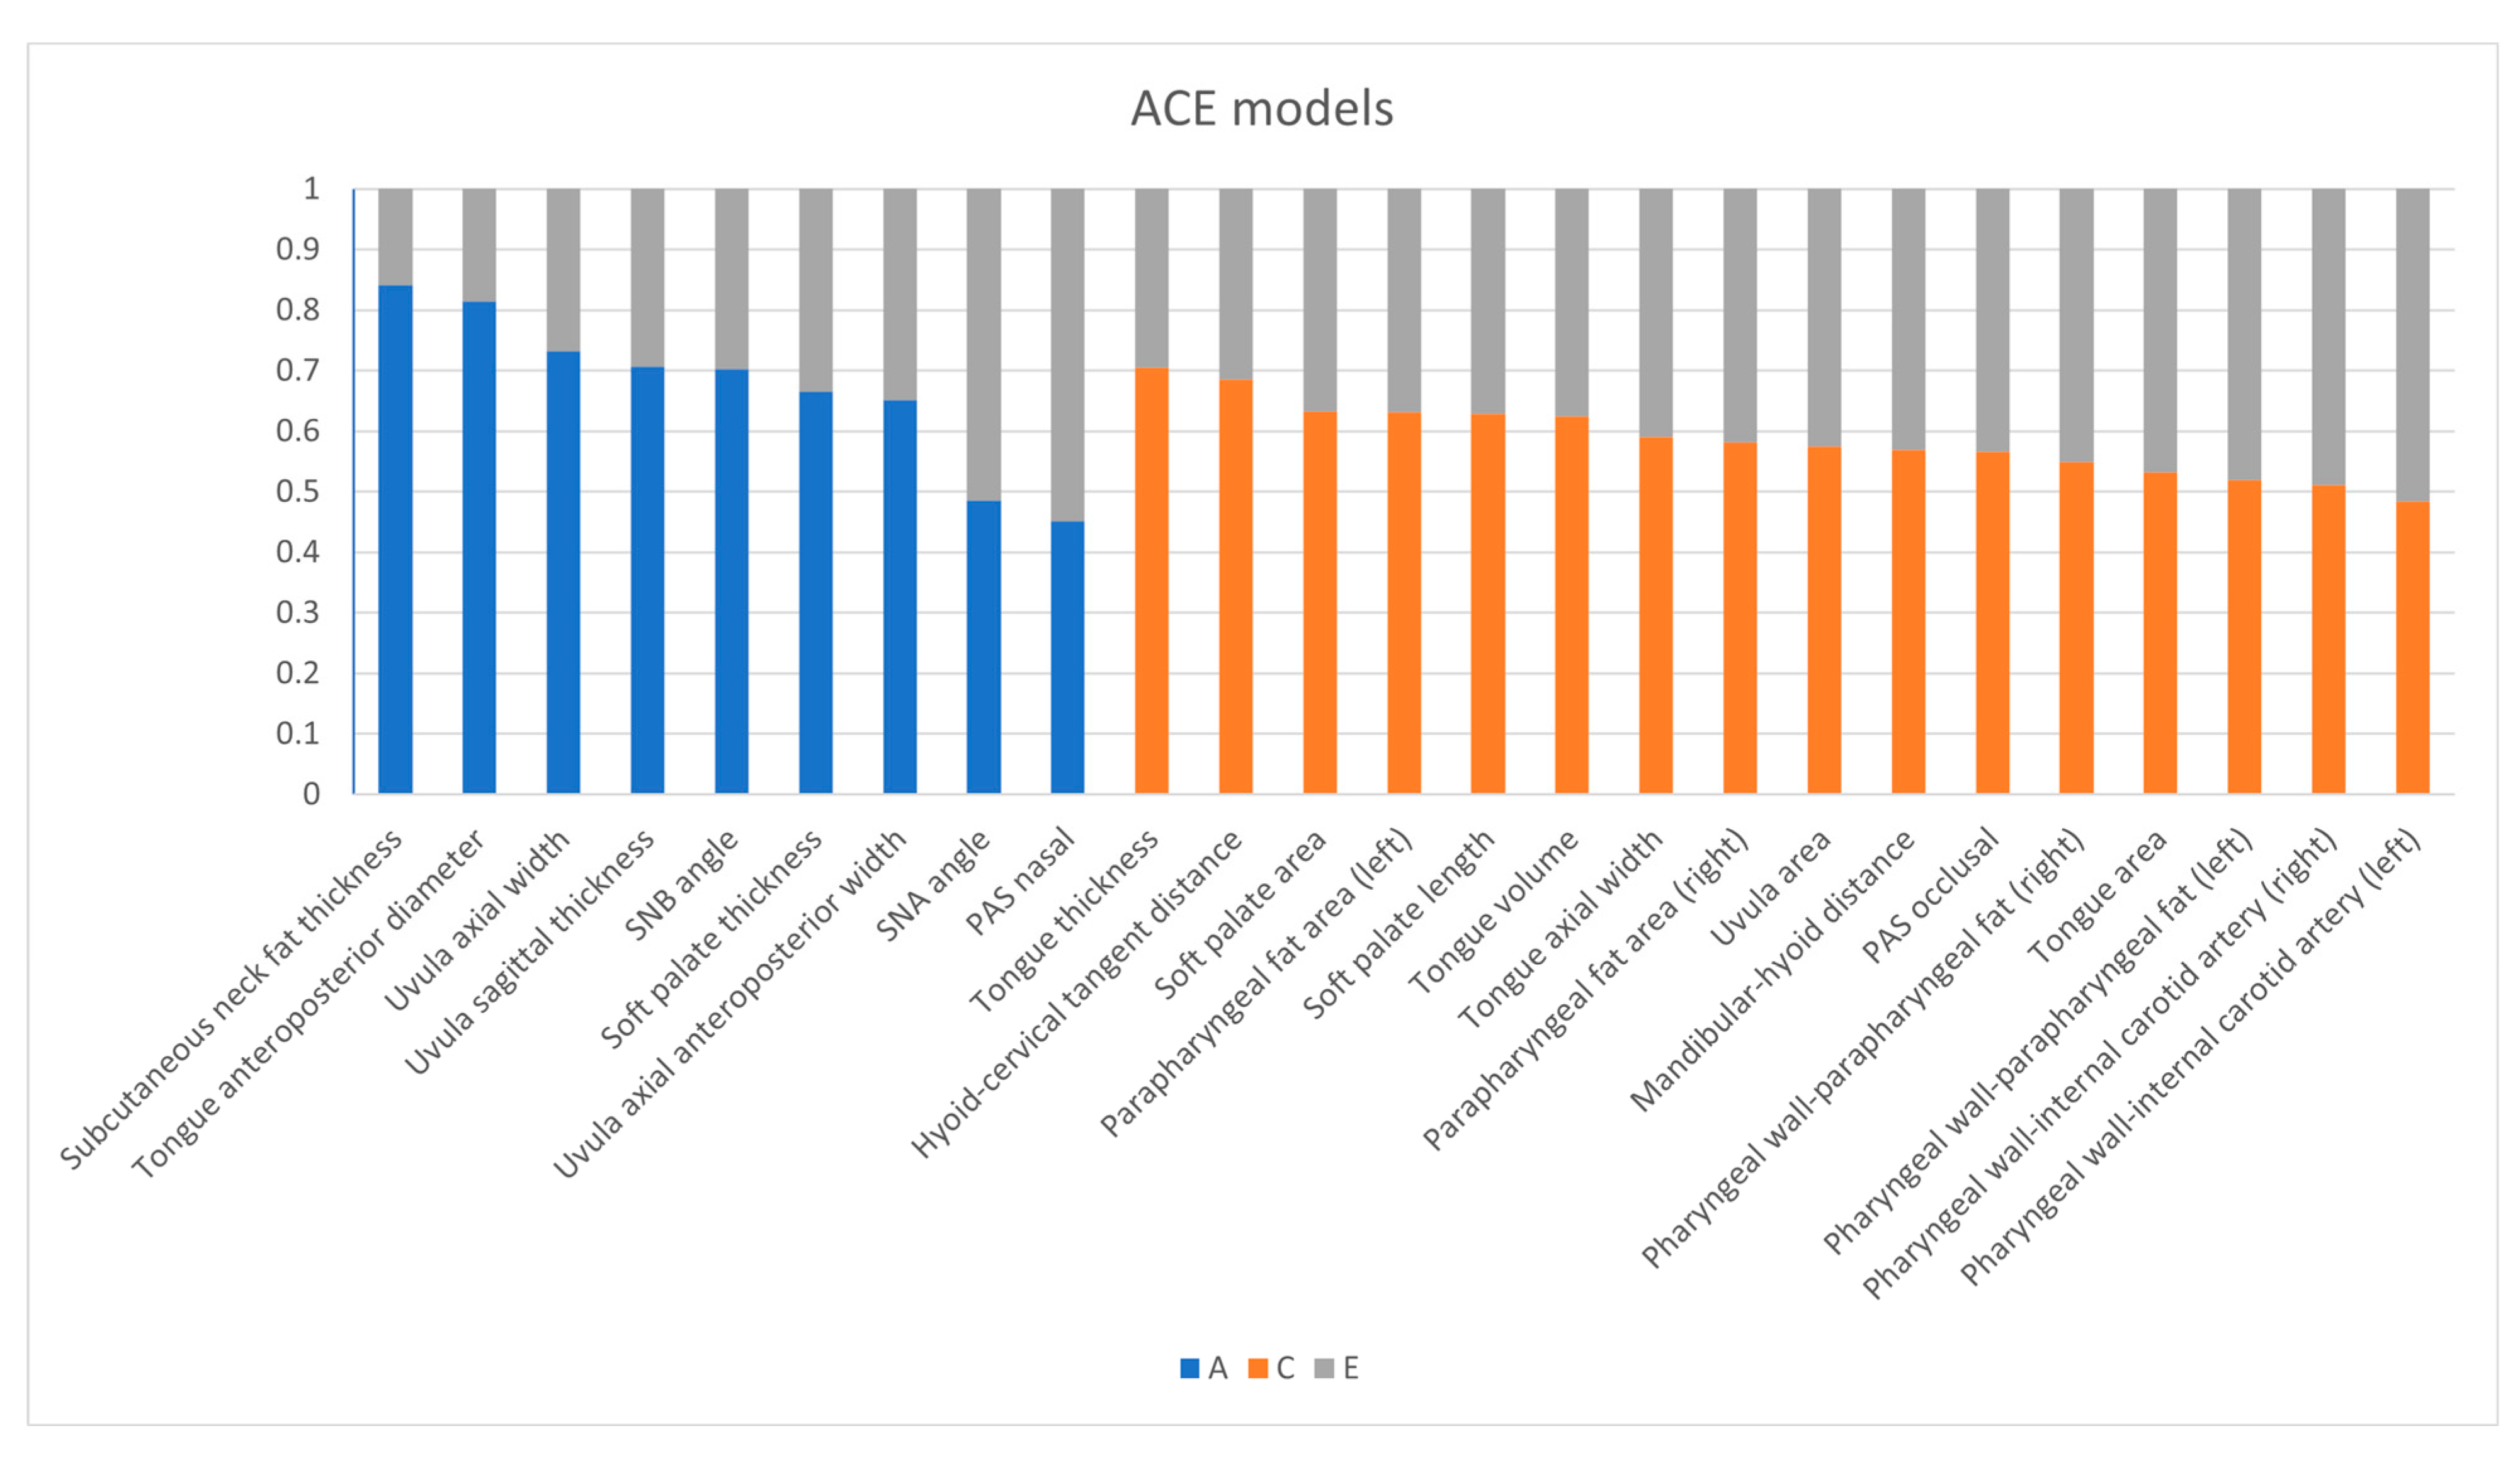
The ACE statistical model of the measurements is summarized in Table 2, with the best fitting sub-model for each parameter. We found a strong heritable component determining subcutan fat-tissue thickness of the neck and tongue anteroposterior diameter. On the other hand, we found a strong environmental contribution to the parapharyngeal adipose tissue area and the pharyngeal wall thickness. The PAS diameter was determined mostly by heritable factors in the nasal region; however, the occlusal thickness of the PAS, which is the narrowest point of the upper airway, was mainly affected by environmental factors. The PAS area had to be eliminated due to distributional problems. The SNA and SNB angles showed both genetic and environmental contributions, with a slightly larger heritable impact regarding the SNB angle. Most parameters of the uvula were also both affected by hereditary and environmental factors except for the area that showed a higher environmental determination. To better visualize the ACE differences between the traits, we demonstrate the distribution of each model from the highest A values to the highest E values in Figure 7.

3.3. MZ-DZ Correlation

The MZ-DZ correlation results are also shown in Table 3. It showed higher rMZ values of the SNA and SNB angles, soft palate length and area, all uvula-connected measurements, nasal and occlusal PAS, and every tongue-related value, especially tongue anteroposterior diameter, subcutaneous neck fat thickness, and the left parapharyngeal fat tissue area; this suggests a higher possibility for heritability for these parameters.

4. Discussion

The present study investigated the heritability of the anatomical markers of OSA on MRI scans. Our main results showed that in our study population, the anteroposterior diameter of the tongue and the neck subcutaneous fat tissue were strongly determined by hereditary influences. The pharyngeal wall thickness and parapharyngeal fat tissue areas were mainly determined by environmental factors.
The collapse of the upper airways during OSA can occur at numerous levels of the nose, nasopharynx, oropharynx, epiglottis, or hypopharynx [38]. There have been several studies investigating the relationship between anatomic features and OSA. Facial skeleton abnormalities of the maxilla and mandibula have been associated with the development of OSA. These bony structure malformations could lead to soft tissue redistribution and pharyngeal airway space reduction [39,40,41]. An inferior and posterior replacement of the hyoid bone has been detected in OSA patients, which could be explained by the mobility of the bone and the caudal expansion of the soft tissue. This leads to instability and the posterior replacement of the tongue, causing airway narrowing [41,42,43]. We found a similar hereditary and environmental determination of the cephalometric parameters. Anatomical abnormalities of the surrounding soft tissues such as lateral pharyngeal walls, tonsils, and tongue are also associated with an increased risk for OSA [44]. Based on our results, the pharyngeal wall thickness was mainly affected by environmental factors. Similarly to us, Reiner et al. found a strong genetic determination regarding tongue AP diameter in mice; meanwhile, the other dimensions of the tongue were mainly affected by environmental factors [45]. In OSA patients, the soft palate tends to appear thicker and has an increased anteroposterior diameter [46,47]. In our study, the dimensions of the soft palate and the uvula were similarly determined by heritable components and environmental factors. Avci et al. considered the retropalatal airway as the most important structure contributing to OSA. They examined 117 male subjects and found that the dimensions of the nasopharynx, the cross-sectional area at the hard palate level, and pharyngeal length were associated with the RP patterns and OSA severity as well [48]. Our study correlates with these findings as we found a strong environmental background behind the narrowest point of the PAS, which is usually in the retropalatal region. The studies investigating tongue anatomy in OSA patients mainly focused on tongue volume, fat distribution, and muscle activity. They found that muscle activity and the muscle fiber distribution of the genioglossus muscle and increased fat tissue in the tongue can affect OSA severity [29,49,50]. Our study indicates that the tongue dimensions may be primarily determined by genetic factors and could be the reason for the high heritability of OSA [29,49,50].
Fat deposition around the tissues of the upper airway could also lead to space reduction [49]. Li et al. aimed to validate the hypothesis that fat tissue accumulation contributes to OSA on 28 subjects and found significantly more fat tissue around the pharyngeal cavity in OSA patients compared to healthy controls [1]. Schwab et al. studied the importance of the lateral parapharyngeal wall in OSA. In their study, the airway narrowing in OSA patients was predominant in the lateral dimension, which was explained by larger pharyngeal walls rather than the enlargement of the parapharyngeal fat tissue [51]. Soares et al. found that the lateral pharyngeal wall and supraglottic airway collapse were associated with OSA surgical failure [52]. In a study on 33 adults by Jang et al., the parapharyngeal fat pad increased with the age and BMI of their study group; they also found that larger fat tissue volume led to the narrowing of the retropalatinal space [53]. Other studies found that the thickening of the soft tissue by fat deposition in the submandibular neck region could also lead to narrowed airways [53,54]. These studies have already indicated the importance of pharyngeal tissue thickness and fat area, and our results suggest that these traits are environmentally determined. This could mean that with appropriate interventions (i.e., diet, pharyngeal muscle training, medications), these factors can be eliminated. On the other hand, we found a strong heritable component regarding the thickness of the subcutaneous neck fat tissue. This could be due to the different anatomical distribution between brown adipose tissue and white adipose tissue. In adults, subcutaneous brown adipose tissue was reported to be found in the anterior neck region but not the parapharyngeal region [55,56]. In addition, studies have reported different gene expressions in the regulation of fat distribution at different anatomical regions, particularly in subcutaneous vs visceral adipose tissue [57,58]. It could suggest that brown adipose tissue and white adipose tissue have different heritable backgrounds.
There are very few family and twin studies currently available regarding OSA markers. Redline et al. examined 272 subjects from 29 families, and their data suggested a significant familial aggregation of symptoms associated with sleep-disordered breathing [59]. Twin and family studies suggest that obesity and craniomorphology are highly determined by genetic contribution [15,60]. Wing et al. found a significant familial aggregation with a high heritability of insomnia disorder in a study based on 75 adults and their 180 relatives [61]. In the Cleveland Family Study, 1802 individuals from 310 families underwent sleep studies and BMI calculations. Based on their study, they found that OSA and obesity shared a substantial genetic basis; however, they suggested the importance of considering both obesity-related and obesity-independent genetic effects [62]. We investigated the heritability of OSA on 71 twin pairs and found a significant genetic determination [24]. Desai et al. found a genetic contribution to the symptomatology of OSA in 933 MZ and 1004 DZ twin pairs using questionnaires [63]. The current study could help us further understand the heritable and environmental components in the development of OSA.
Our study had a few limitations. The accuracy of the measurement highly depends on the radiologist; however, we studied several other publications and trained on several MRI scan series to improve our measurement skills. The scans can be affected by patient cooperation, such as breath-holding during the examination and muscle contraction. We informed our subject before the scanning to limit any movement or posture-induced artifacts. Our study included a relatively small number of patients and involved a 1:2 ratio of male:female participants; meanwhile, OSA is more common in the male population. Unfortunately, polysomnography has not been performed as part of the current study; therefore, the actual contribution of anatomical dimension to OSA development was not investigated.

5. Conclusions

In summary, in this study, we found strong heritability of the anteroposterior diameter of the tongue and the thickness of the submental fatty tissue of the neck. The other parameters of the tongue, soft palate, and uvula have proven to be similarly influenced by genetic and environmental factors, contributing to their anatomical appearance. Meanwhile, we found strong environmental determination in the thickness of the parapharyngeal fatty tissue, the thickness of the pharyngeal wall, as well as the smallest diameter of the posterior upper airways. Our study can help to understand the background of OSA and the possible role of hereditary components in the development of the disease. Further studies are recommended for this subject involving larger sample sizes and more diverse subject groups.

Author Contributions

Conceptualization, Z.J., A.B., D.L.T., A.D.T.; methodology, Z.J., M.S., A.B., D.L.T., A.D.T.; software, Z.J., E.O., M.P.; validation, Z.J., M.S., B.S., E.O., M.P.; formal analysis: M.P.; investigation, Z.J., M.S., B.S., E.O., D.L.T., A.D.T.; resources, I.K., P.M.-H.; data curation, M.P.; writing—original draft preparation, Z.J., A.B.; writing—review and editing, Z.J., M.S., B.S., E.O., M.P., I.K., P.M.-H., A.B., D.L.T., A.D.T.; visualization, Z.J., M.P., A.B.; supervision, A.B., D.L.T., A.D.T.; project administration, D.L.T., A.D.T.; funding acquisition, A.B., D.L.T., A.D.T. All authors have read and agreed to the published version of the manuscript.

Funding

This research received funding from Hungarian Pulmonology Foundation (MPA) and supported by the ÚNKP-20-5 and ÚNKP-21-5 New National Excellence Program of the Ministry for Innovation and Technology from the source of the National Research, Development and Innovation Fund. Andras Bikov is supported by the NIHR Manchester BRC.

Institutional Review Board Statement

The study was conducted according to the guidelines of the Declaration of Helsinki and approved by the Institutional Review Board (TUKEB 30/2014 and 189/2014).

Informed Consent Statement

Informed consent was obtained from all subjects involved in the study.

Data Availability Statement

Data supporting reported results can be provided upon request.

Acknowledgments

We would like to acknowledge the help of additional medical and PhD students of Semmelweis University in the study.

Conflicts of Interest

The authors declare no conflict of interest.

References

  1. Li, Y.; Lin, N.; Ye, J.; Chang, Q.; Han, D.; Sperry, A. Upper Airway Fat Tissue Distribution in Subjects With Obstructive Sleep Apnea and Its Effect on Retropalatal Mechanical Loads. Respir. Care 2012, 57, 1098–1105. [Google Scholar] [CrossRef] [PubMed] [Green Version]
  2. Villaneuva, A.T.C.; Buchanan, P.R.; Yee, B.J.; Grunstein, R.R. Ethnicity and obstructive sleep apnoea. Sleep Med. Rev. 2005, 9, 419–436. [Google Scholar] [CrossRef] [PubMed]
  3. Peppard, P.E.; Young, T.; Barnet, J.H.; Palta, M.; Hagen, E.W.; Hla, K.M. Increased Prevalence of Sleep-Disordered Breathing in Adults. Am. J. Epidemiol. 2013, 177, 1006–1014. [Google Scholar] [CrossRef] [Green Version]
  4. Locke, A.E.; Kahali, B.; Berndt, S.I.; Justice, A.E.; Pers, T.H.; Day, F.R.; Powell, C.; Vedantam, S.; Buchkovich, M.L.; Yang, J.; et al. Genetic studies of body mass index yield new insights for obesity biology. Nature 2015, 518, 197–206. [Google Scholar] [CrossRef] [Green Version]
  5. Redline, S.; Kump, K.; Tishler, P.V.; Browner, I.; Ferrette, V. Gender differences in sleep disordered breathing in a community-based sample. Am. J. Respir. Crit. Care Med. 1994, 149, 722–726. [Google Scholar] [CrossRef] [PubMed]
  6. Madrid-Valero, J.J.; Barclay, N.L.; Rowe, R.; Perach, R.; Buysse, D.J.; Ordoñana, J.R.; Eley, T.C.; Gregory, A.M. Association between symptoms of sleep apnea and problem behaviors in young adult twins and siblings. Psychol. Med. 2020, 51, 1175–1182. [Google Scholar] [CrossRef]
  7. Shahar, E.; Whitney, C.W.; Redline, S.; Lee, E.T.; Newman, A.B.; Javier Nieto, F.; O’CONNOR, G.T.; Boland, L.L.; Schwartz, J.E.; Samet, J.M. Sleep-disordered breathing and cardiovascular disease: Cross-sectional results of the Sleep Heart Health Study. Am. J. Respir. Crit. Care Med. 2001, 163, 19–25. [Google Scholar] [CrossRef] [PubMed] [Green Version]
  8. Małolepsza, A.; Kudrycka, A.; Karwowska, U.; Hoshino, T.; Wibowo, E.; Böjti, P.P.; Białas, A.; Kuczyński, W. The Role of Screening Questionnaires in the Assessment of Risk and Severity of Obstructive Sleep apnea—Polysomnography Versus Polygraphy. Adv. Respir. Med. 2021, 89, 188–196. [Google Scholar] [CrossRef]
  9. Dalewski, B.; Kamińska, A.; Syrico, A.; Kałdunska, A.; Pałka, Ł.; Sobolewska, E. The Usefulness of Modified Mallampati Score and CT Upper Airway Volume Measurements in Diagnosing OSA among Patients with Breathing-Related Sleep Disorders. Appl. Sci. 2021, 11, 3764. [Google Scholar] [CrossRef]
  10. Lonia, L.; Scalese, M.; Rossato, G.; Bruno, G.; Zalunardo, F.; De Stefani, A.; Gracco, A. Validity of the STOP-Bang Questionnaire in Identifying OSA in a Dental Patient Cohort. Medicina 2020, 56, 324. [Google Scholar] [CrossRef] [PubMed]
  11. Schwab, R.J.; Pasirstein, M.; Pierson, R.; Mackley, A.; Hachadoorian, R.; Arens, R.; Maislin, G.; Pack, A.I. Identification of Upper Airway Anatomic Risk Factors for Obstructive Sleep Apnea with Volumetric Magnetic Resonance Imaging. Am. J. Respir. Crit. Care Med. 2003, 168, 522–530. [Google Scholar] [CrossRef] [PubMed]
  12. Whyte, A.; Gibson, D. Imaging of adult obstructive sleep apnoea. Eur. J. Radiol. 2018, 102, 176–187. [Google Scholar] [CrossRef] [PubMed]
  13. Mello Junior, C.F.D.; Guimarães Filho, H.A.; Gomes, C.A.D.B.; Paiva, C.C.D.A. Radiological findings in patients with obstructive sleep apnea. Jornal Brasileiro Pneumologia 2013, 39, 98–101. [Google Scholar] [CrossRef] [PubMed] [Green Version]
  14. Mukherjee, S.; Saxena, R.; Palmer, L. The genetics of obstructive sleep apnoea. Respirology 2017, 23, 18–27. [Google Scholar] [CrossRef] [Green Version]
  15. Patel, S.R.; Frame, J.M.; Larkin, E.K.; Redline, S. Heritability of upper airway dimensions derived using acoustic pharyngometry. Eur. Respir. J. 2008, 32, 1304–1308. [Google Scholar] [CrossRef] [PubMed] [Green Version]
  16. Strohl, K.P.; Saunders, N.A.; Feldman, N.T.; Hallett, M. Obstructive Sleep Apnea in Family Members. N. Engl. J. Med. 1978, 299, 969–973. [Google Scholar] [CrossRef]
  17. Onodera, K.; Niikuni, N.; Chigono, T.; Nakajima, I.; Sakata, H.; Motizuki, H. Sleep disordered breathing in children with achondroplasia. Int. J. Pediatr. Otorhinolaryngol. 2006, 70, 453–461. [Google Scholar] [CrossRef]
  18. Rachmiel, A.; Emodi, O.; Aizenbud, D. Management of obstructive sleep apnea in pediatric craniofacial anomalies. Ann. Maxillofac. Surg. 2012, 2, 111–115. [Google Scholar] [CrossRef] [PubMed] [Green Version]
  19. Marcus, C.L.; Keens, T.G.; Bautista, D.B.; Von Pechmann, W.S.; Ward, S.L. Obstructive sleep apnea in children with Down syndrome. Pediatrics 1991, 88, 132–139. [Google Scholar] [CrossRef]
  20. Driessen, C.; Joosten, K.F.M.; Bannink, N.; Bredero-Boelhouwer, H.H.; Hoeve, H.L.J.; Wolvius, E.B.; Rizopoulos, D.; Mathijssen, I.M.J. How does obstructive sleep apnoea evolve in syndromic craniosynostosis? A prospective cohort study. Arch. Dis. Child. 2013, 98, 538–543. [Google Scholar] [CrossRef]
  21. Chi, L.; Comyn, F.-L.; Keenan, B.T.; Cater, J.; Maislin, G.; Pack, A.I.; Schwab, R.J. Heritability of Craniofacial Structures in Normal Subjects and Patients with Sleep Apnea. Sleep 2014, 37, 1689–1698. [Google Scholar] [CrossRef] [PubMed] [Green Version]
  22. Polderman, T.J.C.; Benyamin, B.; de Leeuw, C.A.; Sullivan, P.F.; Van Bochoven, A.; Visscher, P.M.; Posthuma, D. Meta-analysis of the heritability of human traits based on fifty years of twin studies. Nat. Genet. 2015, 47, 702–709. [Google Scholar] [CrossRef] [Green Version]
  23. Verweij, K.J.H.; Mosing, M.A.; Zietsch, B.P.; Medland, S.E. Estimating Heritability from Twin Studies. Methods Mol. Biol. 2011, 850, 151–170. [Google Scholar] [CrossRef]
  24. Szily, M.; Tarnoki, A.D.; Tarnoki, D.L.; Kovacs, D.T.; Forgo, B.; Lee, J.; Kim, E.; Sung, J.; Kunos, L.; Meszaros, M.; et al. Genetic influences on the onset of obstructive sleep apnoea and daytime sleepiness: A twin study. Respir. Res. 2019, 20, 1–6. [Google Scholar] [CrossRef] [PubMed]
  25. Littvay, L.; Métneki, J.; Tarnoki, A.D.; Tarnoki, D.L. The Hungarian Twin Registry. Twin Res. Hum. Genet. 2012, 16, 185–189. [Google Scholar] [CrossRef] [PubMed] [Green Version]
  26. Tarnoki, A.D.; Tarnoki, D.L.; Forgo, B.; Szabo, H.; Melicher, D.; Metneki, J.; Littvay, L. The Hungarian Twin Registry Update: Turning From a Voluntary to a Population-Based Registry. Twin Res. Hum. Genet. 2019, 22, 561–566. [Google Scholar] [CrossRef] [PubMed]
  27. Chi, L.; Comyn, F.-L.; Mitra, N.; Reilly, M.P.; Wan, F.; Maislin, G.; Chmiewski, L.; Thorne-FitzGerald, M.D.; Victor, U.N.; Pack, A.I.; et al. Identification of craniofacial risk factors for obstructive sleep apnoea using three-dimensional MRI. Eur. Respir. J. 2011, 38, 348–358. [Google Scholar] [CrossRef]
  28. Liu, S.Y.C.; Huon, L.K.; Lo, M.T.; Chang, Y.C.; Capasso, R.; Chen, Y.J.; Shih, T.T.F.; Wang, P.C. Static craniofacial measurements and dynamic airway collapse patterns associated with severe obstructive sleep apnoea: A sleep MRI study. Clin. Otolaryngol. 2016, 41, 700–706. [Google Scholar] [CrossRef]
  29. Kim, A.M.; Keenan, B.T.; Jackson, N.; Chan, E.L.; Staley, B.; Poptani, H.; Torigian, D.A.; Pack, A.I.; Schwab, R.J. Tongue Fat and its Relationship to Obstructive Sleep Apnea. Sleep 2014, 37, 1639–1648. [Google Scholar] [CrossRef] [Green Version]
  30. Cosentini, T.; Le Donne, R.; Mancini, D.; Colavita, N. Magnetic resonance imaging of the upper airway in obstructive sleep apnea. Radiol. Med. 2004, 108, 404–416. [Google Scholar]
  31. Iida-Kondo, C.; Yoshino, N.; Kurabayashi, T.; Mataki, S.; Hasegawa, M.; Kurosaki, N. Comparison of tongue volume/oral cavity volume ratio between obstructive sleep apnea syndrome patients and normal adults using magnetic resonance imaging. J. Med. Dent. Sci. 2006, 53, 119–126. [Google Scholar] [PubMed]
  32. Shelton, K.E.; Woodson, H.; Gay, S.; Suratt, P.M. Pharyngeal Fat in Obstructive Sleep Apnea. Am. Rev. Respir. Dis. 1993, 148, 462–466. [Google Scholar] [CrossRef] [PubMed]
  33. Turnbull, C.D.; Wang, S.H.; Manuel, A.R.; Keenan, B.T.; McIntyre, A.G.; Schwab, R.J.; Stradling, J.R. Relationships between MRI fat distributions and sleep apnea and obesity hypoventilation syndrome in very obese patients. Sleep Breath. 2017, 22, 673–681. [Google Scholar] [CrossRef] [PubMed] [Green Version]
  34. Neale, M. Mx: Statistical Modeling, 6th ed.; Virginia Commonwealth University: Richmond, VA, USA, 2004. [Google Scholar]
  35. Maes, H.H. ACE Model. In Encyclopedia of Statistics in Behavioral Science; Wiley: New York, NY, USA, 2005. [Google Scholar]
  36. Dziak, J.J.; Coffman, D.L.; Lanza, S.T.; Li, R.; Jermiin, L.S. Sensitivity and specificity of information criteria. Briefings Bioinform. 2019, 21, 553–565. [Google Scholar] [CrossRef]
  37. Wang, X.; Guo, X.; He, M.; Zhang, H. Statistical Inference in Mixed Models and Analysis of Twin and Family Data. Biometrics 2011, 67, 987–995. [Google Scholar] [CrossRef] [PubMed] [Green Version]
  38. Tan, S.N.; Yang, H.C.; Lim, S.C. Anatomy and Pathophysiology of Upper Airway Obstructive Sleep Apnoea: Review of the Current Literature. Sleep Med. Res. 2021, 12, 1–8. [Google Scholar] [CrossRef]
  39. Johal, A.; Patel, S.I.; Battagel, J.M. The relationship between craniofacial anatomy and obstructive sleep apnoea: A case-controlled study. J. Sleep Res. 2007, 16, 319–326. [Google Scholar] [CrossRef] [PubMed]
  40. Battagel, J.M.; Johal, A.; Kotecha, B. A cephalometric comparison of subjects with snoring and obstructive sleep apnoea. Eur. J. Orthod. 2000, 22, 353–365. [Google Scholar] [CrossRef] [PubMed]
  41. Tsuiki, S.; Isono, S.; Ishikawa, T.; Yamashiro, Y.; Tatsumi, K.; Nishino, T. Anatomical Balance of the Upper Airway and Obstructive Sleep Apnea. Anesthesiology 2008, 108, 1009–1015. [Google Scholar] [CrossRef] [Green Version]
  42. Tsai, H.-H.; Ho, C.-Y.; Lee, P.-L.; Tan, C.-T. Cephalometric Analysis of Nonobese Snorers Either with or Without Obstructive Sleep Apnea Syndrome. Angle Orthod. 2007, 77, 1054–1061. [Google Scholar] [CrossRef] [PubMed] [Green Version]
  43. Riha, R.L.; Brander, P.; Vennelle, M.; Douglas, N.J. A Cephalometric Comparison of Patients With the Sleep Apnea/Hypopnea Syndrome and Their Siblings. Sleep 2005, 28, 315–320. [Google Scholar] [CrossRef] [PubMed]
  44. Schellenberg, J.B.; Maislin, G.; Schwab, R.J. Physical Findings and the Risk for Obstructive Sleep Apnea. Am. J. Respir. Crit. Care Med. 2000, 162, 740–748. [Google Scholar] [CrossRef] [PubMed] [Green Version]
  45. Reiner, D.J.; Jan, T.A.; Boughter, J.J.D.; Li, C.-X.; Lu, L.; Williams, R.W.; Waters, R.S. Genetic Analysis of Tongue Size and Taste Papillae Number and Size in Recombinant Inbred Strains of Mice. Chem. Senses 2008, 33, 693–707. [Google Scholar] [CrossRef] [Green Version]
  46. Pinto, G.N.D.S.; Filho, L.I.; Previdelli, I.T.D.S.; Ramos, A.L.; Yamashita, A.L.; Stabile, G.A.V.; Stabile, C.L.P.; Iwaki, L.C.V. Three-dimensional alterations in pharyngeal airspace, soft palate, and hyoid bone of class II and class III patients submitted to bimaxillary orthognathic surgery: A retrospective study. J. Cranio-Maxillofacial Surg. 2019, 47, 883–894. [Google Scholar] [CrossRef]
  47. Kurt, G.; Sisman, C.; Akin, E.; Akcam, T. Cephalometric Comparison of Pharyngeal Airway in Snoring and Non-Snoring Patients. Eur. J. Dent. 2011, 05, 084–088. [Google Scholar] [CrossRef] [Green Version]
  48. Avci, S.; Lakadamyali, H.; Lakadamyali, H.; Aydin, E.; Tekindal, M.A. Relationships among retropalatal airway, pharyngeal length, and craniofacial structures determined by magnetic resonance imaging in patients with obstructive sleep apnea. Sleep Breath. 2018, 23, 103–115. [Google Scholar] [CrossRef] [PubMed]
  49. Ono, T. Tongue and upper airway function in subjects with and without obstructive sleep apnea. Jpn. Dent. Sci. Rev. 2012, 48, 71–80. [Google Scholar] [CrossRef] [Green Version]
  50. Eckert, D.J.; White, D.P.; Jordan, A.S.; Malhotra, A.; Wellman, A. Defining Phenotypic Causes of Obstructive Sleep Apnea. Identification of Novel Therapeutic Targets. Am. J. Respir. Crit. Care Med. 2013, 188, 996–1004. [Google Scholar] [CrossRef] [Green Version]
  51. Schwab, R.J.; Gupta, K.B.; Gefter, W.B.; Metzger, L.J.; Hoffman, E.; Pack, A. Upper airway and soft tissue anatomy in normal subjects and patients with sleep-disordered breathing. Significance of the lateral pharyngeal walls. Am. J. Respir. Crit. Care Med. 1995, 152, 1673–1689. [Google Scholar] [CrossRef]
  52. Soares, D.; Sinawe, H.; Folbe, A.J.; Yoo, G.; Badr, S.; Rowley, J.A.; Lin, H.-S. Lateral oropharyngeal wall and supraglottic airway collapse associated with failure in sleep apnea surgery. Laryngoscope 2012, 122, 473–479. [Google Scholar] [CrossRef]
  53. Jang, M.-S.; Kim, H.Y.; Dhong, H.-J.; Chung, S.-K.; Hong, S.D.; Cho, H.-J.; Jung, T.-Y. Effect of Parapharyngeal Fat on Dynamic Obstruction of the Upper Airway in Patients with Obstructive Sleep Apnea. Am. J. Respir. Crit. Care Med. 2014, 190, 1318–1321. [Google Scholar] [CrossRef]
  54. Isono, S. Obesity and obstructive sleep apnoea: Mechanisms for increased collapsibility of the passive pharyngeal airway. Respirology 2011, 17, 32–42. [Google Scholar] [CrossRef]
  55. Sacks, H.; Symonds, M.E. Anatomical locations of human brown adipose tissue: Functional relevance and implications in obesity and type 2 diabetes. Diabetes 2013, 62, 1783–1790. [Google Scholar] [CrossRef] [PubMed] [Green Version]
  56. Cypess, A.M.; Lehman, S.; Williams, G.; Tal, I.; Rodman, D.; Goldfine, A.B.; Kuo, F.C.; Palmer, E.L.; Tseng, Y.-H.; Doria, A.; et al. Identification and Importance of Brown Adipose Tissue in Adult Humans. N. Engl. J. Med. 2009, 360, 1509–1517. [Google Scholar] [CrossRef] [PubMed] [Green Version]
  57. Schleinitz, D.; Böttcher, Y.; Blüher, M.; Kovacs, P. The genetics of fat distribution. Diabetologia 2014, 57, 1276–1286. [Google Scholar] [CrossRef] [PubMed]
  58. Pravenec, M.; Saba, L.M.; Zídek, V.; Landa, V.; Mlejnek, P.; Šilhavý, J.; Simakova, M.; Strnad, H.; Trnovská, J.; Skop, V.; et al. Systems genetic analysis of brown adipose tissue function. Physiol. Genom. 2018, 50, 52–66. [Google Scholar] [CrossRef]
  59. Redline, S.; Tosteson, T.; Tishler, P.V.; Carskadon, M.A.; Milliman, R.P. Studies in the Genetics of Obstructive Sleep Apnea: Familial Aggregation of Symptoms Associated with Sleep-related Breathing Disturbances. Am. Rev. Respir. Dis. 1992, 145, 440–444. [Google Scholar] [CrossRef]
  60. Roosenboom, J.; Hens, G.; Mattern, B.C.; Shriver, M.D.; Claes, P. Exploring the Underlying Genetics of Craniofacial Morphology through Various Sources of Knowledge. BioMed Res. Int. 2016, 2016, 1–9. [Google Scholar] [CrossRef] [PubMed] [Green Version]
  61. Wing, Y.; Zhang, J.; Lam, S.; Li, S.; Tang, N.; Lai, K.; Li, A. Familial aggregation and heritability of insomnia in a community-based study. Sleep Med. 2012, 13, 985–990. [Google Scholar] [CrossRef] [PubMed]
  62. Patel, S.R.; Larkin, E.K.; Redline, S. Shared genetic basis for obstructive sleep apnea and adiposity measures. Int. J. Obes. 2008, 32, 795–800. [Google Scholar] [CrossRef] [Green Version]
  63. Desai, A.V.; Cherkas, L.F.; Spector, T.D.; Williams, A.J. Genetic influences in self-reported symptoms of obstructive sleep apnoea and restless legs: A twin study. Twin Res. 2004, 7, 589–595. [Google Scholar] [CrossRef]
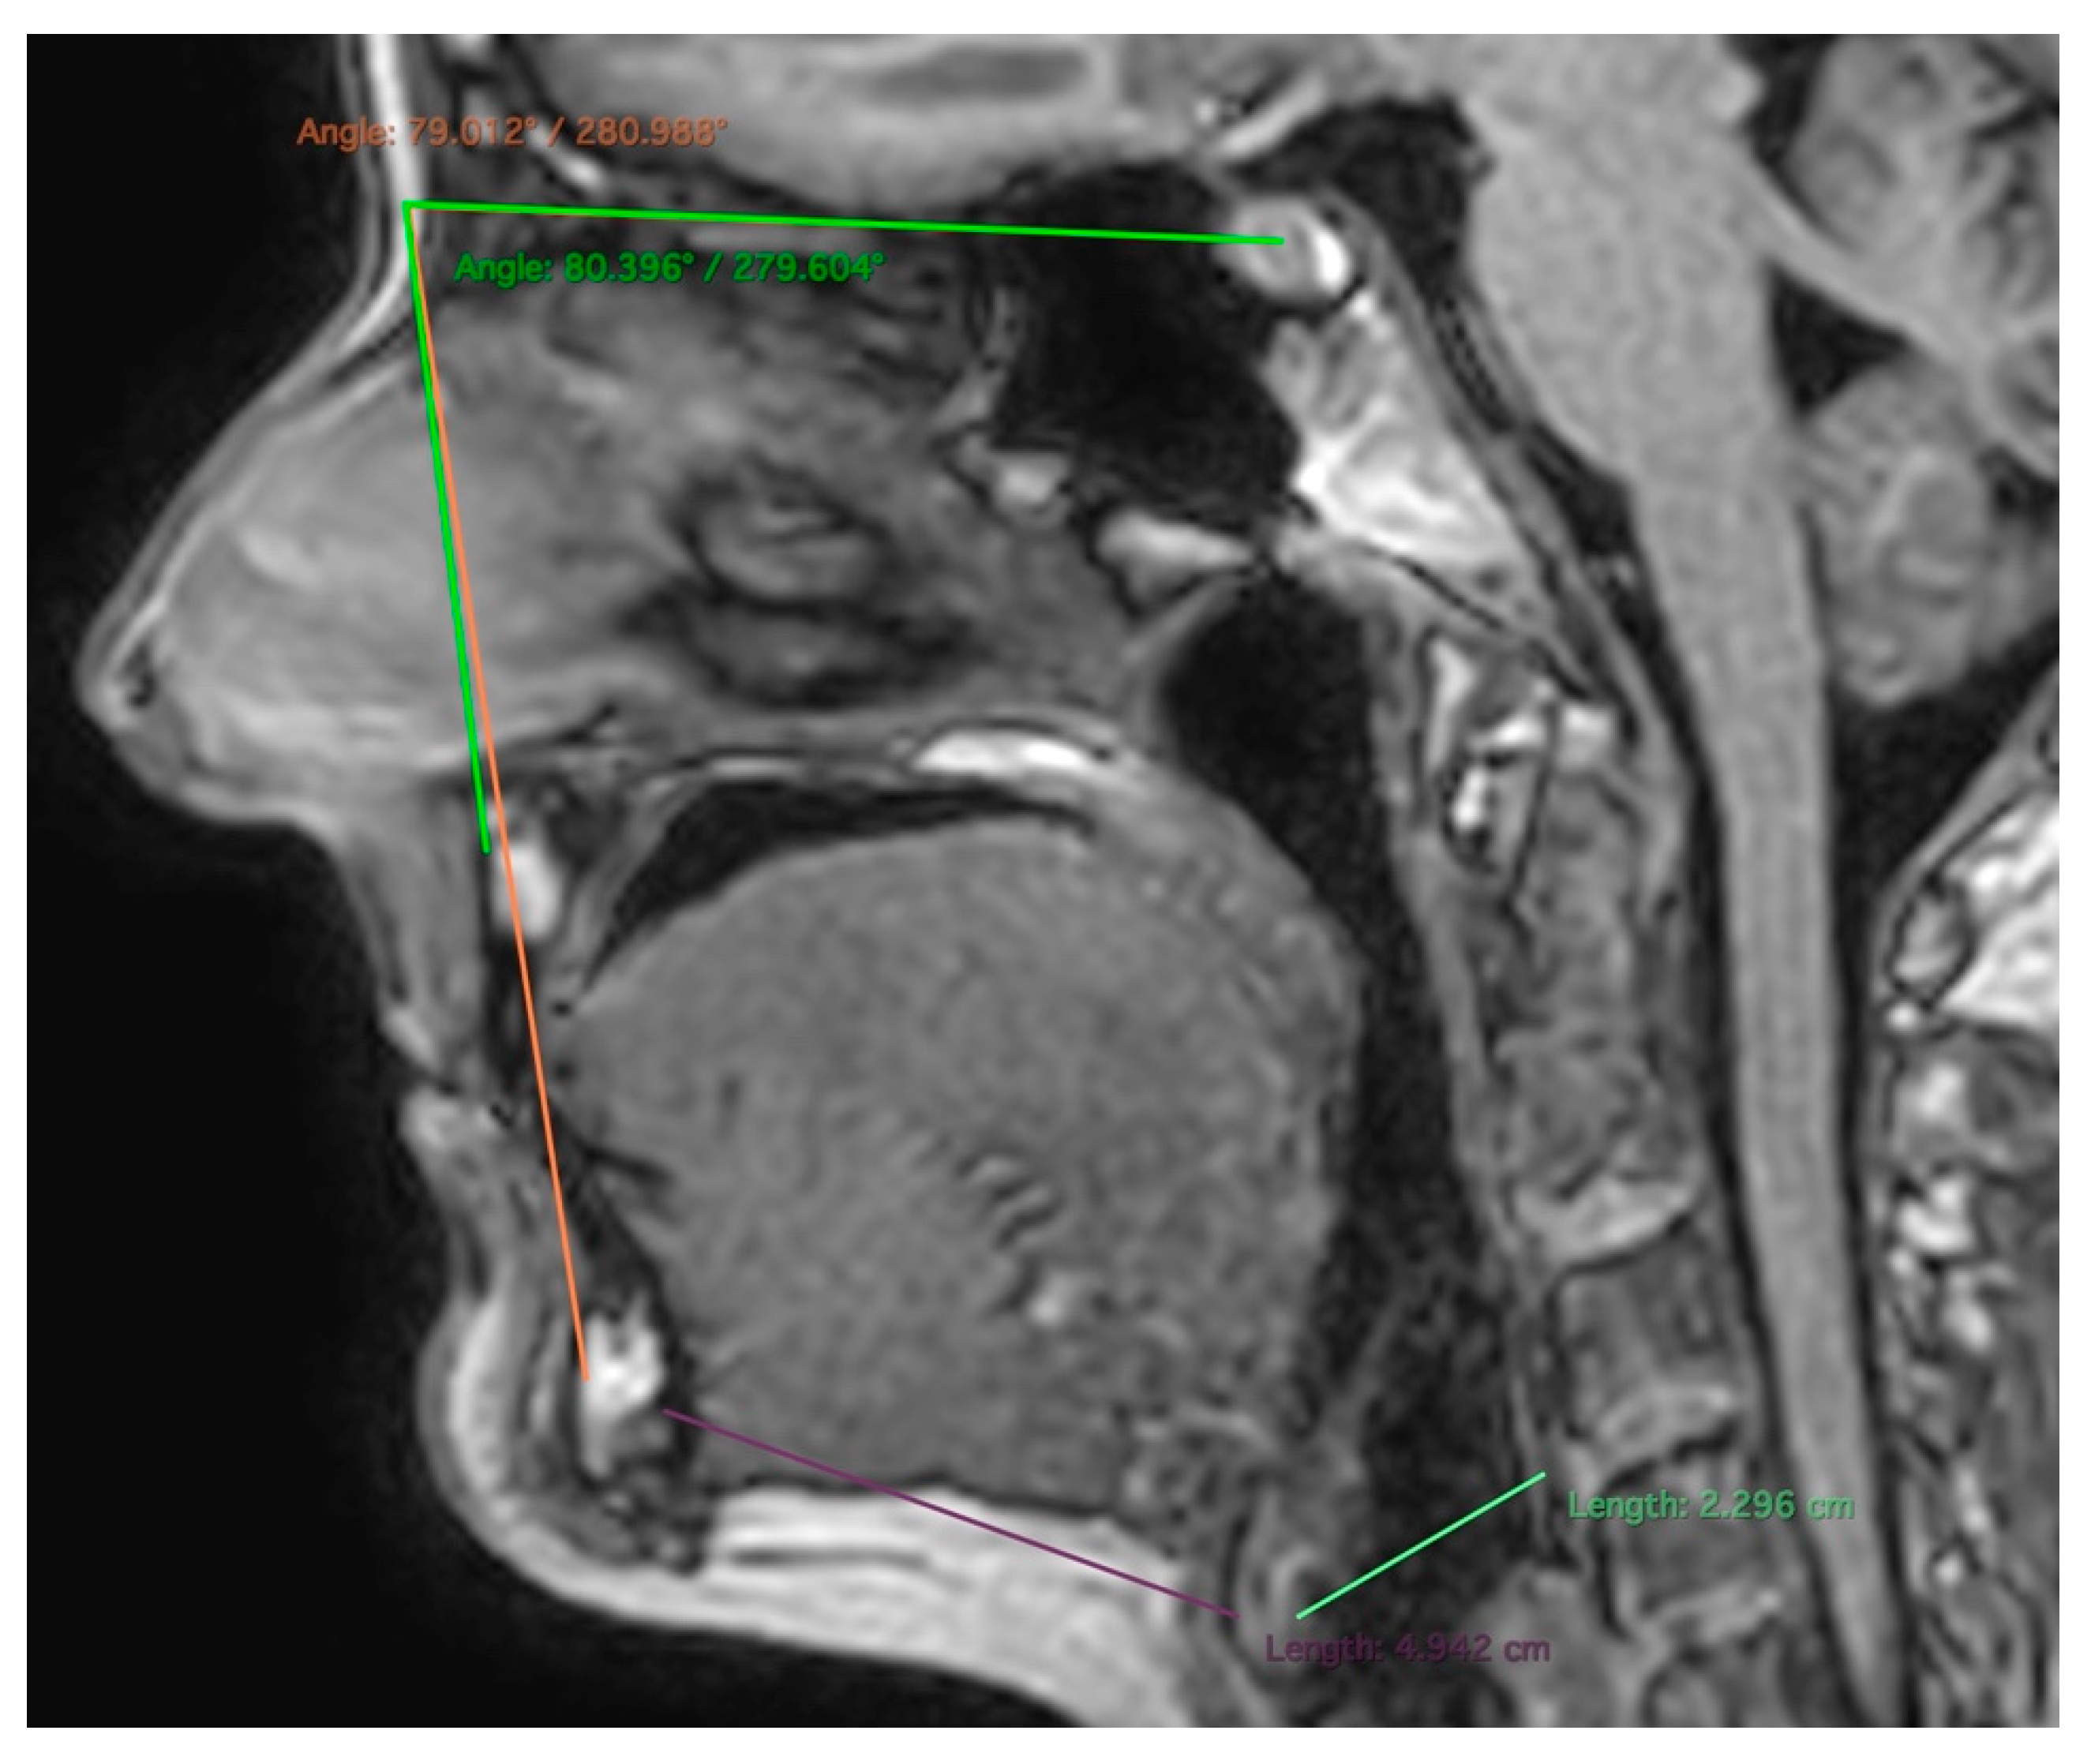
Figure 1. T1 weighted cephalometric measurements on midsagittal plane. (Green: SNA angle, orange: SNB angle, purple: mandibular-hyoid distance, light green: hyoid–cervical tangent distance).
Applsci 12 07646 g001
Figure 2. T1 weighted measurements of the posterior airway space on midsagittal plane (a) nasal (yellow), occlusal (orange) and mandibular (blue) thickness; (b) area (yellow curve).
Applsci 12 07646 g002
Figure 3. (a) Measurements of the tongue on T1 sagittal plane. Yellow: anteroposterior diameter, orange: thickness, purple: area; (b) Measurements of the soft palate on T1 sagittal plane. Orange: length, blue: thickness, purple: area.
Applsci 12 07646 g003
Figure 4. (a) Measurements of the uvula on T1 axial plane. Yellow: anteroposterior thickness, green: latero–lateral width, orange: area; (b) Measurements of the pharyngeal wall on T1 axial plane. Light green arrow on the left: internal carotid artery, dark green arrow on the right: parapharyngeal fat tissue, orange and blue: pharyngeal wall thickness from parapharyngeal fat, red and yellow: pharyngeal wall thickness from the internal carotid arteries.
Applsci 12 07646 g004
Figure 5. Area of the parapharyngeal fat tissue. Blue: right area, purple: left area.
Applsci 12 07646 g005
Figure 6. Graphical explanation of the ACE statistical model.
Applsci 12 07646 g006
Figure 7. A bar-chart demonstration of the ACE model distributions from the highest A values (blue) to the highest E values (grey). Orange demonstrates C values in a decreasing order.
Applsci 12 07646 g007
Table 1. Demographics and descriptive clinical characteristics of the study subjects. The continuous variables are expressed as the median (Q1–Q3) deviation. p-values of the Fishers’ exact test and the Mann–Whitney U tests for each parameter are shown.
TotalMZDZp-Values
Number of participants, N1106644
Age, (years) median (Q1–Q3)53 (44–64)50 (42–56)59 (48–69)0.002
Sex, N (%)Males: 34
(30.9)
Males: 24
(36.4)
Males: 10
(22.7)
0.146
Females: 76
(69.1)
Females: 42 (63.6)Females: 34 (77.3)
BMI, median (Q1–Q3)24.8
(22.4–27.3)
24.3
(22.2–27.2)
25.2
(23.1–27.7)
0.803
Smoking, N (%)16 (14.5)13 (19.7)3 (6.8)0.096
Hypertension, N (%)24 (21.8)12 (18.2)12 (27.3)0.346
Diabetes Mellitus, N (%)7 (6.4)3 (4.5)4 (9.1)0.434
Dyslipidemia, N (%)20 (18.2)9 (13.6)11 (25)0.140
BMI, body mass index
Table 2. ACE models of the measured anatomical markers with 95% confidence interval after defining the best fitting sub-model. A: additive genetics, C: common environment, E: unique environment.
MeasurementsACE
SNA angleA: 0.485 (0.142, 0.713)C: 0E: 0.515 (0.287, 0.858)
SNB angleA: 0.702 (0.422, 0.849)C: 0E: 0.298 (0.151, 0.578)
Mandibular–hyoid distanceA: 0C: 0.569 (0.312, 0.746)E: 0.431 (0.254, 0.688)
Hyoid–cervical tangent distanceA: 0C: 0.685 (0.510, 0.805)E: 0.315 (0.195, 0.490)
Soft palate lengthA: 0C: 0.629 (0.437, 0.765)E: 0.371 (0.235, 0.563)
Soft palate thicknessA: 0.666 (0.442, 0.804)C: 0E: 0.334 (0.196, 0.558)
Soft palate areaA: 0C: 0.633 (0.444, 0.768)E: 0.367 (0.232, 0.556)
Uvula sagittal thicknessA: 0.707 (0.507, 0.829)C: 0E: 0.293 (0.171, 0.493)
Uvula axial anteroposterior widthA: 0.651 (0.308, 0.827)C: 0E: 0.349 (0.173, 0.692)
Uvula axial widthA: 0.732 (0.469, 0.863)C: 0E: 0.268 (0.137, 0.531)
Uvula areaA: 0C: 0.575 (0.324, 0.750)E: 0.425 (0.250, 0.676)
PAS nasalA: 0.452 (0.174, 0.657)C: 0E: 0.548 (0.343, 0.826)
PAS occlusalA: 0C: 0.567 (0.357, 0.723)E: 0.433 (0.277, 0.643)
Tongue anteroposterior diameterA: 0.815 (0.633, 0.904)C: 0E: 0.185 (0.096, 0.367)
Tongue thicknessA: 0C: 0.705 (0.490, 0.836)E: 0.295 (0.164, 0.510)
Tongue axial widthA: 0C: 0.591 (0.334, 0.763)E: 0.409 (0.237, 0.666)
Tongue volumeA: 0C: 0.625 (0.376, 0.786)E: 0.375 (0.214, 0.624)
Tongue areaA: 0C: 0.532 (0.291, 0.698)E: 0.468 (0.302, 0.709)
Subcutaneous neck fat thicknessA: 0.841 (0.719, 0.908)C: 0E: 0.159 (0.092, 0.281)
Parapharyngeal fat area (right)A: 0C: 0.582 (0.328, 0.756)E: 0.418 (0.244, 0.672)
Parapharyngeal fat area (left)A: 0C: 0.631 (0.388, 0.789)E: 0.369 (0.211, 0.612)
Pharyngeal wall-parapharyngeal fat (right)A: 0C: 0.549 (0.281, 0.735)E: 0.451 (0.265, 0.719)
Pharyngeal wall-parapharyngeal fat (left)A: 0C: 0.52 (0.247, 0.714)E: 0.48 (0.286, 0.753)
Pharyngeal wall-internal carotid artery (right)A: 0C: 0.511 (0.234, 0.709)E: 0.489 (0.291, 0.766)
Pharyngeal wall-internal carotid artery (left)A: 0C: 0.484 (0.206, 0.689)E: 0.516 (0.311, 0.794)
Table 3. Intraclass correlations of MZ and DZ groups RMZ: MZ correlation, RDZ: DZ correlation.
MeasurementsRMZRDZ
SNA angle0.511 (0.120, 0.764)0.297 (−0.267, 0.710)
SNB angle0.716 (0.445, 0.866)0.129 (−0.433, 0.616)
Mandibular–hyoid distance0.538 (0.156, 0.782)0.623 (0.181, 0.856)
Hyoid–cervical tangent distance0.550 (0.236, 0.760)0.811 (0.595, 0.918)
Soft palate length0.724 (0.504 0.854)0.429 (0.017, 0.715)
Soft palate thickness0.640 (0.376, 0.809)0.465 (0.060, 0.740)
Soft palate area0.673 (0.431, 0.825)0.614 (0.271, 0.819)
Uvula sagittal thickness0.707 (0.484, 0.843)0.412 (0.01, 0.699)
Uvula axial anteroposterior width0.568 (0.179, 0.799)0.428 (−0.186, 0.781)
Uvula axial width0.612 (0.270, 0.815)0.521 (0.018, 0.811)
Uvula area0.602 (0.263, 0.81)0.577 (0.078, 0.843)
PAS nasal0.489 (0.181, 0.709)0.283 (−0.145, 0.620)
PAS occlusal0.595 (0.313, 0.782)0.569 (0.196, 0.8000)
Tongue anteroposterior diameter0.856 (0.694, 0.934)0.079 (−0.416, 0.536)
Tongue thickness0.793 (0.563, 0.905)0.446 (−0.120, 0.782)
Tongue axial width0.639 (0.315, 0.825)0.515 (−0.055, 0.818)
Tongue volume0.666 (0.36 0.84)0.525 (−0.008, 0.815)
Tongue area0.588 (0.282, 0.761)0.45 (−0.015, 0.721)
Subcutaneous neck fat thickness0.834 (0.681, 0.917)0.598 (0.238, 0.815)
Parapharyngeal fat area (right)0.603 (0.269, 0.805)0.624 (0.174, 0.853)
Parapharyngeal fat area (left)0.656 (0.343, 0.836)0.597 (0.101, 0.846)
Pharyngeal wall-parapharyngeal fat (right)0.510 (0.128, 0.757)0.616 (0.168, 0.85)
Pharyngeal wall-parapharyngeal fat (left)0.510 (0.135, 0.756)0.561 (0.099, 0.823)
Pharyngeal wall-internal carotid artery (right)0.493 (0.115, 0.746)0.568 (0.102, 0.827)
Pharyngeal wall-internal carotid artery (left)0.493 (0.120, 0.744)0.518 (0.036, 0.802)
SNA, sella-nasion-A point (subspinal), SNB, sella-nasion-B point (supramental), PAS, posterior airway space.
Publisher’s Note: MDPI stays neutral with regard to jurisdictional claims in published maps and institutional affiliations.