Article

Effect of Grit Size on Airborne Particle Concentration and Size Distribution during Oak Wood Sanding

1
Department of Manufacturing Technology and Quality Management, Faculty of Technology, Technical University in Zvolen, Študentská 26, 960 01 Zvolen, Slovakia
2
Department of Environmental Engineering, Faculty of Ecology and Environmental Sciences, Technical University in Zvolen, T. G. Masaryka 24, 960 01 Zvolen, Slovakia
3
TSI GmbH, Neuköllner Str. 4, 52068 Aachen, Germany
*
Author to whom correspondence should be addressed.
Appl. Sci. 2022, 12(15), 7644; https://doi.org/10.3390/app12157644
Submission received: 8 July 2022 / Revised: 26 July 2022 / Accepted: 27 July 2022 / Published: 29 July 2022

Abstract

:
Adverse health effects caused by exposure to airborne particles have been detected in recent years, however there is little knowledge about exposure to ultrafine particles with a diameter <100 nm. In this study, particle number concentration and size distribution in a range of particle diameters from 10 nm to 10 µm were determined during oak wood sanding. A hand-held orbit sander in combination with three types of grit size (P60, 120 and 240) of sandpaper were used. Measurements were obtained using a portable particle size distribution analyzer and an optical particle size spectrometer, carried out at 15-min intervals for each treatment by static sampling in the breathing zone. We also compared the optical particle size spectrometer to the aerosol monitor in order to evaluate the mass concentration of airborne particles in the range of 1 to 10 µm in diameter. Sanding paper with the finest grit, P240, showed a significantly higher number concentration of ultrafine particles, compared with P60 and P120 grits. The differences among particular grit size were statistically significant for microparticles. The size distribution of particles during sanding was not affected by grit size. For each grit size, apparent peak values of ultrafine and microparticle number concentrations were determined at approximately 15 nm, and 0.1 µm, respectively. Optical particle size spectrometer and aerosol monitor showed comparable results of mass concentration for the respirable fraction.

1. Introduction

Airborne particulate matter (PM) is of great concern due to its association with health impacts, such as respiratory diseases [1]. Nevertheless, compared with relatively extensively studied health effects of PM with an aerodynamic diameter of <10 µm (PM10, coarse PM) and <2.5 µm (PM2.5, fine PM), we have very little knowledge about the impact of so called ultrafine particles (UFP) <100 nm on human health [2]. UFP are also called nanoparticles because of their size, although many authors consider nanoparticles as 100 nm or smaller particles produced by controlled engineering processes [3].
Another size category of PM is a respirable fraction (PMresp) which is the portion of inhalable particles (<100 µm) that enter the deepest part of the lung, the nonciliated alveoli, with an aerodynamic diameter of approximately <5 µm [4]. The harmful effects of the different PM size categories overlap, because the corresponding sizes overlap: PM10, which includes all smaller particles, will have similar effects as those of smaller PMs, although the effects can be distinguished by taking mass into account. PM10 and PM2.5 are measured by their mass, while UFP are measured by particle number [3].
According to Kuuluvainen et al. [5], the surface area of particles has been shown to correlate with inverse health effects in toxicological studies. A simple manner to combine the lung deposition of particles and the potential for the surface chemistry is to use a metric called the lung deposited surface area (LDSA) concentration.
The LDSA concentration is considered a relevant metric for the negative health effects of aerosol particles, which can be measured by real-time measuring instruments [6].
According to Baldauf et al. [7], various researchers use different metrics and find them informative, therefore, comparing results across multiple studies is difficult given the lack of consistency in the metrics used.
Sanding oak wood with hand-held power tools within woodworking shops has been associated with high inhalable wood dust exposure [8,9,10]. Oak wood dust is considered to be carcinogenic to humans, according to the International Agency for Research on Cancer [11]. The size and shape of particles are primordial factors that condition their deposition in the airways. The largest particles (10–20 µm) are deposited onto the walls of the nose and pharynx, while particles of <5 µm size usually impact smaller airways such as bronchial districts and alveoli [12]. For comparison, the range of droplet sizes of an average human when talking and coughing varies between 25 and 50 µm, and 4 and 7 µm, respectively [13,14]. The size of typical aerosols from air conditioners, and technical systems for humidification and spraying, range from 0.3 to 10 µm [15,16].
Occupational exposure limits for oak wood dust have been established in many countries. In Europe, a binding 8-hr time weighted average (TWA) limit value of 2 mg/m3 (3 mg/m3 until 17 January 2023) was set by European Union Directive 2017/2398 [17].
A number of studies have investigated the effect of various factors on airborne particle size distribution and mass concentration during the sanding of wood. Thorpe and Brown [18] investigated the effect of wood density, sandpaper grade, and contact pressure, on the production of dust. Results from their study indicated that in the case of hardwoods, there is a tendency for the mean aerodynamic diameter of the wood particles generated to be larger for the coarser grades of sandpaper. In addition, fine and coarse sandpaper produced similar concentrations of airborne dust. Ratnasingam et al. [19] reported that the geometric mean particle size of the dust produced during the sanding process was significantly influenced by wood density and hardness. In order to minimize dust emission during the abrasive sanding process of hardwoods, they recommended the use of the coarsest possible abrasive grit and lowest possible wood removal rate. Marková et al. [20] performed granulometric analysis of wood dust samples from oak, beech, spruce, alder and fir. Wood dust samples were obtained through an orbital sander with a grit size of P80. They found that the most frequent percentages of dust particles (between 50 and 79%) in all samples of wood dust were fractions of 32 µm and less. Očkajová et al. [21,22] compared the granulometric compositions of sanding wood dusts of selected wood species (beech, oak) and determined the influence of various factors (type of sander, wood species, sandpaper grit size, and sanding direction) on percentage fractions less than 80 µm. The results confirmed that the use of hand-held sanders caused high percentages of fractions less than 80 µm, above 90% in all cases. In another study conducted by Očkajová et al. [23], sieve analysis was performed for sanding dust from thermally modified wood (oak, spruce, and meranti). The results indicated that the share of wood dust particles with a size less than 80 µm was similar in unmodified and thermally modified wood. Vandličková et al. [24] carried out granulometric analysis of selected samples of tropical wood dust from cumaru, padauk, ebony, and marblewood. Tropical wood dust samples were obtained using a disc sander. In addition, the size and shape of wood dust particles were studied by microscopic analysis. Results of granulometric fractions contribution confirmed that the majority of dust particles were under 100 µm in size. Pędzik et al. [25,26] used two complementary methods, sieve analysis and laser diffraction analysis, to determinate the particle-size distribution and content of very fine particles during the sanding of selected wood species. They found that the type of wood (hardwood or softwood) had a significant influence on the mean arithmetic dust size and the content of the dust fraction with a size <10 µm. Ojima [27] investigated the generation of wood dust during the sanding of two different wood species (beech and cypress) with three different grit sizes (coarse, medium and fine) of the sanding paper by a hand-held orbital sander. The particle size distribution of the wood dust was measured by an eight-stage Andersen cascade impactor. The morphology of the wood dust particle was observed by a desktop digital microscope. Ojima found that when specimens were sanded with a fine paper, the mass median aerodynamic diameters of beech dust and cypress dust were 9.0 µm and 9.8 µm, respectively. Dado et al. [28] performed measurements of wood dust mass concentration using a direct-reading aerosol monitor that combined a light scattering photometer and optical particle counter. The results of real-time measurements demonstrated that softwood species generated higher dust concentrations than hardwood species due to a difference in abrasion durability.
According to the findings reported in the literature, little attention has been given to the UFP generated during wood sanding tasks. There is an assumption that nanoparticles could be an important part of total dust mass, number, and surface area concentration in workplaces involving a wood sanding process [29]. Measurement strategies for exposure to UFP differ from traditional integrated sampling methods for exposure assessments, by the use of real-time instruments [30]. A range of metrics and hence measurement instruments are currently used, because there is no legally enforceable nano-specific occupational exposure limit for wood dust. At the current confusing state whereby metrics of nanoparticles are correlated with specific toxicological end points, it might very well turn out that different particle metrics are correlated with different health end points [31]. To the best of our knowledge, no published study has examined the influence of grit size on airborne particle size distribution in UFP levels during oak wood sanding.
The aim of this study was to explore the effect of the sandpaper grit size on airborne particle number concentration and size distribution during oak wood sanding. UFP and inhalable fraction of coarse and fine PM particles ranging from 0.1 to 10 µm (CFP) were investigated. In addition, the LDSA concentration, as another metric of airborne particles, was determined. The performance of optical particle size spectrometer versus light-scattering photometer and optical particle counter was compared in terms of CFP mass concentration.

2. Materials and Methods

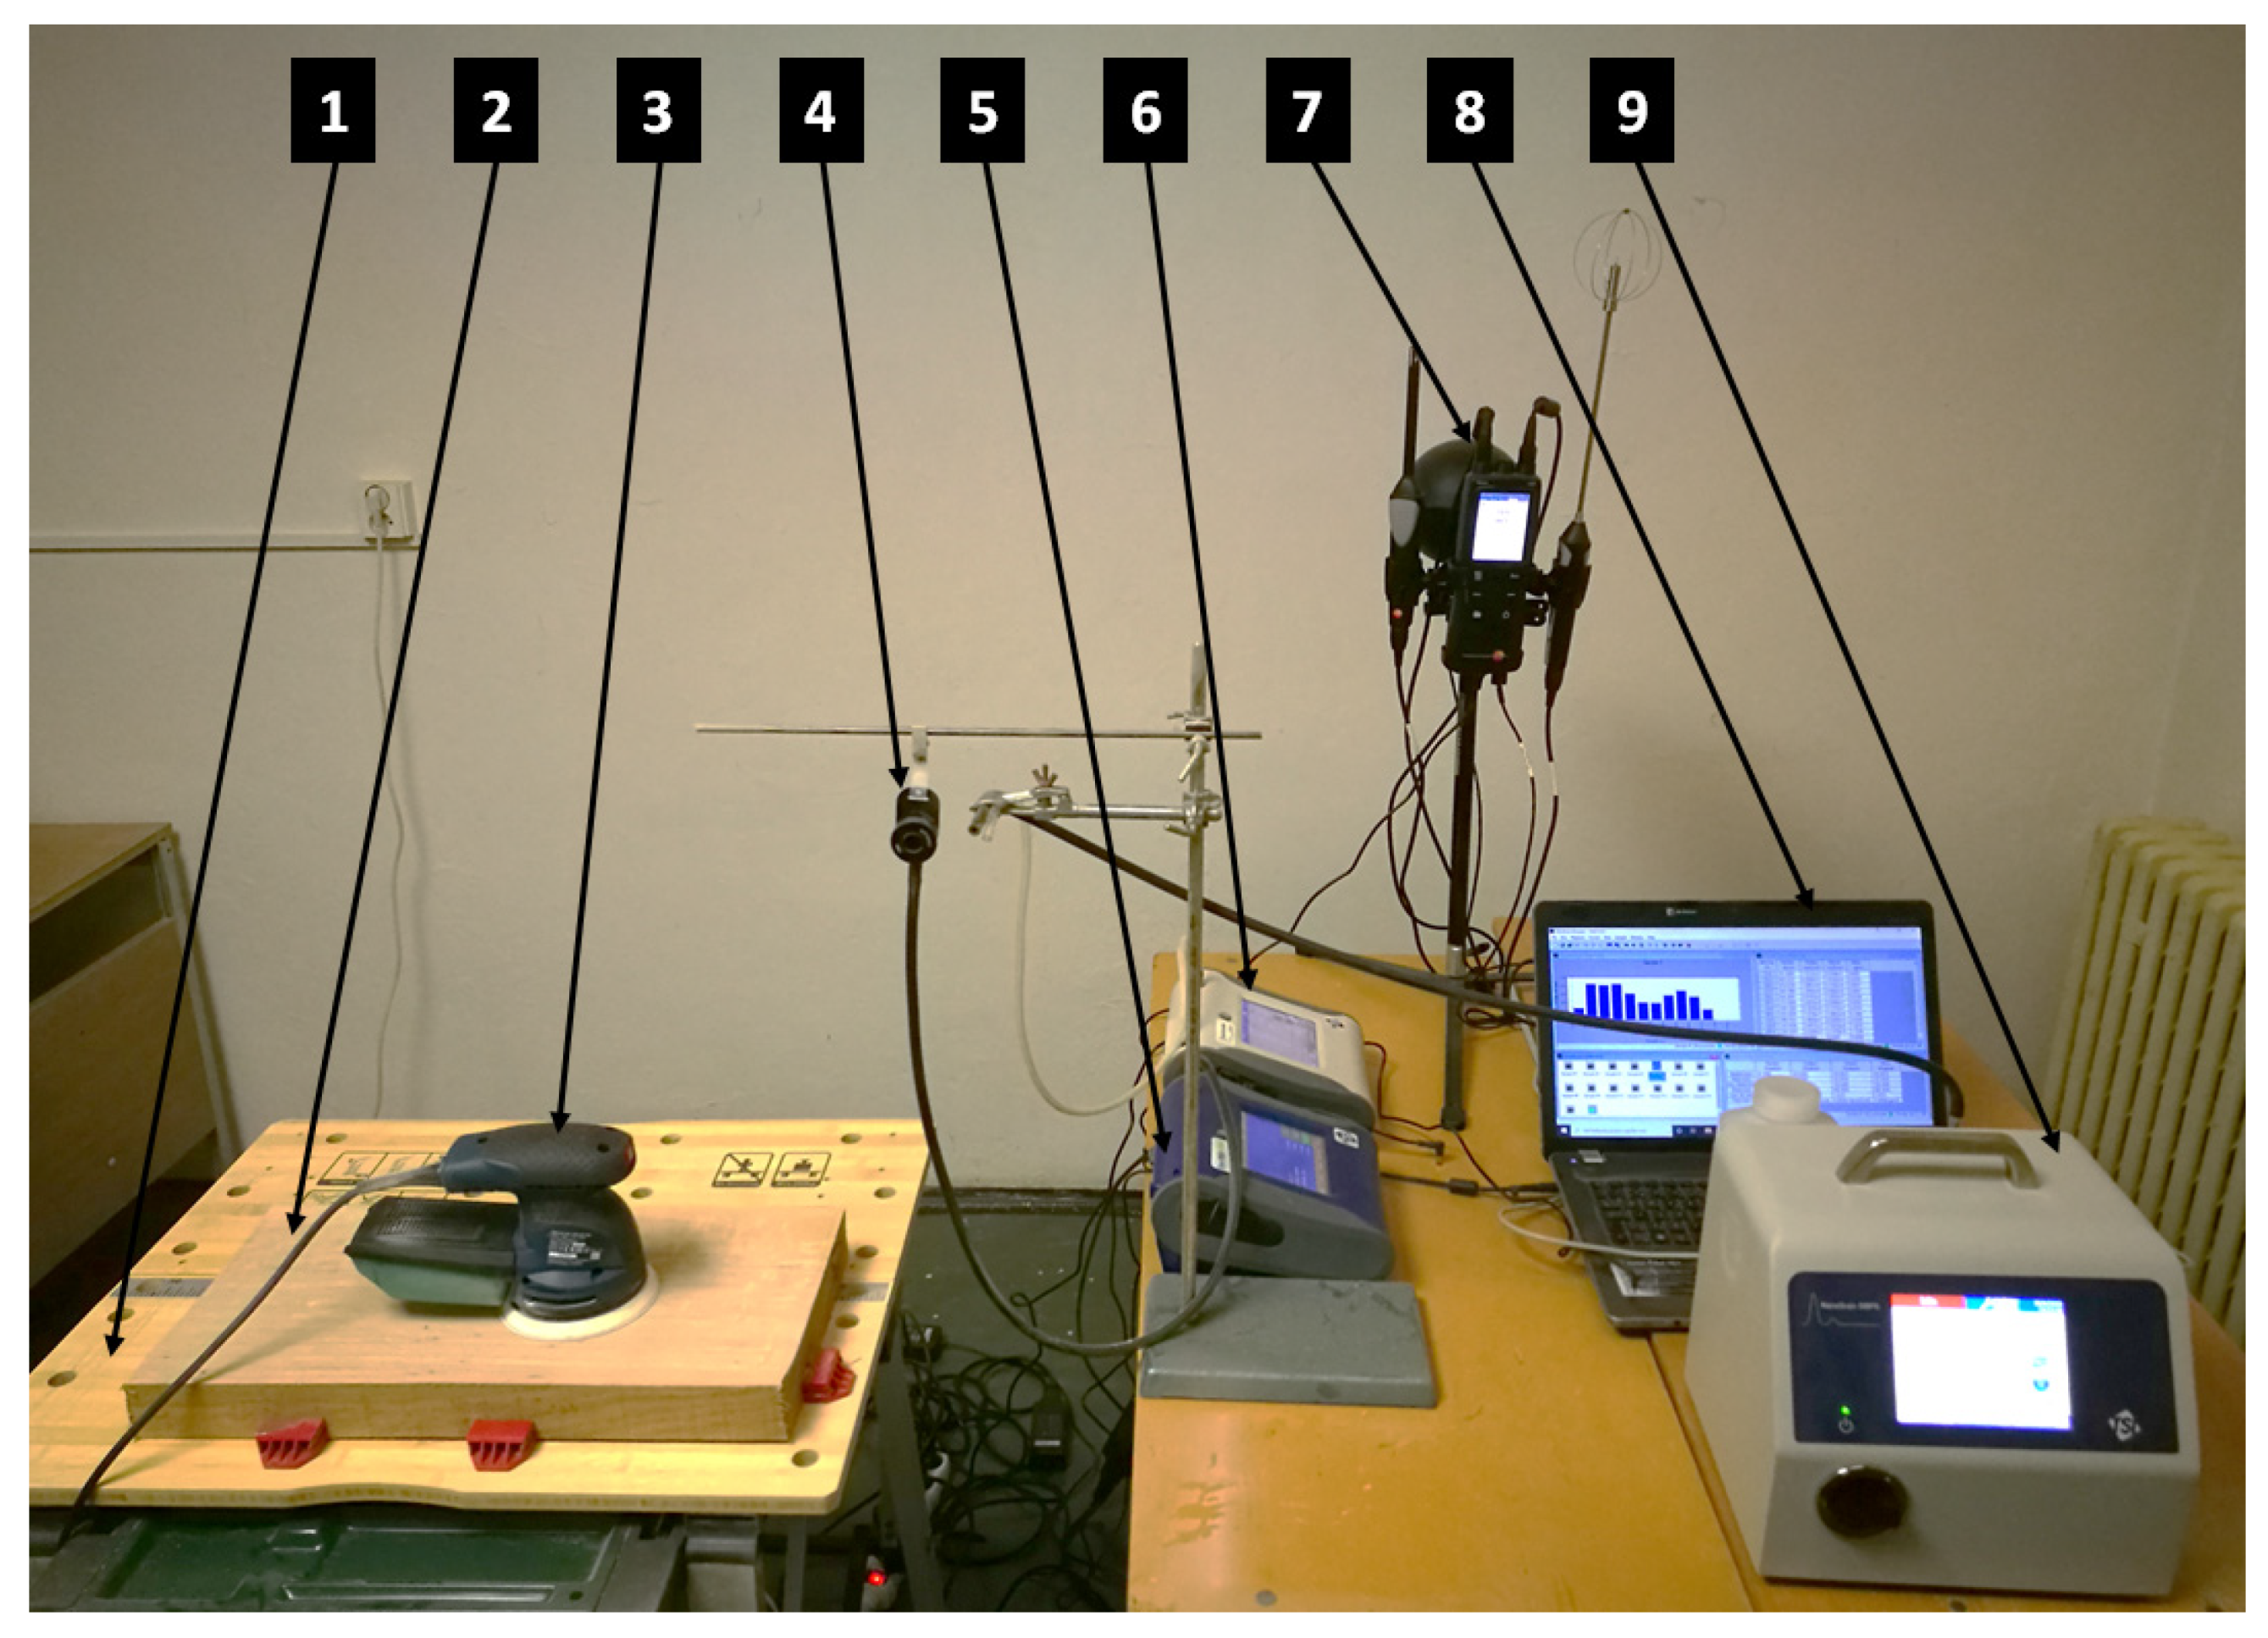
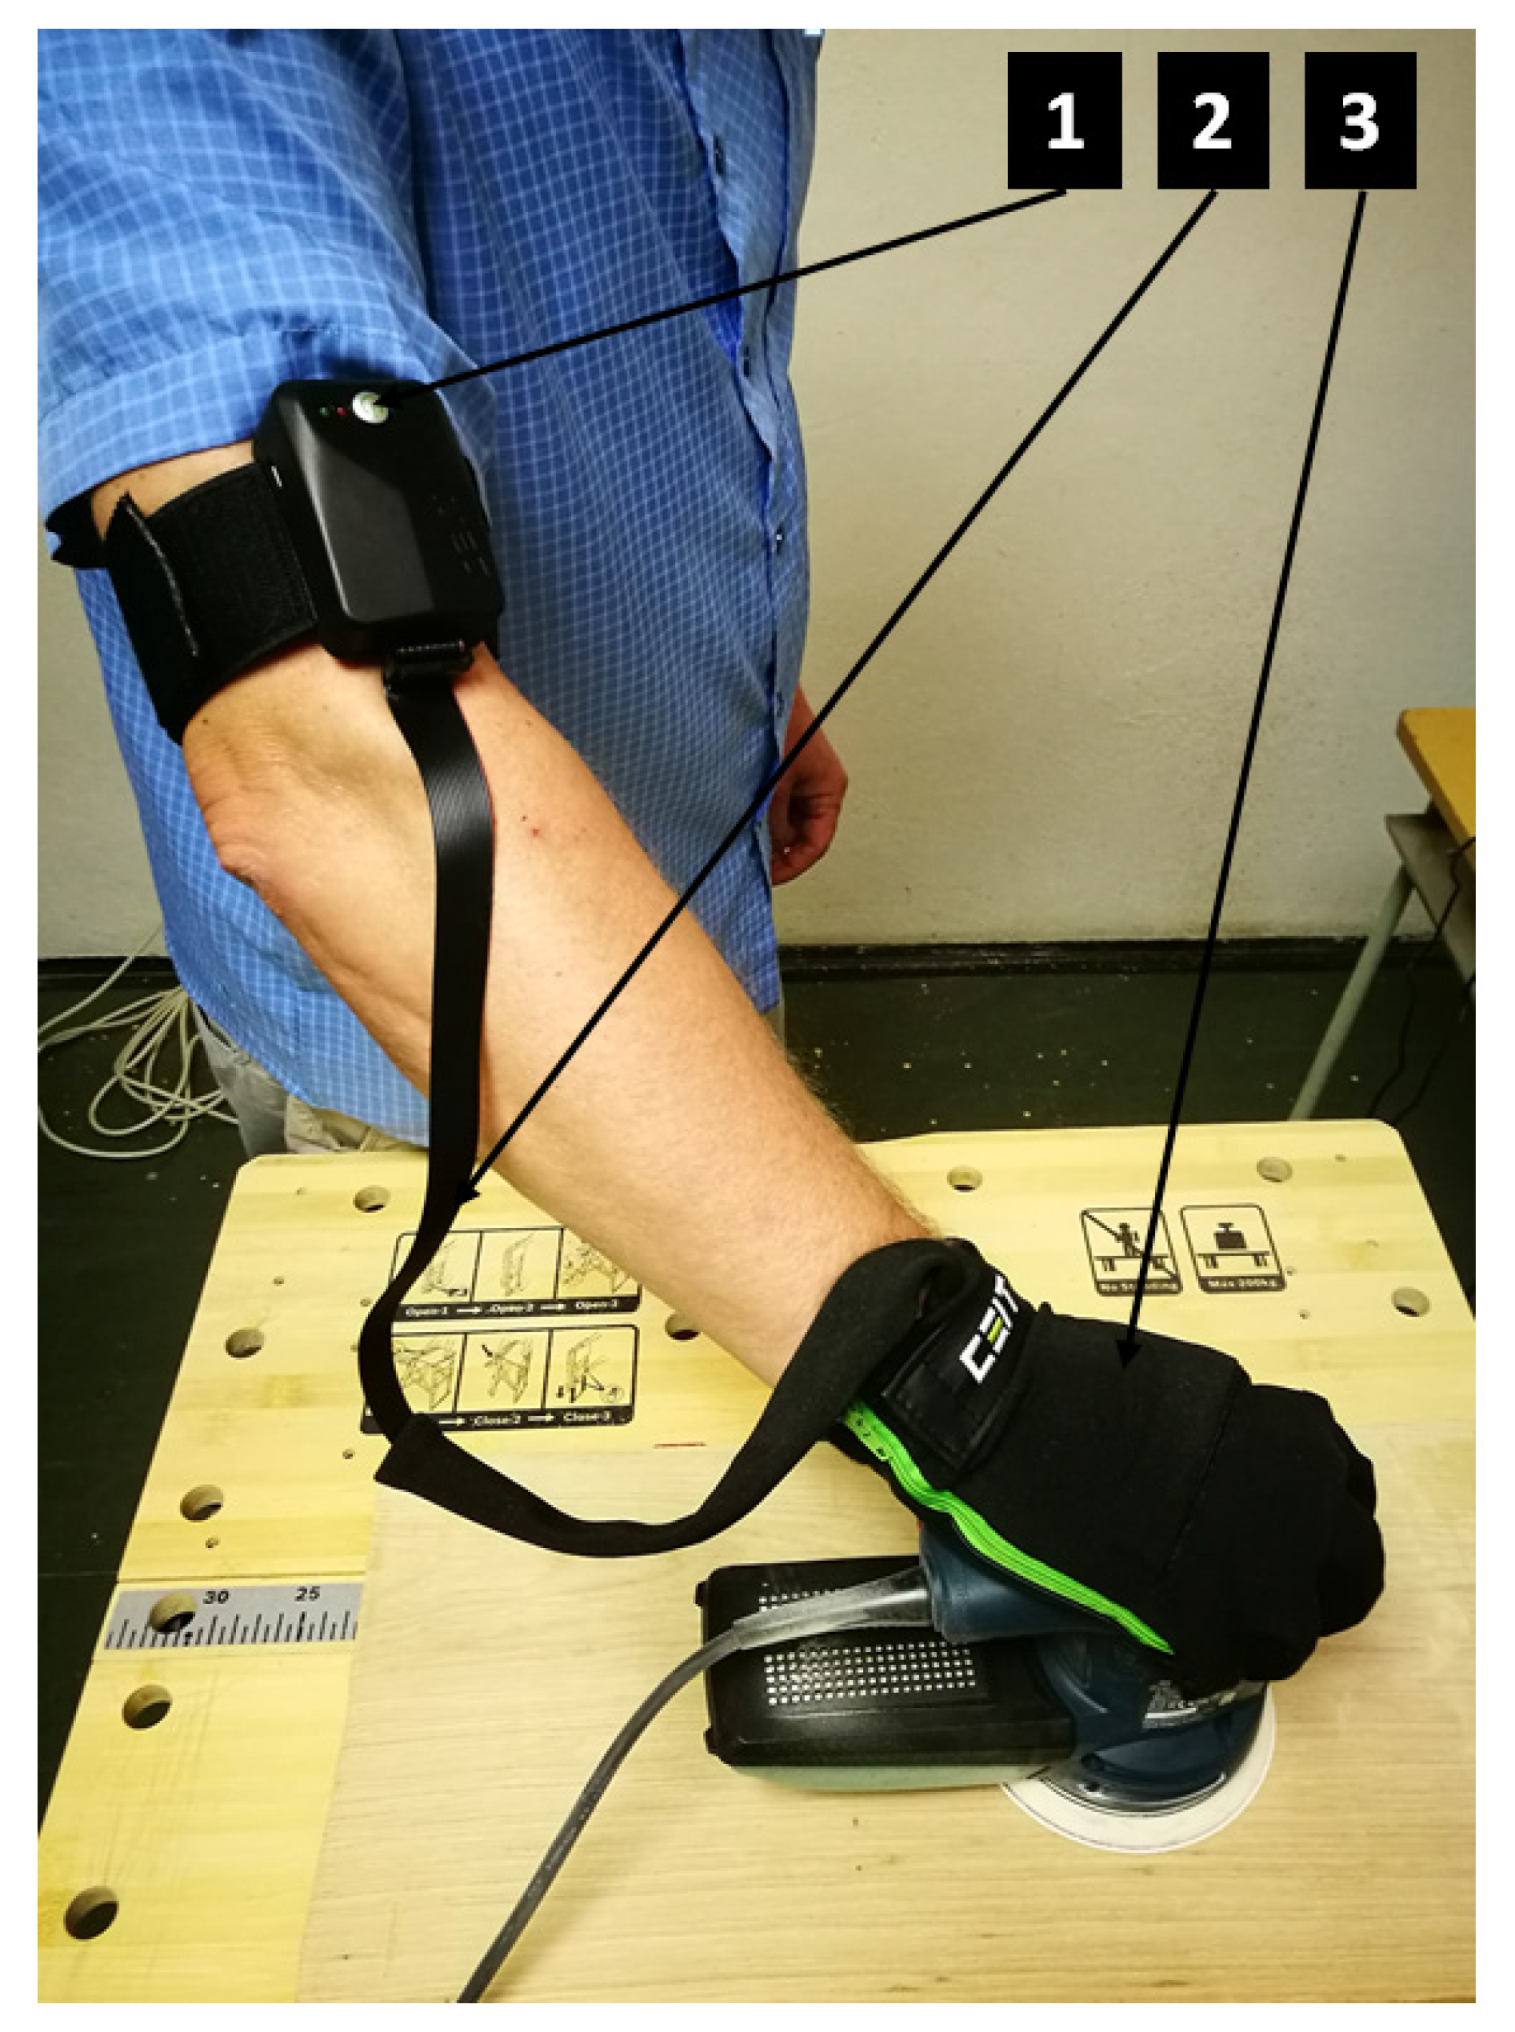
2.1. Experimental Setup and Design

The experiment was conducted in a test room that fulfilled criteria according to standard EN 50 6321-1. The ambient temperature and relative humidity were monitored using a microclimatic conditions monitor (Testo 480, Testo SE & Co., Titisee-Neustadt, Germany). All tests were conducted at a temperature of 21 °C ± 1 °C and at a relative humidity of 38% ± 1%. The layout of the experimental setup is presented in Figure 1.
The experiment was designed as a single-factor completely randomized experiment with three levels of grit size. Each treatment was replicated ten times, so that the total number of runs was 30.

2.2. Test Specimens

The tree species used for the study was oak (Quercus petraea (Matt.) Liebl.). Test specimens in the form of planks of 500 mm × 250 mm × 50 mm dimensions were conditioned to a final moisture content of 12% before experimentation. The moisture content of the test specimens was determined using a wood humidity meter (model Testo 606-2, Testo SE & Co., Titisee-Neustadt, Germany). A mobile workbench (model PWB 600, Robert Bosch Power Tools GmbH, Stuttgart, Germany) was used for clamping the test specimens.

2.3. Sanding Procedure

Sanding was performed using a commercially available hand-held random orbit sander (model GEX 125-1 AE, Robert Bosch Power Tools GmbH, Stuttgart, Germany) with integral extraction unit. The sander was adjusted to the maximum orbital stroke rate. Sanding papers with aluminum oxide abrasives of three different sanding grits (coarse, P60; medium, P120; and fine, P240) were used in the study. An abrasive disc (PS 22 K, Klingspor, Bielsko-Biala, Poland) with diameter 125 mm was replaced after each trial. In order to ensure a consistent sanding operation, the monitoring of the compressive force was performed by a glove-based measurement system (CERAA Glove; Asseco CEIT a.s., Žilina, Slovakia). Figure 2 shows the details of the components set up to monitor the compressive force during the sanding process. The connection of the data box to the tablet (Huawei MediaPad M2 10.0; Huawei Technologies Co, Ltd., Shenzen, China) with the installed software application CERAA was achieved via Bluetooth technology. A compressive force of 30 N ± 5 N was applied on the sanding surface.

2.4. Particle Monitoring Instruments

Particle size distribution and concentration were measured using a NanoScan SMPS (model 3910, TSI Inc., Shoreview, MN, USA). The instrument classified particles in the size range of 10 nm to 420 nm in 13 channels using a radial differential mobility analyzer. The number of particles in each size bin was measured using an isopropanol-based condensation particle counter. The NanoScan SMPS operated at a flow rate of 0.75 L/min and its upper concentration threshold was 106 particles per cm3 (written in the following text as “#/cm3”).
An optical particle size spectrometer (model OPS 3330, TSI Inc., Shoreview, MN, USA) was used for the measurement of particle concentration and particle size distribution in the range of 0.3 µm to 10 µm. The instrument is based on light scattering single-particle counting and sizing technology. The OPS operated at a flow rate of 1 L/min and its upper concentration threshold was 3000 #/cm3.
An aerosol monitor (model DustTrak DRX 8533, TSI Inc., Shoreview, MN, USA) was used for simultaneous measurement of both mass and size fraction of particles in the size range of 0.1 µm to 15 µm. The operation principle of DustTrak DRX is based on a combination of light-scattering photometer and optical particle counter. The instrument operated at a flow rate of 3 L/min and its upper concentration threshold was 150 mg/m3.

2.5. Measurement Procedure

Measurements with all particle monitoring instruments were performed simultaneously. Each experimental trial was conducted following the same procedure. Zero-check calibration of the particle monitoring instruments was completed prior to each sampling event. The time resolution of the NanoScan SMPS was 1 min (45 s up-scan in which the measurement occurred, and a 15 s retrace). The OPS recorded measurements with 1-min frequency. The log interval of the DustTrak DRX was set to 1 s. The sampling inlets were located at a fixed position in the breathing zone of operator. The samples were drawn through a flexible black carbon conductive tubing. The length of the tubes were identical for all instruments (0.6 m). A plastic IOM sampler (IOM Multidust sampler, SKC Inc., Eighty Four, PA, USA) was connected to the DustTrak DRX. To obtain representative results, UFP and CFP concentrations were always checked inside the test room before starting the measurement. The measurement was composed of the following phases: (1) start of the measurement devices and background reading (5 min); (2) sanding operation (5 min); (3) sander stopped, and residual concentration was sampled (5 min).

2.6. Data Analysis

NanoScan Manager software (version 1.0.0.19, TSI Inc., Shoreview, MN, USA), Aerosol Instrument Manager software (version 10.1, TSI Inc., Shoreview, MN, USA) and TrakPro software (version 4.6.1.0, TSI Inc., Shoreview, MN, USA) were used for data post-processing. NanoScan Manager software and Aerosol Instrument Manager software normalized the number concentration to the sample flowrate and sampling time when extracting data.
One-way analysis of variance (ANOVA) combined with Tukey’s post hoc test was used to determine the influence of abrasive grain size on particle concentration during sanding. At a 95% confidence level, p-values < 0.05 were considered statistically significant. The average mass concentrations obtained by DustTrak DRX were paired with the calculated average mass concentrations of the OPS; the calculation equation was as follows:
d M = d N × ρ × π 6 × D p 3
where dM is the particle mass concentration (µg/m3), dN is the particle number concentration (#/cm3), ρ is the density of particle (g/cm3) and Dp is the geometric mean of particle’s diameter (µm).
A comparison to evaluate for statistical significance was conducted via a paired t test. The level of confidence was set to 95%, and a p value < 0.05 was chosen to indicate statistical significance. All statistical analyses were carried out using Statistica software package (version 10, StatSoft Inc., Tulsa, OK, USA).

3. Results

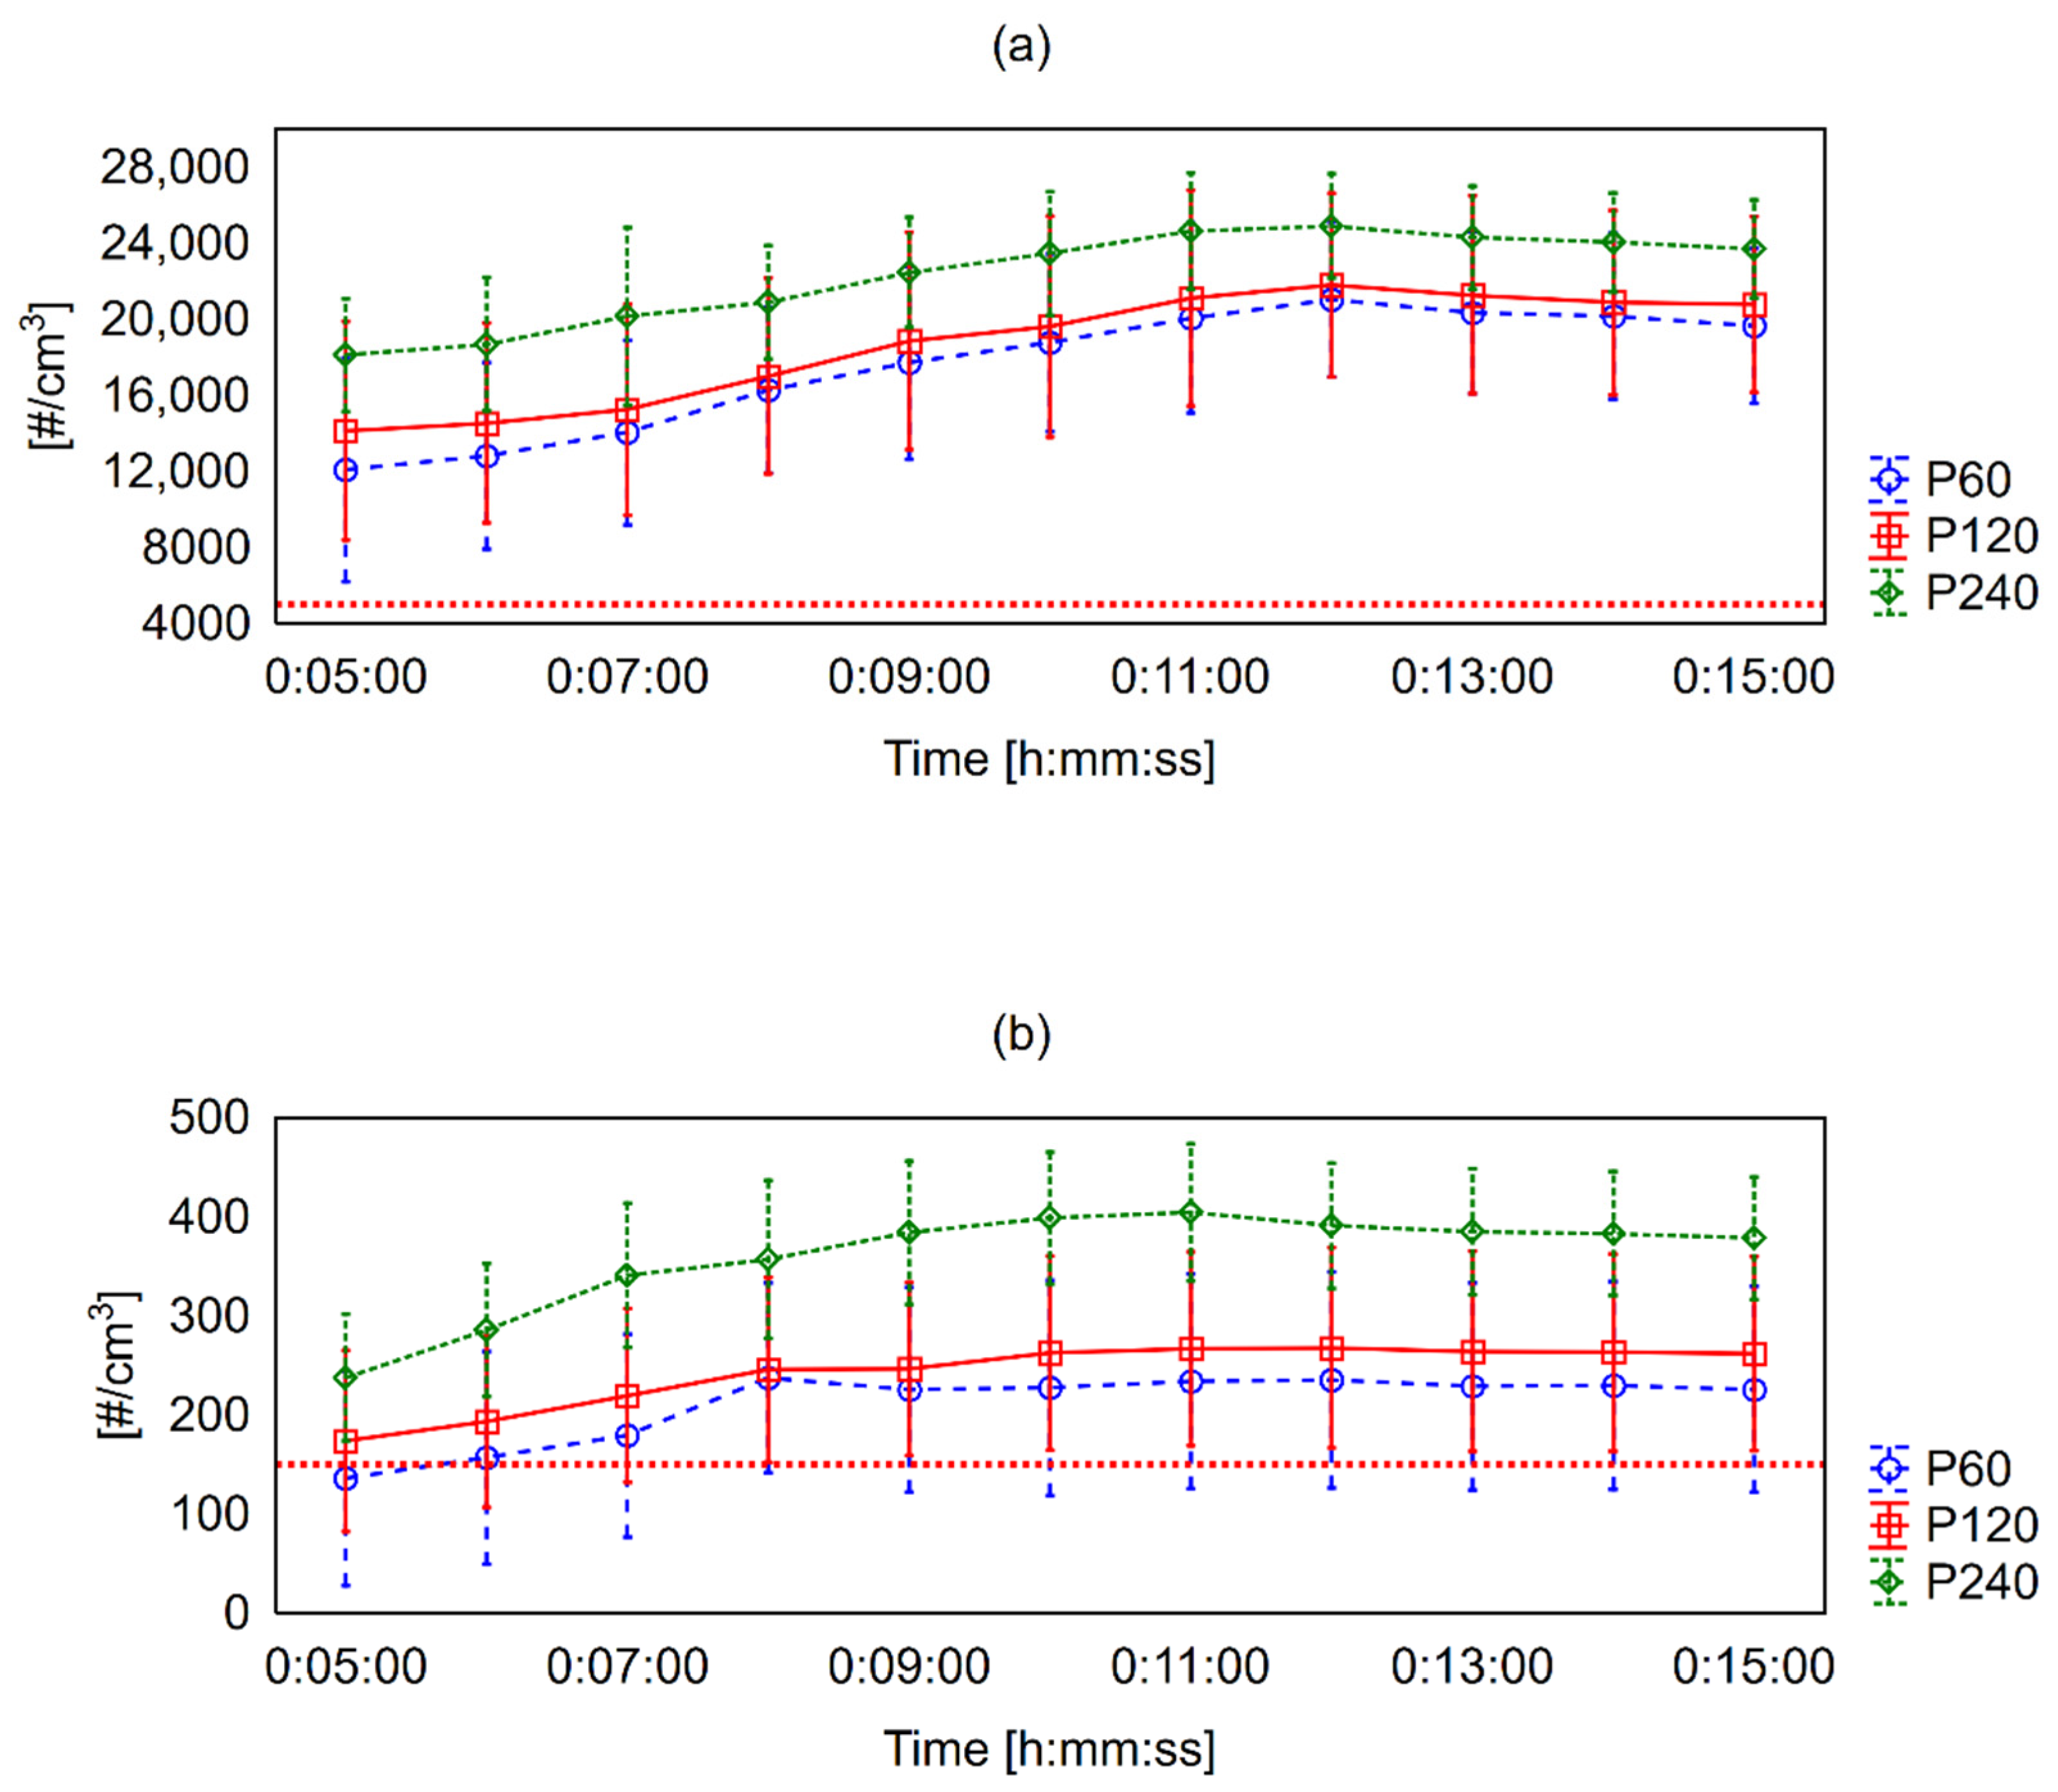
3.1. Particle Number Concentration Results

Figure 3 shows the UFP and CFP number concentration results versus time profile of each sanding paper grit performance. The measurements are shown from the time as the experiments, i.e., when the sanding operation were performed and subsequent sampling of residual concentration. Total concentration from each minute and replication of the experiment was averaged. Periods with no activity before the sanding process (until the fifth minute from sampling initialization) were excluded from the graph, because the background number concentrations of UFP and CFP were always <5000 #/cm3 and <150 #/cm3, respectively, in the test room, and the magnitude of the standard deviation (SD) from the average value indicated insignificant fluctuations.
Figure 3 shows long-lasting high concentrations of UFP and CFP in the breathing zone of the operator with the peak moment being after the sanding process was over.
In Table 1, the descriptive statistics of the measured data from NanoScan SMPS and OPS are available. Data were averaged out of 15 recorded minutes of each treatment in 10 replications. A comparison of the time profile results showed that fine sanding grit P240 generated the highest mean number concentrations of UFP and CFP, followed by P120 and P60, respectively. On the other hand, the maximum observed number concentrations were slightly higher for P60, compared with P120.
By comparing the average mean diameter (MD) and geometric mean diameter (GMD) of UFP generated by particular sanding paper grits, a decreasing trend from P60 to P240 was found. On the contrary, the size of CFP increased with the fineness of the sanding grit.
The results of the ANOVA (Table 2) showed significant (p < 0.001) difference among investigated sanding paper grit performance for both UFP and CFP in terms of number concentration. Therefore, we used Tukey’s honestly significant difference (HSD) procedure. Pairwise comparisons of means within data showed that the difference was remarkable among UFP generated by P240 sanding grit. At micro-scale, each of investigated sanding paper grits were significantly different compared with the other two. Moreover, similar results were obtained by the statistical analysis of MD and GMD of the particles.

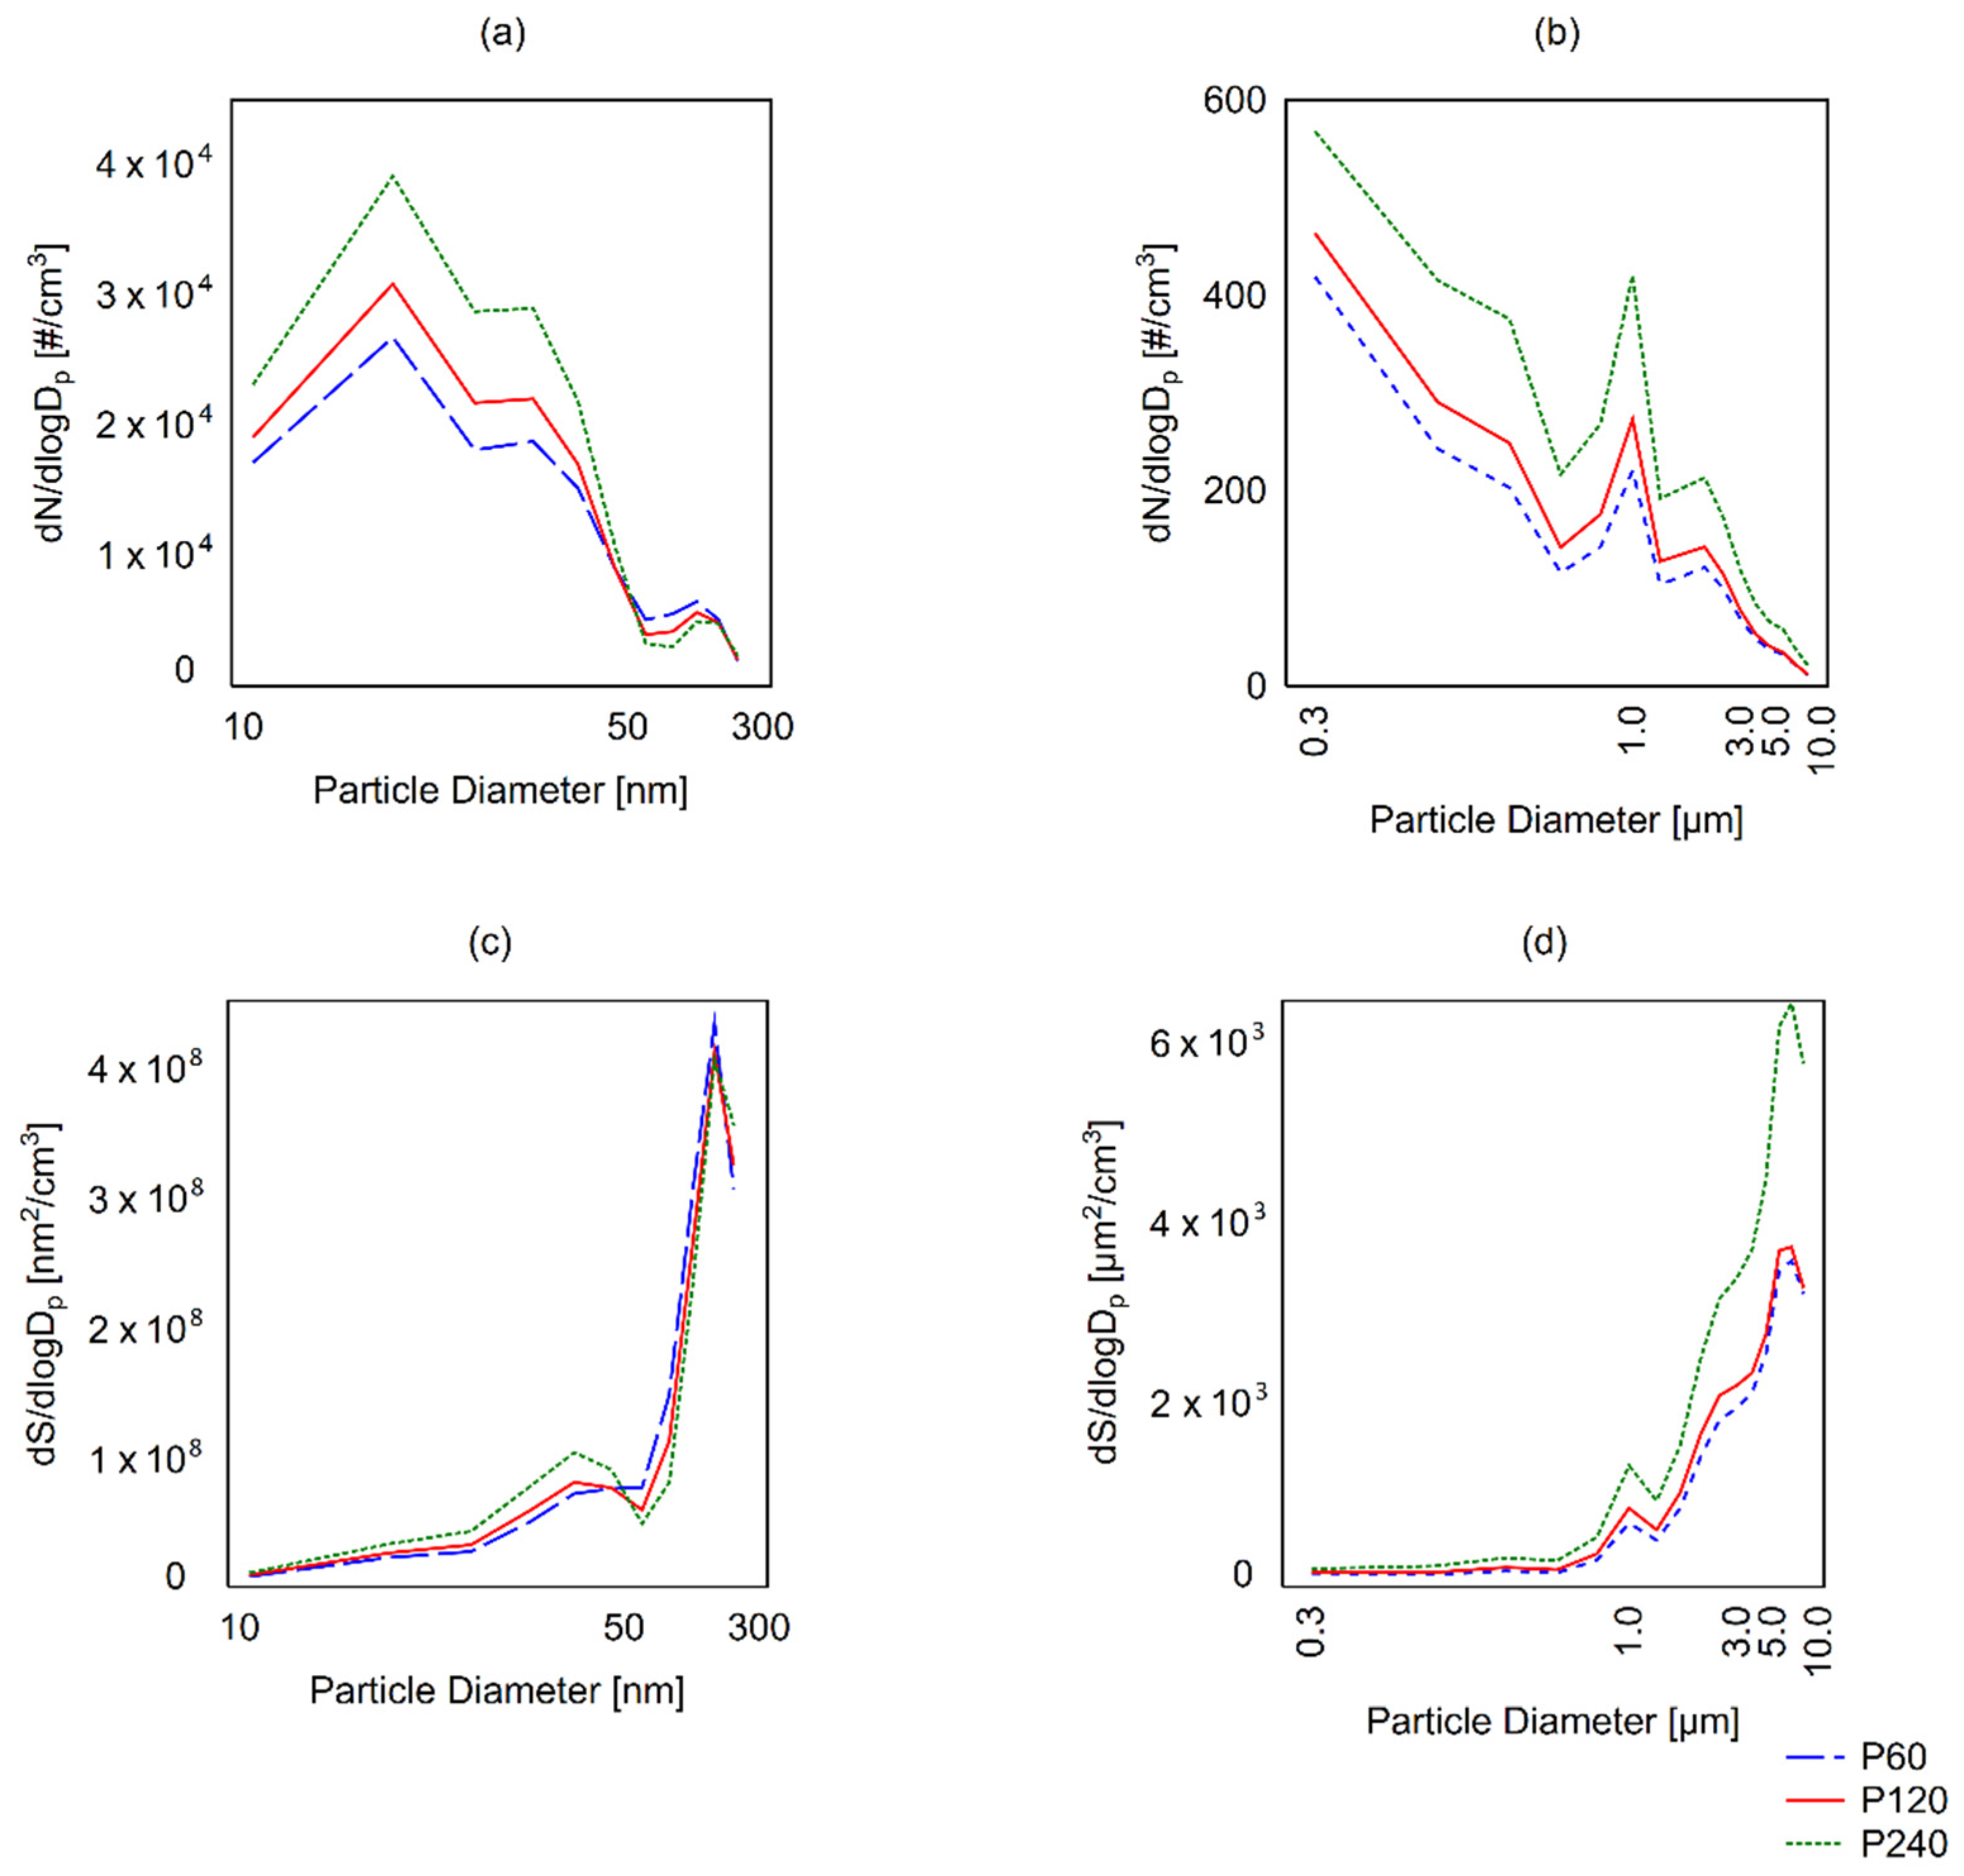
3.2. Particle Size Distribution Results

Figure 4 shows the particle normalized number-sized distribution (dN/dlogDp) and surface area concentration (dS/dlogDp) of airborne PM that was generated during the oak wood sanding process. According to Hinds and Zhu [32], the normalized concentration is the total number, surface or mass concentration (dN, dS or dM) within the measured range divided by the difference between the logarithms (dlogDp) of the lower and upper diameter of the counted particles. This makes the normalized concentration independent of the channel width of the instrument, thus results from instruments with different channel widths are mutually comparable. Data showed in Figure 4 were calculated as the arithmetic mean from each treatment.
During the monitoring of the background number concentration of UFP before the sanding of the oak planks, the shape of a typical Gaussian curve was observed. Thus, particles with diameter approximately from 75 to 100 nm were dominant in the air. In the case of CFP, a clear peak was detectable even before the start of sanding, at a size bin from 0.300 to 0.374 µm. Immediately after the start of sanding, the particle distribution in the test room was rearranged. As seen in Figure 4, the concentration patterns differed between the investigated sanding paper grits in terms of normalized number concentration as well as LDSA, similarly, size distribution of particles showed the same trend. Apparent peaks of UFP and CFP number concentrations were regularly found at size bin in the range of 13.3 to 17.8 nm, and 0.897 to 1.117 µm, respectively. However, the maximum values of CFP remained at the level of 0.3 µm, with a subsequent sharp decrease. Interestingly, UFP in size bin midpoints from 64.9 to 154.0 were generated in higher number concentrations during P60 and P120 grits performance, compared with sanding paper with grit P240.
As can be seen from the graph, despite their dimensions, UFP detected by the NanoScan SMPS had an order of magnitude higher LDSA than the particles detected by the OPS, peaking at 154.0 nm. The curves of LDSA associated with particular sanding paper grits showed higher maximum surface area for P60 (5.39 × 10⁸ nm2/cm3) and P120 (5.12 × 10⁸ nm2/cm3) sanding grits compared with P240 (4.86 × 10⁸ nm2/cm3) sanding grit. This was directly associated with the determined UFP number concentration in the size range of 64.9 to 154.0. On the contrary, the LDSA for CFP determined during the performance of sanding paper grits P60, P120 and P240, ranged from approximately 135 to 3600, 161 to 3700, and 200 to 6500 μm2/cm3, respectively. Peak LDSA was found for the CFP diameter of approximately 7 μm.

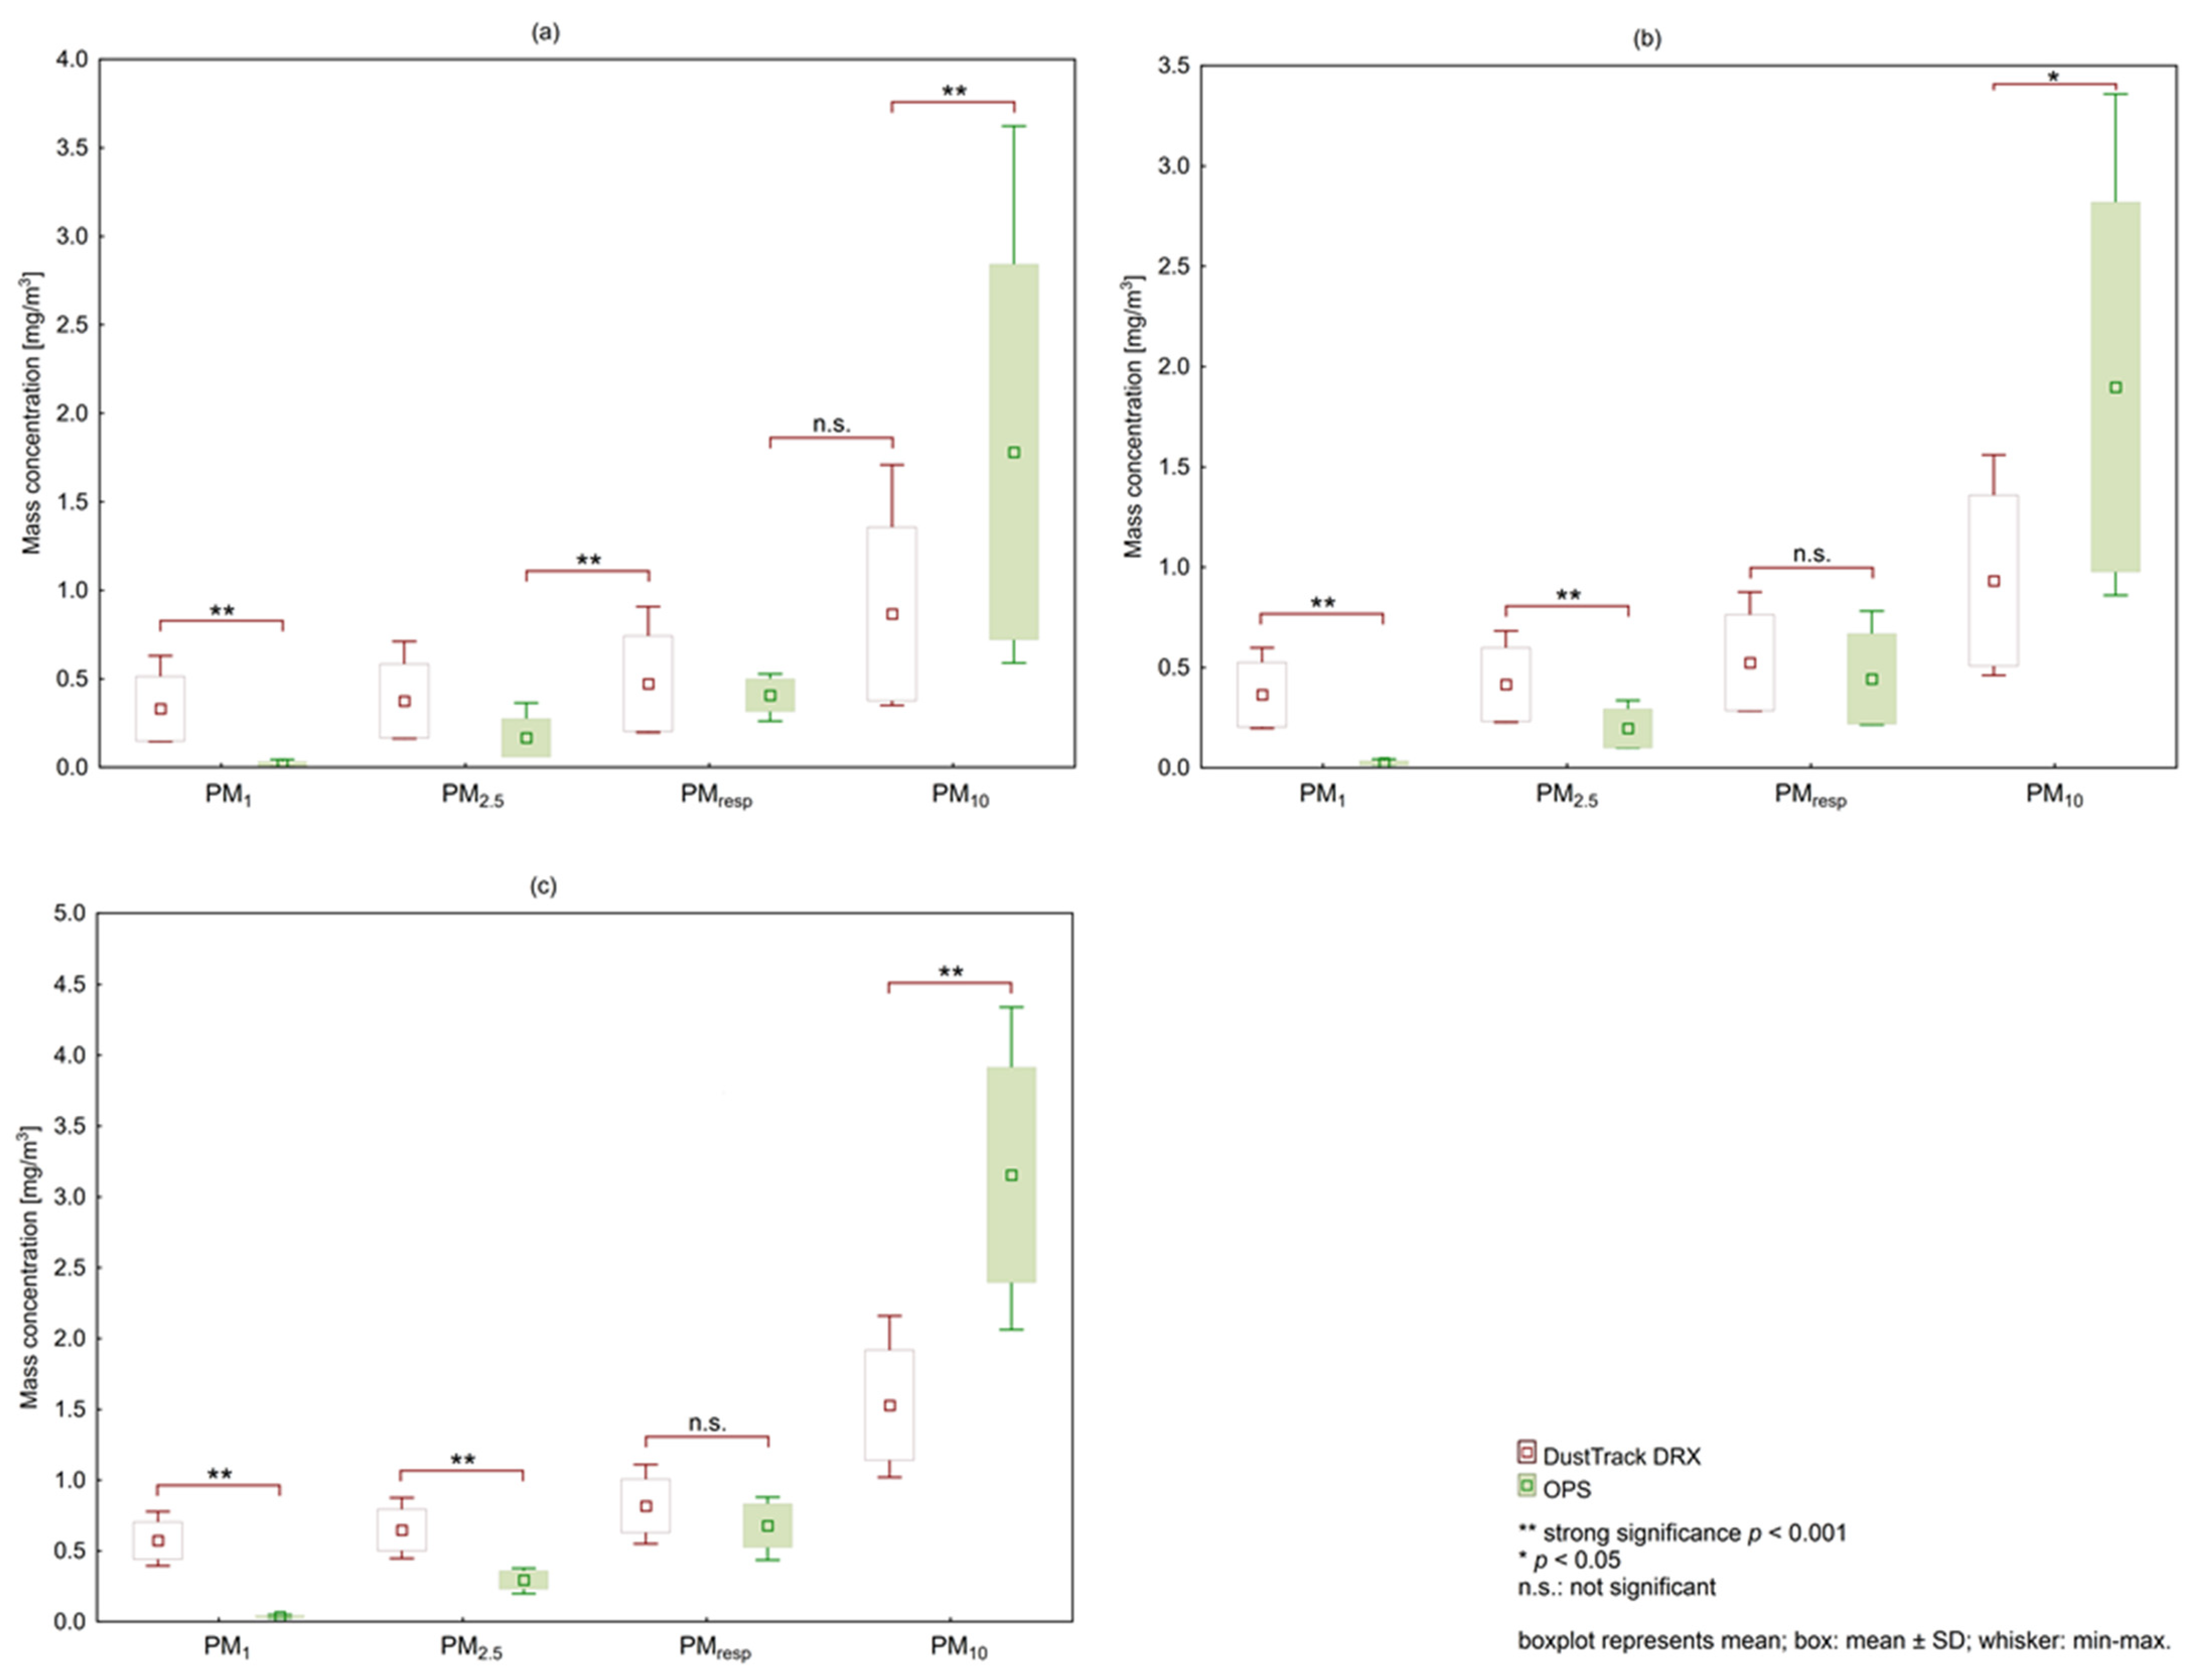
3.3. Mass Concentration Comparison of Instruments

The sampling frequency of the DustTrak DRX instrument resulted in 900 records from each measurement. Mass concentration was monitored in four channels, i.e., PM1, PM2.5, PMresp and PM10. Data were averaged to be comparable with OPS.
The mass concentration determined by OPS was averaged in each of the 16 channel midpoints for 10 treatments and 15 min of records in each treatment. Subsequently, a particular fraction of PM was calculated by summing the corresponding range of midpoint averages: PM1 (from 0.337 to 1.007 µm), PM2.5 (from 0.337 to 2.421 µm), PMresp (from 0.337 to 4.672 µm), and inhalable fraction PM10 (from 0.337 to 9.016 µm).
The normal distribution of data was tested by Shapiro–Wilk test. Figure 5 shows particulate mass concentration and comparison of used instruments conducted by paired t test.
The compared instruments showed no statistically significant difference for PMresp. Other size categories of PM showed statistically significant differences. Therefore, the results from DustTrak DRX and OPS did not agree with PM1, PM2.5 and inhalable fraction PM10.

4. Discussion

Wood processing has been known to emit a large amount of inhalable wood dust, but the emissions of particles with diameters smaller than 10 μm and ultrafine particles, as well as their exposure levels, remain unclear [33]. The Institute for Occupational Safety and Health of Germany (IFA/DGUV) recommend two benchmark levels for airborne particles in the range of 1 nm to 100 nm, based on their density. For materials with a density exceeding 6 g/cm3, the benchmark level is 20,000 #/cm3, and for materials with lower density, the benchmark level is twice as large in range of measurement, between 1 and 100 nm [31,34]. The number concentration of 20,000 #/cm3 is recommended for metals, metal oxides and other bio-persistent granular nanomaterials. Determining the density of oak wood UFP is beyond the scope of this paper, nevertheless, based on the composition of oak wood and its standard tabular density at approximately 0.75 g/cm3, a benchmark level of 40,000 #/cm3 would be more suitable. By comparing this benchmark level with the measurements of P60, P120 and P240 sanding paper grits at peak values, approximately 81% of this benchmark level was reached by sanding paper with grit P240. Sandpapers with grits P60 and P120 reached both approximately 72% of the benchmark level. Our experiment showed that the choice of grit size during sanding process requires serious attention in association with health impacts in the wood-processing industry.
From the analysis of the time course of the measured data, we found a high degree of risk for workers after the end of sanding. The decrease in the concentration of airborne particles in the test room was relatively slow, the original background value from before the start of sanding was reached only after approximately 3 h, however the test room was not equipped with suction. Professional sanding commonly means that personal protective equipment (e.g., respirator) should be used. If so, the worker usually pulls it down immediately after finishing work, which leads to exposure to high concentrations of particles in the occupational environment.
Rim et al. [35] investigated the differential effects of coagulation, deposition, and ventilation on UFP size distribution indoor. They concluded that coagulation is a significant aerosol process for UFP dynamics and the primary cause for the shift of particle size distribution following an episodic high-concentration (>20,000 #/cm3) UFP release with no fans operating. Previous research concluded that a variety of processes and phenomena can influence indoor particle levels and fates [36,37]. However, when comparing our results to those of older studies, it must be pointed out that primary attention has been addressed to residential environment quality. Therefore, it remains unclear how the particle size distributions shown in Figure 4 were affected, and what causes distinct peaks at certain particle sizes. The obvious peak might be a result of particle formation due to combustion initiated by friction between sandpaper and wood. Combustion as a side effect of abrasion produces particles <50 nm scale [38,39,40]. These particles might be volatile organic compounds, semi-volatile organic compounds, elemental carbon, black carbon or any other products of combustion.
There is also a less distinct peak in Figure 4, at approximately 30 nm. Our data are generally comparable with those reported in previous literatures, e.g., Zhang et al. [41] reported bimodal size distribution during the period from 0 to 10 min of wood combustion process, with a nucleation mode in the size range of 10–20 nm and an Aitken mode peaking at 40–50 nm. Subsequently, the bimodal distributions gradually became unimodal during the combustion period from 10 to 15 min. Compared with this study, our results need further investigation to precisely describe the particle presence at <50 nm, where coarse sandpaper with grit P60 seems not to produce as many particles from potential combustion as P240 sandpaper. Moreover, it will be necessary to explain the behavior of particles in the size range of approximately 100 to 150 nm, where sandpaper grit P60 increased the number concentration above the level of both P120 and P240 grits.
In our opinion, there is clear evidence that the surface area is an important metric for carcinogenic oak wood particles. Cancer of the upper respiratory tract develops after exposure to many kinds of wood dust. In addition, the wood dust of oak wood seems to be highly carcinogenic. It is assumed that exposure to wood dust can cause an increased incidence of other cancers, especially lung cancer and Hodgkin’s disease [42]. In this regard, we consider oak wood sanding with an orbital sander to be a risky occupational activity, where the average LDSA for worker is approximately 120,000 µm2/cm3, for each investigated sanding grit. There is a lack of knowledge in the field of wood processing, especially in terms of occupational exposure to UFP. Comparing different occupational environments, Buonanno et al. [43] detected LDSA concentrations ranging from 49 to 3200 µm2/cm3 for UFP generated by welding process in the automotive industry. Guerreiro et al. [44] found LDSA concentrations for welding process ranging from 8325 to 42,896 µm2/cm3 UFP, with a size of primarily 10–20 nm. According to Salo et al. [45], LDSA in an underground mine ranged from 137 to 405 µm2/cm3. Our results underline the importance of future investigation of wood sanding in terms of LDSA, as it appears to be the most relevant physical metric for quantifying occupational exposure to smaller oak wood dust particles. Therefore, occupational exposure limits should also include LDSA values.
Several studies have indicated a relation between the coarseness of the sanding paper and the mass concentration of the generated micro-sized aerosol [18,27,28]. The present study was designed to determine the effect of sandpaper grit size on airborne particle concentration and size distribution in UFP and CFP levels during oak wood sanding. The results of this study are in contradiction to results of study performed by Fransman et al. [46]. They concluded that the coarseness of the sanding paper did not influence the particle number concentration. However, they investigated the potential release of nano-objects, their agglomerates, and aggregates (NOAA) as a result of the sanding of wood surfaces treated with manufactured nano-object (MNO)-containing coatings.
Exposure to wood dust at different wood working processes was studied by Scheeper et al. [47] in the Netherlands. It was observed that during hand sanding of wood, the exposure limit of that time, set at 5 mg/m3, was regularly exceeded. The sanding was identified as the activity which was responsible for all measured high concentrations. In contrast, our results showed that sanding of oak wood was always <5 mg/m3 and it was confirmed by both used instruments, the DustTrak DRX and the OPS. However, when comparing the results from each instrument, differences were found in PM fraction, except the respirable. Mass concentrations were normalized to flowrate. Thus, the discrepancy was most likely caused by calibration. While the DustTrak DRX is calibrated to so-called Arizona test dust A2 particles [48], the OPS measures number sized distribution primarily and is calibrated for size with polystyrene latex (PSL) spheres per ISO 12501-1/4 at TSI [49]. To calculate the mass concentration obtained by the OPS, the standard tabular density of oak wood was set. In addition, the DustTrak DRX uses a cloud of particles to obtain a scattered signal, while the OPS uses single particle signal.
There are several limitations to the scope of this study. The first limitation is that our research was not supported by a visual analysis of particles, e.g., using electron microscopy. Such an analysis would be appropriate for determining the shape of the particles and their origin, because it is necessary to verify whether the particles came only from oak planks, or also from aluminum oxide abrasives. It is also necessary to verify whether the contribution of particles from the sander itself (e.g., from the carbon brush) is negligible. In the future, more comprehensive study is needed to consider the above-mentioned factors. Therefore, our future work could extend our study to the analysis of particles via scanning electron microscopy and determination of the weight of the tested wood planks and sanding papers before and after the sanding process, with accurate scales. Future research should consider the effects of particle density more carefully. However, this will require a different approach in terms of the experiment design and sampling method.

5. Conclusions

Only for a few nano-objects is there currently large enough knowledge of their exposure, interactions and subsequent health impacts. The objective of this study was to determine the exposure of workers in the wood-processing industry to airborne particles generated during oak wood sanding. For comprehensive assessment, it is recommended that the occupational exposure is determined in parallel with more than one metric. In accordance with this recommendation, we focused on the measurement of number concentration, number size distribution and surface area of airborne particles in ultrafine and micro-scale sizes. The research was supplemented by the comparison of the used instruments in terms of mass concentration measurements of CFP.
The main findings and conclusions drawn from the measurements and observations made during the oak wood sanding are as follows:
  • Fine grit (P240) generated the highest mean number concentrations of UFP and CFP, followed by medium grit (P120) and coarse grit (P60);
  • The maximum obtained UFP number concentrations were slightly higher for P60, compared with P120 grit size;
  • By comparing average MD and GMD of UFP generated by particular sanding paper grits, a decreasing trend from P60 to P240 was found. Conversely, the size of CFP increased with the fineness of the sanding grit;
  • Size distribution of airborne particles was not affected by grit size. Apparent peaks of UFP and CFP number concentrations were constantly found at approximately 15 nm and 1 µm, respectively;
  • Statistically not significant difference was found for the respirable fraction when DustTrak DRX was compared with OPS in terms of mass concentration.

Author Contributions

Conceptualization, M.D. and J.S.; methodology, M.D.; software, J.S.; validation, M.V., M.S. and L.B.; formal analysis, M.S.; investigation, M.D.; resources, M.S.; data curation, J.S.; writing—original draft preparation, M.D. and J.S.; writing—review and editing, J.S.; visualization, J.S. and M.D.; supervision, M.S.; funding acquisition, M.D. All authors have read and agreed to the published version of the manuscript.

Funding

This research was funded by the Scientific Grant Agency of the Ministry of Education, Science, Research and Sports, of the Slovak Republic, and the Slovak Academy of Sciences, grant number 1/0019/19.

Institutional Review Board Statement

Not applicable.

Informed Consent Statement

Not applicable.

Data Availability Statement

The data that support the findings of this study are available from the corresponding author, J.S., upon reasonable request.

Acknowledgments

The paper is based on work performed under research contract VEGA 1/0019/19 “Predictive models of workplace atmosphere contamination by solid aerosol during mechanical wood processing” of the Scientific Grant Agency of the Ministry of Education, Science, Research and Sports, of the Slovak Republic, and the Slovak Academy of Sciences, whose support is gratefully acknowledged.

Conflicts of Interest

The authors declare no conflict of interest.

References

  1. Kumar, P.; Kalaiarasan, G.; Porter, A.E.; Pinna, A.; Kłosowski, M.M.; Demokritou, P.; Chung, K.F.; Pain, C.; Arvind, D.; Arcucci, R.; et al. An overview of methods of fine and ultrafine particle collection for physicochemical characterisation and toxicity assessments. Sci. Total Environ. 2021, 756, 143553. [Google Scholar] [CrossRef] [PubMed]
  2. Li, N.; Georas, S.; Alexis, N.; Fritz, P.; Xia, T.; Williams, M.A.; Horner, E.; Nel, A. A work group report on ultrafine particles (AAAAI): Why ambient ultrafine and engineered nanoparticles should receive special attention for possible adverse health outcomes in human subjects. J. Allergy Clin. Immunol. 2016, 138, 386–396. [Google Scholar] [CrossRef] [PubMed] [Green Version]
  3. Schraufnagel, D.E. The health effects of ultrafine particles. Exp. Mol. Med. 2020, 52, 311–317. [Google Scholar] [CrossRef] [PubMed]
  4. The European Committee for Standardisation. EN 481 Workplace Atmospheres—Size Fraction Definitions for Measurement of Airborne Particles; The European Committee for Standardisation: Brussels, Belgium, 1993. [Google Scholar]
  5. Kuuluvainen, H.; Rönkkö, T.; Järvinen, A.; Saari, S.; Karjalainen, P.; Lähde, T.; Pirjola, L.; Niemi, J.V.; Hillamo, R.; Keskinen, J. Lung deposited surface area size distributions of particulate matter in different urban areas. Atmos. Environ. 2016, 136, 105–113. [Google Scholar] [CrossRef] [Green Version]
  6. Oberbek, P.; Kozikowski, P.; Czarnecka, K.; Sobiech, P.; Jakubiak, S.; Jankowski, T. Inhalation exposure to various nanoparticles in work environment—contextual information and results of measurements. J. Nanoparticle Res. 2019, 21, 222. [Google Scholar] [CrossRef] [Green Version]
  7. Baldauf, R.W.; Devlin, R.B.; Gehr, P.; Giannelli, R.; Hassett-Sipple, B.; Jung, H.; Martini, G.; McDonald, J.; Sacks, J.D.; Walker, K. Ultrafine Particle Metrics and Research Considerations: Review of the 2015 UFP Workshop. Int. J. Environ. Res. Public Health 2016, 13, 1054. [Google Scholar] [CrossRef] [PubMed]
  8. Welling, I.; Lehtimäki, M.; Rautio, S.; Lähde, T.; Enbom, S.; Hynynen, P.; Hämeri, K. Wood Dust Particle and Mass Concentrations and Filtration Efficiency in Sanding of Wood Materials. J. Occup. Environ. Hyg. 2008, 6, 90–98. [Google Scholar] [CrossRef] [PubMed]
  9. Douwes, J.; Cheung, K.; Prezant, B.; Sharp, M.; Corbin, M.; McLean, D.; Mannetje, A.; Schlunssen, V.; Sigsgaard, T.; Kromhout, H.; et al. Wood Dust in Joineries and Furniture Manufacturing: An Exposure Determinant and Intervention Study. Ann. Work Expo. Health 2017, 61, 416–428. [Google Scholar] [CrossRef] [PubMed] [Green Version]
  10. Dado, M.; Mikušová, L.; Hnilica, R. Laboratory Investigations Applied to Wood Dust Emmited by Electrical Hand-Held Belt Sander. Manag. Syst. Prod. Eng. 2018, 26, 133–136. [Google Scholar] [CrossRef] [Green Version]
  11. IARC Working Group on the Evaluation of Carcinogenic Risks to Humans. Arsenic, Metals, Fibres and Dusts; International Agency for Research on Cancer: Lyon, France, 2012; ISBN 978-92-832-1320-8.
  12. Staffolani, S.; Manzella, N.; Strafella, E.; Nocchi, L.; Bracci, M.; Ciarapica, V.; Amati, M.; Rubini, C.; Re, M.; Pugnaloni, A.; et al. Wood dust exposure induces cell transformation through EGFR-mediated OGG1 inhibition. Mutagenesis 2015, 30, 487–497. [Google Scholar] [CrossRef]
  13. Dey, P.; Saha, S.K.; Sarkar, S. Study of the interactions of sneezing droplets with particulate matter in a polluted environment. Phys. Fluids 2021, 33, 113310. [Google Scholar] [CrossRef] [PubMed]
  14. Fennelly, K.P. Particle sizes of infectious aerosols: Implications for infection control. Lancet Respir. Med. 2020, 8, 914–924. [Google Scholar] [CrossRef]
  15. Robles-Romero, J.M.; Conde-Guillén, G.; Safont-Montes, J.C.; García-Padilla, F.M.; Romero-Martín, M. Behaviour of aerosols and their role in the transmission of SARS-CoV-2; a scoping review. Rev. Med. Virol. 2022, 32, e2297. [Google Scholar] [CrossRef]
  16. Helbich, S.; Dobslaw, D.; Schulz, A.; Engesser, K.-H. Styrene and Bioaerosol Removal From Waste Air With a Combined Biotrickling Filter and DBD–Plasma System. Sustainability 2020, 12, 9240. [Google Scholar] [CrossRef]
  17. Directive (EU) 2017/2398 of the European Parliament and of the Council of 12 December 2017 Amending Directive 2004/37/EC on the Protection of Workers from the Risks Related to Exposure to Carcinogens or Mutagens at Work (Text with EEA Relevance). 2017. Available online: http://data.europa.eu/eli/dir/2017/2398/oj/eng (accessed on 6 July 2022).
  18. Thorpe, A.; Brown, R. Factors Influencing the Production of Dust During the Hand Sanding of Wood. Am. Ind. Hyg. Assoc. J. 1995, 56, 236–242. [Google Scholar] [CrossRef]
  19. Ratnasingam, J.; Scholz, F.; Natthondan, V.; Graham, M. Dust-generation characteristics of hardwoods during sanding processes. Eur. J. Wood Prod. 2011, 69, 127–131. [Google Scholar] [CrossRef]
  20. Marková, I.; Mračková, E.; Očkajová, A.; Ladomerský, J. Granulometry of Selected Wood Dust Species of Dust from Orbital Sanders. Wood Res. 2016, 61, 10. [Google Scholar]
  21. Očkajová, A.; Kučerka, M.; Krišťák, L.; Igaz, R. Granulometric Analysis of Sanding Dust from Selected Wood Species. BioResources 2018, 13, 7481–7495. [Google Scholar] [CrossRef]
  22. Očkajová, A.; Kučerka, M.; Krišťák, L.; Ružiak, I.; Gaff, M. Efficiency of Sanding Belts for Beech and Oak Sanding. BioResources 2016, 11, 5242–5254. [Google Scholar] [CrossRef] [Green Version]
  23. Očkajová, A.; Barcík, Š.; Kučerka, M.; Koleda, P.; Korčok, M.; Vyhnáliková, Z. Wood Dust Granular Analysis in the Sanding Process of Thermally Modified Wood versus Its Density. BioResources 2019, 14. [Google Scholar]
  24. Vandličková, M.; Marková, I.; Osvaldová, L.M.; Gašpercová, S.; Svetlík, J.; Vraniak, J. Tropical Wood Dusts—Granulometry, Morfology and Ignition Temperature. Appl. Sci. 2020, 10, 7608. [Google Scholar] [CrossRef]
  25. Pędzik, M.; Stuper-Szablewska, K.; Sydor, M.; Rogoziński, T. Influence of Grit Size and Wood Species on the Granularity of Dust Particles During Sanding. Appl. Sci. 2020, 10, 8165. [Google Scholar] [CrossRef]
  26. Pędzik, M.; Rogoziński, T.; Majka, J.; Stuper-Szablewska, K.; Antov, P.; Kristak, L.; Kminiak, R.; Kučerka, M. Fine Dust Creation during Hardwood Machine Sanding. Appl. Sci. 2021, 11, 6602. [Google Scholar] [CrossRef]
  27. Ojima, J. Generation rate and particle size distribution of wood dust by handheld sanding operation. J. Occup. Health 2016, 58, 640–643. [Google Scholar] [CrossRef] [Green Version]
  28. Dado, M.; Mikusova, L.; Schwarz, M.; Hnilica, R. Effect of selected factors on mass concentration of airborne dust during wood sanding. MM Sci. J. 2019, 2019, 3679–3682. [Google Scholar] [CrossRef] [Green Version]
  29. Pavlovska, I.; Martinsone, Ž.; Ramata-Stunda, A.; Vanadziņš, I.; Mārtiņsone, I.; Seile, A. Comparison of biological markers in aerosol-weighed workplaces. J. Nanoparticle Res. 2019, 21, 138. [Google Scholar] [CrossRef] [Green Version]
  30. The European Committee for Standardisation. EN 17058 Workplace Exposure—Assessment of Exposure by Inhalation of Nano-Objects and Their Aggregates and Agglomerates; The European Committee for Standardisation: Brussels, Belgium, 2018. [Google Scholar]
  31. Deutsches Institut fur Normung. EN 16966 Workplace Exposure—Measurement of Exposure by Inhalation of Nano-Objects and Their Aggregates and Agglomerates—Metrics to Be Used Such as Number Concentration, Surface Area Concentration and Mass Concentration; Deutsches Institut fur Normung: Berlin, Germany, 2019. [Google Scholar]
  32. Hinds, W.C.; Zhu, Y. Aerosol Technology: Properties, Behavior, and Measurement of Airborne Particles, 3rd ed.; Wiley; John Wiley & Sons: Hoboken, NJ, USA, 2022; ISBN 978-1-119-49404-1. [Google Scholar]
  33. Gu, J.; Kirsch, I.; Schripp, T.; Froning-Ponndorf, F.; Berthold, D.; Salthammer, T. Human exposure to airborne particles during wood processing. Atmos. Environ. 2018, 193, 101–108. [Google Scholar] [CrossRef]
  34. Institute for Occupational Safety and Health of the German Technical Information: Ultrafine Aerosols and Nanoparticles at the Workplace: Criteria for Assessment of the Effectiveness of Protective Measures. Available online: https://www.dguv.de/ifa/fachinfos/nanopartikel-am-arbeitsplatz/beurteilung-von-schutzmassnahmen/index-2.jsp (accessed on 6 July 2022).
  35. Rim, D.; Green, M.; Wallace, L.; Persily, A.; Choi, J.-I. Evolution of Ultrafine Particle Size Distributions Following Indoor Episodic Releases: Relative Importance of Coagulation, Deposition and Ventilation. Aerosol Sci. Technol. 2012, 46, 494–503. [Google Scholar] [CrossRef]
  36. Nazaroff, W.W. Indoor particle dynamics. Indoor Air 2004, 14, 175–183. [Google Scholar] [CrossRef] [PubMed]
  37. Kwon, H.-S.; Ryu, M.H.; Carlsten, C. Ultrafine particles: Unique physicochemical properties relevant to health and disease. Exp. Mol. Med. 2020, 52, 318–328. [Google Scholar] [CrossRef]
  38. Hugony, F.; Ozgen, S.; Morreale, C.; Signorini, S.; Maggioni, A.; Migliavacca, G.; Marengo, S.; Lonati, G.; Ripamonti, G. Nanoparticles Size Distribution in Wood Combustion; ETH Zentrum: Zurich, Switzerland, 2012; p. 6. [Google Scholar]
  39. Bølling, A.K.; Pagels, J.; Yttri, K.E.; Barregard, L.; Sallsten, G.; Schwarze, P.E.; Boman, C. Health effects of residential wood smoke particles: The importance of combustion conditions and physicochemical particle properties. Part. Fibre Toxicol. 2009, 6, 29. [Google Scholar] [CrossRef] [PubMed] [Green Version]
  40. Gwaze, P.; Schmid, O.; Annegarn, H.J.; Andreae, M.O.; Huth, J.; Helas, G. Comparison of three methods of fractal analysis applied to soot aggregates from wood combustion. J. Aerosol Sci. 2006, 37, 820–838. [Google Scholar] [CrossRef]
  41. Zhang, H.; Wang, S.; Hao, J.; Wan, L.; Jiang, J.; Zhang, M.; Mestl, H.E.; Alnes, L.W.; Aunan, K.; Mellouki, A.W. Chemical and size characterization of particles emitted from the burning of coal and wood in rural households in Guizhou, China. Atmos. Environ. 2012, 51, 94–99. [Google Scholar] [CrossRef]
  42. Maciejewska, A.; Wojtczak, J.; Bielichowska-Cybula, G.; Domańska, A.; Dutkiewicz, J.; Mołocznik, A. Biological effect of wood dust. Med. Pract. 1993, 44, 277–288. [Google Scholar]
  43. Buonanno, G.; Morawska, L.; Stabile, L. Exposure to welding particles in automotive plants. J. Aerosol Sci. 2011, 42, 295–304. [Google Scholar] [CrossRef]
  44. Guerreiro, C.; Gomes, J.; Carvalho, P.; Santos, T.J.G.; Miranda, R.; Albuquerque, P. Characterization of airborne particles generated from metal active gas welding process. Inhal. Toxicol. 2014, 26, 345–352. [Google Scholar] [CrossRef] [PubMed]
  45. Salo, L.; Rönkkö, T.; Saarikoski, S.; Teinilä, K.; Kuula, J.; Alanen, J.; Arffman, A.; Timonen, H.; Keskinen, J. Concentrations and Size Distributions of Particle Lung-deposited Surface Area (LDSA) in an Underground Mine. Aerosol Air Qual. Res. 2021, 21, 200660. [Google Scholar] [CrossRef]
  46. Fransman, W.; Bekker, C.; Tromp, P.; Duis, W.B. Potential Release of Manufactured Nano Objects During Sanding of Nano-Coated Wood Surfaces. Ann. Occup. Hyg. 2016, 60, 875–884. [Google Scholar] [CrossRef]
  47. Scheeper, B. Wood-dust exposure during wood-working processes. Ann. Occup. Hyg. 1995, 39, 141–154. [Google Scholar] [CrossRef]
  48. International Organization for Standardization. Road Vehicles—Test Contaminants for Filter Evaluation—Part 1: Arizona Test Dust; International Organization for Standardization: Geneva, Switzerland, 2016. [Google Scholar]
  49. TSI Incorporated Optical Particle Sizer Mass Calibration Method Application Note OPS-001. Available online: https://tsi.com/getmedia/e261878e-7953-4b8f-a783-c83fdddde9b6/Mass_Calibration_US_OPS-001?ext=.pdf (accessed on 8 July 2022).
Figure 1. Layout of experimental setup: 1—workbench, 2—test specimen, 3—sander, 4—IOM sampler, 5—aerosol monitor, 6—optical particle sizer, 7—microclimatic condition monitor, 8—software tool for data processing, 9—nanoparticle sizer.
Applsci 12 07644 g001
Figure 2. Compressive force monitoring system: 1—data box/Bluetooth transmitter, 2—data cable, 3—glove with pressure sensors.
Applsci 12 07644 g002
Figure 3. Comparison of mean (whisker: mean ± SD) total number concentration of particles during the sanding process (0:05:00–0:10:00) and residual sampling (until 0:15:00) for sanding grits P60, P120, and P240: (a) Time profile of measured data with NanoScan SMPS; (b) Time profile of measured data with OPS. Red dashed line represents upper background level.
Applsci 12 07644 g003
Figure 4. Particle size distributions generated by grits P60, P120, and P240: (a) Normalized number concentration measured with NanoScan SMPS; (b) Normalized number concentration measured with OPS; (c) Normalized surface area concentration (LDSA) measured with NanoScan SMPS; (d) Normalized surface area concentration (LDSA) measured with OPS.
Applsci 12 07644 g004
Figure 5. PM mass concentration measured by OPS and DustTrak DRX, and paired t test comparison of particle mass generated by sanding paper grits: (a) P60; (b) P120; (c) P240.
Applsci 12 07644 g005
Table 1. Descriptive statistics of measured data by NanoScan SMPS and OPS.
InstrumentSanding GritNMin.Max.Mean ± SDMDMedian DiameterGMD ± GSD *
[#/cm3][#/cm3][#/cm3][nm][nm][nm]
NanoScan SMPSP6010398228,97116,201 ± 598545.6331.6934.03 ± 2.08
P12010434128,83217,618 ± 598740.3326.0229.32 ± 2.08
P24010467232,21521,410 ± 389834.5922.9425.80 ± 1.97
OPSP601029426191 ± 1101.17 × 1030.61 × 1030.79 ± 2.21 × 10³
P1201070421225 ± 971.20 × 1030.64 × 1030.82 ± 2.23 × 10³
P24010127504327 ± 931.30 × 1030.72 × 1030.89 ± 2.26 × 10³
Note: * geometric standard deviation.
Table 2. One-way ANOVA and post-hoc Tukey’s test results comparing sanding paper grit by particle number concentration.
InstrumentOne-Way ANOVA and Post-Hoc Tukey’s TestHSDQ *
HSD0.05 = 1487.09Q0.05 = 3.33
NanoScan SMPSP60 vs. P1201417.283.17 (p = 0.07)
P60 vs. P2405208.7711.65 (p < 0.001)
P120 vs. P2403791.498.48 (p < 0.001)
HSD0.05 = 27.87Q0.05 = 3.33
OPSP60 vs. P12033.363.98 (p = 0.01)
P60 vs. P240135.9416.22 (p < 0.001)
P120 vs. P240102.5812.24 (p < 0.001)
Note: * studentized range.
Publisher’s Note: MDPI stays neutral with regard to jurisdictional claims in published maps and institutional affiliations.

