Abstract
Cyclic steam stimulation (CSS) is successfully applied to increase heavy oil recovery in heavy oil reservoirs in Bohai Bay, China. However, during the CSS processes, hydrogen sulfide (H2S) was detected in some heavy oil reservoirs. The existing literature mainly focused on the H2S generation of onshore heavy oil. There is no concrete experimental data available, especially about the level of H2S generation during CSS of offshore heavy oil. In addition, there is still a lack of effective reaction kinetic models and numerical simulation methods to simulate H2S generation during the CSS of offshore heavy oil. Therefore, this paper presents a case study from Bohai Bay, China. First, the laboratory aquathermolysis tests were conducted to simulate the gases that are produced during the CSS processes of heavy oil. The effects of the reaction temperature and time on the H2S generation were studied. Then, a one-dimensional CSS experiment was performed to predict H2S generation under reservoir conditions. A kinetic model for the prediction of H2S generation during the CSS of heavy oil was presented. The developed model was calibrated with the experimental data of the one-dimensional CSS experiment at a temperature of 300 °C. Finally, a reservoir model was developed to predict H2S generation and investigate the effects of soaking time, steam quality, and steam injection volume on H2S generation during CSS processes. The results show that the H2S concentration increased from 0.77 ppm in the first cycle to 1.94 ppm in the eighth cycle during the one-dimensional CSS experiment. The average absolute error between the measured and simulated H2S production was 12.46%, indicating that the developed model can accurately predict H2S production. The H2S production increase with soaking time, steam quality, and steam injection volume due to the strengthened aquathermolysis reaction. Based on the reservoir simulation, the H2S production was predicted in the range of 228 m3 to 2895 m3 within the parameters of this study.
1. Introduction
Recently, due to the gradual depletion of onshore oil resources and the growing global energy demand, the exploitation of offshore heavy oil resources has attracted much attention [1,2,3]. Bohai Bay, China, has abundant heavy oil resources with approximately 4 billion tons [4,5]. Cyclic steam stimulation (CSS) is successfully applied to increase heavy oil recovery in heavy oil reservoirs in Bohai Bay, China [6,7]. However, during the CSS processes, hydrogen sulfide (H2S) was detected in some heavy oil reservoirs [8]. H2S generation can even reach up to 0.044%. H2S generation from production operations is a concern in CSS recovery of offshore heavy oil because H2S poses a hazard to health, affects the integrity of wellbore tubulars, and impacts surface facility design considerations [9,10,11]. Therefore, it is necessary to predict H2S production prior to CSS implementation.
The generation of H2S has attracted considerable attention because of its toxicity and corrosiveness. Hyne and Greidanus defined the chemical reaction between oil sand and steam as an aquathermolysis reaction and considered that the C–S bond cleavage of S-containing organic compounds in oil sands was an important step in the aquathermolysis reaction [12]. Clark et al. used tetrahydrothiophene as a model compound for aquathermolysis reactions, revealing the reaction path of tetrahydrothiophene cracking to H2S [13]. Perez-Perez et al. proposed a kinetic model to predict the H2S generation and deduced the evolution of H2S in resins and asphalt of heavy oil [14]. Kapadia et al. developed an aquathermolysis kinetic model for Athabasca bitumen to predict H2S concentrations, and the kinetic model was also validated against a wide range of laboratory and field data (Assabaska Oilfield, Canada) [15]. Furthermore, Zhao et al. conducted aquathermolysis experiments with minerals and concluded that the H2S concentration was higher when minerals were present in the aquathermolysis reaction mixture. Besides, they also reported that the reaction temperature of aquathermolysis could be reduced due to this catalytic effect [16]. Na et al. carried out aquathermolysis experiments with bitumen samples in a H2S corrosion-resistant autoclave and found that the amounts of H2S generated increased with an increase in the reaction time and temperature [17]. Meanwhile, Ma et al. conducted aquathermolysis experiments of LH residual oil and reported that the use of superheated steam is effective in promoting H2S generation [18].
The aforementioned literature mainly focused on the H2S generation of onshore heavy oil. There is no concrete experimental data available, especially about the level of H2S generation during the CSS of offshore heavy oil. In addition, almost all of the aforementioned aquathermolysis tests were performed under static conditions by the reactors. The fluid displacement and the effects of reservoir rocks were not taken into account. There is still a lack of effective reaction kinetic models and numerical simulation methods to simulate H2S generation during the CSS of offshore heavy oil. In addition, numerous experiments were conducted and found that the heavy oil quality (chemical group composition, viscosity, and gas composition) was improved after aquathermolysis processes [19,20]. However, the H2S generation during the experimental process was not investigated. Therefore, this paper presents a case study from Bohai Bay, China. First, the laboratory aquathermolysis tests were conducted to simulate the gases that are produced during CSS recovery of heavy oil. The effects of the reaction temperature and time on the H2S generation were studied. Then, a one-dimensional CSS experiment was conducted to predict H2S generation. A kinetic model for the prediction of H2S generation during the CSS of heavy oil was presented. The developed model was calibrated with the experimental data of the one-dimensional CSS experiment at a temperature of 300 °C. Finally, a reservoir model was developed to predict H2S generation and investigate the effects of soaking time, steam quality, and steam injection volume on H2S production during CSS.
2. Experiment
2.1. Experimental Materials
The heavy oil was collected from an offshore heavy oil reservoir. The basic properties and composition of the heavy oil are shown in Table 1. The water used in this study was distilled water. Silica sand with a particle size of 200 μm was used as porous media to prepare the sandpack model in the CSS experiment. N2 with a purity of 99.99% was provided by Qingdao Xinkeyuan Technology Co., Ltd., Qingdao, China.
Table 1.
Basic properties and composition of heavy oil.
2.2. Experimental Setup
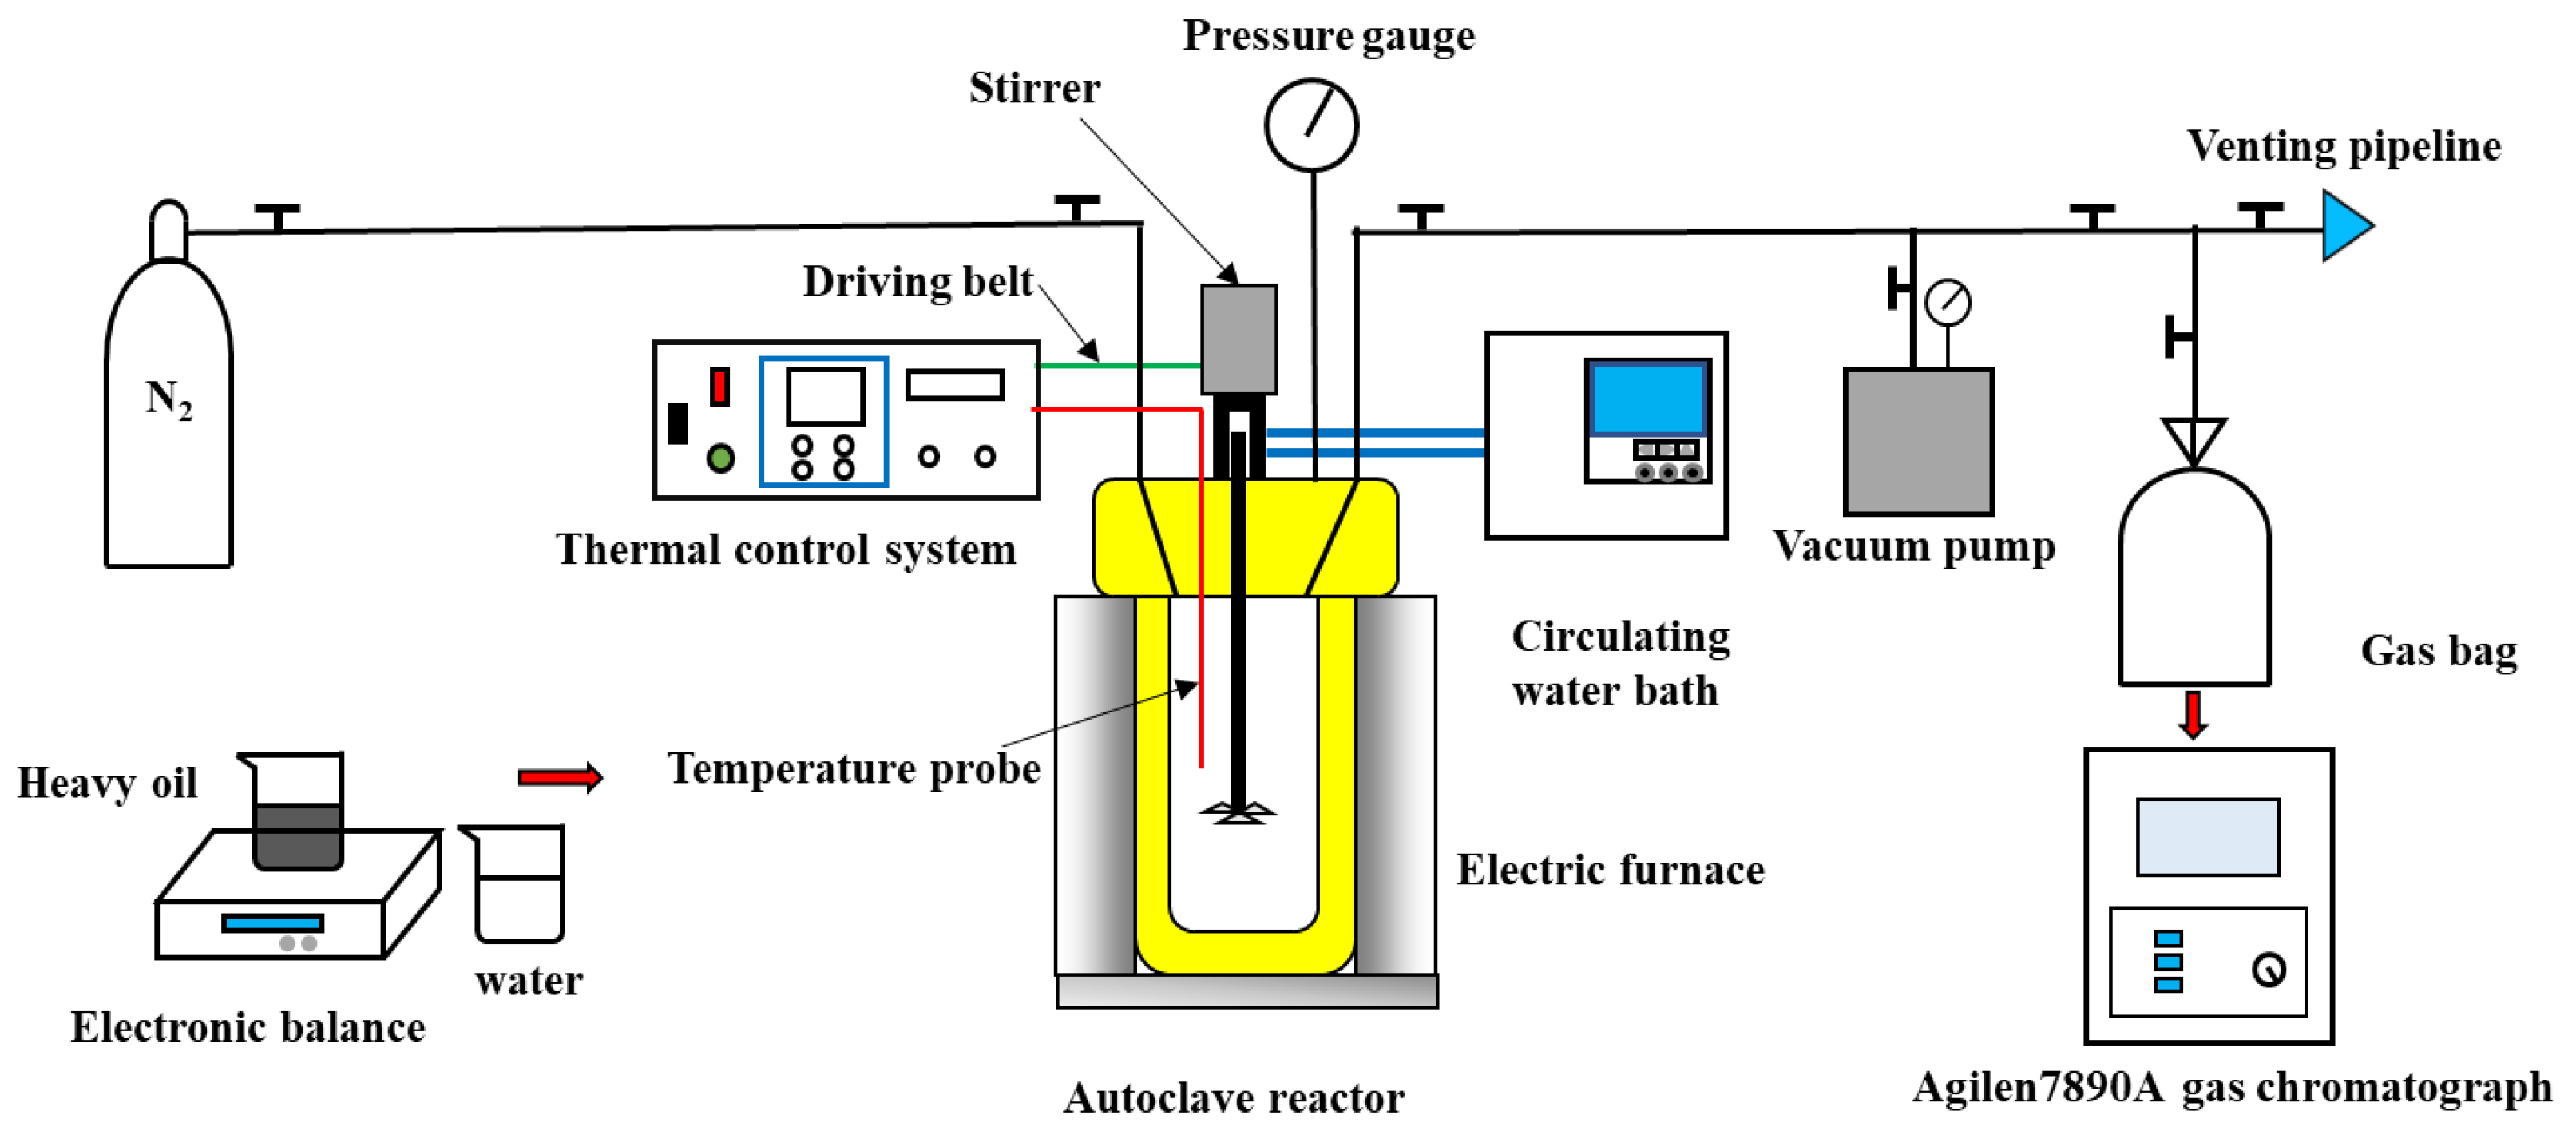
2.2.1. Aquathermolysis Experiments
The setup of the aquathermolysis experiments is detailed in Figure 1. The aquathermolysis experiments were performed in a closed autoclave reactor (Anhui Kemi Machinery Technology Co., Ltd., Hefei, China). The 300 mL reactor was made of Hastelloy C276, and its maximum operating pressure and temperature can achieve 34.5 MPa and 500 °C, respectively. A thermal control system was used to control the temperature of the autoclave reactor by an electric furnace and displayed the temperature data transmitted by an internal temperature probe in real time. A pressure gauge (Jasco 25-1009-SW-02L-400BR-X6W) with a range of 0–40 MPa was used to monitor the pressure during each experiment. The top of the reactor was equipped with a magnetic stirrer with stirring fluid, and a circulating water bath was provided to prevent the magnetic stirrer from being damaged at high temperatures. A vacuum pump was applied to empty the air in the system in advance to improve the accuracy of the experiments. Before each experiment, a certain amount of heavy oil and water were weighed by an electronic balance, and nitrogen was used as an eluent gas. After each experiment, 500 mL gas bags were used to collect the gas products. A gas chromatograph (7890A, Agilent CO., Ltd., Santa Clara, CA, USA) equipped with a flame ionization detector (FID) and sulfur chemiluminescence detector (SCD) was used to analyze the composition of gas products.
Figure 1.
Schematic illustration of the experimental setup for aquathermolysis experiments.
2.2.2. One-Dimensional CSS Experiment
The setup of the one-dimensional CSS experiment is shown in Figure 2. The CSS experiment was performed in a one-dimensional sandpack model (3.8 cm in diameter and 48 cm in length) made of Hastelloy C276. Its maximum operating pressure and temperature were 50 MPa and 450 °C, respectively. The pump was used to inject water and heavy oil into the sandpack model. Its minimum injection rate can reach 0.01 mL/min. The steam generator was used to heat the water provided by a pump to the specified injection temperature, and its maximum working pressure and the temperature reached 35 MPa and 450 °C, respectively. A temperature control system was used to control the sandpack model temperature by six belt heaters (power 3500 W) surrounded by the sandpack surface, and a pressure probe together with a computer was used to monitor the sandpack pressure. The products were cooled to 60 °C through the cooling system and condenser to avoid damage to the back-pressure regulator (BPR). The BPR, together with a hand pump, was used to adjust the sandpack model pressure. The gas–liquid separator separated the products into the liquid and gas phases. An electronic balance and a gas meter were used to measure the mass of the liquid and gas volume. The gas was collected in 500 mL gas bags and analyzed by the gas chromatograph.
Figure 2.
Schematic illustration of the experimental setup for one-dimensional CSS experiment.
2.3. Experimental Procedures
2.3.1. Aquathermolysis Experiments
The autoclave reactor with 50 g heavy oil and 25 g water was sealed. Inspection for leakage was completed after N2 was used to evacuate the air in the autoclave reactor (repeated three times). Then, the thermal control system controlled the electric furnace to heat the reactor at a rate of 8 K/min. When the temperature reached 100 °C, the magnetic stirrer started to stir the fluid in the reactor at a stirring rate of 600 rpm. After the temperature in the reactor reached the predetermined experimental temperature, the reactor was heated at a constant temperature for a certain reaction time. Once the aquathermolysis reaction was completed, the reactor was rapidly cooled with forced air to avoid the influence of steam on the experimental results. Finally, the gas products were collected in 500 mL gas bags and analyzed by the gas chromatograph. According to the aforementioned process, a series of aquathermolysis experiments were conducted to examine the effects of temperature (270 °C and 300 °C) and time (0.5 d and 2 d) on gas products.
2.3.2. One-Dimensional CSS Experiment
The silica sand was filled in the clean one-dimensional sandpack model. After the experimental setups were connected, inspection for leakage and vacuuming were completed. The temperature control system controlled the band heater to heat the sandpack model to 46 °C (reservoir temperature). Then, the pump was used to inject water and heavy oil into the sandpack model, and the porosity, permeability, and initial oil saturation of the model were measured, which were 56.8%, 2748 mD, and 85.4%, respectively. After the sandpack model preparation was finished, the steam generator heated the distilled water to the predetermined temperature (300 °C), and the steam near 100% quality was injected into the model at a rate of 10 mL/min until the reservoir pressure reached the desired pressure. After steam injection, the model was soaked till pressure was stable. The time of steam injection and soaking in each cycle was 2 h in total. During production, the BPR was used to control the outlet pressure, and 1 MPa/h was applied as a pressure drop rate in each cycle. The whole cycle finished when the model pressure was 1 MPa. The CSS cycles were repeated until the end of the eighth cycle. The mass of liquid and gas volume was measured by the electronic balance and the gas meter, and the gas products at the end of cycle 1, cycle 4, and cycle 8 were collected in 500 mL bags, respectively. Finally, the collected gas products were analyzed by the gas chromatograph.
2.4. Experimental Results and Discussion
2.4.1. Aquathermolysis Experiments
Table 2 shows the results of gas chromatography for the gas products. It can be seen from Table 2 that the concentrations of H2S, CO2, and H2 were 0.00013% (1.3 ppm), 24.487%, and 38.52%, respectively, at 270 °C and 0.5 d.
Table 2.
Results of gas chromatography for gas products at different reaction temperatures and times.
The possible reasons for the presence of H2S, CO2, and H2 in the gas products are shown as follows [12]:
According to Equations (1)–(5), it can be seen that the C–S bond of the S-containing organic compound of heavy oil broke in the aquathermolysis reaction, resulting in the presence of H2S, CO2, and H2 in the gas products.
Of course, many paraffin hydrocarbons and olefins were also detected in the gas products. For example, the concentrations of methane, ethane, and propane were 12.921%, 2.381%, and 2.516%, respectively, while the concentrations of C6+, pentene, and trans-2-butene were 3.797%, 1.256%, and 3.658%, respectively at 270 °C and 0.5 d. Similar results were observed in the other three sets of experiments. The possible reasons are shown as follows: (1) The C–C bond cleavage of asphalt chains and the β scission in the alkyl side chain of aromatics of heavy oil lead to the formation of short olefins and low molecular light hydrocarbon in the aquathermolysis reaction [21,22]. (2) The extraction of steam resulted in the formation of long-chain hydrocarbons (such as C6+, trans-2-butene, pentene, and so on) in the gas products [23].
Besides, it can be seen from Table 2 that the H2S concentration increases with the increase in temperature. When the reaction time was 0.5 days, the H2S concentrations were 0.00013% (1.3 ppm) and 0.003185% (31.85 ppm) at 270 °C and 300 °C, respectively. This is due to the fact that with the increase in temperature, the reaction rate accelerated, and the C–S bond was easier to break. In addition, the concentrations of CO2 and H2 also varied from 24.487% and 38.52% to 26.935% and 39.437%, respectively. Similar results were observed when the reaction time was 2 d. The significant increase in the concentrations of CO2 and H2 also proves that an increasing temperature is beneficial for the aquathermolysis of heavy oil. Due to the accelerated aquathermolysis reactions, light hydrocarbons (methane, ethane, and propane) increased, and heavy hydrocarbons (pentene, trans-2-butene, and C6+) decreased with the increase in temperature.
Table 2 also shows the results of the aquathermolysis reaction at different reaction times. The H2S concentration increased with the increase in reaction time. When the reaction time varied from 0.5 d to 2 d at 300 °C, the H2S concentration increased from 0.003185% (31.85 ppm) to 0.01019% (101.9 ppm). The concentrations of CO2 and H2 also increased from 26.935% and 39.437% to 30.861% and 40.265%, respectively. The results suggest that increasing time deepened the degree of aquathermolysis.
According to the experimental data of the aquathermolysis experiments, the activation energy and frequency factor were estimated by a Kapadia kinetics model [15]. As shown in Figure 3a, the reaction time had a linear relation with the concentrations of H2S [24]. The reaction time and the concentration of H2S were fitted, with the slope of the regression lines showing the values of reaction rates (k) at different temperatures. It can be seen from Figure 3a that the reaction rates at 300 °C and 270 °C are 0.0000467 and 0.00001933, respectively. Figure 3b shows the relationship between the reaction rates (k) and temperatures (T). The corresponding kinetic parameters (activation energy and frequency factor) were obtained according to the slope and intercept of the interpolation line (Figure 3b), which are 76.12 kJ/mol and 404.03 1/day, respectively.
Figure 3.
(a) Interpolation lines for obtaining the reaction rates at different temperatures; (b) An interpolation line for obtaining the kinetic parameters.
2.4.2. One-Dimensional CSS Experiment
The results of the one-dimensional CSS experiment are shown in Figure 4. As shown in Figure 4a, the sandpack model pressure increased during the steam injection. Once the target pressure was reached, the soaking began, and then the sandpack model pressure tended to be stable. When the soaking was completed, the pressure decreased at 1 MPa/h. In addition, as the CSS cycle increased, the oil production gradually dropped while the water cut gradually increased (Figure 4b). The oil recovery at the end of the eighth cycle reached 40.10% (Figure 4a).
Figure 4.
Results of the one-dimensional CSS experiment: (a) oil recovery and pressure; (b) oil production and water cut.
The results of gas chromatography are shown in Table 3. It can be seen from Table 3 that the H2S concentration increased from 0.000077% (0.77 ppm) in the first cycle to 0.000194% (1.94 ppm) in the eighth cycle during the one-dimensional CSS experiment. This is because the injected amount of steam increased as the oil was produced, resulting in stronger aquathermolysis reactions. However, it is noted that, after the fourth cycle, the amount of oil saturation was gradually reduced. Therefore, the concentration of H2S at the end of the eighth cycle was only 0.000004% higher than that at the end of the fourth cycle. In addition, the relative volume of CO2 decreased from 98.08% to 89.769% due to the generation of more types of gases during the aquathermolysis reactions and steam extraction.
Table 3.
Results of gas chromatography during the CSS process.
3. Numerical Simulation
3.1. One-Dimensional Numerical Simulation
3.1.1. Building the One-Dimensional Numerical Simulation Model
In this study, CMG-STARS software was used to develop a numerical model to simulate the H2S generation during the one-dimensional CSS experiment. According to the size of the one-dimensional sandpack model, a one-dimensional numerical simulation model was established, as shown in Figure 5. Reasonable grid size and step size can not only approach reality, but also improve the operational speed of the grid model. Therefore, the one-dimensional numerical simulation model included 48 × 19 × 19 (17328) grids, and the grid size was 1 cm (X) × 0.2 cm (Y) × 0.2 cm (Z). The reservoir properties (porosity, permeability, oil saturation) were obtained from the experimental data, and Table 4 shows the other reservoir and rock properties used in the model.
Figure 5.
One-dimensional numerical simulation model.
Table 4.
The reservoir fluid and rock properties used in the model.
In this study, the fluid model was set up with three components: water, heavy oil, and H2S. The density and oil volume factors of heavy oil are 955.977 (kg/m3) and 1.035, respectively. The viscosity–temperature curve of heavy oil, oil–water relative permeability curve, and gas–liquid relative permeability curve adopted in the model are shown in Figure 6 and Figure 7.
Figure 6.
Viscosity–temperature curve of the heavy oil.
Figure 7.
Relative permeability curve: (a) the oil–water relative permeability curve; (b) the gas–liquid relative permeability curve.
The kinetic parameters (activation energy and frequency factor) used in the numerical simulation model were obtained from the aforementioned studies (Figure 3), and the following reaction Equation (6) was applicable to describe the generation of H2S during the CSS process.
Heavy Oil→H2S
The production parameters of wells in the model are consistent with the operating parameters during the one-dimensional CSS experiment.
3.1.2. History Matching
Taking the cumulative oil production and H2S production of the one-dimensional CSS experiment as the fitting targets, the matching was carried out by mainly adjusting the relative permeability curve and kinetic parameters, such as activation energy and frequency factor in the developed numerical simulation model. As shown in Figure 8, the simulated cumulative oil production and H2S production are consistent with those obtained by experiments. The average absolute errors between the measured and simulated cumulative oil production and H2S production were 4.31% and 12.46%, respectively. All the results indicate that the measured and simulated H2S production had a good consistency, and the developed model can accurately predict H2S production during CSS processes. Therefore, the calibrated parameters were used to predict H2S production in the following reservoir numerical simulation.
Figure 8.
Matching of measured and simulated results: (a) cumulative oil production; (b) H2S production.
3.2. Reservoir Numerical Simulation
Prediction of H2S Production
There is a heavy oil reservoir in Bohai Bay, China, at depths of 800 to. 1000 m, with porosities of 12–45%, average permeabilities of 2450 mD, and initial oil saturation of 70–82%. In the reservoir model, to consider the reasonable running time, the total number of cells in the three-dimensional (3D) model was equal to 20,000. The oil layer was vertically subdivided into 10 zones. The reference depth of the reservoir simulation model was set equal to 800 m with pressure at 8000 kPa. Basic reservoir properties and operational parameters for the 3D reservoir model are shown in Table 5. The relative permeability curves and kinetic parameters obtained from the history matching of the one-dimensional CSS experiment are directly applied to the reservoir simulation.
Table 5.
Reservoir properties and operational parameters used in the simulation model.
Based on the established reservoir model, the H2S production during the CSS process of offshore reservoirs was predicted, ranging from 228 m3 to 1490 m3 (Figure 9). However, it is noted that the H2S production decreases with the increase of cycles after two cycles. This is attributed to the fact that the continuous production of heavy oil near-wellbore leads to a decrease in the amount of S-containing organic compounds, resulting in a weakened aquathermolysis reaction.
Figure 9.
H2S production under different CSS cycles.
3.3. Sensitivity Analysis
3.3.1. Effects of Steam Quality
Figure 10 shows the effects of steam quality on H2S production. It can be found from Figure 10 that the production of H2S has an increasing trend with the increase in steam quality. The maximum H2S production is 2895 m3 when the steam quality is 1. This is because the steam with higher quality has a high latent heat of vaporization and a large specific volume. When the steam was injected into the reservoir, the steam with a higher steam quality accelerated the aquathermolysis reaction and increased the H2S production.
Figure 10.
Effects of steam quality on H2S production.
3.3.2. Effects of Soaking Time
Figure 11 shows the effects of soaking times (1–5 days) on H2S production. As shown in Figure 11, the production of H2S increases gradually with the increase in soaking time. The reason for this trend is that with the increase in soaking time, the time of aquathermolysis reaction increases. Therefore, the extent of the aquathermolysis reaction is gradually deepened. However, the increasing degree of H2S production gradually decreases with the increase in soaking time after the third cycle. The reason is that the oil saturation near-wellbore decreases after the continuous aquathermolysis reactions.
Figure 11.
Effects of soaking times on H2S production.
3.3.3. Effects of Steam Injection Volume
Figure 12 shows the effects of steam volumes on H2S production. It can be seen from Figure 12 that the production of H2S increases from 652 m3 to 1490 m3 as steam injection volume increases from 5500 m3 to 7500 m3 per cycle. It is because the aquathermolysis reaction of heavy oil is more intense due to the existence of more steam and higher heat.
Figure 12.
Effects of steam volumes on H2S production.
4. Conclusions
- (1)
- The concentrations of H2S increased with the increase in temperature and time. The aquathermolysis reaction resulted in the presence of H2S, CO2, and H2 in the gas products. The effects of the oil–water ratio, rock minerals, and pressure on the concentrations of H2S need to be further investigated, and the oil products after the aquathermolysis need to be comprehensively analyzed in future research.
- (2)
- The established kinetic model can be used to predict H2S production during the CSS processes. The activation energy and frequency factor were estimated to be 76.12 KJ/mol and 404.03 1/day, respectively.
- (3)
- The H2S concentrations increased from 0.77 ppm to 1.94 ppm during the one-dimensional CSS experiment. As the CSS cycle increased, the oil production gradually dropped while the water cut gradually increased. The oil recovery at the end of the eighth cycle reached 40.10%.
- (4)
- The measured and simulated H2S production had a good consistency, indicating that the developed model has high precision in predicting H2S production during CSS processes.
- (5)
- The H2S production increased with the increase in soaking time, steam quality, and steam injection volume due to the strengthened aquathermolysis reactions. Based on the reservoir simulations, the H2S production was predicted in the range of 228 m3 to 2895 m3 within the parameters of this study.
Author Contributions
Conceptualization, T.W.; methodology, T.W. and R.Y.; formal analysis, L.Z. and W.Z.; investigation, Y.S. and Y.B.; data curation, Y.S.; writing—original draft preparation, T.W. and W.Z.; writing—review and editing, T.W. and L.Z. All authors have read and agreed to the published version of the manuscript.
Funding
This research was funded by the National Science and Technology Major Project of the Ministry of Science and Technology of China (2016ZX05025-004) and the Major Science and Technology of China National Offshore Oil Corporation (YXKY-ZX 06 2021).
Institutional Review Board Statement
Not applicable.
Informed Consent Statement
Not applicable.
Data Availability Statement
Data sharing is not applicable to this article.
Conflicts of Interest
The authors declare no conflict of interest.
References
- Zheng, W.; Fan, T.G.; Tan, X.H.; Jiang, W.D.; Wang, T.C.; Xie, H.J. Numerical simulations of chemical-assisted steam flooding in offshore heavy Oil reservoirs after water flooding. Geofluids 2021, 2021, 8794022. [Google Scholar] [CrossRef]
- Zhang, Y.Y.; Chen, H.J.; Sun, X.F.; Duan, X.W.; Hu, W.T.; Zhang, X.S. Optimization of thermal recovery strategies for offshore heavy oil reservoirs in Bohai Bay, China. Pet. Sci. Technol. 2016, 34, 139–144. [Google Scholar] [CrossRef]
- Pan, G.M.; Chen, J.B.; Zhang, C.Q.; Liu, D.; Wu, J.T.; Li, H. Combined technology of weak gel flooding assisting thermal huff and puff enhances oil recovery for offshore heavy oil field. In Proceedings of the Annual Technical Conference and Exhibition, Dubai, United Arab Emirates, 26 September 2016. [Google Scholar]
- Sun, C.; Hou, J.; Pan, G.M.; Xia, Z.Z. Optimized polymer enhanced foam flooding for ordinary heavy oil reservoir after cross-linked polymer flooding. J. Pet. Explor. Prod. Technol. 2016, 6, 777–785. [Google Scholar] [CrossRef] [PubMed]
- Sun, X.F.; Zhao, H.; Zhang, Y.Y.; Liu, Y.L.; Chen, G.P.; Wang, W.H. An experimental study on the oil-soluble surfactant-assisted cyclic mixed solvent injection process for heavy oil recovery after primary production. Fuel 2019, 254, 115656. [Google Scholar] [CrossRef]
- Carpenter, C. Offshore heavy oil polymer flooding pilot reveals alternative paths. J. Pet. Technol. 2021, 73, 49–50. [Google Scholar] [CrossRef]
- Yi, Y.F.; Li, S.Y.; Ding, F.C.; Yu, H. Change of asphaltene and resin properties after catalytic aquathermolysis. Pet. Sci. 2009, 6, 194–200. [Google Scholar] [CrossRef] [Green Version]
- Yu, X.A.; Li, X.P.; Wang, S.L.; Luo, Y. A multicomponent thermal fluid numerical simulation method considering formation damage. Geofluids 2021, 2021, 8845896. [Google Scholar] [CrossRef]
- Ibatullin, T.R.; Yang, T.; Petersen, E.B.; Chan, M.; Rismyhr, O.; Tollefsen, S. Simulation of hydrogen sulfide and carbon dioxide production during thermal recovery of bitumen. In Proceedings of the Reservoir Characterisation and Simulation Conference and Exhibition, Abu Dhabi, United Arab Emirates, 9 October 2011. [Google Scholar]
- Thimm, H.F. Aquathermolysis and sources of produced gases in SAGD. In Proceedings of the Heavy Oil Conference-Canada, Calgary, AB, Canada, 6 October 2014. [Google Scholar]
- Hosseiny, E.; Baniasad, A.R.; Dehyadegari, E. The genesis of H2S associated with heavy oils in Hendijan and Bahregansar oilfields. Sarvak reservoir. Energy Sources 2016, 38, 1140–1147. [Google Scholar] [CrossRef]
- Hyne, J.B.; Clark, P.D.; Clarke, R.A. Aquathermolysis of heavy oil. In Proceedings of the 2nd International Conference on Heavy Crudes and Tar Sands, Caracas, Venezuela, 7 February 1982. [Google Scholar]
- Clark, P.D.; Hyne, J.B.; Tyrer, J.D. Chemistry of organosulphur compound types occurring in heavy oil sands: 1. High temperature hydrolysis and thermolysis of tetrahydrothiophene in relation to steam stimulation processes. Fuel 1983, 62, 959–962. [Google Scholar] [CrossRef]
- Perez-Perez, A.; Kamp, A.M.; Soleimani, H.; Darche, G. Numerical simulation of H2S and CO2 generation during SAGD. In Proceedings of the World Heavy Oil Congress, Edmonton, AB, Canada, 14 March 2011. [Google Scholar]
- Kapadia, P.R.; Kallos, M.S.; Gates, I.D. A new reaction model for aquathermolysis of Athabasca bitumen. Can. J. Chem. Eng. 2013, 91, 475–482. [Google Scholar] [CrossRef]
- Zhao, P.H.; Li, C.Z.; Wang, C.; Yang, M.L. The mechanism of H2S generation in the recovery of heavy oil by steam drive. Pet. Sci. Technol. 2016, 34, 1452–1461. [Google Scholar] [CrossRef]
- Jia, N.; Zhao, H.Y.; Yang, T.; Ibatullin, T.; Gao, J.L. Experimental measurements of bitumen–water aquathermolysis during a steam-injection process. Energy Fuels 2016, 30, 5291–5299. [Google Scholar] [CrossRef]
- Ma, Q.; Yang, Z.D.; Zhang, L.Q.; Lin, R.Y.; Wang, X.W. Generation of hydrogen sulfide during the thermal enhanced oil recovery process under superheated steam conditions. RSC Adv. 2019, 9, 33990–33996. [Google Scholar] [CrossRef] [PubMed] [Green Version]
- Sitnov, S.; Mukhamatdinov, I.; Aliev, F.; Khelkhal, M.A.; Slavkina, O.; Bugaev, K. Heavy oil aquathermolysis in the presence of rock-forming minerals and iron oxide (II, III) nanoparticles. Pet. Sci. Technol. 2020, 38, 574–579. [Google Scholar] [CrossRef]
- Mukhamatdinov, I.I.; Salih, I.; Khelkhal, M.A.; Vakhin, A.V. Application of Aromatic and Industrial Solvents for Enhancing Heavy Oil Recovery from the Ashalcha Field. Energy Fuels 2021, 35, 374–385. [Google Scholar] [CrossRef]
- Greensfelder, B.S.; Voge, H.H.; Good, G.M. Catalytic and thermal cracking of pure hydrocarbons: Mechanisms of Reaction. Ind. Eng. Chem. 1949, 41, 2573–2584. [Google Scholar] [CrossRef]
- Sabbe, M.K.; Vandeputte, A.G.; Reyniers, M.F. Ab initio thermochemistry and kinetics for carbon-centered radical addition and β-scission reactions. J. Phys. Chem. A 2007, 111, 8416–8428. [Google Scholar] [CrossRef] [PubMed]
- Sun, X.F.; Li, X.Y.; Tan, X.H.; Zheng, W.; Zhu, G.J.; Cai, J.M. Pyrolysis of heavy oil in supercritical multi-thermal fluid: An effective recovery agent for heavy oils. J. Pet. Sci. Eng. 2020, 196, 107784. [Google Scholar] [CrossRef]
- Lin, R.Y.; Chen, K.; Miao, M.Q.; Zhang, L.Q.; Wang, X.W.; Jiang, Y. Reaction mechanism of H2S generation during tetrahydrothiophene aquathermolysis reaction. Energy Fuels 2020, 34, 2781–2789. [Google Scholar] [CrossRef]
Publisher’s Note: MDPI stays neutral with regard to jurisdictional claims in published maps and institutional affiliations. |
© 2022 by the authors. Licensee MDPI, Basel, Switzerland. This article is an open access article distributed under the terms and conditions of the Creative Commons Attribution (CC BY) license (https://creativecommons.org/licenses/by/4.0/).