Article

Neural Networks for Early Diagnosis of Postpartum PTSD in Women after Cesarean Section

1
Department of Product and Systems Design Engineering, Faculty of Engineering, University of Western Macedonia, 50100 Kozani, Greece
2
Department of Midwifery, School of Health, Sciences, University of Western Macedonia, 50100 Kozani, Greece
3
Department of Midwifery, University of West Attica, 12243 Egaleo, Greece
4
School of Health and Science, Faculty of Medicine, University of Thessaly, 41500 Larisa, Greece
5
Department of Digital Systems, School of Economics and Technology, University of the Peloponnese, Kladas, 23100 Sparta, Greece
*
Author to whom correspondence should be addressed.
Appl. Sci. 2022, 12(15), 7492; https://doi.org/10.3390/app12157492
Submission received: 19 May 2022 / Revised: 15 July 2022 / Accepted: 22 July 2022 / Published: 26 July 2022
(This article belongs to the Special Issue Data Analysis and Mining)

Abstract

:

Featured Application

Early diagnosis and warning mechanisms are essential in every health condition. The research described in this paper can provide the means for the development of medical assistance applications.

Abstract

The correlation between the kind of cesarean section and post-traumatic stress disorder (PTSD) in Greek women after a traumatic birth experience has been recognized in previous studies along with other risk factors, such as perinatal conditions and traumatic life events. Data from early studies have suggested some possible links between some vulnerable factors and the potential development of postpartum PTSD. The classification of each case in three possible states (PTSD, profile PTSD, and free of symptoms) is typically performed using the guidelines and the metrics of the version V of the Diagnostic and Statistical Manual of Mental Disorders (DSM-V) which requires the completion of several questionnaires during the postpartum period. The motivation in the present work is the need for a model that can detect possible PTSD cases using a minimum amount of information and produce an early diagnosis. The early PTSD diagnosis is critical since it allows the medical personnel to take the proper measures as soon as possible. Our sample consists of 469 women who underwent emergent or elective cesarean delivery in a university hospital in Greece. The methodology which is followed is the application of random decision forests (RDF) to detect the most suitable and easily accessible information which is then used by an artificial neural network (ANN) for the classification. As is demonstrated from the results, the derived decision model can reach high levels of accuracy even when only partial and quickly available information is provided.

1. Introduction

Post-traumatic stress disorder (PTSD) is a mental health problem that can develop after a person goes through a life-threatening event. The disorder can develop even when the person is witnessing an event, exposed through information, or extreme repeated exposure to the workplace [1]. The disorder, regardless of the type of exposure to trauma, causes symptoms of re-experiencing, avoidance, negative cognitions in the mood, and arousal. The duration of symptoms lasts more than a month, not due to the action of any substance or physical condition and causes a significant reduction in the individual’s social life [2]. Anyone can develop PTSD at any age. Women, however, are twice as likely to develop PTSD as men, showing how they are most affected by traumatic childbirth experiences, hormonal disorders, stressful life events, and domestic violence [3].
On the other hand, PTSD profile, or partial PTSD, originally used in relation to Vietnam veterans has recently been extended to trauma victims. The PTSD profile includes the most important symptoms of PTSD, but people exposed to trauma do not meet all the diagnostic criteria of the disorder. A correlation has also been found between PTSD profiles with increased rates of suicidal ideation, alcoholism, overuse of health services, and several absences from the work environment as well as a negative reduction of a person’s social life [4,5].
For several years, scientists viewed the childbirth experience as a positive experience, regardless of the presence of traumatic events. In recent years, however, birth trauma has increased researchers’ interest, as it has been shown that it can develop into PTSD or PTSD profile. Actually, more than 1/3 of mothers experienced their delivery as a traumatic event, while 1/4 of them will experience postpartum PTSD [6]. Some factors can increase the chance that a postpartum mother will have PTSD, such as pathology of gestation, complicated vaginal delivery, personal history of mental disorders, tokophobia, low social support, past PTSD, and cesarean section (CS) [7,8,9,10]. Postpartum PTSD symptoms are debilitating and affect the social, professional, psychological, and communication function of the mother–infant bond and her family, as well [10]. However, there are many previous and current surveys that highlight the effect of CS on maternal mental health, especially emergency cesarean section (EMCS) which show a strong correlation with postpartum PTSD compared to other types of births [11,12,13,14,15,16].
Due to the nature of the current diagnosis procedure, which is in accordance with the (DSM-V), in order to reach a conclusion, it is necessary to wait for a period of six weeks to fill up the necessary questionnaires regarding any symptoms. However, the early detection of the possibility of developing PTSD could offer medical personnel significant information to take increased precautionary measures and alleviate any symptoms in advance.
This observation is behind the motivation of the present work. More specifically, our motivation is to examine if machine learning and especially the artificial neural network (ANNs) models can be applied to predict possible PTSD cases. Our contribution is the development of an ANN model that can detect PTSD cases using a minimum amount of information and produce an early PTSD diagnosis as soon as possible.
The rest of the paper is organized as follows: Section 2 presents the related work. In Section 3, the dataset and the proposed methodology for early diagnosis of PTSD cases are described in detail. Section 4 presents the experimental study which is based on a dataset with 469 cases. Section 5 discusses the results while Section 6 concludes the paper and gives directions for future work.

2. Related Work

An early investigation of the application of ANNs as a clinical diagnostic and a modeling tool, especially for psychiatric disorders has been presented in [17]. Although many successful cases of diagnosis in general medicine, contemporary at the time of that review, have been presented, the lack of evaluation of the impact of the nature of psychiatric data, where most variables derive from dimensional rating scales, is also mentioned. A more detailed consideration of the application of ANN models to clinical decision-making exists in [18] where some issues of psychological assessment using ANNs are discussed as well. The use of ANNs in psychology-related applications, such as personality traits analysis, has also been reviewed in [19]. In general, machine learning can provide a powerful diagnostic toolset as it is demonstrated in [20].
In a similar manner to the work presented in this paper, the use of ANNs in identifying the symptom severity in obsessive–compulsive disorder (OCD) for classification and prediction has been successfully employed in [21]. The importance of timely treatment of OCD before leading to a chronic disability is also stressed and several significant factors related to this disorder are pointed out with confirmatory factor analysis (CFA).
The potentiality of machine learning approaches with multidimensional data sets in pathologically redefining mental illnesses and also improving the therapeutic outcomes in relation to the Diagnostic and Statistical Manual of Mental Disorders (DSM) and the International Classification of Diseases (ICD) is examined in [22]. An extended related review also exists in [23,24] where open issues for AI in psychiatry are discussed as well.

3. Materials and Methods

This study took place from July to November 2019 to August 2020, at the Midwifery Department of the General University Hospital of Larisa in Greece. It was approved by the University Hospital of Larisa Ethics Commission. Approval: 18838/08-05-2019. To answer the research question, the study was designed as a prospective study between 2 groups of postpartum women (EMCS and Elective Cesarean Section (ELCS)).

3.1. Participants

The participants were all postpartum women who gave birth by the 2 types of CS and gave their written consent for their participation. A total of 469 postpartum women were examined in this research. For each case, several demographics, prenatal health, and mental health variables were collected through questionnaires that were filled through interviews during their hospitalization in the departments and 6 weeks later. The exclusion criteria of the research were difficulties at a cognitive level, other languages than Greek, and underage mothers.

3.2. Data and Measures

The data were collected in 2 stages: the first stage was the 2nd day after CS, and the second stage was the 6th week after CS. During the first stage, from 469 women, we collected medical and demographic data from the socio-demographic questionnaire and past traumatic life events from the Life Events Checklist-5 (LEC-5) of DSM-V and Criterion A from the adapted first Criterion of PTSD. At the second stage, the PTSD symptoms from the Post-Traumatic Stress Checklist (PCL-5) of DSM-V are collected (The dataset that was used can be found in: https://users.uowm.gr/chorovas/appsci/nn_ptsd.html (accessed on 20 June 2022)).
The life events checklist (LEC) is the only measure that individuals can determine different levels of exposure to a traumatic event in their lives [25]. For a PTSD diagnosis, 8 criteria must be met. For the first criterion (Criterion A), the individual must have been exposed to death, threatened death, serious injury, or sexual violence in one of the following ways: (a) direct exposure, (b) witness to the event, (c) information of the event, and (d) exposure in the working space [26]. For this study, Criterion A was adjusted accordingly. The post-traumatic stress checklist (PCL-5) is a self-report scale, which was developed to measure and evaluate PTSD and PTSD Profile symptoms [1,27]. In the present study, the postpartum women replied via telephone to 20 questions during the 6th postpartum week, corresponding to 20 symptoms of the criteria B (re-experiencing), C (avoidance), D (negative thoughts and feelings), and E (arousal and reactivity). All replies are scored on 5-point scales (range zero to four). A score of one or more in the categories of criteria B and C and two or more in categories D and E are considered PTSD symptoms. Depending on the symptoms, the postpartum women were diagnosed with (a) provisional diagnosis of PTSD and (b) PTSD profile [27,28].
The demographics, prenatal health, and mental health variables that were collected are presented in Table 1, Table 2 and Table 3 (statistical tests with IBM SPSS Statistics v.20).
In total, for each case there were 70 data fields available as it is shown in Table 4.
As mentioned in 
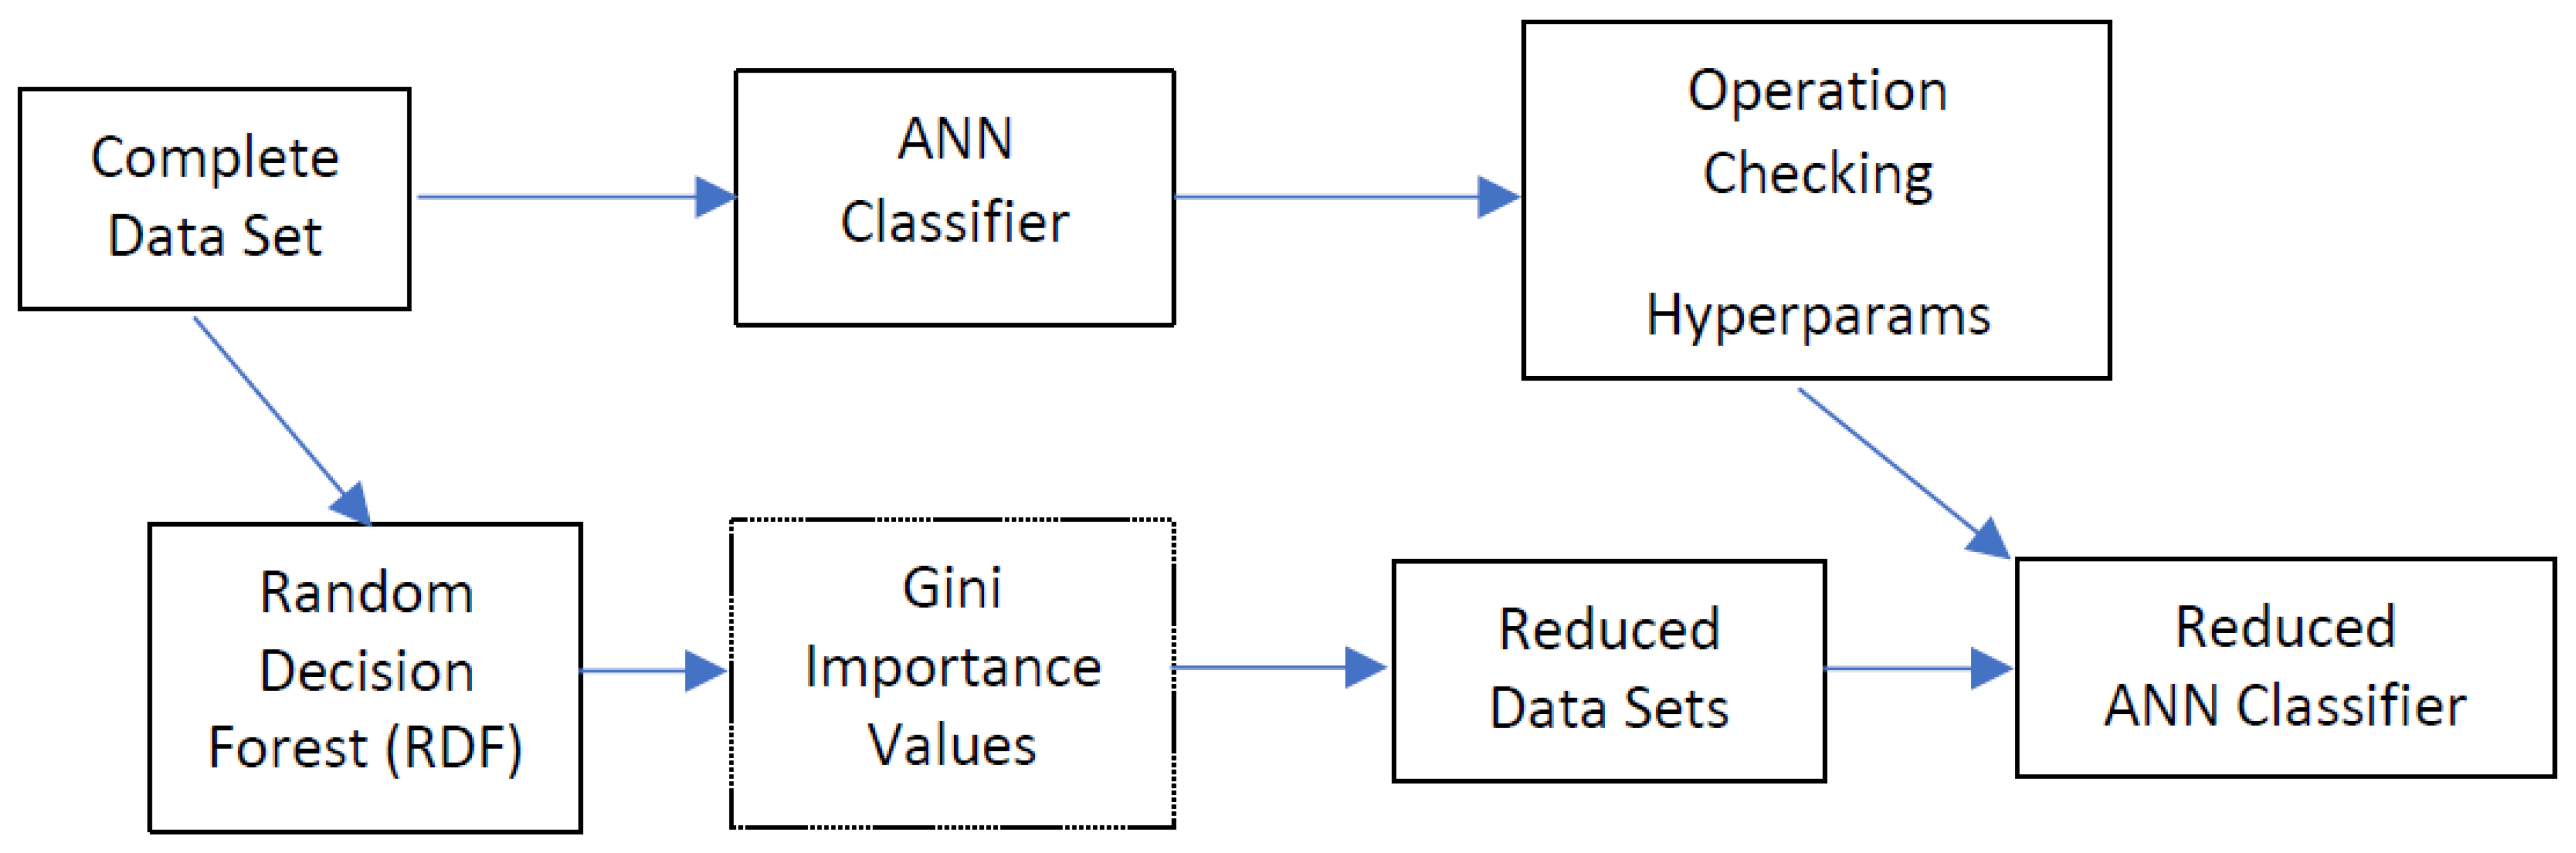
Section 1, the development of a diagnostic model that could indicate early a possible PTSD case using a minimum amount of information could be very useful to prepare the health personnel for such a scenario so that appropriate measures could be taken in advance. Having this in mind we initially trained an artificial neural network (ANN) [18,23] with all the available information so that we could check whether the traditionally confirmed diagnosis could be replicated. Since that was easily achieved by a two-layered feed-forward ANN (Table 5), the focus was moved to the proper subset of data that could be used to achieve high classification accuracy. Random forest classification [
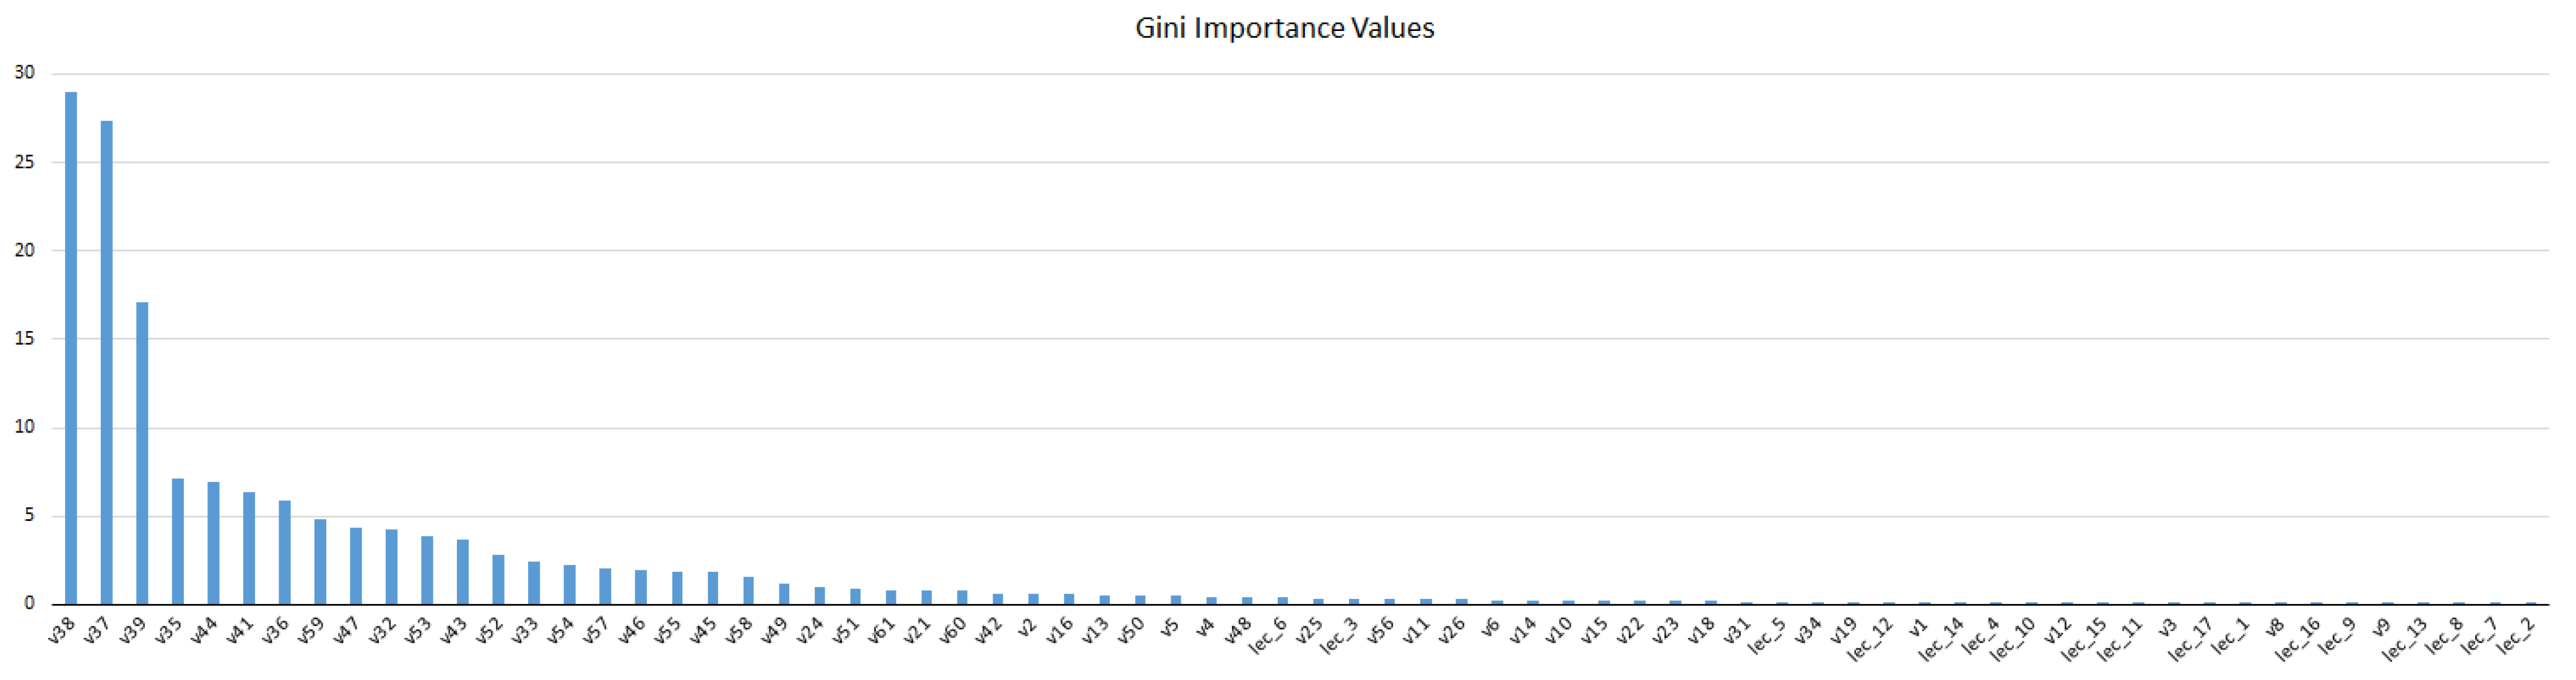
29] was performed with the initial set of 70 data fields (variables). The goal was to derive Gini importance values [30] which could assist with the selection of the proper subset of variables. The criteria for the selection of these variables were the level of their direct availability with the smaller number of questions asked. This procedure resulted in having the sets of data that we used to train the ANNs models. A schematic diagram of the above processing is depicted in Figure 1.
The corresponding results and additional details from the above methodology are presented to the following section.

4. Results

4.1. Initial Classification Using the ANN

As mentioned above, the complete set of the data were used initially to examine the feasibility of the reproduction of the original classification according to the DSM-V. From the 469 cases of the collected data, 379 (80.81%) were manually diagnosed as free of symptoms, 34 (7.24%) had traces and were characterized as profile and 56 (11.94%) were diagnosed as PTSD cases. For the training and testing phases, a stratified ten-fold cross-validation scheme was employed.
The ANN was created using the PyTorch (v1.9.0 + cu11) library in Python and had a structure of seventy input units (in the case of the complete data fields as shown in Table 4), six hidden units, and three output units using three bits for the output where only one of them was set to “1” indicating the diagnosis (one hot coding). The connections were feed-forward from one layer to the next, the Sigmoid function (with α = 1.0) was used for activation and the mean squared error (MSE) was employed from the stochastic gradient descent (SGD) optimization algorithm for training. The learning rate was set to 1.0 and the momentum to 0.9. The tuning of the hyperparameters that were used was performed on a trial-and-error base after several initial experimentations.
Initially, we estimated precision, recall, specificity, and accuracy for the complete set of the 70 variables by considering the confusion matrices and these are presented in Table 5 and Table 6. Precision estimates how many positive predictions were correct. Recall estimates how many positives are correctly predicted while specificity estimates how many negatives are correctly predicted. Precision is calculated as the fraction TP/(TP + FP), the recall (sensitivity) as TP/(TP + FN), the specificity TN/(TN + FP), and the total accuracy (TP1 + TP2 + TP3)/(P1 + P2 + P3) where TP, FP, TN, and FN are the true and false positives and true and false negatives, respectively.
The results for both phases are averaged over ten sessions of the experiments, each one with a different initialization of the weights of the ANN. The averaged learning curve for the training process is depicted in Figure 1.
From Table 5 and Table 6 and Figure 2, we can see that the ANN manages to easily learn the classification procedure of the DSM-V. However, we need to perform the same classification with as few variables as possible. Therefore, we employ the RDF importance values.

4.2. Importance Values Using Random Decision Forests

All the data from the initial set (469 × 70) were used with the random decision forests classification which was performed using the function randomForest from the library randomForest version 4.6-14 in RStudio (v1.3.1093). The number of trees was 500 and the number of variables tried at each split (mtry) was 20. These parameters were also selected on a trial-and-error basis. As RDF classification has a stochastic feature in its operation, ten sessions were run, and the average estimated error rate was 1,13%. The average confusion matrix is shown in Table 7.
A powerful feature of RDF classification is that an importance vector is also returned which has the Gini importance values (mean decrease in impurity, MDI) [30] of the variables used. This is very useful for having an idea of what variables contribute more to the classification process as the higher the Gini values the higher the importance of the variables. This is profound in our research as our aim was to reach a competitive level of classification using as less and more directly acquired, variables as possible.
The Gini values for the 70 variables sorted from highest to lowest can be seen in Figure 3 and in Table 8 for more precision.

4.3. Classification Using a Subset of the Available Data

The values in Table 8 show an expected high level of importance to the variables that are used directly for the typical diagnosis procedure in DSM-V (indicated by bold variable labels). As these are only available after six weeks, our effort is to avoid them and concentrate on what is quickly and easily acquired with as less questions as possible. This gives us the list of candidate variables listed in Table 9.
All the twenty-four variables that are presented in Table 9 were used to construct eight data sets (called D1–D8) in steps of three. The variables in each dataset and the corresponding sum of the Gini values of these variables can be seen in Table 10.
The results concerning the precision, recall (sensitivity), specificity, and accuracy during the training and testing phases in a stratified ten-fold cross-validation scheme can be seen in Table 11 and Table 12 and Figure 4 and Figure 5.
In order to have an idea about the best level of classification that could be achieved with RDF using only those variables of the complete set which are not related to DSM-V, (i.e., v41–v60 and v36–v39), ten sessions were run using the complete dataset for training. Comparing the classification errors in Table 13 (which is one recall) with the best values for recall in Table 12 we can observe a slightly better performance from the ANN using datasets D6 and D7 with only 18 and 21 variables, respectively. This is an indication of the validity of the variable selection method that was performed based on Table 8.

5. Discussion

The subject of the present study was to present a model that can produce an early diagnosis to detect and alarm a possible case so that proper measures can be taken as soon as possible. According to our findings, emergency cesarean section, pathology of gestation, preterm birth, the inclusion of neonate in NICU, absence of breastfeeding, psychiatric history, expectations from childbirth, and support from the partner are included in the set of important decision factors.
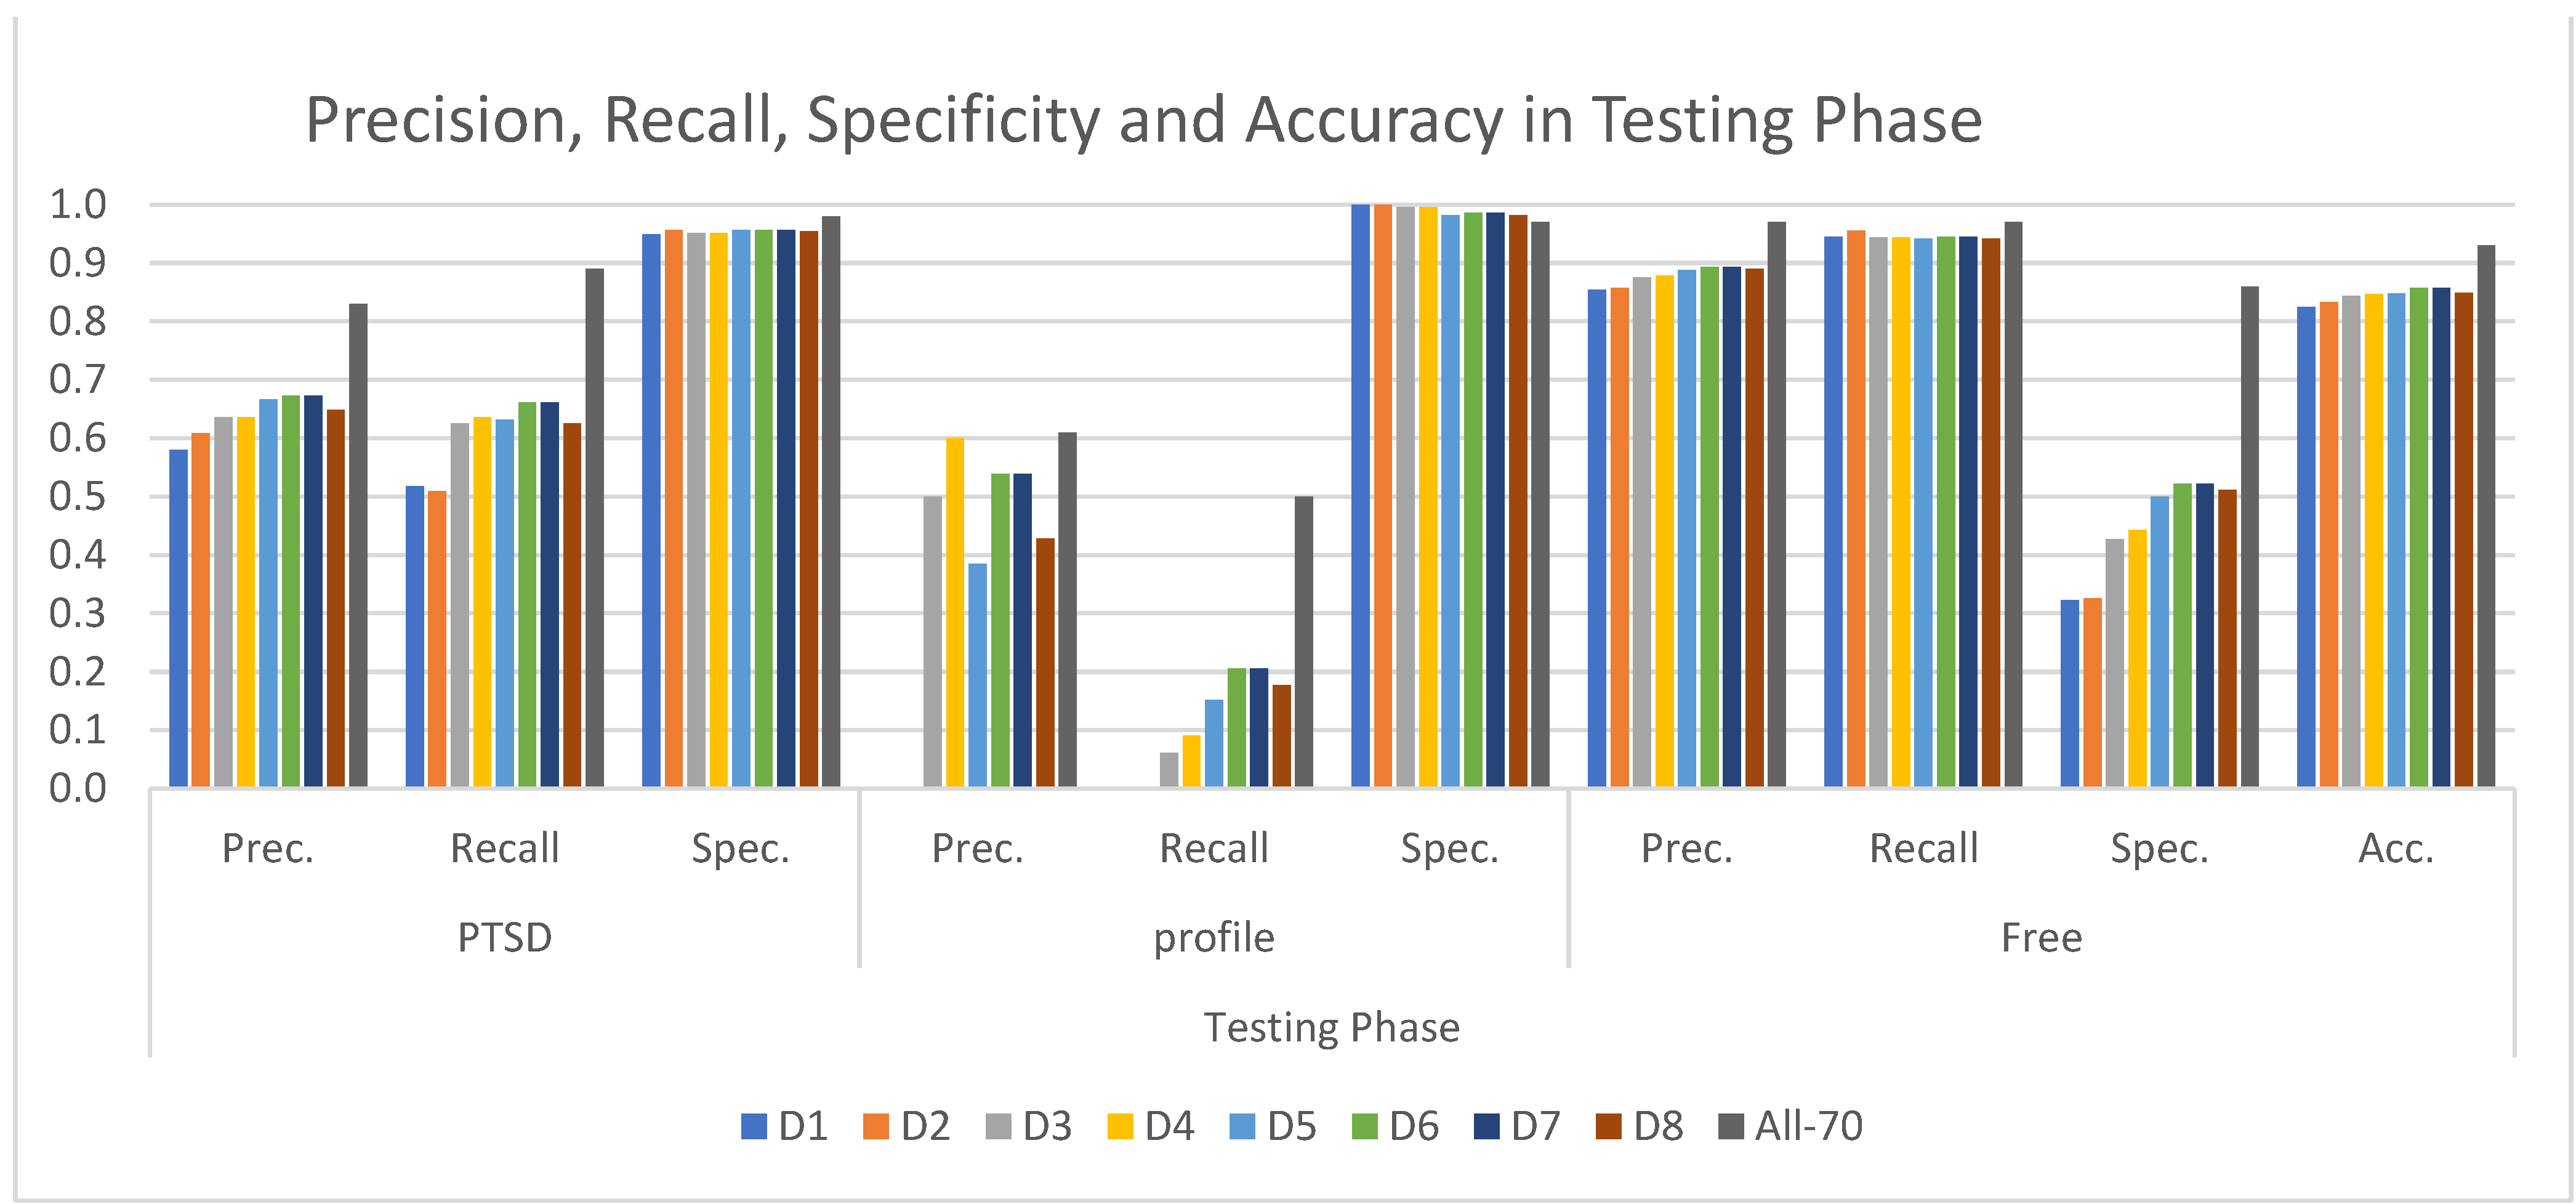
Additionally, as it can be seen from the results (graphs in Figure 4 and Figure 5, Table 11 and Table 12), the ability of the ANN model to arrive at a correct conclusion is demonstrated at a very satisfactory level (around 97% in training and 94% in testing) for the cases which are free of symptoms. For the cases that are PTSD diagnosed, the recognition level reaches 83% in training and 66% in testing. The area in between the above two categories has a low percentage of recognition and it collects the PTSD profile cases. As it can be observed from the results, the PTSD profile cases are the only ones that really need the late questionnaires data (after 6 weeks). According to the above, a policy that could be followed to arrive at a conclusion as soon as possible is to characterize a case that is not classified as free of symptoms as a possible PTSD case. If the case is indeed classified as PTSD, then such a scenario would probably denote an increased potentiality for the appearance of PTSD symptoms after six weeks when the second part of the data is collected. More focused treatment in such a case could be applied and this can start six weeks in advance, providing a beneficial period of medical care.
The use of random decision forests for associating an importance value for each data field is very useful as well. The ordering of the early accessible variables according to their Gini values in 
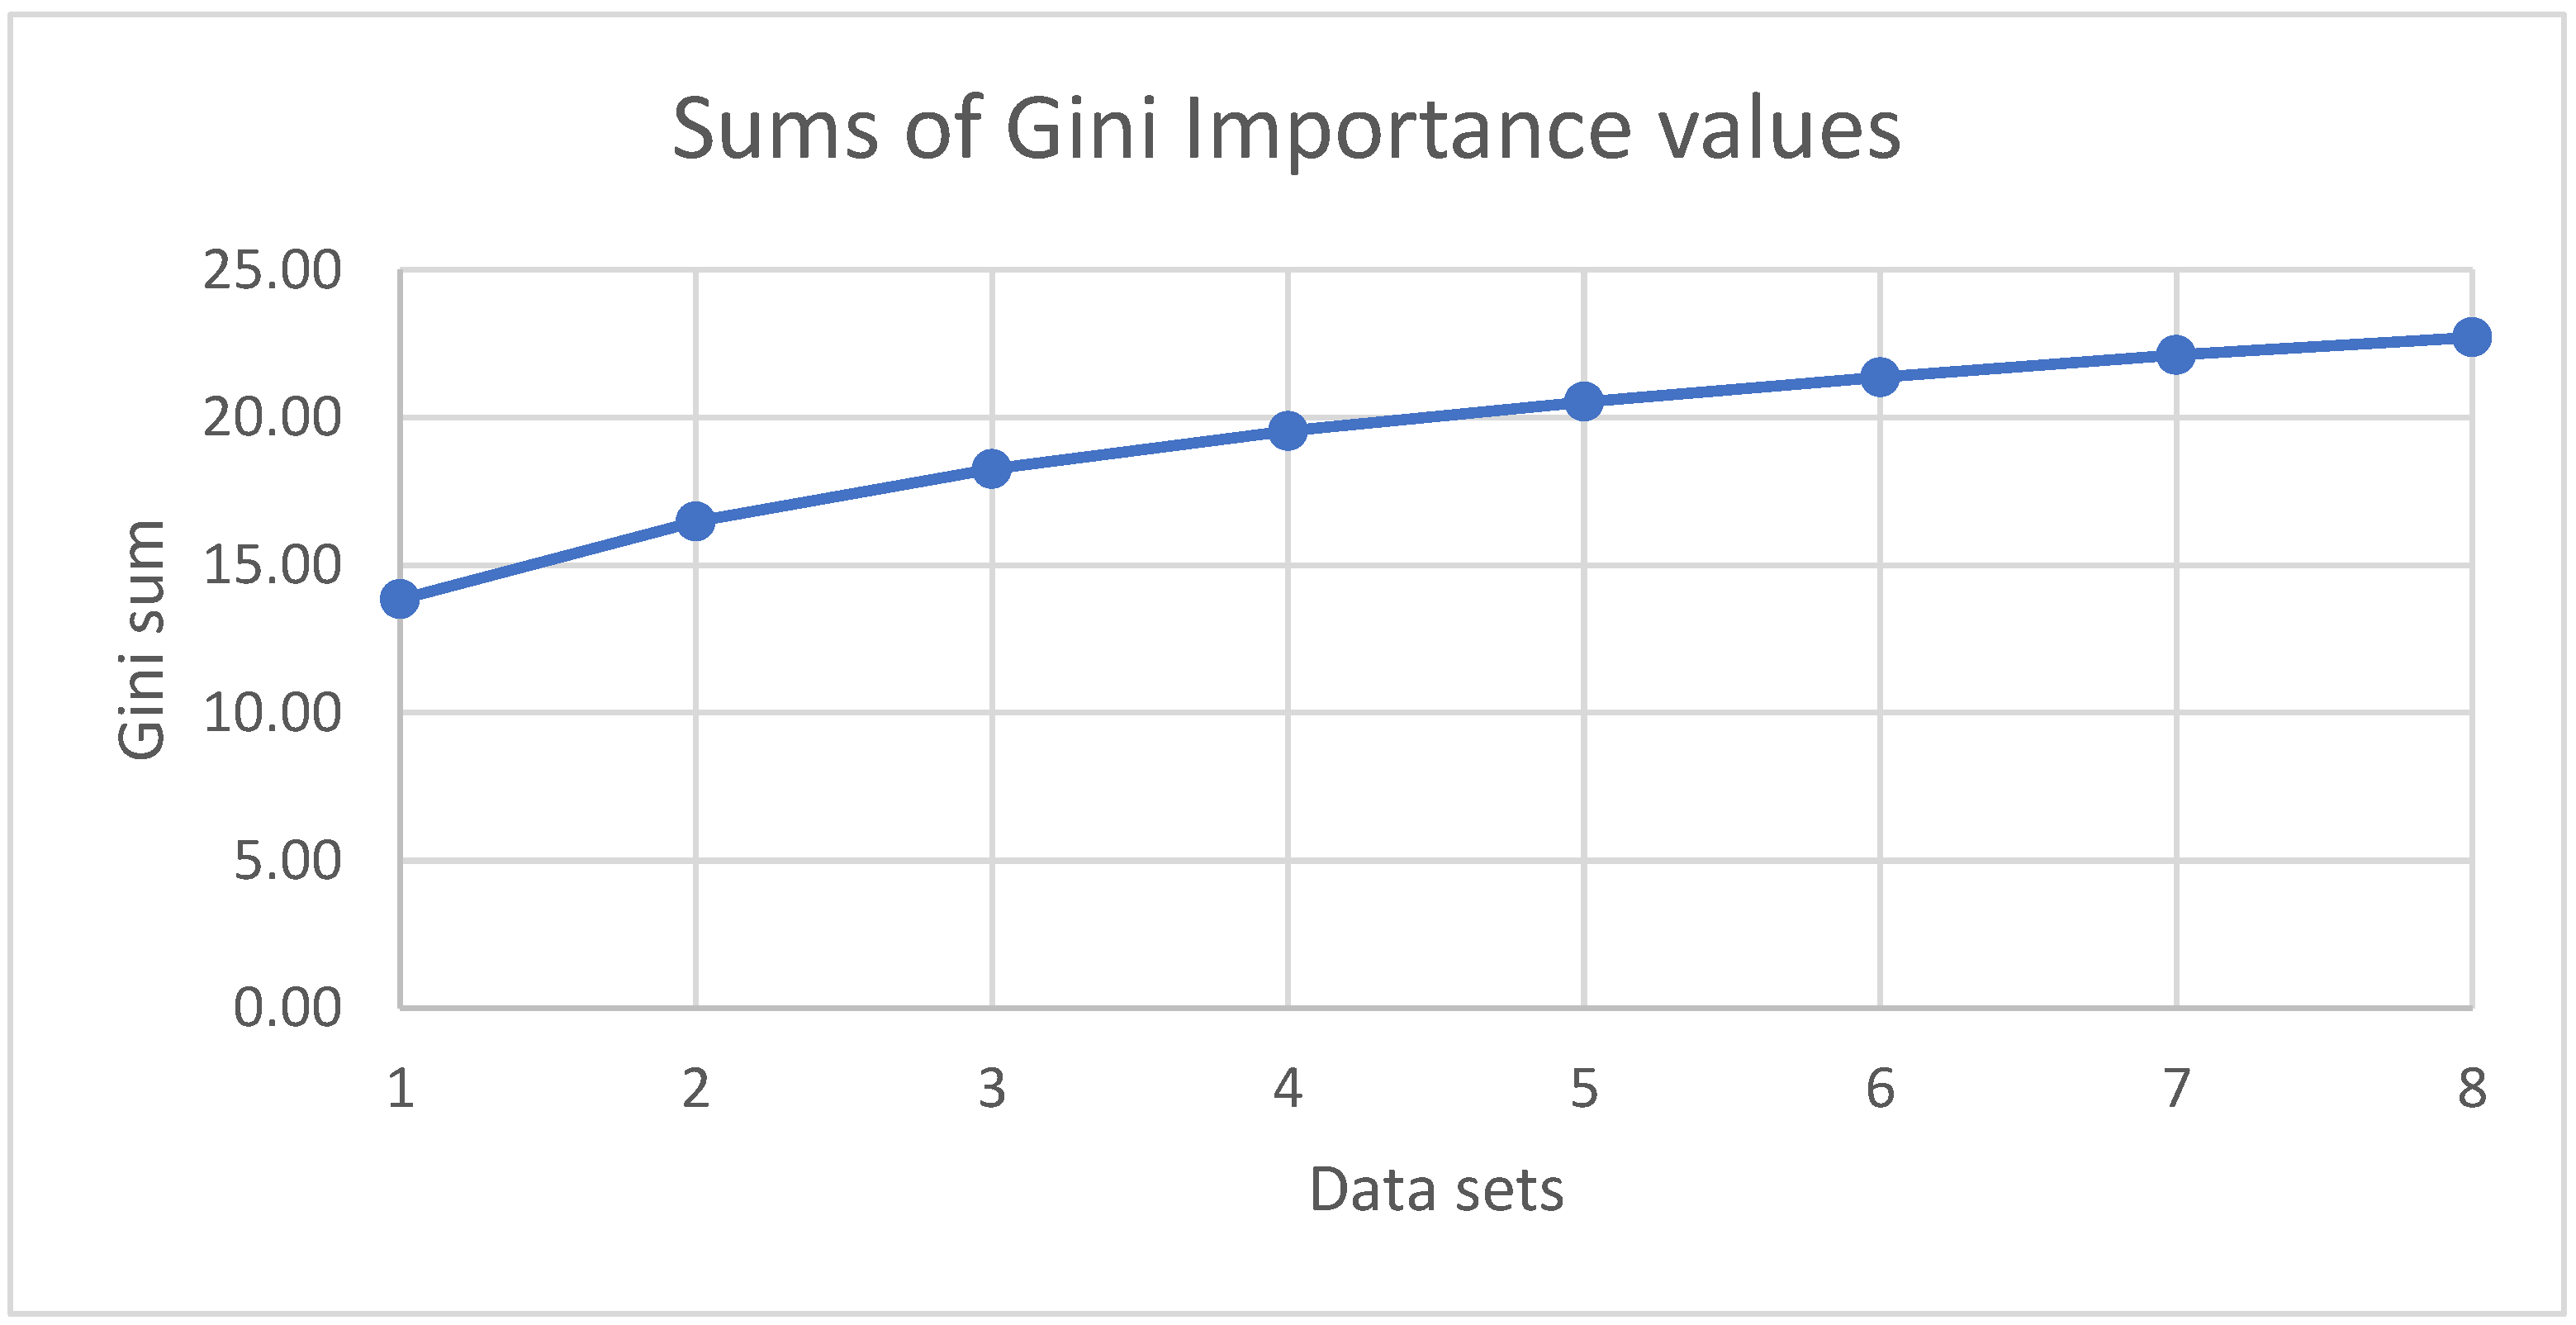
Table 9 is the result of that process and it can be noted that this ordering is indeed profound. Criterion A, which constitutes a basic decision factor also in the typical DSM diagnosis, is ranked first and its related parts (A1 and A2) are just after that. Although there is one more datum field related to Criterion A, (v34, number of similar stressful experiences) we decided not to use this as it requires extra effort from the side of the woman in order to be defined. The rest of the data fields that are used for the datasets are all important and this can be shown by the gradual increase in PTSD sensitivity which is noticed in the training phase (Figure 4). This is expected and it denotes the usefulness of the extra information which is added to every dataset. This information increase is also depicted as the sums of the Gini values of the datasets in Figure 6.

6. Conclusions

Our aim for this research was to examine whether the use of ANN modeling for describing the classification process of postpartum PTSD could be useful to provide a diagnostic model for the early detection of possible cases. The high accuracy that is obtained using as little and as readily available information as possible demonstrates that this is possible, and this marks a successful scenario for the application of ANNs in psychological data modeling. Future research could incorporate additional machine learning tools for the classification to obtain even more precise classification percentages. The development of mobile device applications to make the process faster would be also desirable. The benefit for the persons that would finally be diagnosed positively is important as well, since the extra period gained could be used in favor of their preliminary treatment.

Author Contributions

Conceptualization, C.O.; methodology, C.O. and S.O.; software, C.O.; validation, M.D., A.D., G.I. and E.A.; formal analysis, C.O.; investigation, E.O., N.R. and E.A.; resources, E.O., N.R. and E.A.; data curation, C.O.; writing—original draft preparation, C.O.; writing—review and editing, M.D., A.D., S.O., G.I. and E.A.; visualization, C.O. and E.O.; supervision, E.A.; project administration, C.O. All authors have read and agreed to the published version of the manuscript.

Funding

This research received no external funding.

Institutional Review Board Statement

This study was approved by the University Hospital of Larisa Ethics Commission. Approval: 18838/08-05-2019.

Informed Consent Statement

Informed consent was obtained from all subjects involved in the study.

Data Availability Statement

Not applicable.

Conflicts of Interest

The authors declare no conflict of interest.

References

  1. PTSD Basics—PTSD: National Center for PTSD. Available online: https://www.ptsd.va.gov/understand/what/ptsd_basics.asp (accessed on 29 December 2020).
  2. DePierro, J.; D’Andrea, W.; Spinazzola, J.; Stafford, E.; van Der Kolk, B.; Saxe, G.; Stolbach, B.; McKernan, S.; Ford, J.D. Beyond PTSD: Client Presentations of Developmental Trauma Disorder from a National Survey of Clinicians. Psychol. Trauma 2019. [Google Scholar] [CrossRef] [PubMed]
  3. Stein, M.B.; Jang, K.L.; Taylor, S.; Vernon, P.A.; Livesley, W.J. Genetic and Environmental Influences on Trauma Exposure and Posttraumatic Stress Disorder Symptoms: A Twin Study. Am. J. Psychiatry 2002, 159, 1675–1681. [Google Scholar] [CrossRef] [PubMed]
  4. Breslau, N.; Lucia, V.C.; Davis, G.C. Partial PTSD versus Full PTSD: An Empirical Examination of Associated Impairment. Psychol. Med. 2004, 34, 1205–1214. [Google Scholar] [CrossRef] [PubMed]
  5. Mylle, J.; Maes, M. Partial Posttraumatic Stress Disorder Revisited. J. Affect. Disord. 2004, 78, 37–48. [Google Scholar] [CrossRef]
  6. Czarnocka, J.; Slade, P. Prevalence and Predictors of Post-Traumatic Stress Symptoms Following Childbirth. Br. J. Clin. Psychol. 2000, 39, 35–51. [Google Scholar] [CrossRef] [PubMed]
  7. Sentilhes, L.; Maillard, F.; Brun, S.; Madar, H.; Merlot, B.; Goffinet, F.; Deneux-Tharaux, C. Risk Factors for Chronic Post-Traumatic Stress Disorder Development One Year after Vaginal Delivery: A Prospective, Observational Study. Sci. Rep. 2017, 7, 8724. [Google Scholar] [CrossRef] [PubMed]
  8. James, S. Women’s Experiences of Symptoms of Posttraumatic Stress Disorder (PTSD) after Traumatic Childbirth: A Review and Critical Appraisal. Arch. Womens Ment. Health 2015, 18, 761–771. [Google Scholar] [CrossRef] [Green Version]
  9. Kessler, R.C.; Sonnega, A.; Bromet, E.; Hughes, M.; Nelson, C.B. Posttraumatic Stress Disorder in the National Comorbidity Survey. Arch. Gen. Psychiatry 1995, 52, 1048–1060. [Google Scholar] [CrossRef]
  10. Tamaki, R.; Murata, M.; Okano, T. Risk Factors for Postpartum Depression in Japan. Psychiatry Clin. Neurosci. 1997, 51, 93–98. [Google Scholar] [CrossRef] [Green Version]
  11. Schwab, W.; Marth, C.; Bergant, A.M. Post-Traumatic Stress Disorder Post Partum: The Impact of Birth on the Prevalence of Post-Traumatic Stress Disorder (PTSD) in Multiparous Women. Geburtshilfe Frauenheilkd 2012, 72, 56–63. [Google Scholar] [CrossRef] [Green Version]
  12. Söderquist, J.; Wijma, B.; Thorbert, G.; Wijma, K. Risk Factors in Pregnancy for Post-Traumatic Stress and Depression after Childbirth. BJOG Int. J. Obstet. Gynaecol. 2009, 116, 672–680. [Google Scholar] [CrossRef] [PubMed]
  13. Tham, V.; Christensson, K.; Ryding, E.L. Sense of Coherence and Symptoms of Post-Traumatic Stress after Emergency Caesarean Section. Acta Obstet. Gynecol. Scand. 2007, 86, 1090–1096. [Google Scholar] [CrossRef] [PubMed]
  14. Mahmoodi, Z.; Dolatian, M.; Shaban, Z.; Shams, J.; Alavi-Majd, H.; Mirabzadeh, A. Correlation between Kind of Delivery and Posttraumatic Stress Disorder. Ann. Med. Health Sci. Res. 2016, 6, 356–361. [Google Scholar] [CrossRef] [PubMed] [Green Version]
  15. Ryding, E.L.; Wijma, B.; Wijma, K. Posttraumatic Stress Reactions after Emergency Cesarean Section. Acta Obstet. Gynecol. Scand. 1997, 76, 856–861. [Google Scholar] [CrossRef]
  16. Orovou, E.; Dagla, M.; Iatrakis, G.; Lykeridou, A.; Tzavara, C.; Antoniou, E. Correlation between Kind of Cesarean Section and Posttraumatic Stress Disorder in Greek Women. Int. J. Environ. Res. Public Health 2020, 17, 1592. [Google Scholar] [CrossRef] [Green Version]
  17. Galletly, C.A.; Clark, C.R.; McFarlane, A.C. Artificial Neural Networks: A Prospective Tool for the Analysis of Psychiatric Disorders. J. Psychiatry Neurosci. 1996, 21, 239–247. [Google Scholar]
  18. Price, R.K.; Spitznagel, E.L.; Downey, T.J.; Meyer, D.J.; Risk, N.K.; El-Ghazzawy, O.G. Applying Artificial Neural Network Models to Clinical Decision Making. Psychol. Assess. 2000, 12, 40–51. [Google Scholar] [CrossRef]
  19. Remaida, A.; Abdellaoui, B.; Moumen, A.; Idrissi, Y. Personality Traits Analysis Using Artificial Neural Networks: A Literature Survey. In Proceedings of the 1st International Conference on Innovative Research in Applied Science, Engineering and Technology (IRASET), Meknes, Morocco, 16–19 April 2020. [Google Scholar] [CrossRef]
  20. Truong, V.T.; Nguyen, B.P.; Nguyen-Vo, T.-H.; Mazur, W.; Chung, E.S.; Palmer, C.; Tretter, J.T.; Alsaied, T.; Pham, V.T.; Do, H.Q.; et al. Application of Machine Learning in Screening for Congenital Heart Diseases Using Fetal Echocardiography. Int. J. Cardiovasc. Imaging 2022, 38, 1007–1015. [Google Scholar] [CrossRef]
  21. Shahzad, M.N.; Suleman, M.; Ahmed, M.A.; Riaz, A.; Fatima, K. Identifying the Symptom Severity in Obsessive-Compulsive Disorder for Classification and Prediction: An Artificial Neural Network Approach. Behav. Neurol. 2020, 2020. [Google Scholar] [CrossRef]
  22. Komatsu, H.; Watanabe, E.; Fukuchi, M. Psychiatric Neural Networks and Precision Therapeutics by Machine Learning. Biomedicines 2021, 9, 403. [Google Scholar] [CrossRef]
  23. Dwyer, D.B.; Falkai, P.; Koutsouleris, N. Machine Learning Approaches for Clinical Psychology and Psychiatry. Annu. Rev. Clin. Psychol. 2018, 14, 91–118. [Google Scholar] [CrossRef] [PubMed]
  24. Durstewitz, D.; Koppe, G.; Meyer-Lindenberg, A. Deep Neural Networks in Psychiatry. Mol. Psychiatry 2019, 24, 1583–1598. [Google Scholar] [CrossRef] [PubMed]
  25. Gray, M.J.; Litz, B.T.; Hsu, J.L.; Lombardo, T.W. Psychometric Properties of the Life Events Checklist. Assessment 2004, 11, 330–341. [Google Scholar] [CrossRef] [PubMed] [Green Version]
  26. McFarlane, A.C. PTSD and DSM-5: Unintended Consequences of Change. Lancet Psychiatry 2014, 1, 246–247. [Google Scholar] [CrossRef]
  27. Blevins, C.A.; Weathers, F.W.; Davis, M.T.; Witte, T.K.; Domino, J.L. The Posttraumatic Stress Disorder Checklist for DSM-5 (PCL-5): Development and Initial Psychometric Evaluation. J. Trauma Stress 2015, 28, 489–498. [Google Scholar] [CrossRef]
  28. Wortmann, J.H.; Jordan, A.H.; Weathers, F.W.; Resick, P.A.; Dondanville, K.A.; Hall-Clark, B.; Foa, E.B.; Young-McCaughan, S.; Yarvis, J.S.; Hembree, E.A.; et al. Psychometric Analysis of the PTSD Checklist-5 (PCL-5) among Treatment-Seeking Military Service Members. Psychol. Assess. 2016, 28, 1392–1403. [Google Scholar] [CrossRef]
  29. Ho, T.K. Random Decision Forests. In Proceedings of the Third International Conference on Document Analysis and Recognition, Montreal, QC, Canada, 14–16 August 1995; Volume 1. [Google Scholar]
  30. Nembrini, S.; König, I.R.; Wright, M.N. The Revival of the Gini Importance? Bioinformatics 2018, 34, 3711–3718. [Google Scholar] [CrossRef] [Green Version]
Figure 1. A schematic diagram of the methodology used.
Applsci 12 07492 g001
Figure 2. The convergence graph for the training with all the initial data (70 fields).
Applsci 12 07492 g002
Figure 3. The averaged Gini importance values of the 70 variables in descending order.
Applsci 12 07492 g003
Figure 4. The precision, recall (sensitivity) and specificity for each class and dataset and the accuracy for the training phase.
Applsci 12 07492 g004
Figure 5. The precision, recall (sensitivity), and specificity for each class and dataset and the accuracy for the testing phase.
Applsci 12 07492 g005
Figure 6. The graph of the sums of Gini importance values in the eight datasets (D1–D8) of Table 10.
Applsci 12 07492 g006
Table 1. Demographic data. Counts and percentages in corresponding diagnosis.
Diagnosisp-Value *
FreeProfilePTSD
N%N%N%
v1. Residence1. City30381.2%256.7%4512.1%0.665
2. Village7679.2%99.4%1111.5%
v2. Age1. ≤201777.3%00.0%522.7%0.08
2. ≤253276.2%511.9%511.9%
3. ≤307776.2%55.0%1918.8%
4. ≤3510780.5%1511.3%118.3%
5. ≤4012183.4%96.2%1510.3%
6. ≤452395.8%00.0%14.2%
7. >452100.0%00.0%00.0%
v3. Family Status0. Single3100.0%00.0%00.0%0.551
1. In relationship2972.5%37.5%820.0%
2. Married33981.7%307.2%4611.1%
3. Engaged685.7%00.0%114.3%
4. Divorced250.0%125.0%125.0%
v4. Educational Status0. Primary2974.4%37.7%717.9%0.848
1. Jr High Sch.2273.3%413.3%413.3%
2. High Sch.15981.1%147.1%2311.7%
3. Uni14082.4%127.1%1810.6%
4. MSc2382.1%13.6%414.3%
5. PhD6100.0%00.0%00.0%
v5. Occupation1. Employee (Pub/Priv)11685.3%75.1%139.6%0.277
2. Freelance5277.6%57.5%1014.9%
3. Health care3078.9%513.2%37.9%
4. Educators3581.4%12.3%716.3%
5. Household10282.9%108.1%118.9%
6. Unemployed4471.0%69.7%1219.4%
v6. Financial Status1. Low10375.7%118.1%2216.2%0.399
2. Medium26683.1%226.9%3210.0%
3. High1076.9%17.7%215.4%
v8. Nationality1. Greek34381.1%307.1%5011.8%0.887
2. Other3678.3%48.7%613.0%
v9. Minority0. No35681.7%317.1%4911.2%0.196
1. Yes2369.7%39.1%721.2%
* p-values refer to Pearson chi-square.
Table 2. Prenatal health variables. Counts and percentages in corresponding diagnosis.
Diagnosisp-Value *
FreeProfilePTSD
N%N%N%
v10. Parity0. No15878.2%136.4%3115.3%0.278
1. One birth14984.2%126.8%169.0%
2. >17280.0%910.0%910.0%
v11. Previous labor0. No prev. labor16078.4%136.4%3115.2%0.013
1. Vaginal2567.6%38.1%924.3%
2. C-section18885.8%167.3%156.8%
3. Vag. and CS666.7%222.2%111.1%
v12. Type of conception1. Normal34279.7%337.7%5412.6%0.145
2. IVF3792.5%12.5%25.0%
v14. Atomic history0. None29780.7%246.5%4712.8%0.05
1. Thyroid4787.0%35.6%47.4%
2. C/V975.0%18.3%216.7%
3. Neurological571.4%114.3%114.3%
4. AutoImm.787.5%112.5%00.0%
5. Kidney150.0%00.0%150.0%
6. Tubes133.3%266.7%00.0%
7. Myopia5100.0%00.0%00.0%
8. Other770.0%220.0%110.0%
v15. Gynecologic hist.0. No34581.9%296.9%4711.2%0.39
1. Intr.fetal demise2170.0%26.7%723.3%
2. Gynec.cancers1100.0%00.0%00.0%
3. Prem.ovarian2100.0%00.0%00.0%
4. Surgeries266.7%133.3%00.0%
5. Death infant562.5%225.0%112.5%
6. Uterine pathology375.0%00.0%125.0%
v16. Pathology of gestation0. No26785.3%268.3%206.4%<0.001
1. Thromb/hyperem.571.4%114.3%114.3%
2. Preeclampsia3869.1%23.6%1527.3%
3. Placenta previa1368.4%00.0%631.6%
4. Diabetes 4280.8%59.6%59.6%
5. Cervical insuff.675.0%00.0%225.0%
6. Infection350.0%00.0%350.0%
7. Premature contr.555.6%00.0%444.4%
v18. Full term1. Yes33084.2%317.9%317.9%<0.001
2. Late preterm4365.2%34.5%2030.3%
3. Very preterm654.5%00.0%545.5%
v19. Type of C-section1. Emergency11563.5%189.9%4826.5%<0.001
2. Programmed26491.7%165.6%82.8%
v21. Cause of C-section1. Previous CS17887.3%178.3%94.4%<0.001
2. Abnormal fet.pos.4688.5%23.8%47.7%
3. Twins/IVF2996.7%13.3%00.0%
4. Mother’s desire2083.3%28.3%28.3%
5. Placenta previa743.8%00.0%956.3%
6. Heavy med. hist.1280.0%320.0%00.0%
7. Failure of labor3988.6%49.1%12.3%
8. Abnormal HR3757.8%57.8%2234.4%
9. Preeclampsia1155.0%00.0%945.0%
v22. Complications after C-section0. None36584.1%347.8%358.1%<0.001
1. Bleeding633.3%00.0%1266.7%
2. Infection350.0%00.0%350.0%
3. High blood press.457.1%00.0%342.9%
4. Neuro/psychiatric00.0%00.0%1100.0%
5. Other133.3%00.0%266.7%
v23. Breastfeeding0. No10166.0%127.8%4026.1%<0.001
1. Yes27888.0%227.0%165.0%
v24. NICU0. No31986.9%318.4%174.6%<0.001
1. Perinatal stress2561.0%12.4%1536.6%
2. Infection250.0%00.0%250.0%
3. Prematurity2959.2%12.0%1938.8%
4. IUGR150.0%00.0%150.0%
5. Other350.0%116.7%233.3%
* p-values refer to Pearson chi-square.
Table 3. Mental health variables. Counts and percentages in corresponding diagnosis.
Diagnosisp-Value *
FreeProfilePTSD
N%N%N%
v13. Psych. history0. None35385.9%204.9%389.2%<0.001
1. Stress disord.1344.8%517.2%1137.9%
2. Postpartum mental disorders952.9%529.4%317.6%
3. Depression225.0%450.0%225.0%
4. Psych. syndromes250.0%00.0%250.0%
v25. Support from partner0. No3044.1%1623.5%2232.4%<0.001
1. Yes34987.0%184.5%348.5%
v26. Expectations0. No15764.1%3313.5%5522.4%<0.001
1. Yes22299.1%1.4%1.4%
v31. Traumatic C-section0. No22899.1%2.9%00.0%<0.001
1. Yes15163.2%3213.4%5623.4%
v32. Criterion A1 Was your life or your child’s life in danger?0. No32889.1%318.4%92.4%<0.001
1. Child’s3555.6%34.8%2539.7%
2. Mother’s1058.8%00.0%741.2%
3. Both628.6%00.0%1571.4%
v33. Criterion A2 Any complications involving you or your child?0. No34987.7%338.3%164.0%<0.001
1. Child’s2044.4%12.2%2453.3%
2. Mother’s850.0%00.0%850.0%
3. Both220.0%00.0%880.0%
* p-values refer to Pearson chi-square.
Table 4. The total of 70 available data fields.
DescriptionNumber of Data FieldsCoded Labels
Demographics
(as shown in Table 1)
8v1, v2, v3, v4, v5, v6, v8, v9
Prenatal health variables
(as shown in Table 2)
12v10, v11, v12, v14, v15, v16, v18, v19, v21, v22, v23, v24
Mental health variables
(as shown in Table 3)
6v13, v25, v26, v31, v32,v33
Criteria A, B, C, D, E
(binary variables)
5v35, v36, v37, v38, v39
Answers to the twenty questions from DSM-V so that the PTSD score and values of Criteria B, C, D, and E are defined (values in {0,1,2,3,4}. These answers and the corresponding values for Criteria B, C, D, and E are only available six weeks after the birth.20v41–v60
The third question related to Criterion A (A3), number of similar stressful experiences. Min = 0, max = 11, median = 0.A Kruskal–Wallis H test showed that there was a statistically significant difference in its values between the three different diagnoses, H = 96.480, df = 2, p < 0.001, with a mean rank of 219.32 for free, 249.71 for profile, and 332.31 for PTSD.1v34
The seventeen Life Events Checklist (LEC-5) of DSM-V.
Values are weighted and summed for each of the four severity options (personal, witness, other, and occupation related with weight 4.0, 3.0, 2.0 and 1.0, respectively)
17lec_1–lec_17
The total count of LEC-5 answers. Min = 0, max = 11, median = 1.
A Kruskal–Wallis H test showed that there was a statistically significant difference in its values between the three different diagnoses, H = 49.636, df = 2, p < 0.001, with a mean rank of 214.89 for free, 341.76 for profile, and 306.25 for PTSD.
1v61
Table 5. The averaged confusion matrix of the initial classification results for the training phase using the complete set of the 70 variables. The accuracy is 99.6%.
FreeProfilePTSDPrecisionRecall (Sens.)Specificity
Free341.10099.9%100%99.7%
Profile0.228.81.5100%94.4%100%
PTSD0050.497.1%100%99.6%
Table 6. The averaged confusion matrix of the initial classification results for the testing phase using the complete set of the 70 variables. The accuracy is 92,9%.
FreeProfilePTSDPrecisionRecall (Sens.)Specificity
Free36.90.60.696.8%97.4%86.4%
Profile1.11.70.660.7%50.0%97.5%
PTSD0.10.54.882.8%88.9%97.6%
Table 7. The averaged confusion matrix and the classification errors from the RDF.
FreeProfilePTSDClass. ErrorSd of Class. Error
Free378100.0023750.001498
Profile13120.0970550.01421
PTSD01550.0178573.66 × 10−18
Table 8. The averaged Gini importance values of the 70 variables in descending order 1. Bolded variables are only available after six weeks of birth.
VariableGini ValueVariableGini ValueVariableGini ValueVariableGini Value
v3828.98435v451.8905019lec_30.31930649lec_40.137412479
v3727.394505v581.5943305v560.30413895lec_100.12593543
v3917.084163v491.1418203v110.30269473v120.120028475
v357.1403067v241.00739209v260.29636865lec_150.107513023
v446.971652v510.9250898v60.27196558lec_110.101853315
v416.3785479v610.81900432v140.26559605v30.101409277
v365.8372447v210.81722037v100.25888349lec_170.094143941
v594.8650734v600.81011046v150.2548879lec_10.084016984
v474.3128049v420.63748018v220.24198349v80.082011903
v324.2619363v20.62349169v230.21767294lec_160.080463707
v533.8501501v160.60897038v180.1983336lec_90.05289523
v433.6749819v130.54351801v310.17640773v90.045091486
v522.8472892v500.53564906lec_50.17548751lec_130.028551434
v332.4381206v50.49679806v340.17496421lec_80.011308693
v542.2139708v40.41331847v190.166634565lec_70.008951235
v572.0267311v480.39974051lec_120.14626491lec_20.004792534
v461.9955999lec_60.37660294v10.14314126
v551.8907127v250.36428793lec_140.142114515
1 The variable coding scheme is mentioned in Table 4.
Table 9. The list of 24 candidate variables for direct diagnosis sorted by Gini importance.
LabelDescriptionComments
v35Criterion AThis is activated upon at least a positive answer in v32 and/or v33 (below). The number of the events (v34 in Table 4) is related to this criterion but is not considered for its activation.
v32 Criterion A1 Was your life or your child’s life in danger?Easy to check in hospital
v33 Criterion A2 Any complications involving you or your child?Easy to check in hospital
v24 NICUEasy to check in hospital
v61 The total count of LEC-5 answersEasy to count from LEC answers
v21 Cause of C-sectionEasy to check in hospital
v2AgeEasy
v16Pathology of gestationInfo available from surveillance dossier
v13Psych. historyInfo available from surveillance dossier
v5OccupationEasy
v4Educational statusEasy
lec_6Physical assaultPart of LEC questionary
v25Support from partnerEasy
lec_3Transportation accident (car, train, boat)Part of LEC questionary
v11Previous laborEasy
v26ExpectationsQuestion, subjective
v6Financial statusQuestion
v14Atomic historyInfo available from medical history
v10ParityEasy
v15Gynecologic hist.Info available from medical history
v22Complications after C-sectionEasy
v23BreastfeedingEasy but not directly available
v18Full termEasy
v31Traumatic C-sectionEasy
Table 10. The eight datasets that were created from the variables in Table 9 and the corresponding sum of their Gini values. “1” means the variable is included in the dataset.
3532332461212161354L625L31126614101522231835
D1111 13.84
D2111111 16.48
D3111111111 18.26
D4111111111111 19.55
D5111111111111111 20.53
D6111111111111111111 21.37
D7111111111111111111111 22.12
D811111111111111111111111122.72
Table 11. The results during the training phase for the eight partial datasets (D1–D8) and for the complete set of the 70 variables (bolded values). Stratified ten-fold cross validation is applied.
Training Phase
PTSDProfileFree
Prec.RecallSpec.Prec.RecallSpec.Prec.RecallSpec.Acc.
D10.630.550.960.000.001.000.860.950.340.84
D20.700.650.960.000.001.000.870.960.410.85
D30.720.700.960.570.120.990.890.960.500.86
D40.740.760.960.660.160.990.900.960.560.88
D50.770.770.970.770.320.990.920.970.640.90
D60.830.830.980.790.350.990.930.970.680.91
D70.830.830.980.790.350.990.930.970.680.91
D80.810.790.970.770.340.990.920.970.660.90
All-700.971.000.991.000.941.000.991.000.990.99
Table 12. The results during the testing phase for the eight partial datasets (D1–D8) and for the complete set of the 70 variables (bolded values). Stratified ten-fold cross validation is applied.
Testing Phase
PTSDProfileFree
Prec.RecallSpec.Prec.RecallSpec.Prec.RecallSpec.Acc.
D10.580.520.950.000.001.000.850.940.320.83
D20.610.510.960.000.001.000.860.960.330.83
D30.640.630.950.500.061.000.880.940.430.84
D40.640.640.950.600.091.000.880.940.440.85
D50.670.630.960.380.150.980.890.940.500.85
D60.670.660.960.540.210.990.890.940.520.86
D70.670.660.960.540.210.990.890.940.520.86
D80.650.630.950.430.180.980.890.940.510.85
All-700.830.890.980.610.500.970.970.970.860.93
Table 13. The averaged confusion matrix and the classification errors from the RDF using the 46 variables remaining after removing the (20 + 4) ones directly related to the DSM-V. The complete dataset is used for the training.
FreeProfilePTSDClass. ErrorSd of Class.Error
Free357.86.614.60.055940.00389
Profile25.96.71.40.802940.03410
PTSD21.60.933.50.401790.02560
Publisher’s Note: MDPI stays neutral with regard to jurisdictional claims in published maps and institutional affiliations.

