Abstract
Absenteeism and early school leaving (ESL) constitute two main problems in education with a significant impact on adolescents’ life. Early leavers from education and training may face considerable difficulties in the labor market later as adults. Motivated by the necessity of minimizing this phenomenon, we developed a novel application that uses big data, generated from a student attendance management system in a vocational senior high school in Greece. This application first automatically conducts data preprocessing and data transformation and saves the processed data on a cloud data warehouse. Then, an online analytical processing (OLAP) analysis is performed, resulting in a real-time visualization that provides a variety of different graphs. In this study, we demonstrate the need for real-time visualization of the analyzed data. Such a type of presentation provides information on the spot regarding potential early leavers’ behavior, helping school administrators gain time for prompt and effective actions. Through the data processing and analysis, the application provides instructors with constant information, in addition to those acquired by the formal student attendance management systems. Our research provides indicative evidence in favor of the use of such applications, as by adequately reacting to the observed patterns in real-time, we observed a significant decrease in students’ unnecessary absences and a reduction of the ELS phenomenon in a three-year school period.
1. Introduction
New competencies will be required in the years to come, and a way for future citizens to be well prepared for this is by “learning to know”. According to Jacques Delors, “learning to know” means “learning to learn” to benefit from the opportunities that education provides throughout life [1].
In Greece, vocational education and training (VET) graduates gain a specialized degree in their field. Moreover, it has been observed that a large percentage of them seek to join the production workforce as specialized personnel. During the period 2015–2019, a highly targeted effort was made in Greece to support VET. The aim of this effort was effective institutional, educational, and pedagogical reforms in various fields [2,3].
In order to prevent and tackle early school leaving (ESL) in society, it is fundamental to detect the main factors causing it. The literature proposes a wide set of aspects, ranging from school-based explanations (school segregation) to individual, family, and socio-economic characteristics [4,5]. ESL is mainly observed among students of vocational education, where many of them are above 18 years old, students who face financial problems in their families and are forced to work in parallel with their studies, or students who come from a foreign country. The percentage of the latter can be expected to increase by 45 in the future due to the refugee crisis [6].
ESL is one of the core issues on the European educational agenda. It is a fundamental concern, as it does not only limit the life opportunities of ESLers but also calls into question the foundations of the European educational systems as guarantors of equal opportunities as well as the right to education.
In fact, far from being a phenomenon that affects all social groups equally, ESL is particularly significant among the most economically, socially, and culturally disadvantaged groups and, therefore, must be viewed as a central question in terms of educational equality and social justice [7]. The UNESCO World Inequality Database on Education (WIDE) provides evidence of the severity of ESL: 258 million children and youths were out of school during the school period 2017–2018 [8].
The strategic framework for European cooperation in education and training (known as ET 2020) adopted a benchmark to be achieved by 2020, namely, that the percentage of early leavers from education and training in the EU should be no more than 10%. With 9.9%, this target was only just met in 2020 [9].
In Bulgaria, Denmark, Estonia, Greece, Spain, Croatia, Cyprus, Lithuania, Hungary, the Netherlands, Poland, Romania, and Finland, the highest proportion of early leavers was reported in rural areas. This was also the case in Iceland, Norway, and North Macedonia [9].
In Greece, the ELS phenomenon was even more intense during the 2008–2009 economic crisis and the recession that followed afterward [10], strongly proving the significant relationship between socioeconomic circumstances, ESL and absenteeism phenomena.
According to a report published by the Institute of Education Policy [11], across the country of Greece, student outflows were lower in urban areas followed by semi-urban and rural areas but with a small difference. There were no significant differences in relation to educational levels, except for vocational education, in which the dropout rate was higher in urban areas and lower in semi-urban areas. Although the percentage of early leavers was 1.92% for upper secondary general education, it climbed to 11.02% for upper secondary VET [11].
Our study claims that a learning analytics (LA) system could fulfill the requirements for informing all parties concerned (students, instructors, parents, school administration, etc.) on the dot. Although higher education has already taken advantage of the benefits of LA systems [12,13,14,15,16], especially with the mediation of online learning environments, the fact that these systems are addressed to non-information-technology experts (non-IT experts) to make sense of forms a barrier for potential use in secondary education. As a result, making these systems easy to use is of great importance. VET remains overlooked in learning analytics research [17].
The lack of guidelines on what to consider when implementing the LA prevents its full adoption; hence, there are important issues to be considered when approaching the design of the LA experience in terms of data preparation [18]. Undoubtedly, data preparation is a fundamental stage of data analysis in predictive learning analytics (PLA) for student dropout [19].
Developing and using an early warning system (EWS) is a good solution for detecting students at high risk of dropout as early as possible. An EWS is any system designed to alert decision makers of potential dangers. Its purpose is to allow for prevention of the problem before it becomes an actual danger [20,21]. In this line, it is important to realize that identifying students at risk of dropping out by using an EWS is only the first step in truly addressing the issue of school dropout. The next step is to identify the specific needs and problems of each individual student who is in danger of dropping out and then to implement programs to provide effective and appropriate dropout prevention strategies [21].
This study aimed to present the results of a methodology based on a prototype application that was developed in order to manage and visualize students’ data for early decision making such as ESL. Through this application, the factors that are related to absenteeism and ESL are highlighted. In more detail, the application collects and analyses students’ data concerning their school presence. Afterwards, it creates visuals that can be easily read by non-experts who can then be informed regarding students’ behavior, spot students in dropout danger, and generally come to conclusions that can be used to reduce absenteeism.
2. Related Work
A significant observation is that in Greece, vulnerable social groups, such as immigrants or other ethnic minorities, present a five times higher risk of dropping out of secondary education than the general population [22]. Other factors driving this phenomenon include cognitive ability, family composition, socioeconomic situation, or school location [23]. Interventions should not and cannot always be aimed exclusively at a person or his/her individual family. Instead, school policies can be proven to be effective. The same factors were acknowledged by teachers in a relevant study [24]. Additionally, several behavioral problems, such as depression, anxiety, or attention deficit hyperactivity disorder (ADHD) syndrome, increase the risk of dropping out of school at an early stage [25]. Health and family problems are also important reasons for absenteeism; in India, a biometric system in combination with home visits was proposed for the decrease of chronic absenteeism and, thus, of the dropout rate [26]. Socioeconomic factors were identified as a major predictor of expected ESL in the research in [27].
Another more recent study [28] makes a distinction between risk factors for absenteeism and ESL. The authors mention that the factors with large effects on absenteeism include a negative attitude towards school, substance abuse, externalizing and internalizing problems of the juvenile, as well as low parent–school involvement. As far as the issue of dropout is concerned, the risks that indicated a large effect on absenteeism include a negative attitude towards school, substance abuse, externalizing and internalizing problems of the juvenile, as well as low parent–school involvement. According to them, as far as dropout issue is concerned, the risks that indicated a large effect include a history of grade retention, having a low IQ, or experiencing learning difficulties and low academic achievement.
A significant distinction is to understand whether a student is absent due to the presence of an insuperable barrier (illness, serious family reasons, etc.) or by choice. Truancy is a common reason for systematic absenteeism that can lead to significant loss of knowledge, poor grades, and even school dropout. A truant has a 3.4 times higher risk of leaving school than his/her peers [29]. Moreover, peer group effects are emerging. Students’ social behavior relates to the tendency of missing classes for no important reason. Bembich [30] highlighted the dysfunctional relational structures that raise the risk within groups of students. Therefore, having the opportunity to detect patterns in students’ interactions when the number of their absences is becoming high for no obvious reason becomes of crucial importance.
A different approach to this problem is to investigate the level of school leavers. In the study in [31], students were separated into four different groups (i.e., those without any qualification, with low qualified, apprentices, and with full qualification). It was shown that these four groups revealed clear differences in the effects of different factors on the risk of ESL. Level-related factors were recognized also in the research in [32]. Higher levels of absenteeism appeared to be more closely related to lower achievement orientation, active-recreational orientation, cohesion, and expressiveness.
The common denominator in the research concerning absenteeism and ESL is the recognition of the importance of the early detection of students at risk. As Lyche [33] well stated: “Early identification enables broader, less costly measures to be set up earlier and leaves the more costly one-on-one measures for later stages of education to the remaining at-risk students that have not yet been picked up”. The idea of taking action in the shortest possible time is central in the European Union policy as well. That is, in order to cultivate knowledgeable and successful teachers and schools, by emphasizing and empowering the elimination of social and educational exclusions, it needs to be an integral part of the pursuit of progress and development of the society and the economy [34]. Thus, predictive and prescriptive analytics should be established at every educational level to provide the necessary data for decision making. Leveraging school data educators can take action rapidly to prevent ELS. Early warning systems have been used in six European countries (i.e., Poland, Lithuania, Germany, Sweden, Ireland, and the United Kingdom) with positive results [35].
In higher education, efforts are usually aimed at creating predictive systems that will notify tutors for on-time interventions concerning students at risk, based on the prediction of their academic achievements. Machine learning techniques provide an accurate prediction of dropping out, allowing educators prompt action to prevent students’ failure. Lykourentzou et al. [36] compared three different techniques achieving high accuracy of prediction in e-learning course students. Márquez-Vera et al. [21] identified significant predictive factors for students at risk, including low academic performance, substance use (alcohol and smoking), hours of work, maternal education, and the number of students in each class, using machine learning techniques. A recent study [37] provided results of high accuracy to a time series prediction problem by proposing a model with an accuracy that can reach up to 84% in the final weeks of study, provided that the course demands students’ involvement in online learning activities. Forum participation was found to be an indicator of higher grades, thus leading to a lower dropping-out risk. Clustering methods were also used to provide evidence of cheating in written assignments, resulting in poor final performance despite high grades during the semester [14]. Finally, Gontzis et al. [38] presented a predictive analytic tool based on participation-related attributes that can early predict students that are in danger of dropping out.
Delis et al. [39] presented the methodology and technological aspects of the application that is used in the Greek educational community to organize and manage students’ data.
3. Materials and Methods
This section describes the methodology followed in order to create a multiple visualization environment that would instantly be informed about students’ absentee status and can easily be accessed by educators. In more detail, firstly we present an overview of the This section describes the methodology followed in order to create a multiple visualization environment that would instantly be informed about students’ absences status and easily be accessed by educators. In more detail, firstly we present an overview of the Greek educational system focusing on vocational schools and the geographical area of this study. Subsequently, the research questions, methodology, and finally the tools and the implementation design are explained.
3.1. Setting and Dataset Description
Education in Greece is compulsory for all children between the ages of six and fifteen. K12 education is divided into primary and secondary education. Primary education includes the k1 to k6 grades. Secondary education is divided into lower secondary (i.e., K7, K8, and K9 grades), which is compulsory, and upper secondary (i.e., K10, K11, and K12 grades) which is optional. The grades up to k9 constitute a compulsory education, while upper secondary education is optional. During upper secondary education, students can either attend a general high school and be prepared to enter higher education or a vocational high school and be qualified with specific hard skills by receiving a vocational training.
This study focused on the vocational high school of Prosotsani in the rural area of the municipality of Drama that belongs to the administrative region of Eastern Macedonia and Thrace in Northern Greece. Drama is a nonprivileged area with limited career opportunities for young people. Eastern Macedonia and Thrace is the administrative region in Greece with the second-lowest gross domestic product (GDP) per capita and is one of the poorest regions in the EU [40]. The difficult financial conditions along with a significantly low birth rate are affecting the quality of life negatively and add even more importance to the role of education and training. Especially for adolescents, it was found that socioeconomic status inequalities influence their literacy abilities, leading to poorer educational attainment and working memory task results [41], proving the augmented need for quality public education in low privileged areas.
Teachers and educational stakeholders in the reference school have empirically pointed out the significance of the absenteeism problem. Therefore, since 2012, the vocational high school’s director has been using an early warning system to track the exact number of students’ absences in order to inform their legal guardians. It must be noted that this warning system was an initiative undertaken by the director, as there was no general strategy for using an early warning system in Greek education. However, tracking the number of absences is not sufficient to solve the ELS problem. Visualizing results in an interpretable way is also necessary.
Data over three successive years were retrieved from the vocational high school of Prosotsani. These data came from the database of the early warning system and included the absences of students along with the characteristics that affect absenteeism. This area was chosen because it reflects the challenges of attending a nonprivileged, public, provincial school with the background of the Greek economic crisis. Students from 13 small towns and villages in the wider area of Prosotsani attended courses in the reference school (Table 1). There were a total of 258 students in the high school over the three successive years. The majority of students were boys (64%). Students from the wider area during the school period used public transportation to attend their courses.

Table 1.
Students from 13 areas, other than Prosotsani, were registered at the reference school.
The retrieved data also contained information concerning age, gender, personal information (address, phone number, etc.), and a detailed record of absences on an hourly basis.
3.2. Research Questions
Investigating the situation presented above at the vocational high school of Prosotsani, since 2012, and over three successive years, also based on the need for a visualization of the data during this period, the research questions addressed were the following:
- RQ1
- Can we identify those factors that affect the absenteeism phenomenon so as to create a cube of important data for real-time visualization?
- RQ2
- Which types of visualization can provide a clear view of students’ behavior in a way that even nonexperts in the field of learning analytics can easily draw conclusions for decision making?
- RQ3
- Does the strict policy of frequent parental briefing, based on the available visualization of data followed by this school unit, discourage students from enrolling, resulting in students’ population decrease?
- RQ4
- Are there any patterns in students’ absences concerning the day, the hour, or the class?
- RQ5
- Are there any correlations between students’ absences and the other variables of the data warehouse?
3.3. System Implementation Design
Our team designed and developed a new educational application with the main goal of reducing ESL and school and university dropouts (Figure 1). It is a Windows Desktop application and can be described as Extract-Transform-Load (ETL).
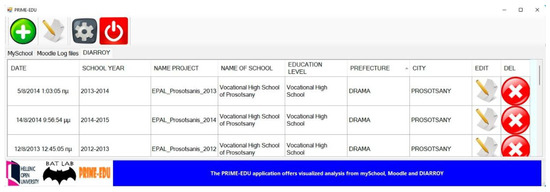
Figure 1.
Screenshot of the Extract-Transform-Load (ETL) application.
It receives data from other educational applications, such as from MySchool, Moodle, Leak, and Classter. In more detail, MySchool is an online application designed by the Greek Ministry of Education, and it is used by all Greek secondary schools, whereas Moodle is a widely used web application used for asynchronous education. Leakage is a windows desktop application designed and developed by our team that offers telematics services to reduce ESL and educational dropout. Finally, Classter is a web application of the company Vertitech that aims to manage the educational process in the life cycle of an organization such as primary, high school tuition, and general or vocational high school.
Our application was programmed in the C# programming language in Microsoft Visual Studio 2017. It utilizes Microsoft Virtual Machine.NET Framework 3.5 libraries so that our application can work in all versions of Microsoft Windows. The application sends automatically training data to the warehouse database from Excel, Access, SQLSERVER. It also sends information via SMS to parents such as information about their children’s attendance. An essential requirement of the application is that the data it sends to the cloud warehouse database have to be anonymous, not only because it must comply with the community privacy requirement but also because personal data do not help us make educational decisions.
Our application transfers data to the cloud warehouse database, which was developed in SQL SERVER 2017. The warehouse database is designed with a table of events and dimensions tables in a snowflake schema. The table of facts has in each line the attendance of each student per day and the dimension tables most of the characteristics that affect the attendance of the student such as environment, schoolteacher, family, etc.
From the cloud warehouse database, we isolated the data that we needed to make educational decisions. The technique we used was that of business intelligence used for many years by companies with many data to determine the behavior of their customers and their organization. Thus, with CUBE and roll-up techniques, we succeeded in isolating an educational phenomenon and managing it per period, per area, per age of students, etc.
With the data we isolated with CUBE techniques and with the capabilities of the Tools for Visual Studio (RTVS) tool, we could more easily visualize an educational phenomenon and look for the prediction.
The snowflake model, as an extension of the star model, with each dimension table extending outward, supported the role or explained details to multiple tables for external connection. The main point of these tables was for a detailed description of the fact table for some dimensions, which can reduce the fact table properties, to enhance the efficiency of the query [42].
As shown in Figure 2, the design of the cloud warehouse database was in the form of a snowflake schema. The transaction fact table included the students’ absences per hour in the daily school schedule, the total students’ absences per school day, and the students’ absences due to the fact of illness. The dimensional tables included project characteristics and characteristics that affected students’ attendance such as weather, teachers, grades, and student characteristics (without including properties that reveal the student’s identity).
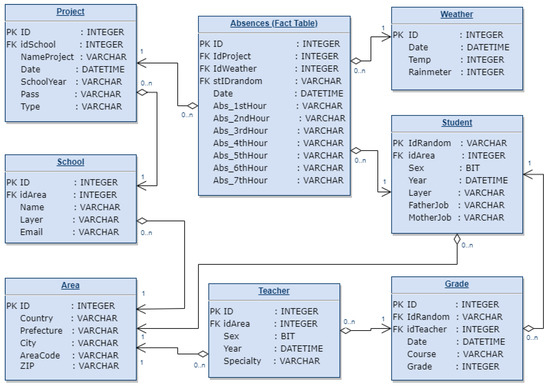
Figure 2.
Entity relationship model (ERM) of the cloud warehouse database (snowflake schema).
In Figure 3, there is a snapshot of the cloud warehouse database. In the “Absences Fact Table”, information regarding the presence of each student per school hour is shown. Namely, it shows whether the student is present or absent at a specific hour. In the case that the student is absent, it also shows whether he/she is excused with a parents’ note or with a doctor’s note accordingly. Additionally, it records when a student has missed the class due to the fact of an exploitation. In the rare case that a group of students have a free hour between courses, the corresponding field in the fact table takes the value: “No classes”. Enterprise data warehouses (EDW or simply, DW) are complex systems serving as a repository of an organization’s data. Apart from their role as enterprise data storage facilities, they include tools to manage and retrieve metadata, tools to integrate and cleanse data, and, finally, business intelligence tools for performing analytical operations. Conceptually, data warehouses are used for the timely translation of enterprise data into information useful for analytical purposes. In doing so, they have to manage the flow of data from operational systems to decision support environments.
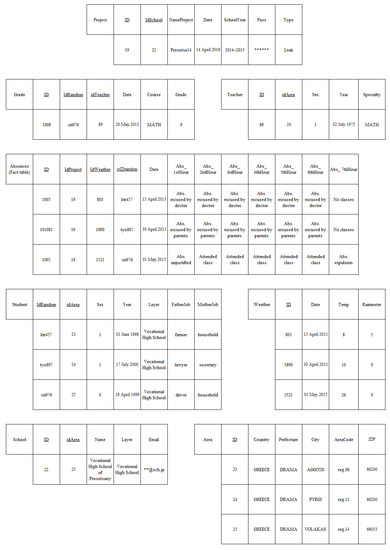
Figure 3.
One possible relational database state corresponding to the cloud warehouse snowflake schema; the primary keys (PK) are underlined.
The process of gathering, cleansing, transforming and loading data from various operational systems that perform day-to-day transaction processing (hereafter, sources or source data stores) is assigned to the ETL processes [43]. However, when it comes to the environment of online analytical processing (OLAP), which is performed over simply but neatly organized cubes, these two tasks, along with profiling (i.e., data quality assurance), have already been completed, either by the organization ETL workflow or by a do-it-yourself data wrangling. The rest of the high-level tasks are too few and too high for our purpose here [44].
4. Results and Discussion
Simple and more complex graphs were created by our application (Figure 4) to investigate the most important factors that affect students’ absenteeism. The choice of the graphs was driven by their ability to provide clear and interpretable relations of the data. The number of absences per student and in total is visualized per school hour (i.e., 1st to 7th hour), per day, per region, or per school year. Additionally, the use of maps can reveal problems related with distant or problematic regions. Possible relations between the variables that were measured can be proven by using correlation analysis that can be accessible at a glimpse using correlation plots.
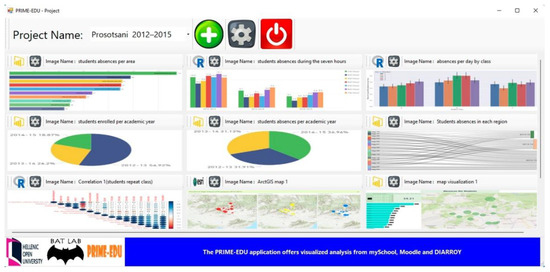
Figure 4.
Screenshot of the of the application who creates the graphs.
To begin with, certain simple graphs allow educators to draw simple conclusions regarding students’ data. The bar chart from the three-year period (Figure 5) indicated that students from certain regions (i.e., Mikropoli, Petroussa, Volakas, Kali Vrysi, and Anthochori) tended to miss courses more frequently. The abovementioned areas have a long distance from the school, and students from these areas had many absences during the first year (2012–2013) out of the three years in our research, but, subsequently, they were able to reduce them with the help of the early warning system (Table 1). Moreover, it was obvious that during every school year (between 2012 and 2015) it was always the first hour of the daily schedule that was the most likely to be missed (Figure 6). This is usually due to the fact of transport-related problems, bad weather and bad sleeping habits.
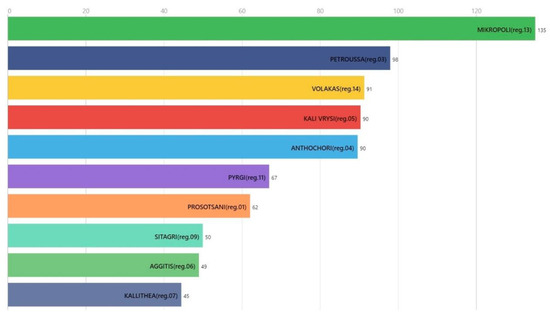
Figure 5.
The average number of students’ absences per area for the school years 2012–2015.
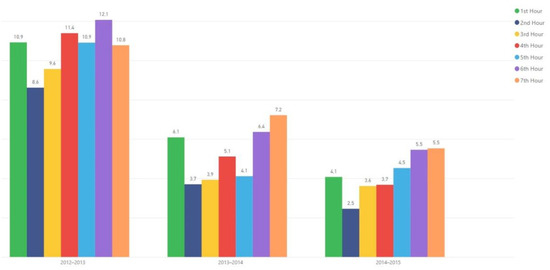
Figure 6.
The average number of all students’ absences during the seven hours of the daily schedule for the school years 2012–2015.
Students in the second grade of the vocational high school tended to skip classes unexcused more than the other students (Figure 7). This happened mostly in the middle of the week.
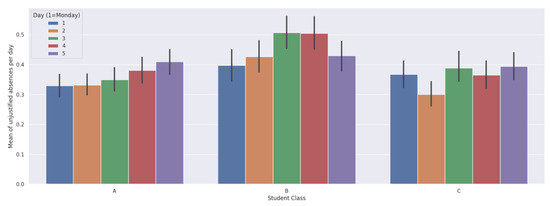
Figure 7.
Total number of absences per day by class (Where A represents the first grade, B represents the second grade and C represents the third grade of the Vocational Highschool).
As shown in Figure 8, the students who lived in region 4 were late for school more than their peers from other areas. Since reg.04 is not the most distant area, this might indicate problems in transport connection.
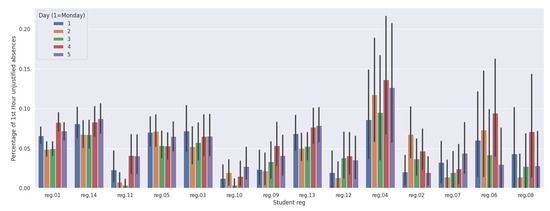
Figure 8.
Total number of absences per day by region.
The pie chart in the left part of Figure 9 provides information about the percentage of students’ enrollments during three successive school years. Additionally, in the right part of Figure 9, the quota of total absences for the same period is shown. That is, in the total of the three years 2012–2015 of our research, the students in the 1st year were 31.91%, in the 2nd year 31.14%, and in the 3rd year 36.6%. There was a descending percentage of absences while the number of students during the same period was either almost the same or increased. Vocational schools in Greece follow an inclusive policy, gathering many students from vulnerable groups. Practices that can be considered as strict or demanding may discourage student admission by increasing the fear of failure. The eventual rise in the enrollment of students and the parallel drop in students’ absences indicate that the implementation of our system had a positive acceptance rather than created a feeling of freedom restriction.
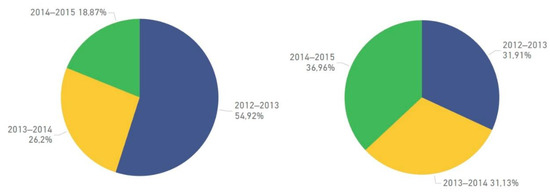
Figure 9.
Left: Percentage of the number of students enrolled per academic year. Right: Percentage of the average number of students’ absences per academic year.
Radar charts (or spider charts) are mainly used to compare categorical attributes. Each axis represents an area, so it is easy to rank them by ascending order. This is important because it allows teachers to instantly draw conclusions regarding the progression of absenteeism compared with other schools, indicating performance and improvement. The three-fold diagram of Figure 10 was created with Microsoft Radar Chart (ver.2.0.2.0, 2019, Microsoft Power BI, USA), and it indicated a change in the school’s rank depending on the type of absenteeism. The absences per student are compared to the frequency of skipping the first class and the absence during the last hour of school. Differences in the areas’ order between these three diagrams can be indicative of factors affecting absenteeism. The visualization is dynamic, allowing teachers to choose the school year and have a constantly updated view of the new incoming data.
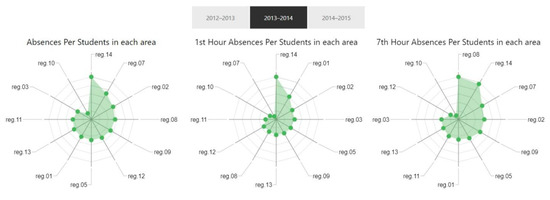
Figure 10.
Left: Radar charts for the mean number of total absences per student. Center: The mean number of the absences per student during the 1st hour. Right: The mean number of the absences per student during the last hour. All of the above refer to the school year 2013–2014.
To imprint the contribution of a variable in the overall flow, the flow diagram called Sankey was used. In particular, in Figure 11 the contribution of each region presented in Table 1 to the total number of absences during three successive school years is shown. Links are weighted to using the number of total absences so thicker lines indicate a greater contribution to the absenteeism phenomenon.
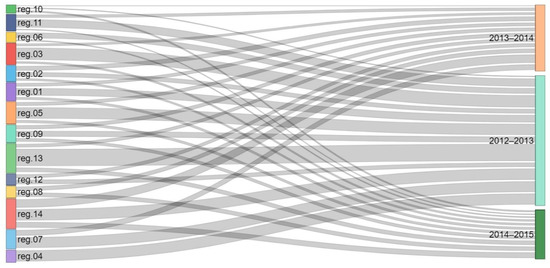
Figure 11.
Students’ absences in each region during the three school years.
Figure 12 was compiled with our system and the ArcGIS application, which helps to visualize the data using interactive maps. The star schema storage allows us the choice of visualizing different schools or different school years. In Figure 12, the total number of students’ absences in the area per student is shown. Different colors represent different years: the school year 2012–2013 is red, the year 2013–2014 is yellow, and the year 2014–2015 is blue. This visualization helps the teachers to identify absenteeism problems in students from a specific area and thus to relate them to relevant factors, such as transportation problems and eventually to determine if the problem was effectively managed over time.
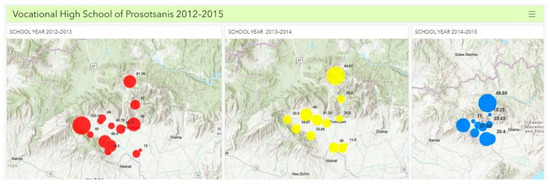
Figure 12.
Interactive maps of the school’s region that depict the total absences of students per area/the total number of students per area by the size of the circle diameter. Red: school year 2012–2013; yellow: 2013–2014; blue: 2014–2015.
Microsoft Power BI was used to create dynamic visualization with the same data format as in the previous graphs to develop the online map in Figure 13. In this case, the user can select the school year and the area of interest on the left side of the map. The number at the left top of the image expresses the total absences of the school per student for the school year selected. The following graphs were developed using Microsoft Power BI’s Horizontal Bar Chart by (ver.1.5.4.0, 2019) and Map Bing. Drill Down Donut PRO by Zoom Charts(ver.1.5.19, 2019) and Chord by Microsoft (ver.2.0.4, 2017) were also used.
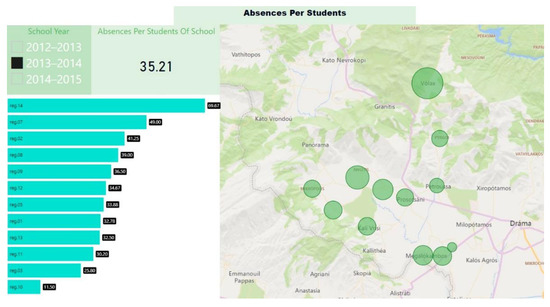
Figure 13.
A combination of a bar chart and a map visualization. For every area the length of the bar and the diameter of the circle on the map change according to the total absences of the students of the area/the total number of the students of the area in each school year.
To investigate the dependence between multiple variables time and to highlight the most correlated variables in our data table we used the correlation plot. The statistical measure of Pearson correlation coefficient was used where the value of +1 (or −1) indicates a perfect correlation between two variables, with +1 indicating a positive correlation and −1 a negative (inverse) correlation; a value in the range from 0.6 to 1 (or from −0.6 to −1) indicates a strong correlation; a value between 0.4 and 0.6 (or between −0.4 and −0.6) indicates a moderate correlation; a value in the range from 0 to 0.4 (or from 0 to −0.4) indicates a weak correlation [45]. The correlation coefficients are colored according to the value providing in a simple and interpretable way. The students were divided into three groups according to their level of absenteeism. In the first group students who had to repeat the class because they exceeded the limit of absences (N = 25). The second group contains students with high levels of absenteeism who successfully completed the class (N = 118), while the students in the third group had rarely been absent (N = 116). As it was expected due to the criterion used for divided the students in the groups, a one-way ANOVA revealed that there was a statistically significant difference in the total number of absences between these three group of students (F(between groups 2, within groups 256) = 234.35, p = 0.00). Apart from the correlation matrix for each group, the p-values are provided in Appendix A to evaluate the statistical significance of the results.
The correlation matrix in Figure 14 shows that most of the parents did not contact the school to justify their children’s absences. There was a weak negative correlation between the total number of students’ absences and the number of absences that their parents justified. This result may seem contradictory. However, it could be indicative of a lack of interest on behalf of parents concerning their children’s schooling or an attitude of low expectations.
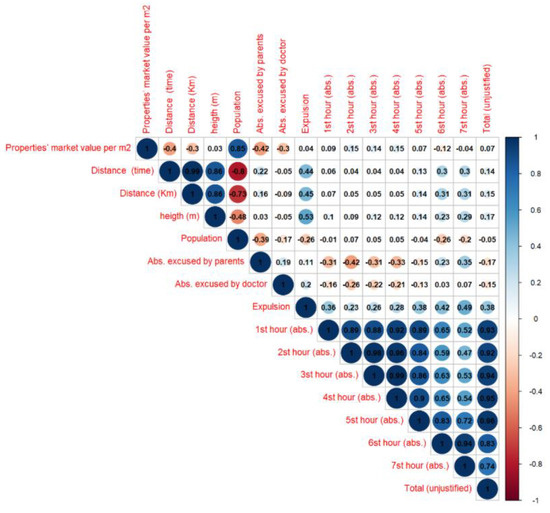
Figure 14.
Correlation matrix for students who will repeat the class.
The number of absences due to the fact of expulsion was positively but not significantly correlated with the distance (r(23) = 0.45, p = 0.16) but weakly and negatively correlated with the population (r(23) = 0.17, p = 0.02). Additionally, there was a positive correlation between the number of expulsion absences and the total number of absences (r(23) = 0.38, p = 0.00), showing that the tendency to skip classes regularly often comes with behavioral difficulties. In the study by Sara et al. [46], which was conducted in Denmark, four characteristics that influenced school dropout were highlighted: class size, school size, last month’s absences, and average income per postal code.
In the second group of students (Figure 15), parents justified their children’ absences. There was a strong positive correlation between the number of justified absences from the parents and the total number of absences (r(116) = 0.75, p = 0.00). Students that lived in more privileged areas tended to skip more classes because there was a very strong positive correlation between the market value of students’ residence and the total number of absences (r(116) = 0.89, p = 0.00). There was a moderate positive correlation between the total number of absences and the distance that student had to make to get to school (r(116) = 0.35, p = 0.00).
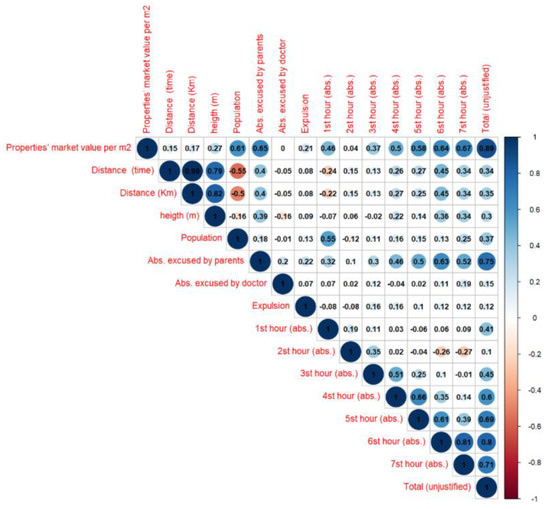
Figure 15.
Correlation matrix for students with high number of absences.
In their study, Nascimento et al. [47] used correlation tables to show that the level-age dispersion had the highest positive correlation with school dropout, while, on the other hand, the adequacy of teacher training had the highest negative correlation.
In the group of students who rarely skipped classes (Figure 16), the total number of absences was highly correlated with the market value of their residence, also for students with a low number of absences (r(114) = 0.063, p = 0.00). Additionally, there was a strong positive correlation between the total number of absences and the number of absences that were justified by parents (r(114) = 0.60, p = 0.00). Finally, there was a moderate positive correlation between the number of absences and the distance to the school from students’ residence (r(114) = 0.46, p = 0.00).
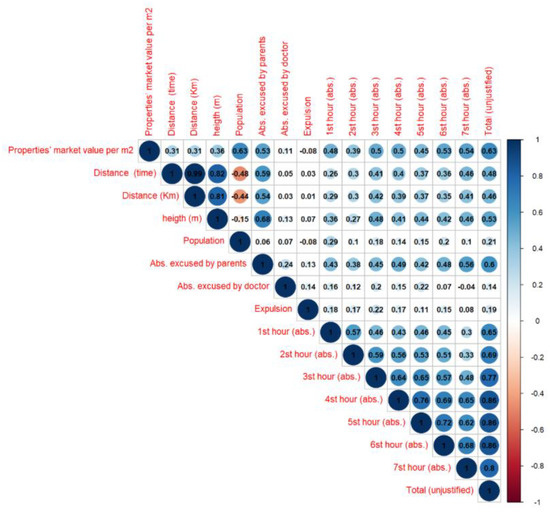
Figure 16.
Correlation matrix for the students with low number of absences.
5. Conclusions
In this paper, we presented a two-fold effort to diminish absenteeism that was implemented in the vocational high school of Prosotsani. The system proposed combined with the early warning system that the school already uses provided educational stakeholders with simple and complex graphs that can be easily interpreted. The results showed a significant impact in gradually reducing the number of students’ absences during three successive school years. At the same time, there was a rise in students’ enrolment, indicating that this policy was well received by the local community.
Concerning RQ1, it was shown that factors such as the hour, region, or the day could provide useful knowledge from students to their tutors, so that they can control the absenteeism phenomenon. As it was shown in the previous section, there were significant correlations between students’ absences and factors such as distance and the market value of the properties where they live. This information should be provided in simple graphs, such as bar and pie charts, to be straightforward and easy to read. Additionally, radar charts and maps containing rich information can be used by nonexperts for sense making such as knowing in which area the absenteeism has decreased over the years. In addition, elaborated graphs, such as Sankey diagrams and correlation plots, can be used to present relationships between different factors (RQ2). Additionally, simple comparisons, such as those in Figure 9, answer to RQ3, showing that the strict policy of frequent parental briefing did not discouraged students from enrolling even when there were aware of this policy in the two following years. Graphs 5, 6, and 7 revealed information concerning patterns connected with the hour, the day, and the class that students attend (RQ4). There, the educators can spot which day has the most absences or whether students from a certain region tend to skip classes more often. Those patterns may vary from time to time. Thus, the proposed system’s ability to daily load data and provide updated information to educators is one of its main benefits. This actionable knowledge can be used to introduce new policies when needed. For example, Figure 7 can lead tutors to investigate what led the students of the second to skip classes more often than their peers and make an appropriate intervention to reduce them. Finally, the correlation plots showed several statistically significant correlations, especially for students with high number of absences (i.e., students at a high dropping out risk) and the students who eventually had to repeat their class (RQ5).
On a deeper level, the constantly updated visualization of students’ absences combined with related variables (school year, hour in the daily school schedule, and region) provides teachers with the opportunity to spot and prove possible reasons for systematic absences and identify students at risk of realizing social aspects of the problem. This way valuable time can be gained, allowing teachers to act and ask for the intervention of specialists (phycologists or social workers) when needed. The potential long-term positive contribution of our system to prevent absenteeism and ESL could be a robust argument towards its implementation in the common policy of every high school towards the elimination of these phenomena.
Author Contributions
Conceptualization, C.S.; Data curation, C.S.; Formal analysis, R.T.; Investigation, E.P.; Methodology, E.P. and S.K.; Project administration, V.S.V.; Software, E.P.; Supervision, V.S.V.; Validation, S.K.; Visualization, R.T.; Writing—original draft, C.S. and R.T.; Writing—review & editing, S.K. and V.S.V. The authors contributed equally to the work. All authors have read and agreed to the published version of the manuscript.
Funding
This research received no external funding.
Institutional Review Board Statement
Not applicable.
Informed Consent Statement
Not applicable.
Data Availability Statement
Not applicable.
Acknowledgments
We would like to thank Konstantinos Kabadais, Director of the Vocational School of Prostotsani as well as all the members of the teaching staff for their devotion in the implementation of this new technology for the students’ benefit. Their cooperation led to the successful completion of students’ studies and also to the increase in the student’s guardian trust towards the public vocational schools.
Conflicts of Interest
The authors declare no conflict of interest.
Appendix A
Table A1.
p-Values for the correlation matrix in Figure 14.
Table A1.
p-Values for the correlation matrix in Figure 14.
| Properties’ Market Value per m2 | Distance (time) | Distance (Km) | Heigth (m) | Population | Abs. excused by Parents | Abs. Excused by Doctor | Expulsion | 1st hour (abs.) | 2nd hour (abs.) | 3rd hour (abs.) | 4th hour (abs.) | 5th hour (abs.) | 6th hour (abs.) | 7th hour (abs.) | Total (Unjustified) | |
|---|---|---|---|---|---|---|---|---|---|---|---|---|---|---|---|---|
| Properties’ market value per m2 | NA | 0 | 0 | 0 | 0 | 0 | 0.005 | 0.039 | 0.143 | 0 | 0.116 | 0 | 0.146 | 0.232 | 0 | 0 |
| Distance (time) | NA | 0 | 0 | 0 | 0 | 0.86 | 0.159 | 0.435 | 0.091 | 0 | 0 | 0 | 0.002 | 0 | 0 | |
| Distance (Km) | NA | 0 | 0 | 0 | 0.767 | 0.363 | 0.131 | 0.19 | 0 | 0 | 0 | 0.001 | 0 | 0 | ||
| heigth (m) | NA | 0 | 0 | 0.052 | 0.021 | 0.001 | 0.339 | 0 | 0 | 0 | 0 | 0 | 0 | |||
| Population | NA | 0 | 0.575 | 0.058 | 0.048 | 0.004 | 0.032 | 0 | 0.003 | 0.047 | 0 | 0 | ||||
| Abs. excused by parents | NA | 0 | 0.003 | 0 | 0 | 0 | 0 | 0.002 | 0.005 | 0 | 0 | |||||
| Abs. excused by doctor | NA | 0.005 | 0.002 | 0.278 | 0 | 0.036 | 0 | 0.039 | 0.11 | 0 | ||||||
| Expulsion | NA | 0 | 0 | 0 | 0 | 0 | 0 | 0 | 0 | |||||||
| 1st hour (abs.) | NA | 0 | 0 | 0 | 0.001 | 0.003 | 0.554 | 0 | ||||||||
| 2nd hour (abs.) | NA | 0 | 0 | 0 | 0 | 0.195 | 0 | |||||||||
| 3rd hour (abs.) | NA | 0 | 0 | 0 | 0 | 0 | ||||||||||
| 4th hour (abs.) | NA | 0 | 0 | 0 | 0 | |||||||||||
| 5th hour (abs.) | NA | 0 | 0 | 0 | ||||||||||||
| 6th hour (abs.) | NA | 0 | 0 | |||||||||||||
| 7th hour (abs.) | NA | 0 | ||||||||||||||
| Total (unjustified) | NA |
Table A2.
p-Values for the correlation matrix in Figure 15.
Table A2.
p-Values for the correlation matrix in Figure 15.
| Properties’ Market Value per m2 | Distance (time) | Distance (Km) | Heigth (m) | Population | Abs. Excused by Parents | Abs. Excused by Doctor | Expulsion | 1st hour (abs.) | 2nd hour (abs.) | 3rd hour (abs.) | 4th hour (abs.) | 5th hour (abs.) | 6th hour (abs.) | 7th hour (abs.) | Total (Unjustified) | |
|---|---|---|---|---|---|---|---|---|---|---|---|---|---|---|---|---|
| Properties’ market value per m2 | NA | 0 | 0 | 0.001 | 0 | 0 | 0.005 | 0.215 | 0 | 0.017 | 0.002 | 0.032 | 0 | 0 | 0.33 | 0.047 |
| Distance (time) | NA | 0 | 0 | 0 | 0 | 0.001 | 0.366 | 0 | 0.001 | 0.016 | 0.281 | 0.628 | 0 | 0 | 0.046 | |
| Distance (Km) | NA | 0 | 0 | 0 | 0 | 0.362 | 0 | 0.002 | 0.019 | 0.045 | 0.832 | 0 | 0 | 0.049 | ||
| heigth (m) | NA | 0 | 0 | 0 | 0.025 | 0 | 0.498 | 0 | 0.02 | 0 | 0 | 0 | 0.167 | |||
| Population | NA | 0 | 0.413 | 0.079 | 0 | 0 | 0.479 | 0.118 | 0.009 | 0 | 0.074 | 0.015 | ||||
| Abs. excused by parents | NA | 0 | 0.649 | 0 | 0.012 | 0 | 0.049 | 0.47 | 0 | 0.004 | 0 | |||||
| Abs. excused by doctor | NA | 0.917 | 0.006 | 0 | 0 | 0 | 0.046 | 0.046 | 0 | 0 | ||||||
| Expulsion | NA | 0 | 0 | 0.004 | 0.001 | 0.153 | 0.034 | 0.514 | 0 | |||||||
| 1st hour (abs.) | NA | 0 | 0.004 | 0 | 0 | 0 | 0 | 0 | ||||||||
| 2nd hour (abs.) | NA | 0 | 0.447 | 0 | 0 | 0 | 0.16 | |||||||||
| 3rd hour (abs.) | NA | 0 | 0 | 0 | 0 | 0.438 | ||||||||||
| 4th hour (abs.) | NA | 0 | 0.013 | 0 | 0 | |||||||||||
| 5th hour (abs.) | NA | 0 | 0.003 | 0 | ||||||||||||
| 6th hour (abs.) | NA | 0 | 0 | |||||||||||||
| 7th hour (abs.) | NA | 0 | ||||||||||||||
| Total (Unjustified) | NA |
Table A3.
p-Values for the correlation matrix in Figure 16.
Table A3.
p-Values for the correlation matrix in Figure 16.
| Properties’ Market Value per m2 | Distance (time) | Distance (Km) | Heigth (m) | Population | Abs. Excused by Parents | Abs. Excused by Doctor | Expulsion | 1st hour (abs.) | 2nd hour (abs.) | 3rd hour (abs.) | 4th hour (abs.) | 5th hour (abs.) | 6th hour (abs.) | 7th hour (abs.) | Total (Unjustified) | |
|---|---|---|---|---|---|---|---|---|---|---|---|---|---|---|---|---|
| Properties’ market value per m2 | NA | 0 | 0 | 0 | 0 | 0 | 0.005 | 0.039 | 0.043 | 0 | 0.04 | 0 | 0.03 | 0.02 | 0 | 0 |
| Distance (time) | NA | 0 | 0 | 0 | 0 | 0.86 | 0.159 | 0.435 | 0.091 | 0 | 0 | 0 | 0.002 | 0 | 0 | |
| Distance (Km) | NA | 0 | 0 | 0 | 0.767 | 0.363 | 0.131 | 0.19 | 0 | 0 | 0 | 0.001 | 0 | 0 | ||
| heigth (m) | NA | 0 | 0 | 0.052 | 0.021 | 0.001 | 0.339 | 0 | 0 | 0 | 0 | 0 | 0 | |||
| Population | NA | 0 | 0.575 | 0.058 | 0.048 | 0.004 | 0.032 | 0 | 0.003 | 0.047 | 0 | 0 | ||||
| Abs. excused by parents | NA | 0 | 0.003 | 0 | 0 | 0 | 0 | 0.002 | 0.005 | 0 | 0 | |||||
| Abs. excused by doctor | NA | 0.005 | 0.002 | 0.278 | 0 | 0.036 | 0 | 0.039 | 0.11 | 0 | ||||||
| Expulsion | NA | 0 | 0 | 0 | 0 | 0 | 0 | 0 | 0 | |||||||
| 1st hour (abs.) | NA | 0 | 0 | 0 | 0.001 | 0.003 | 0.554 | 0 | ||||||||
| 2nd hour (abs.) | NA | 0 | 0 | 0 | 0 | 0.195 | 0 | |||||||||
| 3rd hour (abs.) | NA | 0 | 0 | 0 | 0 | 0 | ||||||||||
| 4th hour (abs.) | NA | 0 | 0 | 0 | 0 | |||||||||||
| 5th hour (abs.) | NA | 0 | 0 | 0 | ||||||||||||
| 6th hour (abs.) | NA | 0 | 0 | |||||||||||||
| 7th hour (abs.) | NA | 0 | ||||||||||||||
| Total (unjustified) | NA |
References
- Tawil, S.; Cougoureux, M. Revisiting Learning: The Treasure Within; Assessing the Influence of the 1996 Delors Report; UNESCO: Paris, France, 2013; ISBN 978-92-3-001132-1. Available online: https://unesdoc.unesco.org/ark:/48223/pf0000220050 (accessed on 1 February 2022).
- Kolyvas, G.; Kotsifakos, D.; Douligeris, C.; Modeling, C. Designing and implementing an open personalized learning environment for the electrical engineering training course in vocational education. Eur. J. Eng. Res. Sci. 2020. [Google Scholar] [CrossRef]
- Kotsifakos, D.; Kostis, B.; Douligeris, C. Science, technology, engineering, and mathematics (STEM) for vocational education in Greece. In Proceedings of the Global Engineering Education Conference (EDUCON), Athens, Greece, 25–28 April 2017; pp. 1831–1836. [Google Scholar]
- Thibert, R. Le décrochage scolaire: Diversité des approches, diversité des dispositive. In Dossier d’actualité; ENS de Lyon, Veille & Analyses IFÉ: Lyon, France, 2013; Volume 84. [Google Scholar]
- Lamonica, V.; Ragazzi, E.; Sella, L. Including adolescent migrants in school through VET approach: Evidence from a pilot action in Italy. Empir. Res. Vocat. Educ. Train. 2020, 12, 6. [Google Scholar] [CrossRef]
- Zikos, N. The phenomenon of early school leaving (ESL) in Greek educational system. Int. J. Soc. Sci. Econ. Res. 2020, 5, 2503–2513. [Google Scholar] [CrossRef]
- Tarabini, A.; Curran, M.; Montes, A.; Parcerisa, L. Can educational engagement prevent Early School Leaving? Unpacking the school’s effect on educational success. Educ. Stud. 2018, 45, 1–16. [Google Scholar] [CrossRef]
- UNESCO UIS. 2019. Available online: https://en.unesco.org/news/unesco-warns-without-urgent-action-12-million-children-will-never-spend-day-school-0 (accessed on 1 February 2022).
- Eurostat. Statistics Explained. Early Leavers from Education and Training. 2019. Available online: https://ec.europa.eu/eurostat/statistics-explained/index.php/Early_leavers_from_education_and_training#Analysis_by_degree_of_urbanisation (accessed on 1 February 2022).
- Fura, B.; Wojnar, J.; Kasprzyk, B. Ranking and classification of EU countries regarding their levels of implementation of the Europe 2020 strategy. J. Clean. Prod. 2017, 165, 968–979. [Google Scholar] [CrossRef]
- Institute of Education Policy (IEP). Student Dropout in Greek Primary and Secondary Education. 2017. Available online: http://www.iep.edu.gr/images/IEP/EPISTIMONIKI_YPIRESIA/Paratiritirio/2017/2017-03-28_paratiritirio_epiteliki_synopsi.pdf (accessed on 1 February 2022).
- Lotsari, E.; Verykios, V.S.; Panagiotakopoulos, C.; Kalles, D. A learning analytics methodology for student profiling. In Artificial Intelligence: Methods and Applications; Likas, A., Blekas, K., Kalles, D., Eds.; Lecture Notes in Computer Science, 8445; Springer: Cham, Germany, 2014. [Google Scholar] [CrossRef]
- Kagklis, V.; Karatrantou, A.; Tantoula, M.; Panagiotakopoulos, C.T.; Verykios, V.S. A learning analytics methodology for detecting sentiment in student fora: A case study in distance education. Eur. J. Open Distance e-Learn. 2016, 18, 74–94. [Google Scholar] [CrossRef]
- Gkontzis, A.; Kotsiantis, S.; Tsoni, R.; Verykios, V. An effective LA approach to predict student achievement. In Proceedings of the 22nd Pan-Hellenic Conference on Informatics, Athens, Greece, 29 November–1 December 2018; pp. 76–81. [Google Scholar] [CrossRef]
- Gkontzis, A.F.; Kontsiantis, S.; Kalles, D.; Panagiotakopoulos, C.T.; Verykios, V.S. Polarity, emotions, and online activity of students and tutors as features in predicting grades. Intell. Decis. Technol. 2020, 14, 409–436. [Google Scholar] [CrossRef]
- Tsoni, R.; Sakkopoulos, E.; Panagiotakopoulos, C.T.; Verykios, S.V. On the equivalence between bimodal and unimodal students’ collaboration networks in Distance Learning. Intell. Decis. Technol. 2021, 15, 305–319. [Google Scholar] [CrossRef]
- Gedrimiene, E.; Silvola, A.; Pursiainen, J.; Rusanen, J.; Muukkonen, H. Learning analytics in education: Literature review and case examples from vocational education. Scand. J. Educ. Res. 2019, 64, 1105–1119. [Google Scholar] [CrossRef]
- Tlili, A.; Essalmi, F.; Jemni, M.; Kinshuk; Chen, N. A complete validated learning analytics framework: Designing issues from data preparation perspective. Int. J. Inf. Commun. Technol. Educ. 2018, 14, 1–16. [Google Scholar] [CrossRef]
- Nurmalitasari; Awang Long, Z.; Faizuddin Mohd Noor, M. Data preparation in predictive learning analytics (PLA) for student dropout. Int. J. Innov. Technol. Explor. Eng. 2020, 9, 116–120. [Google Scholar] [CrossRef]
- Grasso, V.F. Early Warning Systems: State-of-Art Analysis and Future Directions; Draft Report United Nations Environment Programme (UNEP); United Nations: New York, NY, USA, 2009; pp. 1–66. [Google Scholar]
- Márquez-Vera, C.; Cano, A.; Romero, C.; Noaman, A.Y.M.; Mousa Fardoun, H.; Ventura, S. Early dropout prediction using data mining: A case study with high school students. Exp. Syst. 2016, 33, 107–124. [Google Scholar] [CrossRef]
- Greek Ministry of Education. Strategic Policy Framework for the Reduction of Early School Leaving in Greece. 2015. Available online: https://www.minedu.gov.gr/publications/docs2015/14.%CE%A3%CF%87%CE%AD%CE%B4%CE%B9%CE%BF_%CE%94%CF%81%CE%AC%CF%83%CE%B7%CF%82_%CE%A0%CE%95%CE%A3_2014-2020.pdf (accessed on 1 February 2022).
- Esch, P.; Bocquet, V.; Pull, C.; Couffignal, S.; Lehnert, T.; Graas, M.; Ansseau, M. The downward spiral of mental disorders and educational attainment: A systematic review on early school leaving. BMC Psychiatry 2014, 14, 237. [Google Scholar] [CrossRef]
- Szabó, C.M. Causes of early school leaving in secondary education. J. Appl. Tech. Educ. Sci. 2018, 8, 54–76. [Google Scholar] [CrossRef]
- Melkevik, O.; Nilsen, W.; Evensen, M.; Reneflot, A.; Mykletun, A. Internalizing disorders as risk factors for early school leaving: A systematic review. Adolesc. Res. Rev. 2016, 1, 245–255. [Google Scholar] [CrossRef]
- Amor, Y.B.; Dowden, J.; Borh, K.J.; Castro, E.; Goel, N. The chronic absenteeism assessment project: Using biometrics to evaluate the magnitude of and reasons for student chronic absenteeism in rural India. Int. J. Educ. Dev. 2020, 72, 102140. [Google Scholar] [CrossRef]
- Hippe, R.; Jakubowski, M. Immigrant Background and Expected Early School Leaving in Europe: Evidence from PISA; EUR 28866 EN; Publications Office of the European Union: Luxembourg, 2018; ISBN 978-92-79-76328-1. [Google Scholar]
- Gubbels, J.; Van der Put, C.E.; Assink, M. Risk factors for school absenteeism and dropout: A meta-analytic review. J. Youth Adolesc. 2019, 48, 1637–1667. [Google Scholar] [CrossRef]
- De Witte, K.; Csillag, M. Does anybody notice? On the impact of improved truancy reporting on school dropout. Educ. Econ. 2014, 22, 549–568. [Google Scholar] [CrossRef]
- Bembich, C. Social network learning analytics: Identification of students at risk of early school leaving. Ital. J. Educ. Res. 2019, 174–186. [Google Scholar]
- Traag, T.; Van Der Velden, R.K.W. Early school-leaving in The Netherlands: The role of family resources, school composition and background characteristics in early school-leaving in lower secondary education. Irish Educ. Stud. 2011, 30, 45–62. [Google Scholar] [CrossRef]
- Fornander, M.J.; Kearney, C.A. Family environment variables as predictors of school absenteeism severity at multiple levels: Ensemble and classification and regression tree analysis. Front. Psychol. 2019, 10, 2381. [Google Scholar] [CrossRef]
- Lyche, C. Taking on the Completion Challenge: A Literature Review on Policies to Prevent Dropout and Early School Leaving; OECD Education Working Papers No. 53; OECD Publishing: Paris, France, 2010. [Google Scholar] [CrossRef]
- Nikolaou, S.M.; Papa, M.; Gogou, L. Early school leaving in Greece and Europe and educational inequality: Actions and policies against educational and social exclusion. Eur. J. Soc. Sci. Educ. Res. 2018, 5, 212–220. [Google Scholar] [CrossRef][Green Version]
- Tomcsik, D.; Joksimovic, J.; Juhász, J.; Mihályi, K. Early Warning Systems in Six European Countries; Tempus Közalapítvány: Budapest, Hungary, 2014; Available online: https://cpi.si/wp-content/uploads/2020/08/12-Sistemi-zgodnjega-opozarjanja-v-EU-EN.pdf (accessed on 1 February 2022).
- Lykourentzou, I.; Giannoukos, I.; Nikolopoulos, V.; Mpardis, G.; Loumos, V. Dropout prediction in e-learning courses through the combination of machine learning techniques. Comput. Educ. 2009, 53, 950–965. [Google Scholar] [CrossRef]
- Mubarak, A.A.; Cao, H.; Zhang, W. Prediction of students’ early dropout based on their interaction logs in the online learning environment. Interact. Learn. Environ. 2020, 28, 1–20. [Google Scholar] [CrossRef]
- Gkontzis, A.F.; Kotsiantis, S.; Panagiotakopoulos, C.T.; Verykios, V.S. A predictive analytics framework as a countermeasure for attrition of students. Interact. Learn. Environ. 2019, 27, 1–16. [Google Scholar] [CrossRef]
- Delis, V.; Papaioannou, I.; Valeontis, E.; Kalaitzis, D.; Giannakopoulos, C.; Voukelatos, M. Experiences from the development of the Greek school profiling system. In Proceedings of the 12th European Conference on eGovernment, Barcelona, Spain, 14–15 June 2012; p. 186. [Google Scholar]
- Eurostat. Region of Anatoliki Makedonia. 2019. Available online: https://ec.europa.eu/eurostat/documents/2995521/9618249/1-26022019-AP-EN.pdf/f765d183-c3d2-4e2f-9256-cc6665909c80 (accessed on 1 February 2022).
- Kolinsky, R.; Gabriel, R.; Demoulin, C.; Gregory, M.M.; De Carvalho, K.S.; Morais, J. The influence of age, schooling, literacy, and socioeconomic status on serial-order memory. J. Cult. Cogn. Sci. 2020, 4, 343–365. [Google Scholar] [CrossRef]
- Jianmin, W.; Wenbin, Z.; Tongrang, F.; Shilong, Y.; Hongwei, L. An improved join-free snowflake schema for ETL and OLAP of data warehouse. Concurr. Comput. Pr. Exp. 2020, 32, e5519. [Google Scholar] [CrossRef]
- Karagiannis, A.; Vassiliadis, P.; Simitsis, A. Scheduling strategies for efficient ETL execution. Inf. Syst. 2013, 38, 927–945. [Google Scholar] [CrossRef]
- Vassiliadis, P.; Marcel, P.; Rizzi, S. Beyond roll-up’s and drill-down’s: An intentional analytics model to reinvent OLAP. Inf. Syst. 2019, 85, 68–91. [Google Scholar] [CrossRef]
- Tsiatas, G.C.; Kotsiantis, S.; Charalampakis, A.E. Predicting the response of laminated composite beams: A comparison of machine learning algorithms. Front. Built Environ. 2022, 8, 855112. [Google Scholar] [CrossRef]
- Sara, N.-B.; Halland, R.; Igel, C.; Alstrup, S. High-school dropout prediction using machine learning: A Danish large-scale study. In Proceedings of the European Symposium on Artificial Neural Networks, Computational Intelligence, and Machine Learning, Bruges, Belgium, 22–24 April 2015; pp. 319–324. [Google Scholar]
- Do Nascimento, R.L.; Fagundes, R.A.D.A.; De Souza, R.M. Statistical learning for predicting school dropout in elementary education: A comparative study. Ann. Data Sci. 2021, 9, 801–828. [Google Scholar] [CrossRef]
Publisher’s Note: MDPI stays neutral with regard to jurisdictional claims in published maps and institutional affiliations. |
© 2022 by the authors. Licensee MDPI, Basel, Switzerland. This article is an open access article distributed under the terms and conditions of the Creative Commons Attribution (CC BY) license (https://creativecommons.org/licenses/by/4.0/).