
The Effect of Side Wall Cutout Sizes on Corrugated Box Compression Strength in the Function of Length-to-Width Ratios—An Experimental Study


Abstract
:1. Introduction
- Kraftliner, which contains only primary cellulose fibers;
- Testliner or duplex, which contains partly primary fiber and partly recycled secondary fiber;
- Srenc, which contains only secondary fibers or fibers from other waste paper processing in which contaminants are unavoidably introduced during processing (e.g., plastic residues, ink residues, etc.).
- Fluting, which contains primary fibers with low fiber length and density;
- Wellenstoff, which is practically identical to the base material of srenc but contains additives that make it suitable for corrugating technology.
- Tab-like cutouts used to grip the box;
- Ventilation openings, mainly used to increase the shelf life of agricultural products (vegetables, fruit);
- Products requiring cold storage;
- Window-like cutouts to identify and view the product (e.g., to read the product’s barcode or QR code);
- Creating window-like cutouts to reduce the amount of corrugated cardboard used.
2. Materials and Methods
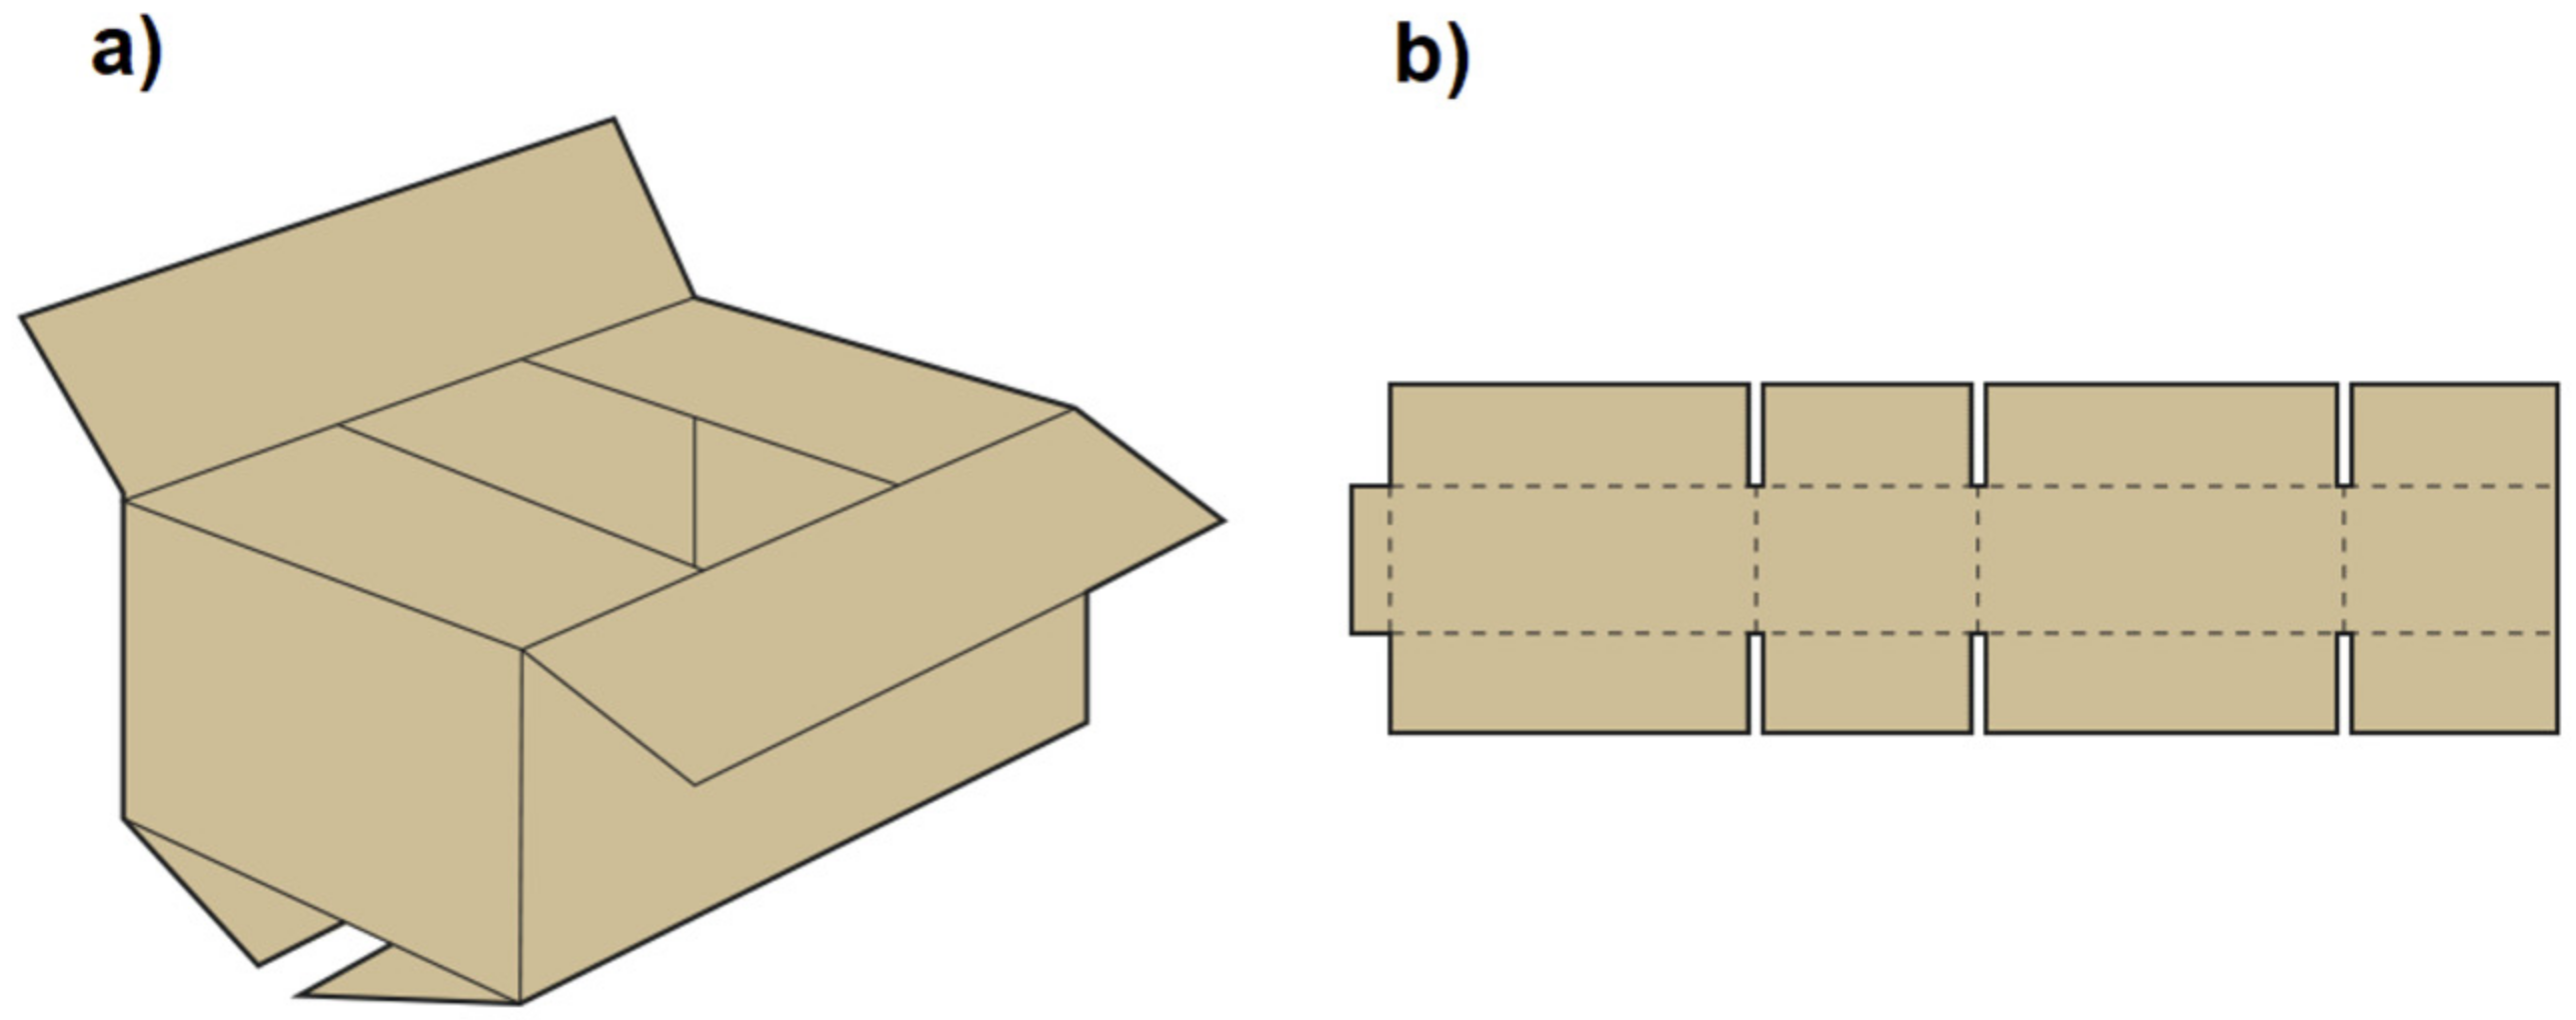
2.1. Sample Design and Geometrical Sizes
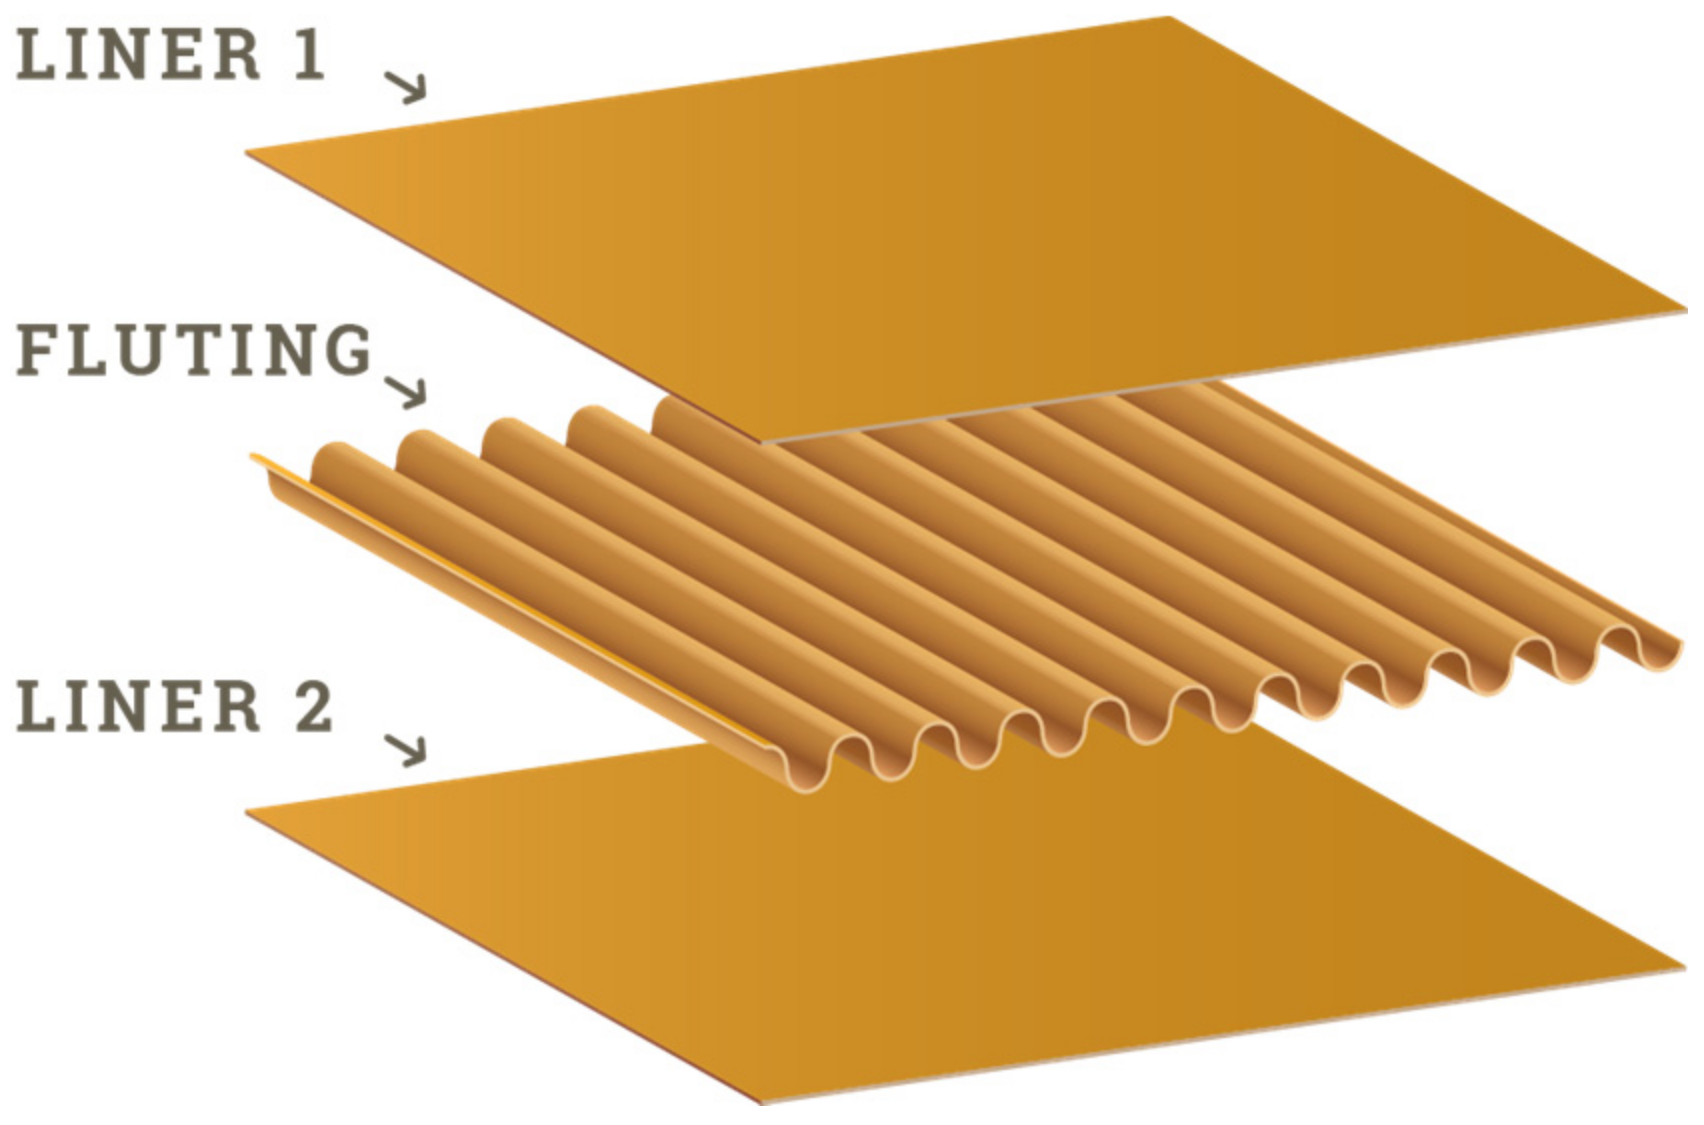
- Number of layers: three (single wall design);
- Parts of the corrugated cardboard material:
- ○
- Outer liner: 210 GD2 (weight 210 g/m2, coated white lined chipboard with grey back, quality class 2);
- ○
- Fluting medium: 120 HC (weight 120 g/m2, high-compression wellenstoff);
- ○
- Inner liner: 130 TL 3 (weight 130 g/m2, Testliner, quality class 3).
2.2. Experimental Design
2.3. Data Analysis
3. Results
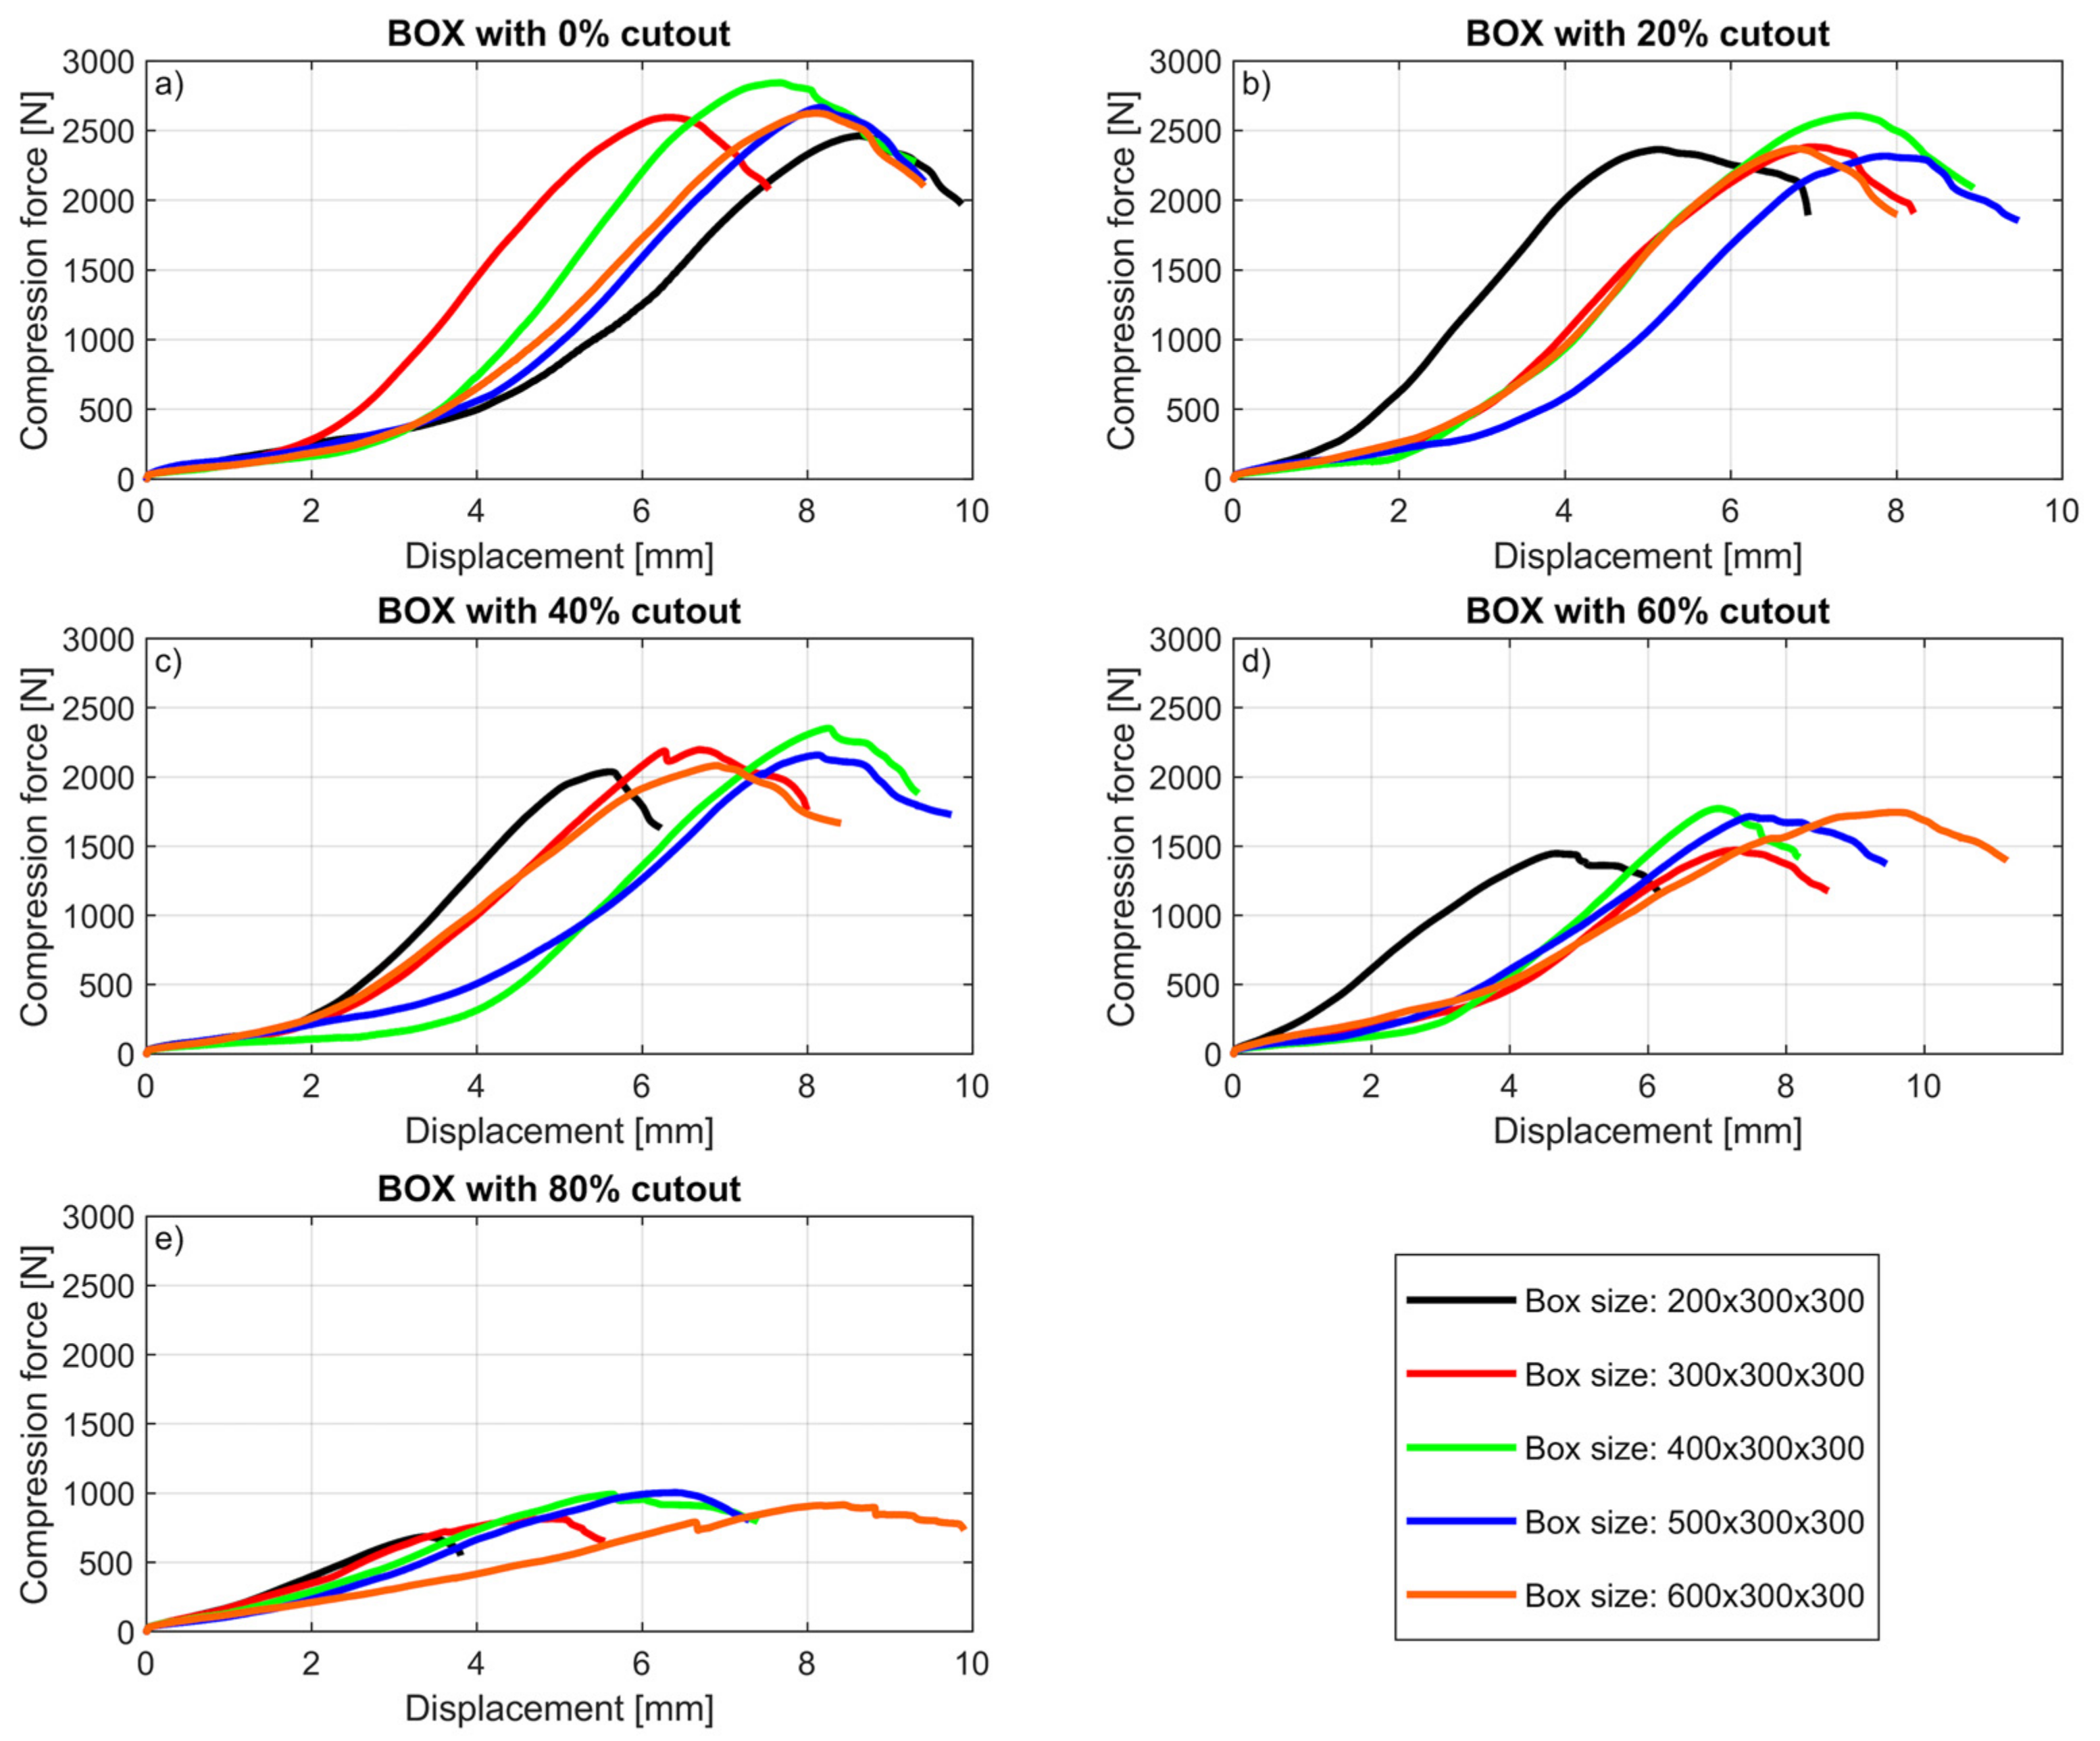
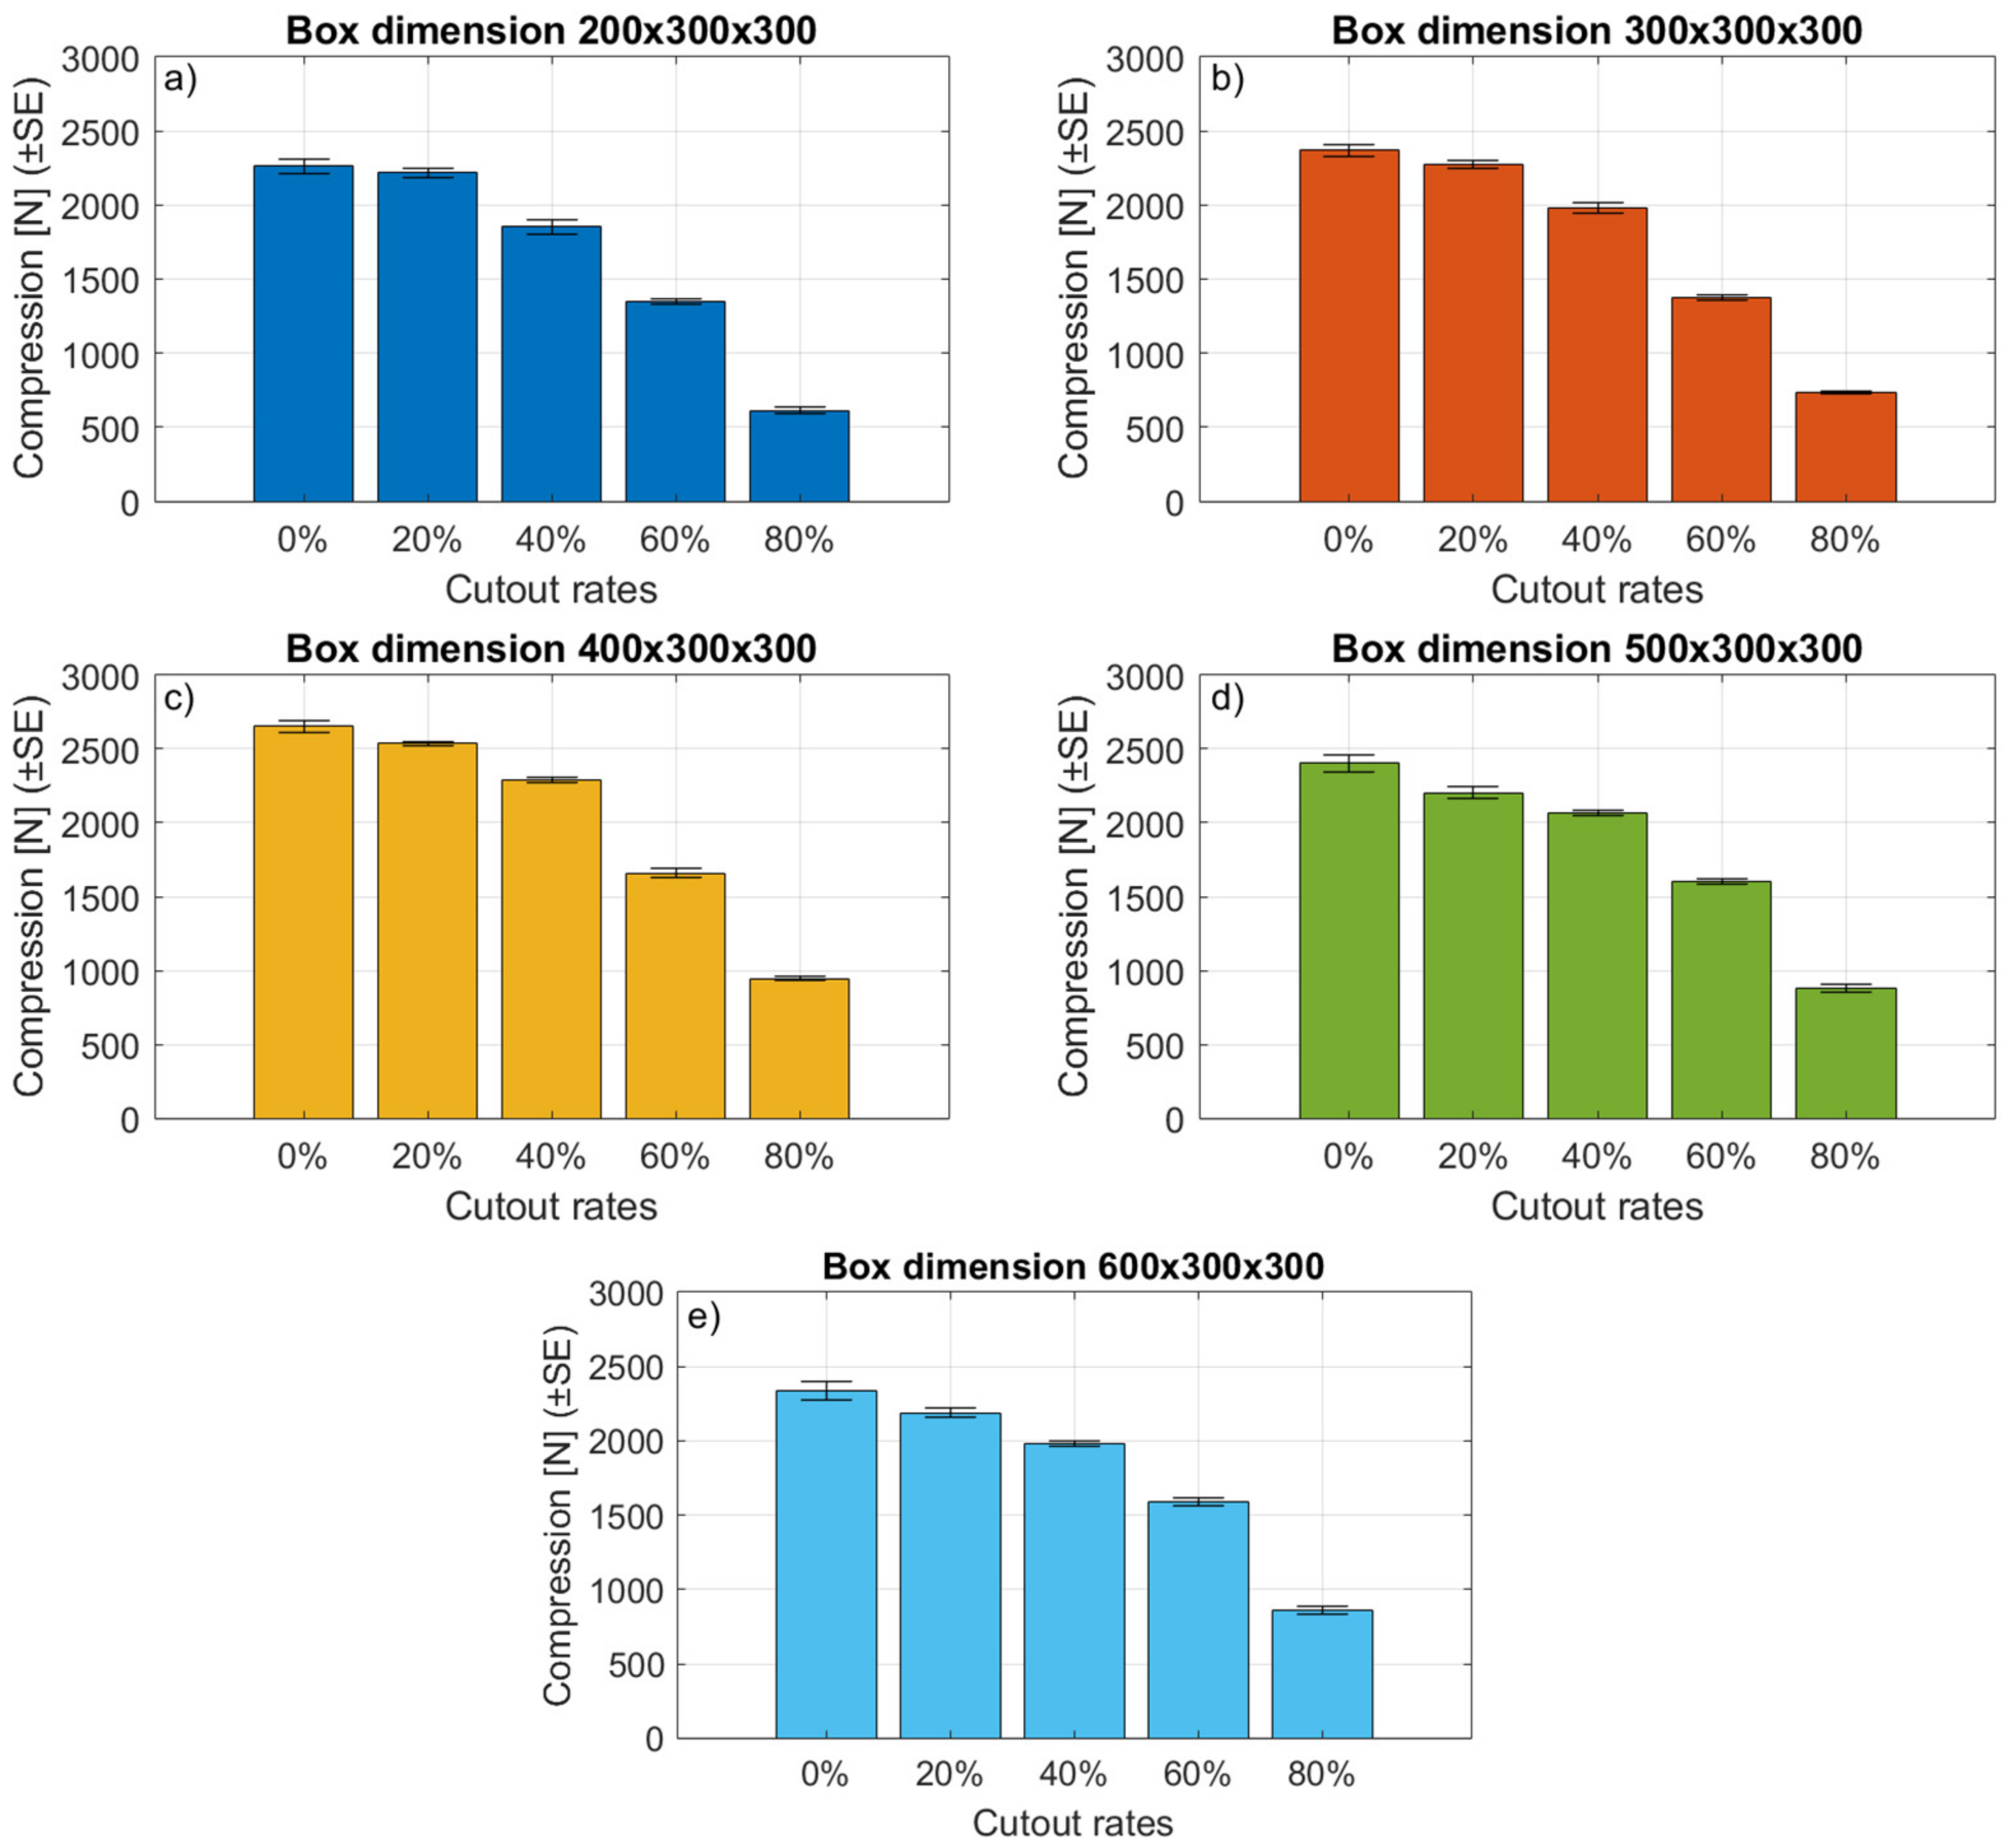
3.1. Results of the BCT Tests
3.2. ANOVA Analysis
4. Discussion
Limitations for Practice
- The applied experimental method for the data of this study uses only one B-flute corrugated cardboard quality, so the results can only show a narrow range of interest based on corrugated cardboard box area. In reality, boxes made of corrugated cardboard have an extremely wide range and variation, such as A, B, C and others, along with different flute-heights with variations in the numbers of layers; therefore, data from this study may be limited for general use but covers an important issue for possible materials reduction and packaging engineering design.
- In addition, there are some environmental conditions that significantly affect the possible box compression strength. It has been proven that the changes in temperature and relative humidity or the difference between the dynamic and static loads will affect the expected compression strength of the boxes. This study did not investigate these phenomena.
- Last but not least, the theoretical dynamics of compression strength require more experimental results with a varied selection of corrugated cardboard quality to show the exact correlation with compression strength in the function of the length-to-width ratio and cutout sizes together.
5. Conclusions
Author Contributions
Funding
Institutional Review Board Statement
Informed Consent Statement
Data Availability Statement
Acknowledgments
Conflicts of Interest
References
- Fadiji, T.; Coetzee, C.; Opara, U.L. Compression strength of ventilated corrugated paperboard packages: Numerical modelling, experimental validation and effects of vent geometric design. Biosyst. Eng. 2016, 151, 231–247. [Google Scholar] [CrossRef]
- Fadiji, T.; Berry, T.; Coetzee, C.; Opara, U.L. Investigating the mechanical properties of paperboard packaging material for handling fresh produce under different environmental conditions: Experimental analysis and finite element modelling. J. Appl. Packag. Res. 2017, 9, 20–34. [Google Scholar]
- Opara, U.L.; Fadiji, T. Compression damage susceptibility of apple fruit packed inside ventilated corrugated paperboard package. Sci. Hortic. 2018, 227, 154–161. [Google Scholar] [CrossRef]
- Fadiji, T.; Coetzee, C.; Chen, L.; Chukwu, O.; Opara, U.L. Susceptibility of apples to bruising inside ventilated corrugated paperboard packages during simulated transport damage. Postharvest Biol. Technol. 2016, 118, 111–119. [Google Scholar] [CrossRef]
- Fadiji, T.; Coetzee, C.; Pathare, P.; Opara, U.L. Susceptibility to impact damage of apples inside ventilated corrugated paperboard packages: Effects of package design. Postharvest Biol. Technol. 2016, 111, 286–296. [Google Scholar] [CrossRef]
- Marsh, K.; Bugusu, B. Food packaging—Roles, materials, and environmental issues. J. Food Sci. 2007, 72, R39–R55. [Google Scholar] [CrossRef]
- Singh, S.P.; Singh, J.; Paek, Y. New pressure sensitive device to measure and predict package drops. J. Appl. Packag. Res. 2009, 3, 149–160. [Google Scholar]
- Beldie, L.; Sandberg, G.; Sandberg, L. Paperboard packages exposed to static loads–finite element modelling and experiments. Packag. Technol. Sci. 2001, 14, 171–178. [Google Scholar] [CrossRef]
- Lu, F.; Ishikawa, Y.; Kitazawa, H.; Satake, T. Measurement of impact pressure and bruising of apple fruit using pressure-sensitive film technique. J. Food Eng. 2010, 96, 614–620. [Google Scholar] [CrossRef] [Green Version]
- Lu, F.; Ishikawa, Y.; Kitazawa, H.; Satake, T. Assessment and prediction of repetitive impact damage to apple fruit using pressure-sensitive film technique. J. Food Agric. Environ. 2012, 10, 156–160. [Google Scholar]
- Pathare, P.B.; Opara, U.L. Structural design of corrugated boxes for horticultural produce: A review. Biosyst. Eng. 2014, 125, 128–140. [Google Scholar] [CrossRef]
- Fadiji, T.; Berry, T.M.; Coetzee, C.J.; Opara, U.L. Mechanical design and performance testing of corrugated paperboard packaging for the postharvest handling of horticultural produce. Biosyst. Eng. 2018, 171, 220–244. [Google Scholar] [CrossRef]
- Talbi, N.; Batti, A.; Ayad, R.; Guo, Y.Q. An analytical homogenization model for finite element modelling of corrugated cardboard. Compos. Struct. 2009, 88, 280–289. [Google Scholar] [CrossRef]
- FEFCO Code. Design Style Library for Corrugated, Board Products, 12th ed.; FEFCO: Brussels, Belgium, 2022; Available online: https://www.fefco.org/sites/default/files/files/2022–04–21_FEFCO%20Code_WEB_unprotected.pdf (accessed on 14 June 2022).
- Garbowski, T.; Gajewski, T.; Grabski, J.K. The role of buckling in the estimation of compressive strength of corrugated cardboard boxes. Materials 2020, 13, 4578. [Google Scholar] [CrossRef]
- Garbowski, T.; Gajewski, T.; Grabski, J.K. Role of transverse shear modulus in the performance of corrugated materials. Materials 2020, 13, 3791. [Google Scholar] [CrossRef]
- Garbowski, T.; Gajewski, T.; Grabski, J.K. Torsional and transversal stiffness of orthotropic sandwich panels. Materials 2020, 13, 5016. [Google Scholar] [CrossRef]
- Bartolozzi, G.; Pierini, M.; Orrenius, U.L.F.; Baldanzini, N. An equivalent material formulation for sinusoidal corrugated cores of structural sandwich panels. Compos. Struct. 2013, 100, 173–185. [Google Scholar] [CrossRef]
- Biancolini, M.E.; Brutti, C.; Mottola, E.; Porziani, S. Numerical Evaluation of Buckling and Post-Buckling Behaviour of Corrugated Board Containers. Presented at the XXXIV Convegno Nazionale Associazione Italiana Per L’Analisi Delle Sollecitazioni. Presented at the XXXIV Convegno Nazionale Associazione Italiana Per L’Analisi Delle Sollecitazioni, Milan, Italy, 14–17 September; 14–17 September 2005. [Google Scholar]
- Defraeye, T.; Cronje, P.; Berry, T.; Opara, U.L.; East, A.; Hertog, M.; Verbovenc, P.; Nicolaich, B. Towards integrated performance evaluation of future packaging for fresh produce in the cold chain. Trends Food Sci. Technol. 2015, 44, 201–225. [Google Scholar] [CrossRef]
- Zaghloul, M.M.Y.; Mohamed, Y.S.; El-Gamal, H. Fatigue and tensile behaviors of fiber-reinforced thermosetting composites embedded with nanoparticles. J. Compos. Mater. 2019, 53, 709–718. [Google Scholar] [CrossRef]
- McKee, R.C.; Gander, J.W.; Wachuta, J.R. Compression strength formula for corrugated boxes. Paperboard Packag. 1963, 48, 149–159. [Google Scholar]
- Kellicutt, K.; Landt, E. Development of design data for corrugated fiberboard shipping containers. Tappi. J. 1952, 35, 398–402. [Google Scholar]
- Biancolini, B.M.E.; Brutti, C. Numerical and experimental investigation of the strength of corrugated board packages. Packag. Technol. Sci. 2003, 16, 47–60. [Google Scholar] [CrossRef]
- Han, J.; Park, J.M. Finite element analysis of vent/hand hole designs for corrugated fibreboard boxes. Packag. Technol. Sci. 2007, 20, 39–47. [Google Scholar] [CrossRef]
- Singh, J.; Olsen, E.; Singh, S.P.; Manley, J.; Wallace, F. The effect of ventilation, and hand holes on loss of compression strength in corrugated boxes. J. Appl. Packag. Res. 2008, 2, 227–238. [Google Scholar]
- Fadiji, T.; Coetzee, C.J.; Berry, T.M.; Opara, U.L. Investigating the role of geometrical configurations of ventilated fresh produce packaging to improve the mechanical strength–Experimental and numerical approaches. Food Packag. Shelf Life 2019, 20, 100–312. [Google Scholar] [CrossRef]
- Fadiji, T.; Coetzee, C.J.; Opara, U.L. Analysis of the creep behaviour of ventilated corrugated paperboard packaging for handling fresh produce—An experimental study. Food Bioprod. Process. 2019, 117, 126–137. [Google Scholar] [CrossRef]
- Czechowski, L.; Kmita-Fudalej, G.; Szewczyk, W.; Gralewski, J.; Bienkowska, M. Numerical and experimental study of five-layer non-symmetrical paperboard panel stiffness. Materials 2021, 14, 7453. [Google Scholar] [CrossRef]
- Berry, T.M.; Defraeye, T.; Shrivastava, C.; Ambaw, A.; Coetzee, C.; Opara, U.L. Designing ventilated packaging for the fresh produce cold chain. Food Bioprod. Process. 2022, 134, 121–149. [Google Scholar] [CrossRef]
- Archaviboonyobul, T.; Chaveesuk, R.; Singh, J.; Jinkarn, T. An analysis of the influence of hand hole and ventilation hole design on compressive strength of corrugated fiberboard boxes by an artificial neural network model. Packag. Technol. Sci. 2020, 33, 171–181. [Google Scholar] [CrossRef]
- Garbowski, T.; Gajewski, T.; Grabski, J.K. Estimation of the compressive strength of corrugated cardboard boxes with various openings. Energies 2020, 14, 155. [Google Scholar] [CrossRef]
- Wei, Z.; Hua, G.J.; Zhao, D.J. Testing Research of Aspect Ratio on Corrugated Box Compression Strength. In Applied Mechanics and Materials; Trans Tech Publications Ltd.: Bach, Switzerland , 2011; Volume 48, pp. Volume 1213–1216. [Google Scholar] [CrossRef]
- Ambaw, A.; Fadiji, T.; Opara, U.L. Thermo-mechanical analysis in the fresh fruit cold chain: A review on recent advances. Foods 2021, 10, 1357. [Google Scholar] [CrossRef] [PubMed]
- ASTM D4332–01; Standard Practice for Conditioning Containers, Packages, or Packaging Components for Testing. American Society of Testing and Materials International: West Conshohocken, PA, USA, 2006.
- ASTM ASTM D642; Standard Test Method for Determining Compressive Resistance of Shipping Containers, Components, and Unit Loads. American Society of Testing and Materials International: West Conshohocken, PA, USA, 2010.


| Properties | Specification | Standard |
|---|---|---|
| Board Thickness | 2.8 mm (±10%) | ISO 3034 (FEFCO no.3) |
| Grammage | 512 g/m2 (±10%) | ISO 536:1995 |
| Edge Crush Test (ECT) | 5.1 kN/m (±15%) | ISO 3037 (FEFCO no.8) |
| Bursting Strength (BST) | 676 kPa (±15%) | ISO 2759 (FEFCO no.4) |
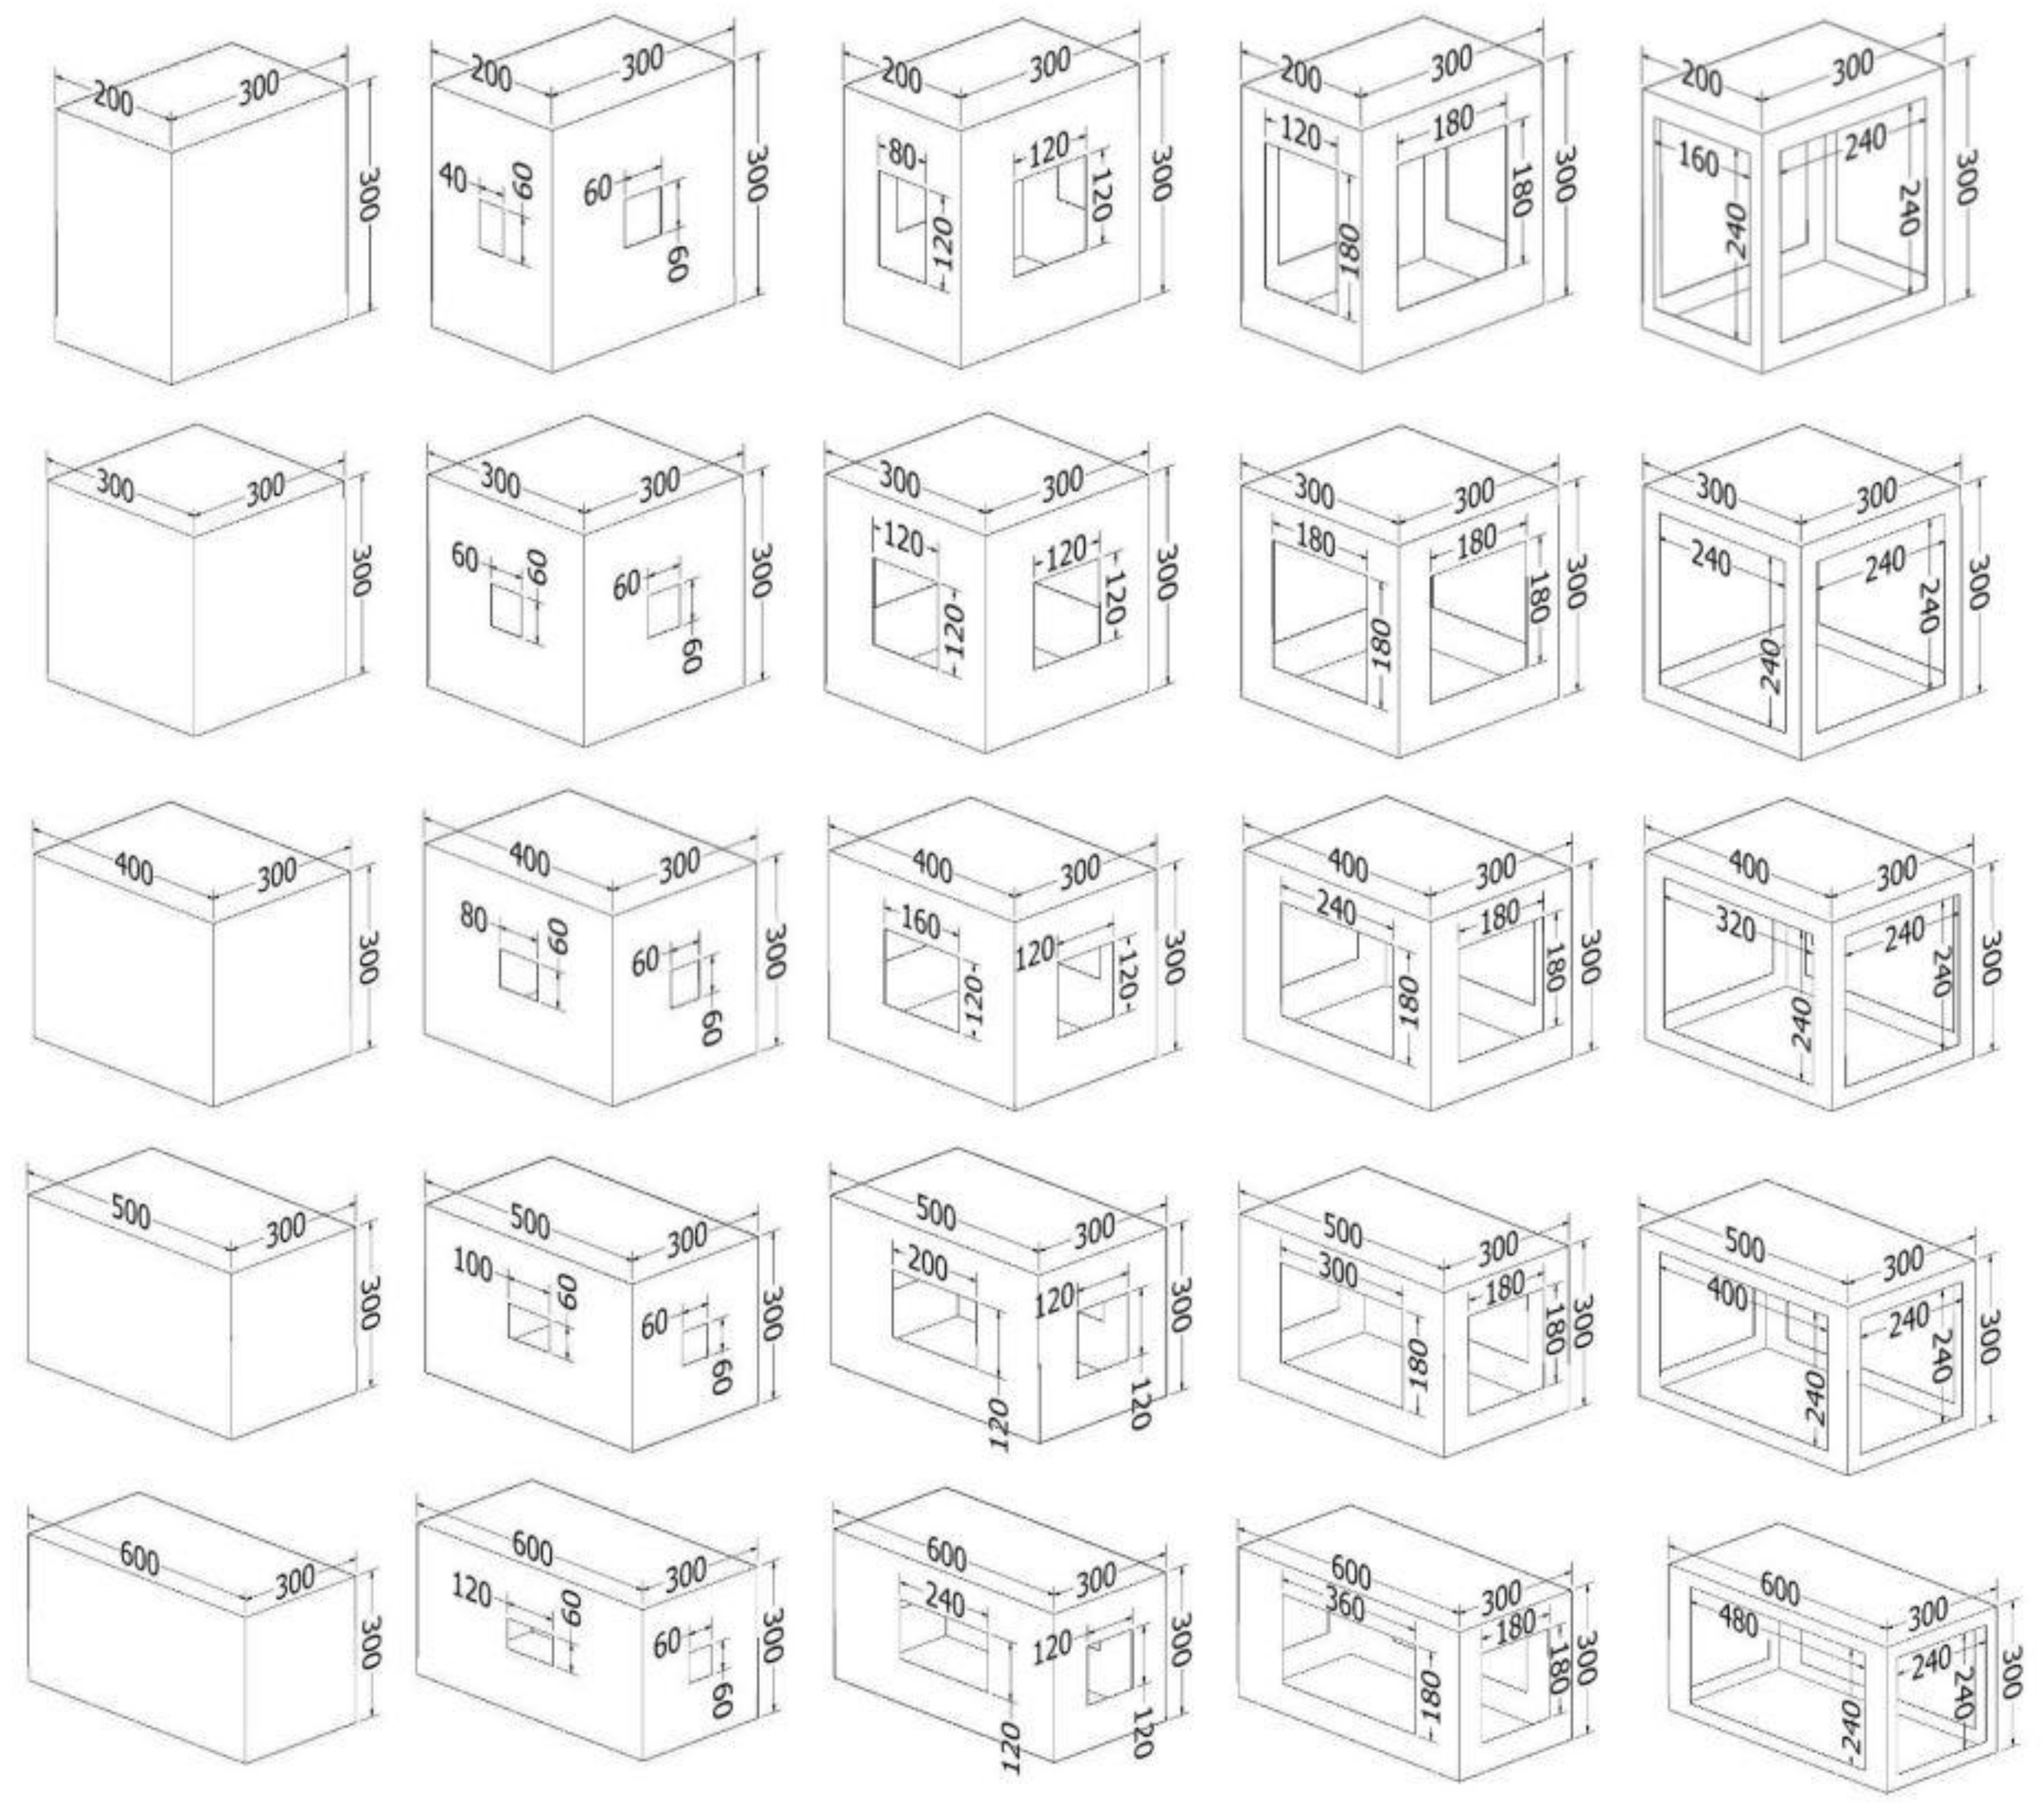
| Length (mm) | Perimeter (mm) | Area without Top and Bottom (mm2) | Cutout Rates(%) | Sizes of Cutouts (mm) |
|---|---|---|---|---|
| 200 | 1000 | 300,000 | 0 | - |
| 20 | 40 × 60/60 × 60 | |||
| 40 | 80 × 120/120 × 120 | |||
| 60 | 120 × 180/180 × 180 | |||
| 80 | 160 × 240/240 × 240 | |||
| 300 | 1200 | 360,000 | 0 | - |
| 20 | 60 × 60/60 × 60 | |||
| 40 | 120 × 120/120 × 120 | |||
| 60 | 180 × 180/180 × 180 | |||
| 80 | 240 × 240/240 × 240 | |||
| 400 | 1400 | 420,000 | 0 | - |
| 20 | 80 × 60/60 × 60 | |||
| 40 | 160 × 120/120 × 120 | |||
| 60 | 240 × 180/180 × 180 | |||
| 80 | 320 × 240/240 × 240 | |||
| 500 | 1600 | 480,000 | 0 | - |
| 20 | 100 × 60/60 × 60 | |||
| 40 | 200 × 120/120 × 120 | |||
| 60 | 300 × 180/180 × 180 | |||
| 80 | 400 × 240/240 × 240 | |||
| 600 | 1800 | 540,000 | 0 | - |
| 20 | 120 × 60/60 × 60 | |||
| 40 | 240 × 120/120 × 120 | |||
| 60 | 360 × 180/180 × 180 | |||
| 80 | 480 × 240/240 × 240 |
| Length (mm) | Width (mm) | Length-to-Width Ratio | Cutout(%) | Maximum Compression Force (N) | Average Compression Force (N) |
|---|---|---|---|---|---|
| 200 | 300 | 0.66 | 0 | 2461 | 2261 |
| 20 | 2364 | 2217 | |||
| 40 | 2037 | 1851 | |||
| 60 | 1447 | 1346 | |||
| 80 | 685 | 614 | |||
| 300 | 300 | 1 | 0 | 2594 | 2367 |
| 20 | 2382 | 2275 | |||
| 40 | 2197 | 1981 | |||
| 60 | 1470 | 1373 | |||
| 80 | 814 | 734 | |||
| 400 | 300 | 1.33 | 0 | 2842 | 2651 |
| 20 | 2608 | 2537 | |||
| 40 | 2351 | 2291 | |||
| 60 | 1771 | 1656 | |||
| 80 | 993 | 946 | |||
| 500 | 300 | 1.66 | 0 | 2666 | 2402 |
| 20 | 2316 | 2203 | |||
| 40 | 2158 | 2066 | |||
| 60 | 1713 | 1603 | |||
| 80 | 1003 | 877 | |||
| 600 | 300 | 2 | 0 | 2624 | 2339 |
| 20 | 2371 | 2189 | |||
| 40 | 2082 | 1980 | |||
| 60 | 1745 | 1591 | |||
| 80 | 915 | 862 |
Publisher’s Note: MDPI stays neutral with regard to jurisdictional claims in published maps and institutional affiliations. |
© 2022 by the authors. Licensee MDPI, Basel, Switzerland. This article is an open access article distributed under the terms and conditions of the Creative Commons Attribution (CC BY) license (https://creativecommons.org/licenses/by/4.0/).
Share and Cite
Pidl, R.; Fehér, L.; Böröcz, P. The Effect of Side Wall Cutout Sizes on Corrugated Box Compression Strength in the Function of Length-to-Width Ratios—An Experimental Study. Appl. Sci. 2022, 12, 6939. https://doi.org/10.3390/app12146939
Pidl R, Fehér L, Böröcz P. The Effect of Side Wall Cutout Sizes on Corrugated Box Compression Strength in the Function of Length-to-Width Ratios—An Experimental Study. Applied Sciences. 2022; 12(14):6939. https://doi.org/10.3390/app12146939
Chicago/Turabian StylePidl, Renáta, Lajos Fehér, and Péter Böröcz. 2022. "The Effect of Side Wall Cutout Sizes on Corrugated Box Compression Strength in the Function of Length-to-Width Ratios—An Experimental Study" Applied Sciences 12, no. 14: 6939. https://doi.org/10.3390/app12146939
APA StylePidl, R., Fehér, L., & Böröcz, P. (2022). The Effect of Side Wall Cutout Sizes on Corrugated Box Compression Strength in the Function of Length-to-Width Ratios—An Experimental Study. Applied Sciences, 12(14), 6939. https://doi.org/10.3390/app12146939