1. Introduction
Water shortages in hyper-arid regions such as southern Egypt are a serious concern for hydrologists, who should evaluate and protect every accessible water source. Water scarcity in these hyper-arid areas might affect a number of activities (including the economy and human life); as a consequence, different actions are needed to avert the expected disasters and conflicts that may develop as a result of insufficient water supplies [
1]. Groundwater is the second source of water used in agriculture, industry, and domestic applications [
2]. Groundwater flow models are used to analyze groundwater flow behavior and recharge in vast aquifers [
3], but these techniques might be challenging to implement due to a lack of datasets and the time and resources required to obtain them. For quantification of the groundwater storage changes on a regional scale, the gravity datasets from the Gravity Recovery and Climate Experiment mission, combined with other relevant information, have been extensively used in several study areas (e.g., [
4,
5,
6,
7,
8,
9,
10,
11,
12,
13]). Additionally, regional and global gravity and magnetic data are used to investigate heat flow in different regions [
14,
15].
Hydro-chemically, the groundwater is influenced by precipitation, geological structure, rock type, residence time, and geochemical activity along groundwater flow paths. In this sense, it is vital and necessary to study the mechanisms that alter groundwater and its chemistry via rock interactions. The term “water–rock interaction” refers to how groundwater interacts with the host rocks in a unique way that changes its chemical composition and properties [
16]. The primary interaction between groundwater and ambient rock formation results in minerals with unique hydrochemical compositions and stability dynamic features [
17]. Interaction mechanisms result in the creation of numerous dissolved element components in the aquifer, which can influence the groundwater quality, particularly in arid zones [
18,
19]. Furthermore, precipitation absorbed through the soil and sediments can dissolve carbonate minerals, such as calcite, aragonite, dolomite, and other minerals, in the flow path [
20,
21,
22].
The chemical interaction between water and rock is one of the most intriguing and intricate phenomena in water geochemistry. The composition of surface water and groundwater is determined by how water reacts to rocks and minerals. The chemical reactions of water–rock interaction at high temperatures are associated with hydrothermal features, hydrothermal mineral deposits, and geothermal fields. The surface outcrops of rocks from deeper levels of the crust, such as lower crustal and mantle exposures, typically reveal features produced by supercritical aqueous fluid interaction at extremely high temperatures. Many researchers have investigated the water–rock interaction [
17,
18,
19,
22,
23,
24,
25,
26].
The purpose of this research is to examine how the groundwater chemistry is affected by the lithologic nature and structural geology. The aforementioned aim is crucial for long-term groundwater development in hyper-arid environments. As a consequence, researchers identified the geology and geochemistry of water-bearing strata along the flow path to the analyzed aquifers. The location was chosen as an example from the hyper-arid zone to carry out this scientific approach. To interpret the hydrochemical data based on factor scores, statistical measures such as the saturation index (SI), principal component analysis (PCA), and hierarchical cluster analysis (HCA) were used [
27,
28]. The SI can be used to assess the flow of groundwater in aquifer systems [
29]. PCA and HCA are also used to assess the aquifer’s geochemical mineralization and groundwater contamination [
22,
30,
31]. PCA and HCA can also be used to describe how agricultural and mining operations affect groundwater [
32].
2. Material and Methods
2.1. Location
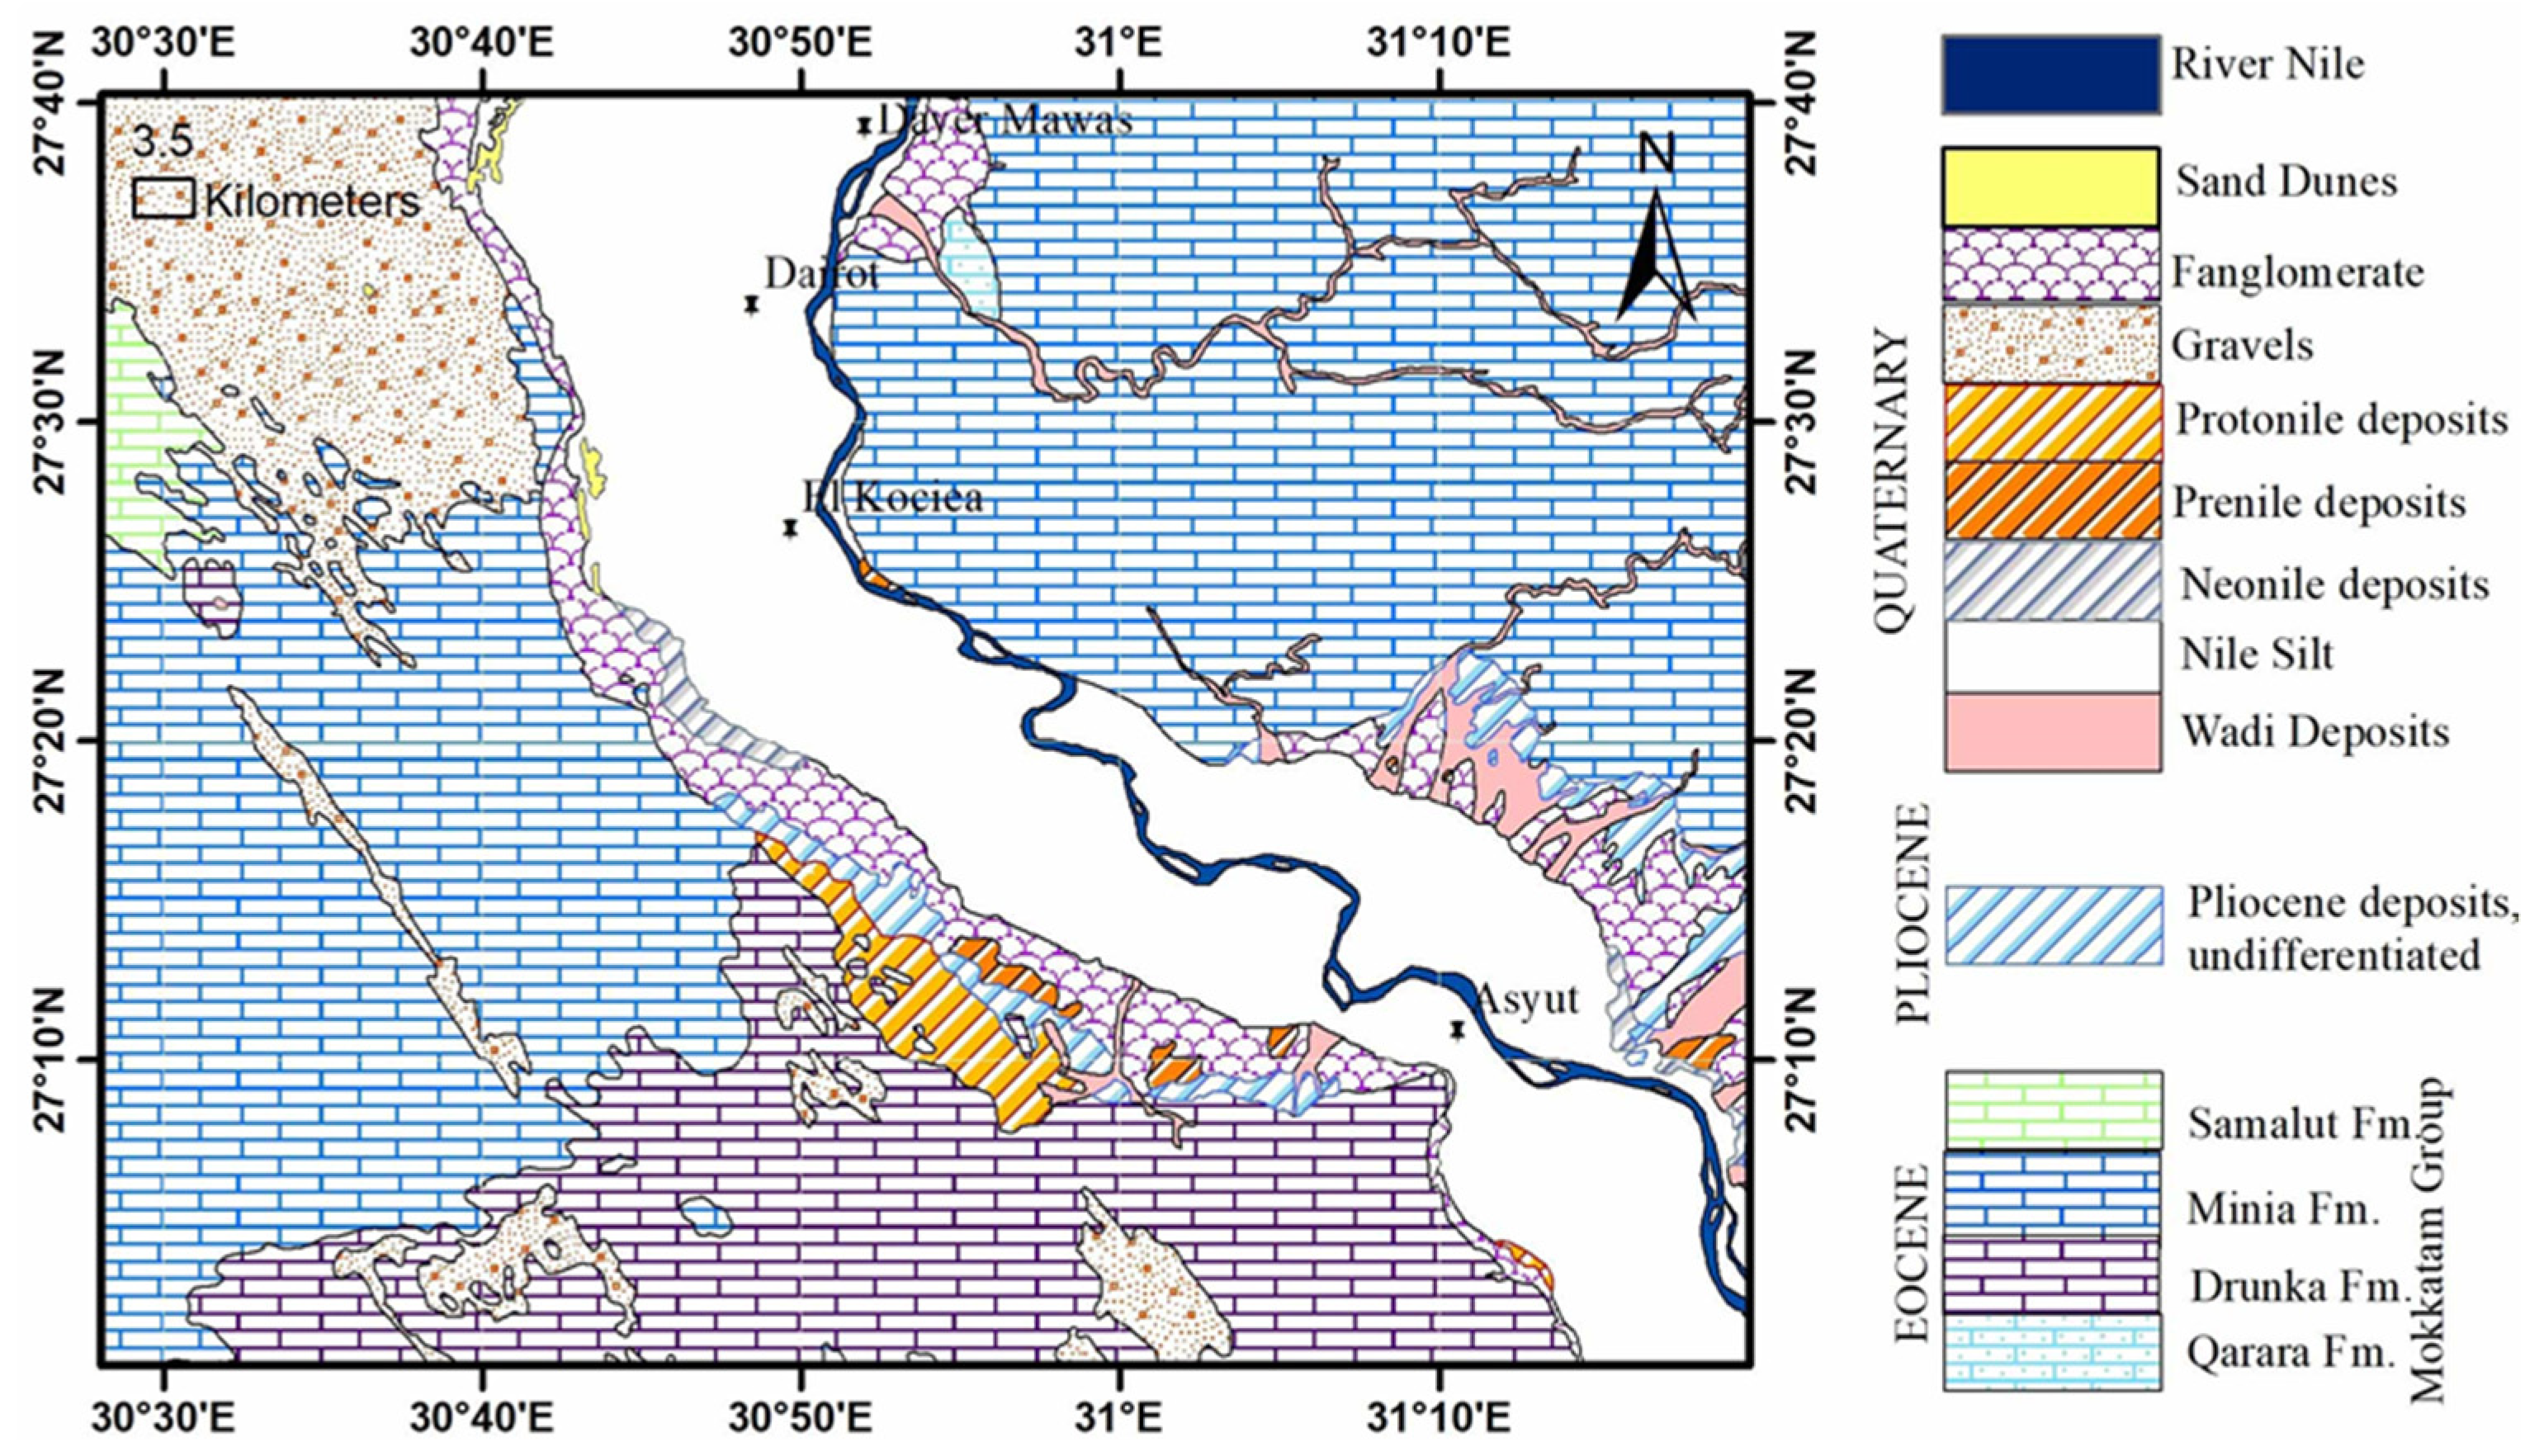
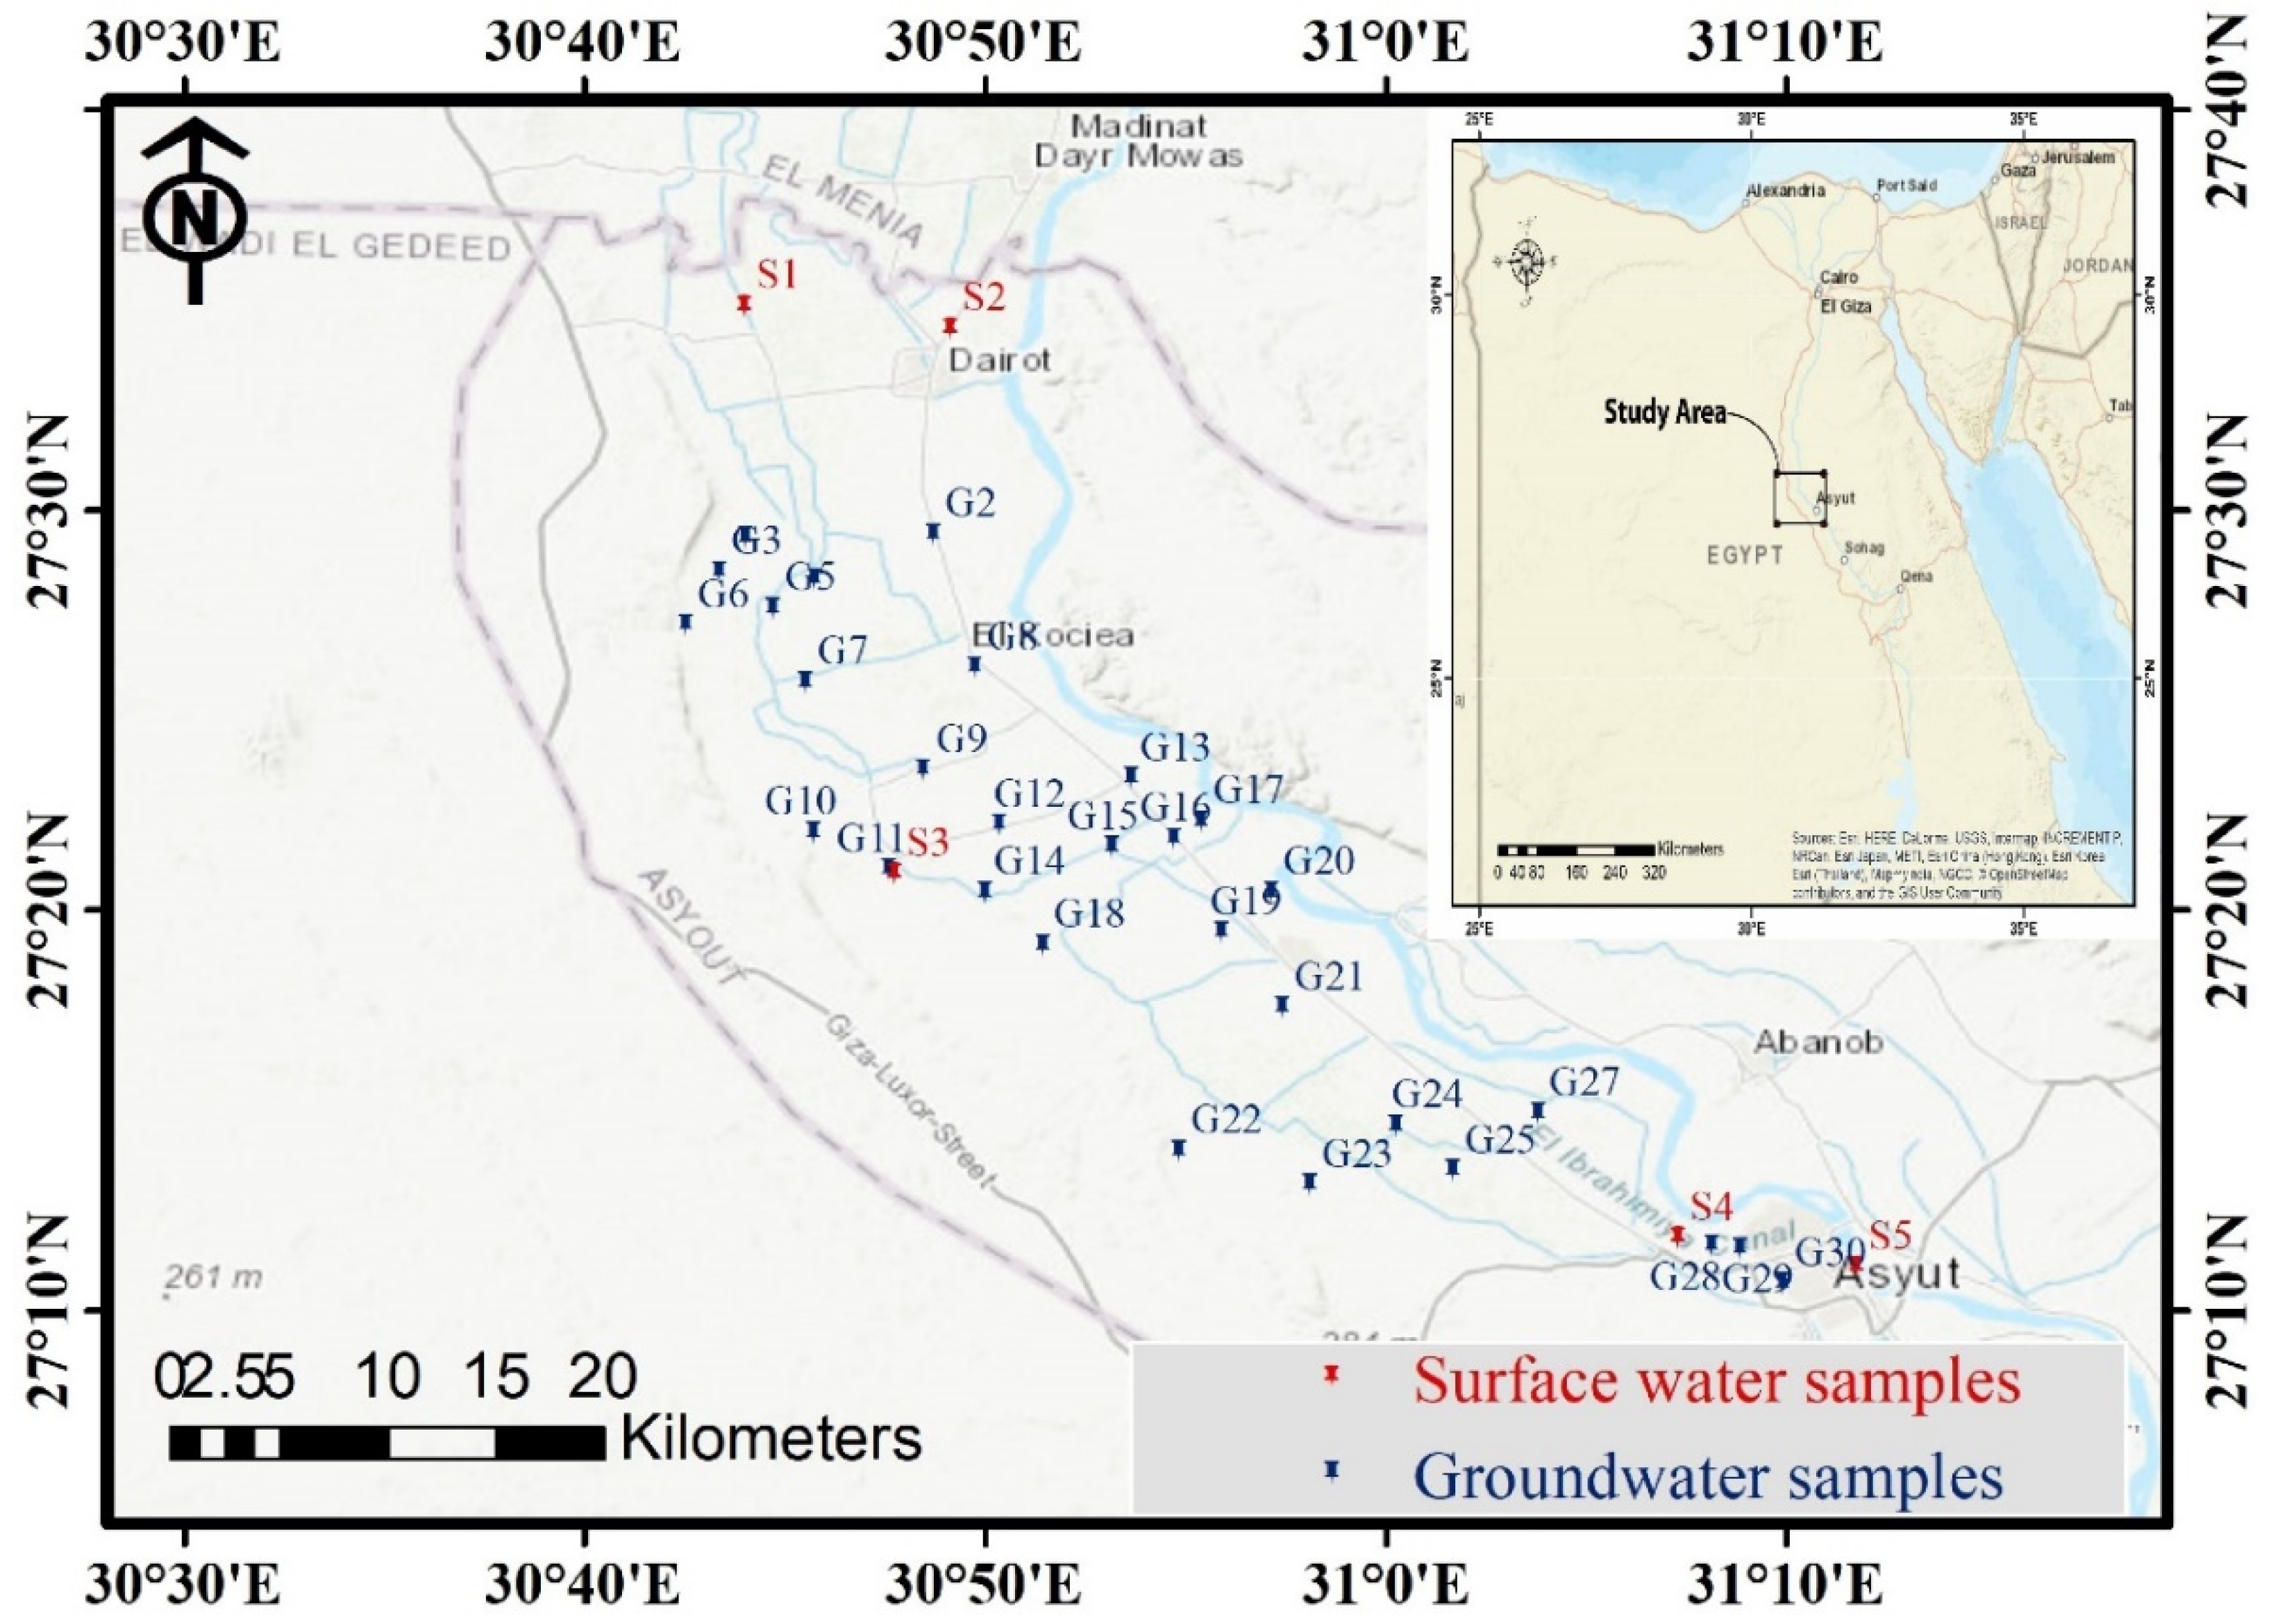
The research area is located in the northern section of the Assuit region, near the Nile Valley. It spans the latitudes of 27°10′ and 27°40′ N, and the longitudes of 30°40′ and 31°20′ E. It is geomorphologically divided into lowland and highland, with the Eocene plateau to the west and the Nile River to the east. The older alluvial plain (agricultural land) and the younger alluvial plain are represented by the morphological units (the reclaimed land;
Figure 1 and
Figure 2; [
33]). According to [
34], the geologic succession is represented by rock units ordered from bottom to top as Eocene rocks (Mokkatom group), Pliocene deposits, and Quaternary sediments. In the researched area, groundwater is the second source of water for drinking water, domestic purposes, and irrigation. According to [
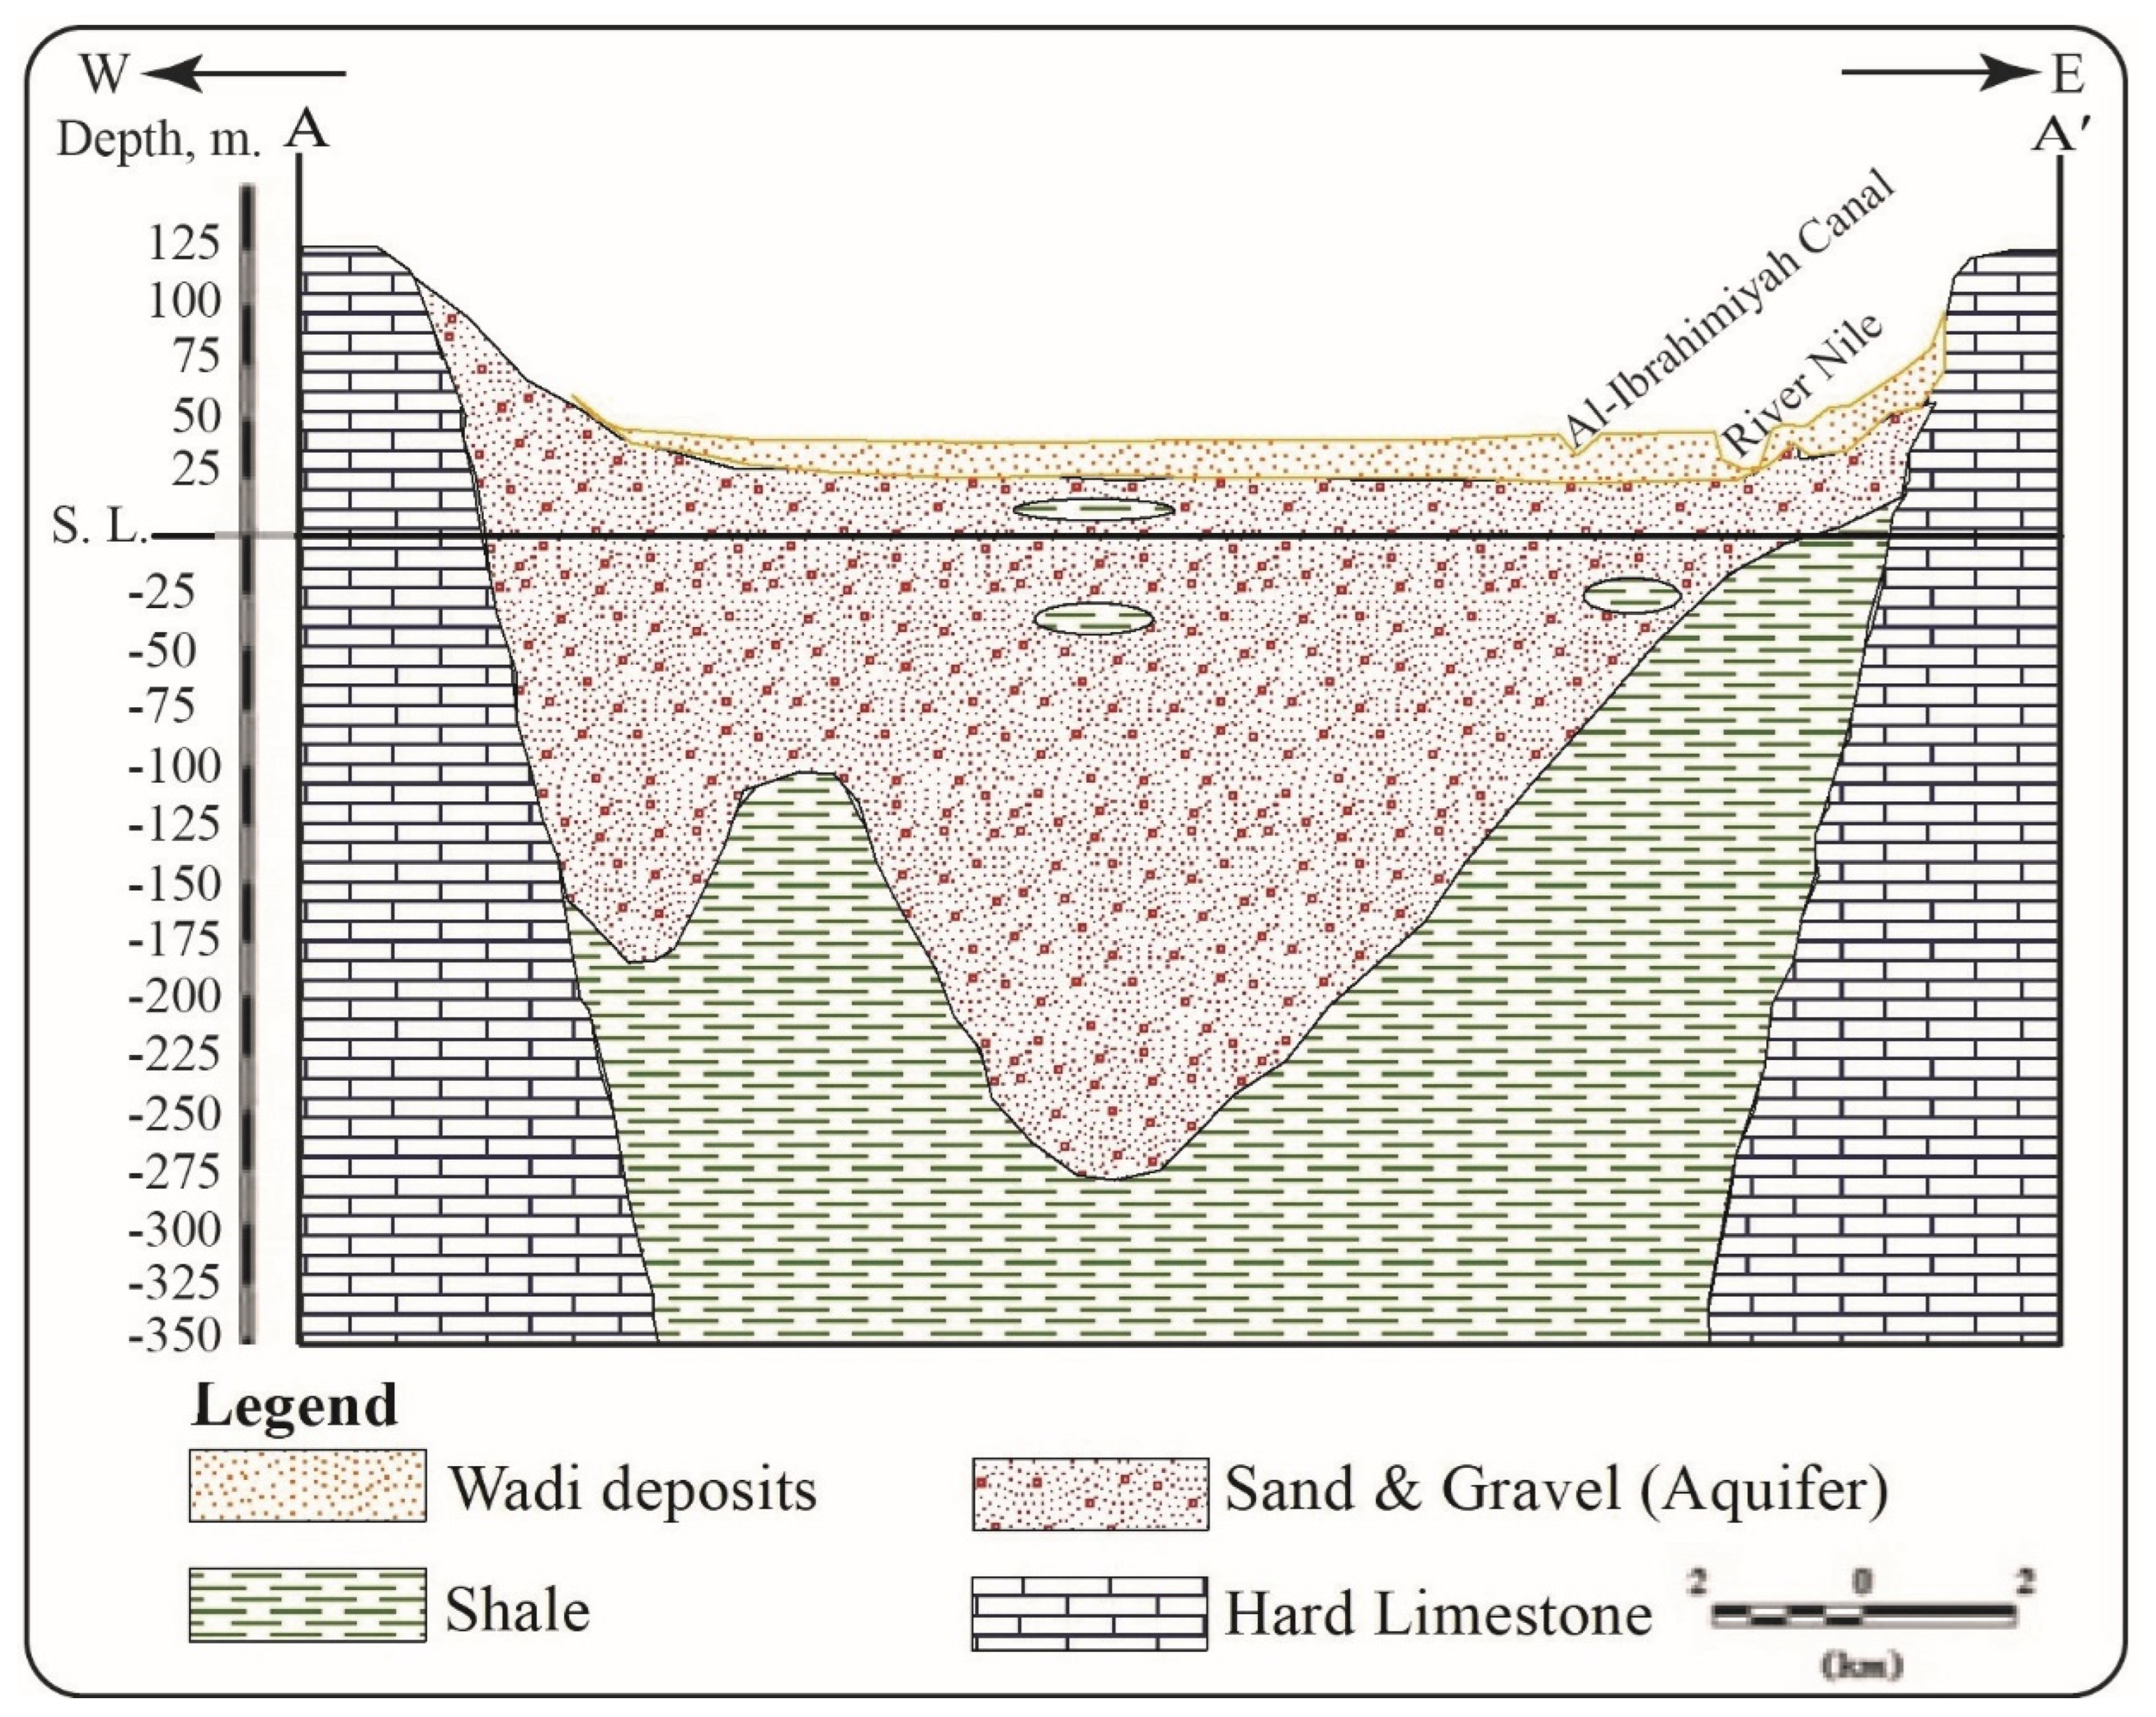
35], the groundwater aquifer is made up of coarse and sandy clay with cobbles, gravels, and calcareous rock fragments from the middle Pleistocene (Prenile) (
Figure 3). The aquifers are primarily replenished from surface water and precipitation, and groundwater moves westward [
23,
36].
2.2. Sampling and Laboratory Methods
From the research region, 30 groundwater samples were taken. The samples were placed in pre-rinsed polypropylene bottles and carefully sealed. Standard techniques were used to filter the samples and analyze their chemical components [
38].
The pH-meter was used to measure the temperature, electric conductivity (EC), total dissolved salts (TDSs), and hydrogen ion concertation (pH) while the Flame-Photometer was utilized to assess the sodium and potassium concentrations. Titration was used to determine the amounts of calcium, magnesium, carbonate, bicarbonate, sulphate, and chloride. The ionic balances identified the analytical precision of the ion’s measurements, which was less than 5%.
2.3. Saturation Index (SI)
The SI investigates the chemical equilibrium of processes involving aqueous species and minerals [
23,
24,
39]. The Phreeqc Interactive version 3.4 was used to calculate the saturation indices for the groundwater samples. The SI system is defined by the equation:
where IAP signifies the ion activity product and K
mineral denotes the mineral’s solubility constant. When SI equals 0, the dissolved mineral in the water sample is entirely saturated. Positive SI values indicate that the sample is super-saturated, and the mineral will tend to precipitate; negative SI values indicate that the sample is under-saturated, and the mineral will dissolve [
40].
2.4. Chloro-Alkaline Indices (CAIs)
CAIs describe ion exchange processes that occur when one ion is replaced by another ion at the solid material surface of a soil or rock, such as a clay mineral, and organic matter or metal oxyhydroxide [
20,
23,
41,
42]. The concentration of ions and the transit of contaminants in groundwater are controlled by ion exchange and sorption processes [
20]. The following equation is used to determine CAI, where the concentrations are represented in equivalent per mill (epm):
and:
The obtained positive results indicate that groundwater alkalis (Na
+ + K
+) interchange with alkaline earth ions (Ca
2+ + Mg
2+) in the host rocks. As a result, the concentrations of Ca
+2 and Mg
2+ in the groundwater are rising [
43]. Negative values, on the other hand, show that reverse exchange occurs and the alkali ions (Na
+ + K
+) in the solution exceed the limit [
43]. Furthermore, negative values refer to rainwater recharge, which seeps into the sediments and replenishes the groundwater table [
44].
2.5. Gibbs Diagram (GD)
The GD depicts groundwater evolution processes and the effects of surrounding sediments on groundwater chemistry [
23,
45,
46]. Aside from the water–rock interaction and atmospheric precipitation, evaporation is an important mechanism that regulates water chemistry [
45,
47]. The following equations were used to compute the Gibbs ratio for cations and anions (GC and GA):
The concentration is expressed in epm in this case. By plotting both the GC and GA values against TDS, a Gibbs diagram can be generated. The ion concentrations and physicochemical properties are shown in
Table 1.
2.6. Statistical Analysis
Principal component analysis (PCA) is a method for determining the dynamics of all variables in a system under study. Its goal is to minimize the multivariate dataset’s dimensionality by extracting information in the form of a minimal number of main components while representing typical environmental factors. As a result, by eliminating information omission, the key principal components may be retrieved, comprising all of the essential data. The equations were reported in detail by [
48].
Hierarchical cluster analysis (HCA) is a clustering method that explores the placement of data in groups and within groups in a hierarchical fashion. HCA outcomes are frequently presented in the form of a dendrogram, which is a tree-like representation of the structure of samples and their interactions. There are two primary approaches to solving the grouping problem in HCA: agglomerative and divisive [
49]. A single sample is initially considered a cluster in the agglomerative technique, and subsequently pairs of clusters are merged. The divisive algorithm begins with a single cluster containing all samples and then separates them recursively.
PCA and HCA statistical analysis were used to describe the quality of pumped water and determine the extent to which it may be influenced by environmental parameters and the interaction between soil and water. PCA and HCA were both performed with the [
50].
3. Results and Discussion
The interaction between groundwater and host rocks is determined by dissolution and precipitation, which are influenced by a variety of factors, including solution composition and the degree of saturation of the aqueous solution with respect to the various mineral phases [
24].
3.1. Saturation Index
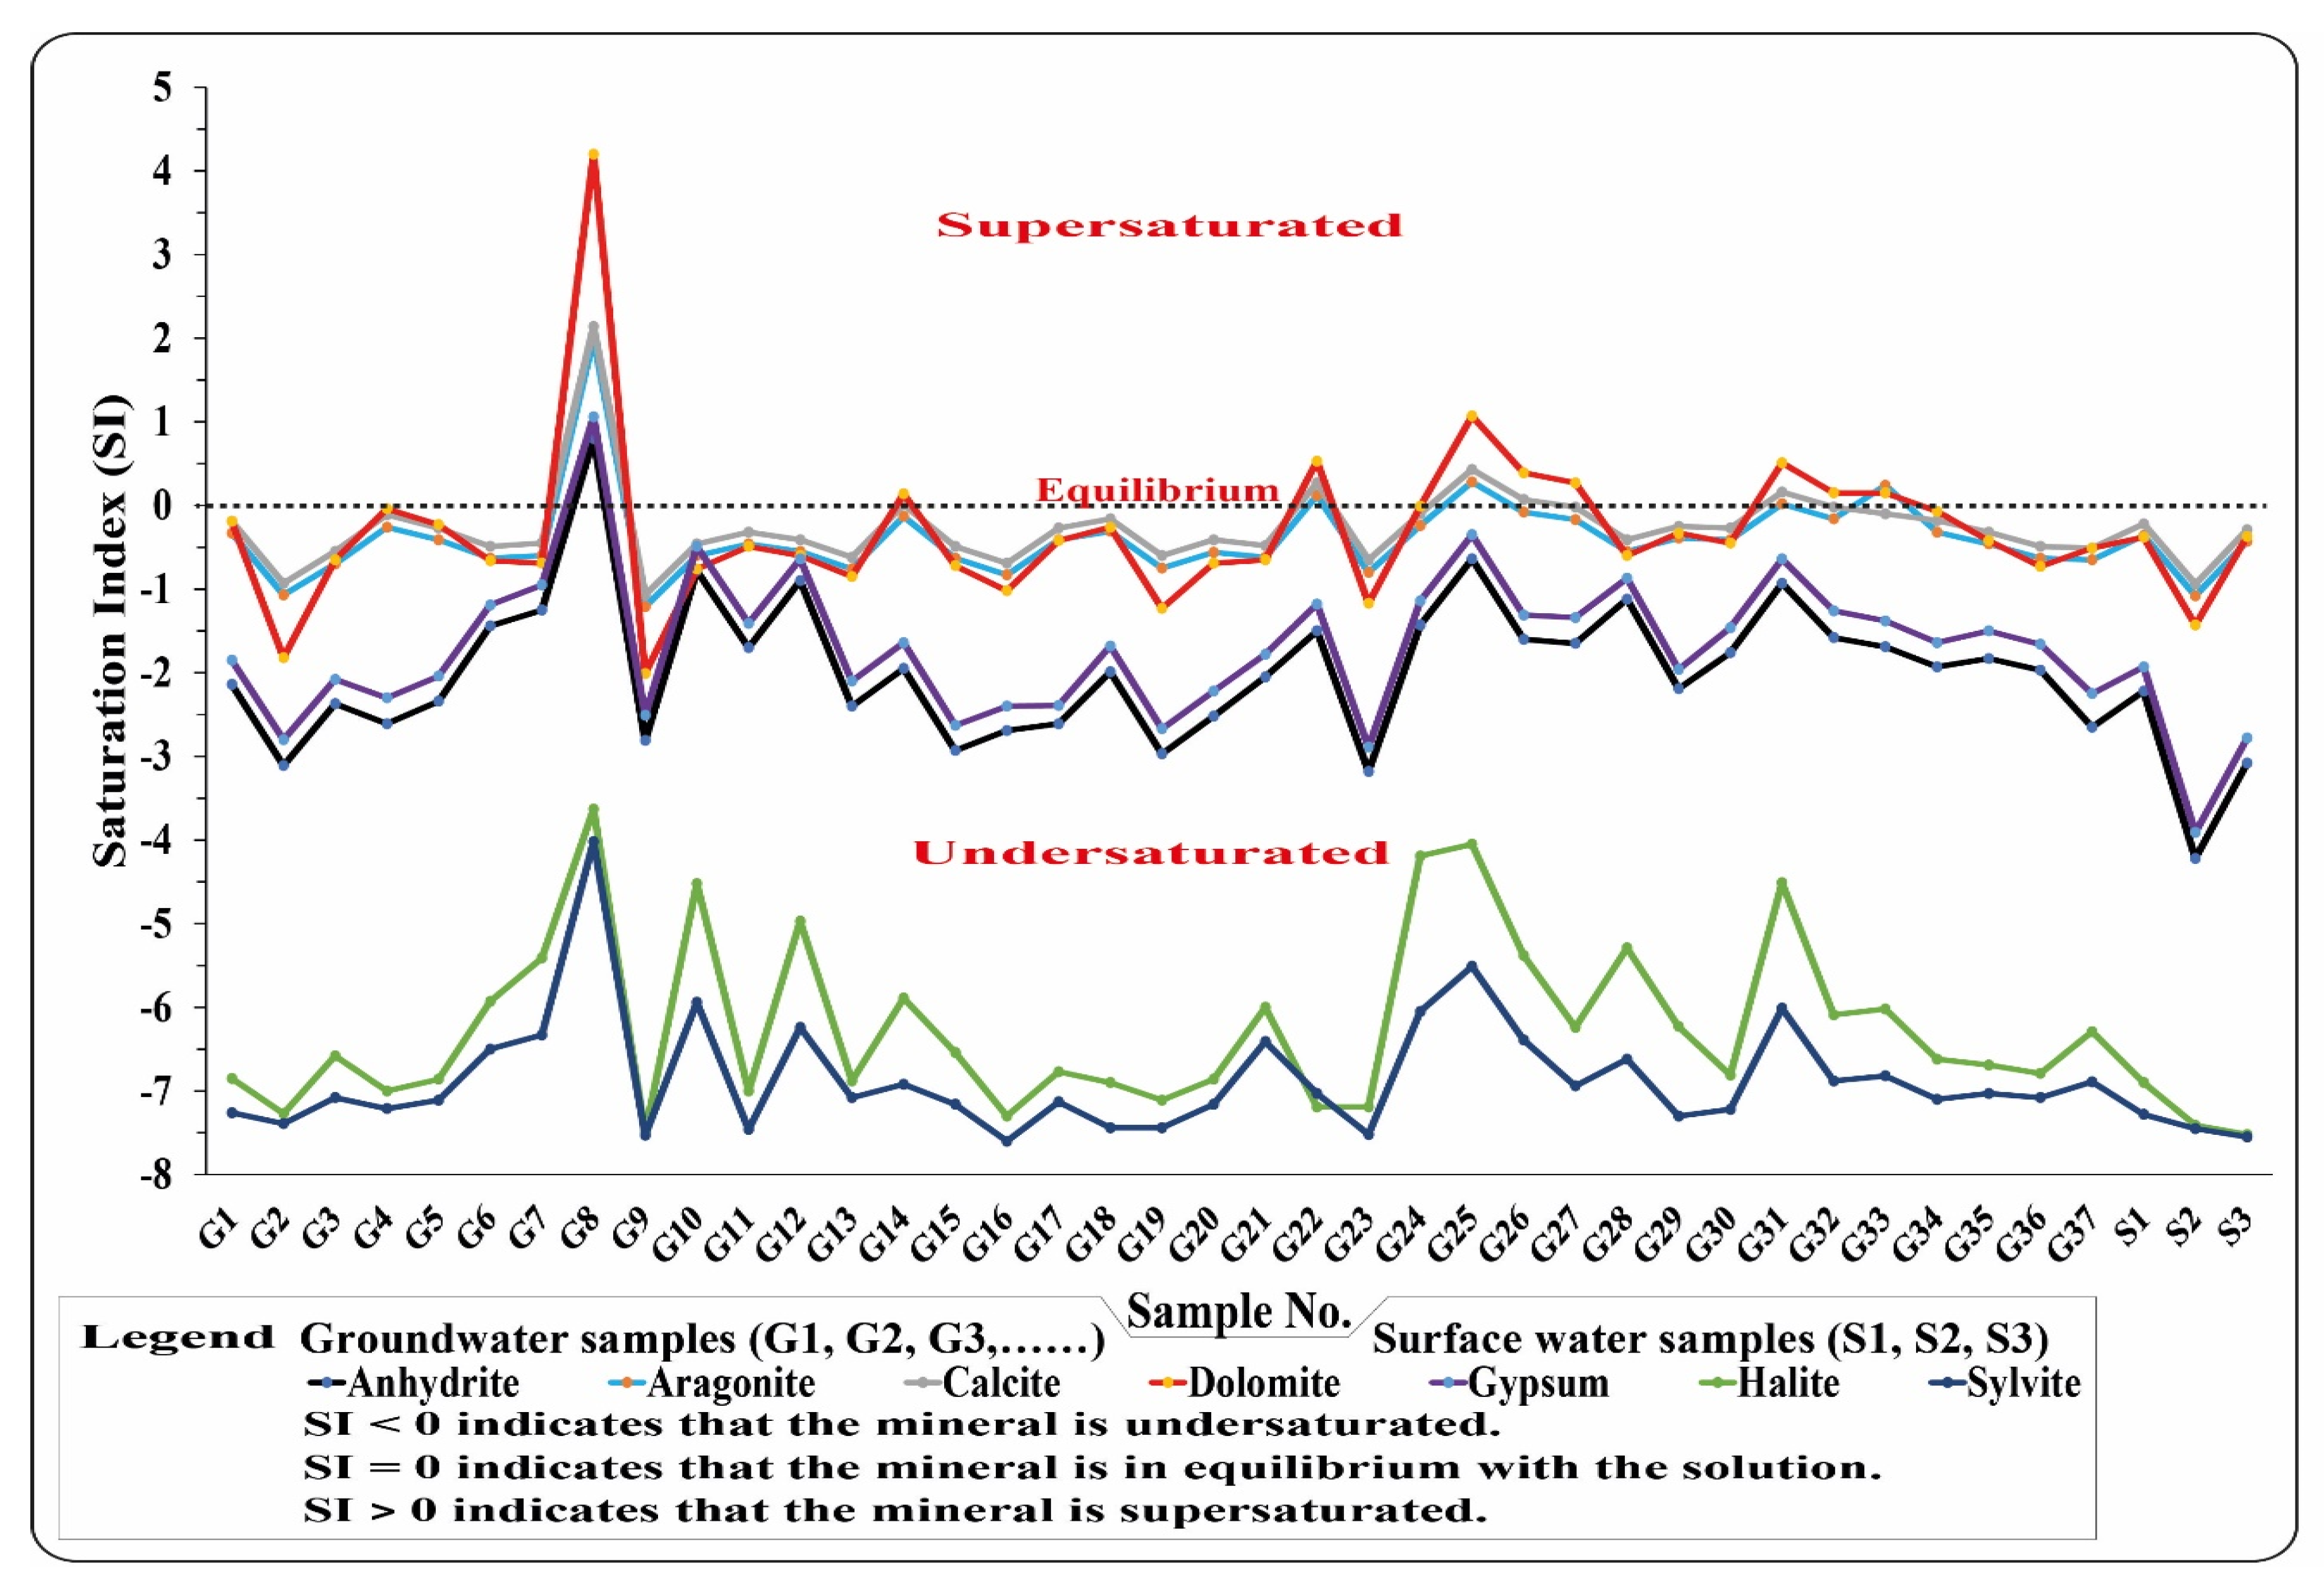
Because the groundwater system is affected by diverse solutes resulting from the interaction with the surrounding sediments, SI aids in the realization of reactive minerals in the groundwater system [
39,
40]. SI values indicated that the bulk of groundwater samples are undersaturated in these minerals (
Figure 4), except five samples: No. G7, G19, G21, G25, and G26. Sample No. G7 is supersaturated with anhydrite, aragonite, calcite, dolomite, gypsum, halite, and sylvite minerals. Sample No. G19 is supersaturated with aragonite, calcite, and dolomite while samples No. G21 and G25 are supersaturated with dolomite only. Moreover, sample No. G26 is supersaturated with dolomite and aragonite. This supported by [
51], who proved the presence of carbonate minerals in Assuit soils, which leached to the groundwater, using XRD, XRF, and SEM techniques.
The SI values for the five surface water samples, on the other hand, are undersaturated with the previously mentioned minerals (
Figure 4). This indicates that the groundwater in the study area is primarily recharged by surface water [
23]. The evaporite and carbonate minerals are dissolutions based on the SI results, except in the supersaturated samples. These minerals are prone to precipitation [
23,
39,
40]. The very strong correlation between TDS and Ca
2+, Mg
2+, Na
+, Cl
−, and SO
42−, where r = 0.940, 0.935, 939, 0.962, and 0.848, respectively, supports the presence of carbonate and evaporite minerals in the groundwater (
Table 2). This proved that the motioned ions (Ca
2+, Mg
2+, Na
+, Cl
−, and SO
42−), which were indicated on both carbonate and evaporite minerals, are the main control in TDS.
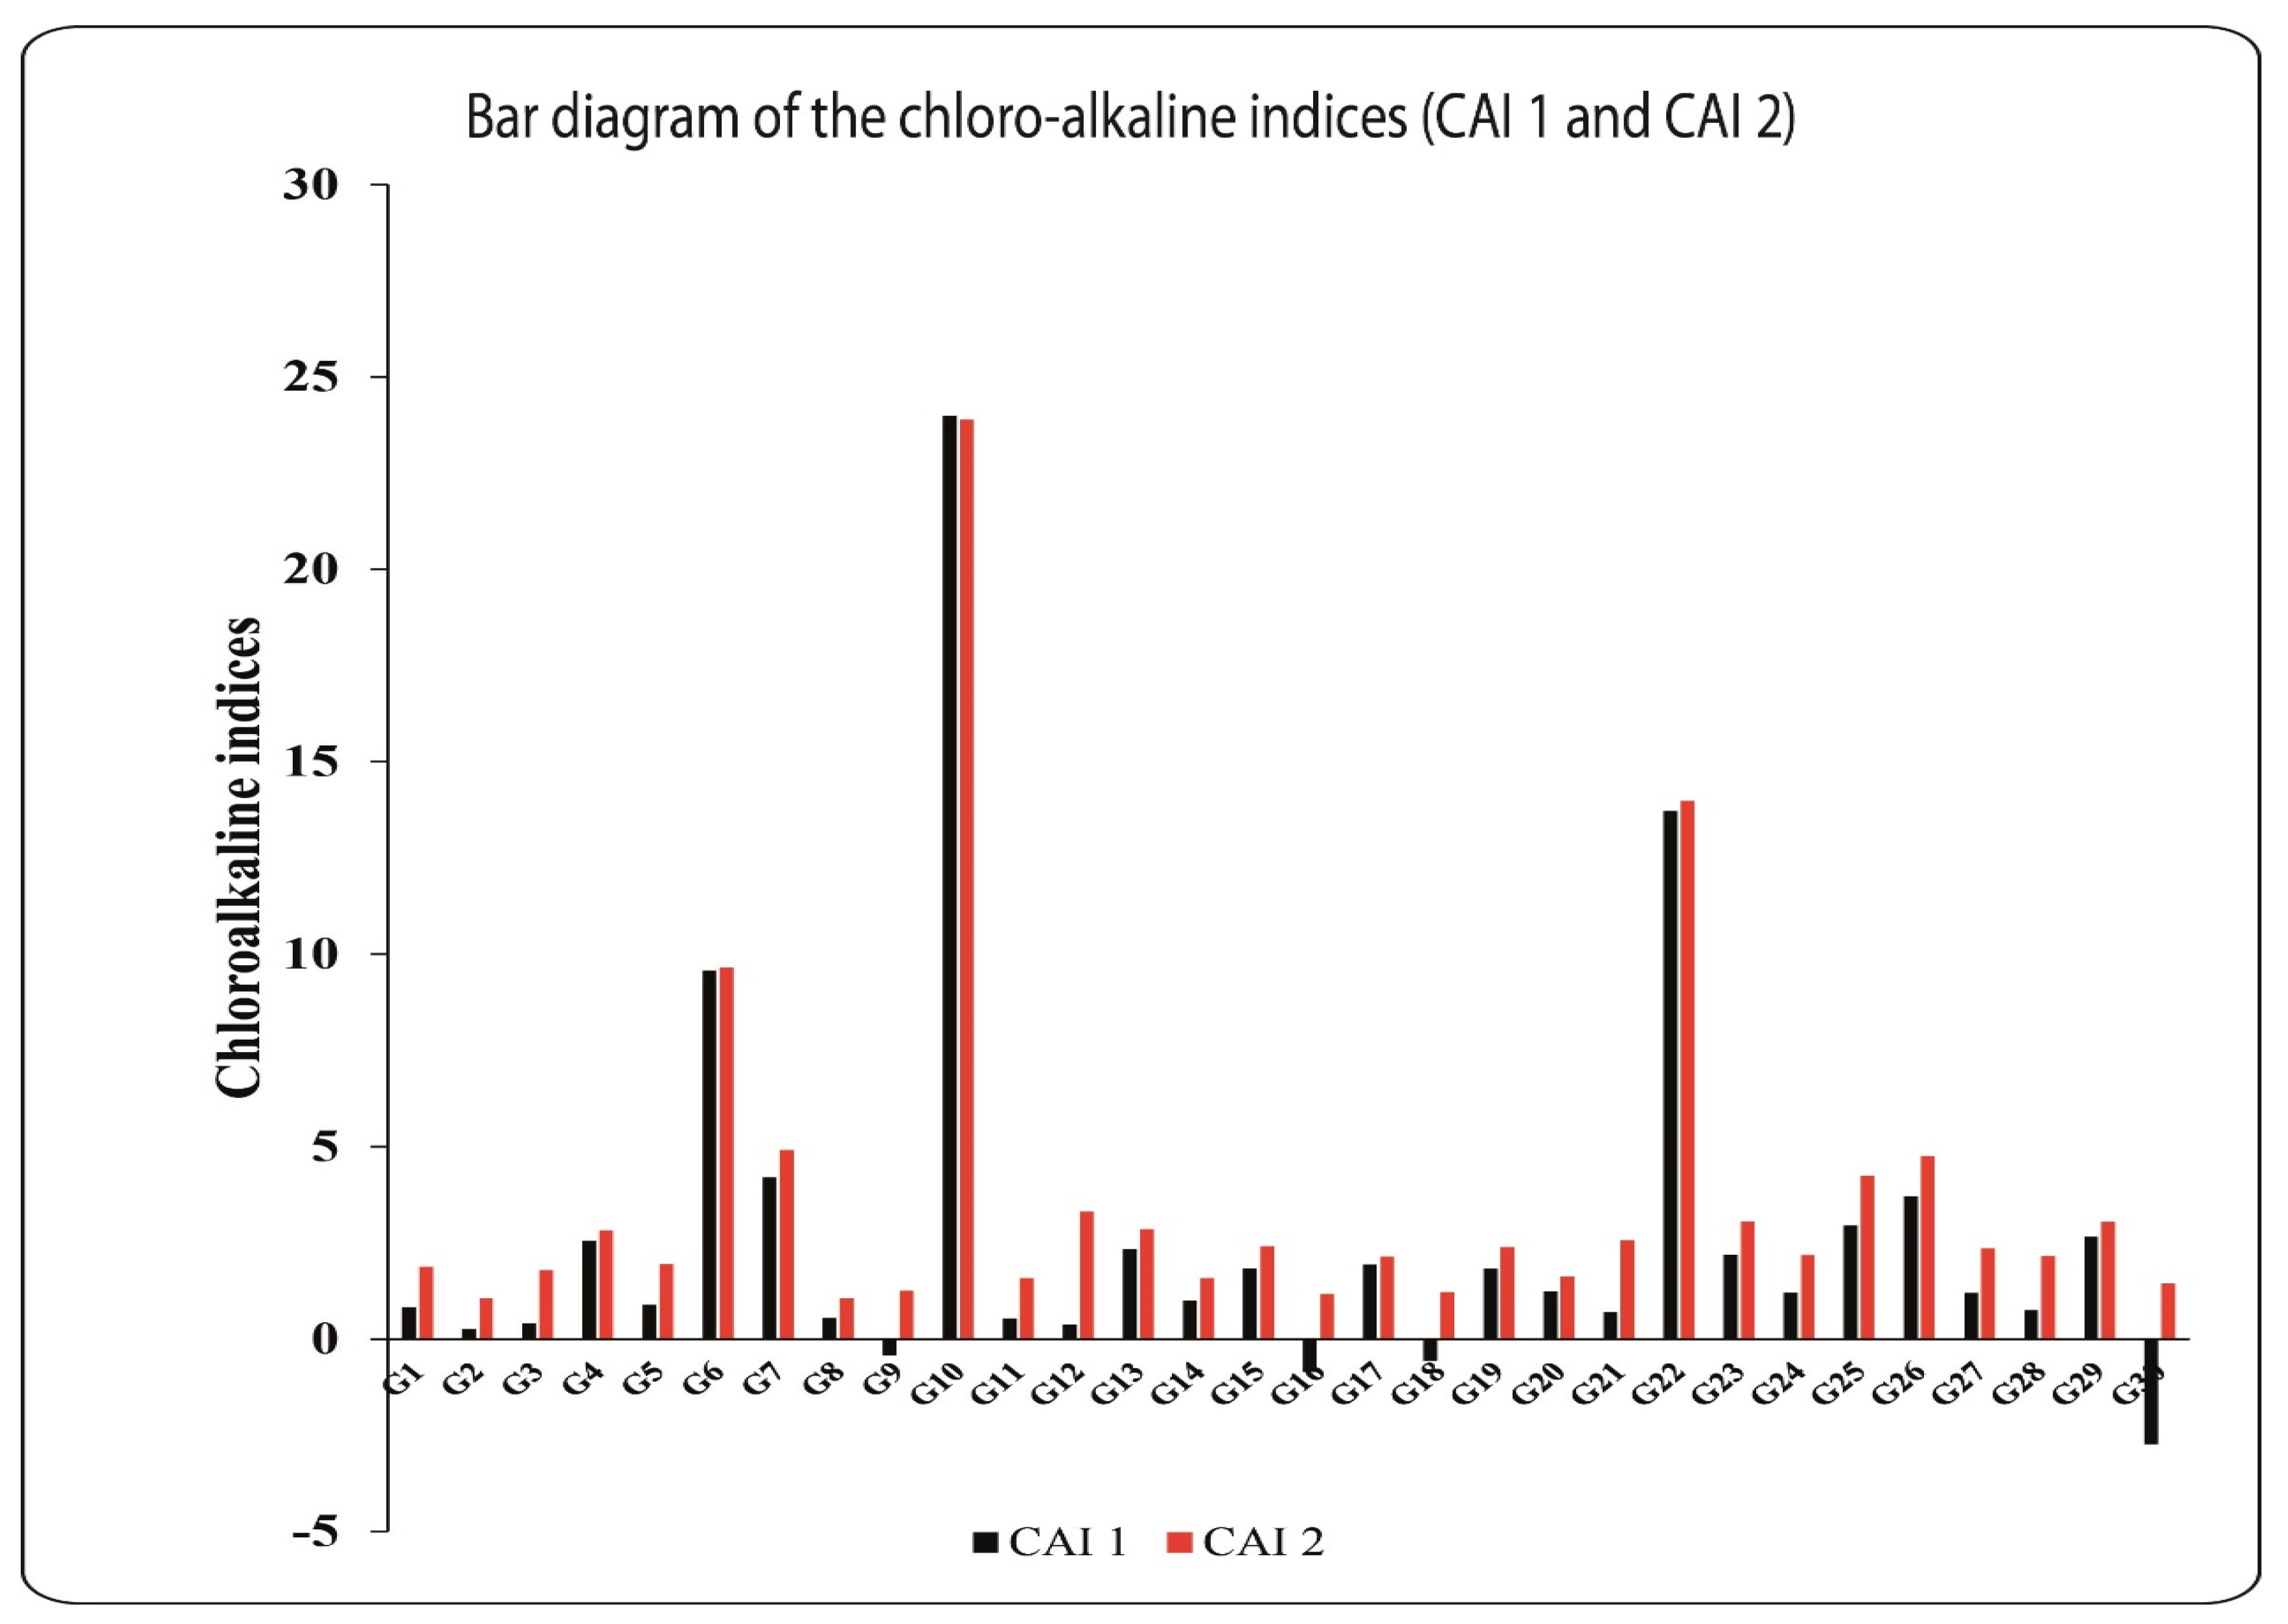
3.2. Chloro-Alkaline Indices
The CAIs indicate the ion exchange between groundwater and solid constituents in ambient sediments [
20,
23,
39,
41]. Except for four samples that have negative CAI values, all of the groundwater samples had positive CAI values (
Figure 5). This shows that alkali ions (Na
+ + K
+) in groundwater interact with earth alkaline elements (Ca
2+ + Mg
2+) in ambient sediments at the solid surface material [
23,
39,
43].
As a result, the concentrations of calcium and magnesium in groundwater are raised, indicating the dominance of carbonate mineral dissolution [
23,
39,
43]. The samples with negative CAI values, on the other hand, showed reverse replacement. As a result, the sodium and potassium concentrations in the groundwater are too high (
Figure 5; [
23,
39,
43]). The negative numbers showed that the percolated rainwater is recharging the groundwater [
44]. The substantial positive correlation coefficients (r = 0.910–0.914) between Ca
2+ and Mg
2+ with Na
+ demonstrate these replacements (
Table 2).
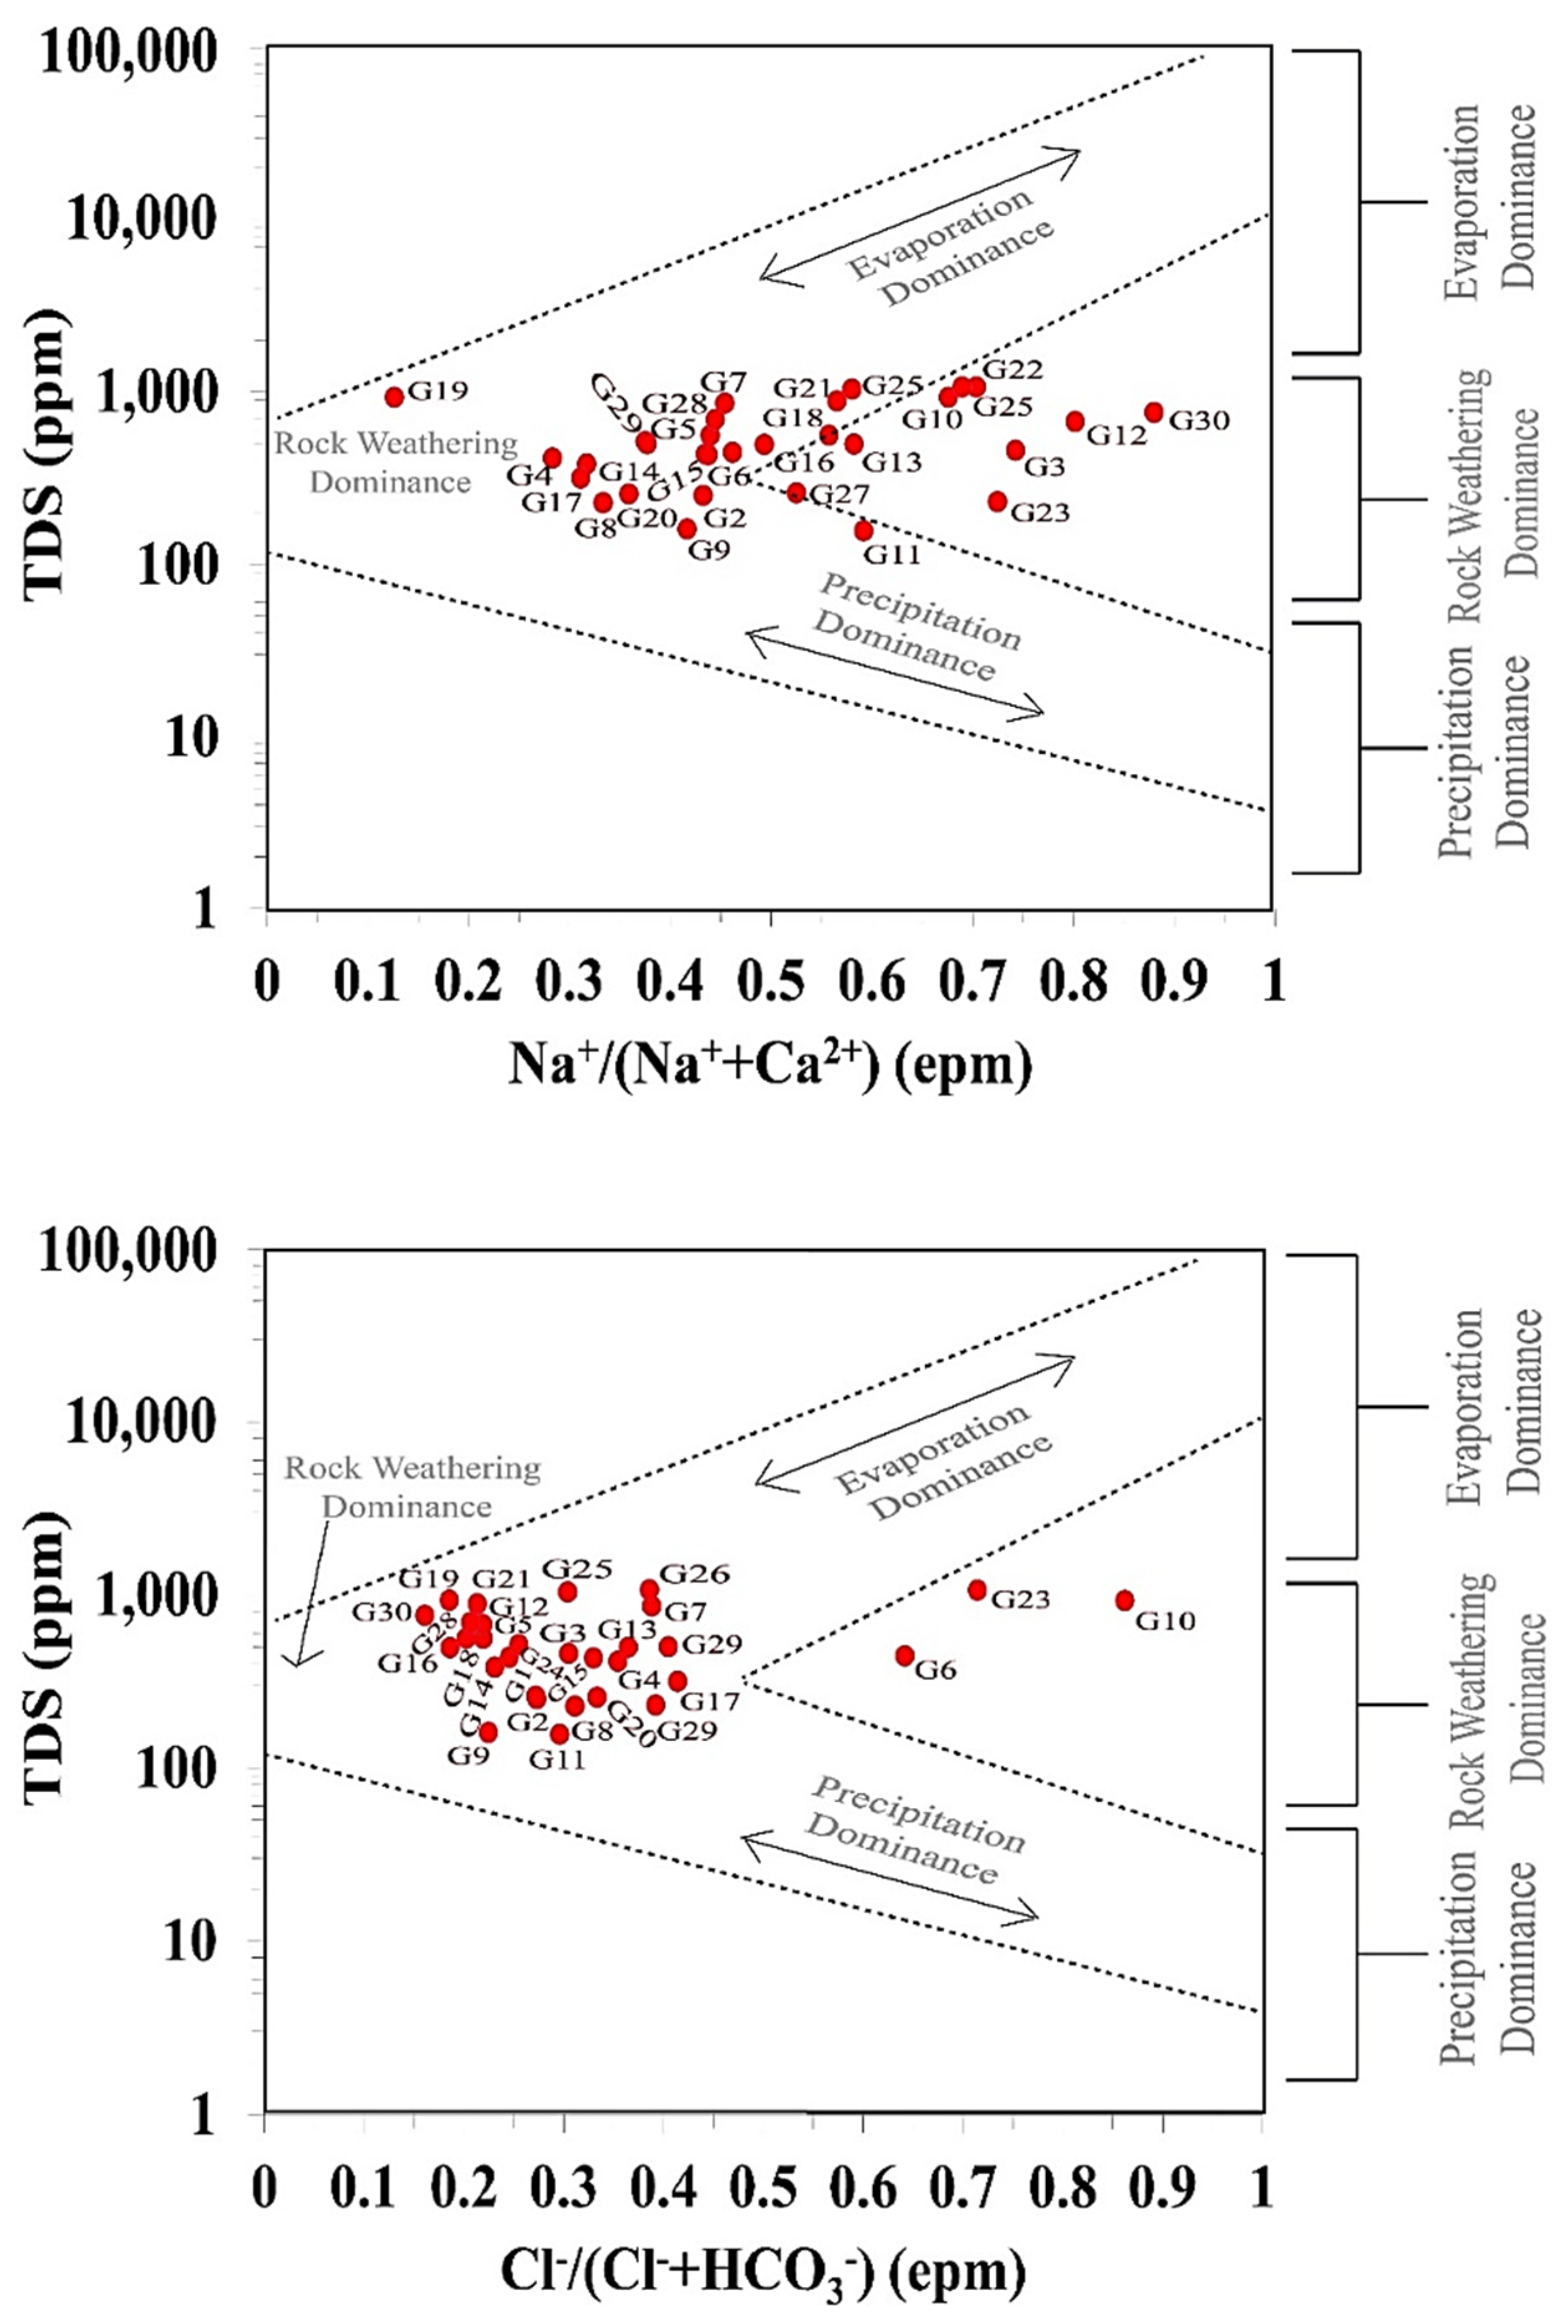
3.3. Gibbs Diagram
In addition to the water–rock interaction (rock dominance) and precipitation, the GD considers evaporation as a significant mechanism that can alter groundwater chemistry [
45,
46,
47]. According to GD in this study, the majority of groundwater samples were located in the rock-weathering dominance field (
Figure 6). This suggests that the water–rock interaction is the most important natural factor determining the groundwater chemistry. The term “rock-weathering dominance” refers to the recharging of fresh groundwater from fresh surface water. Furthermore, it suggests that the majority of carbonate minerals are dissolved in groundwater [
46,
47]. It is also obvious that evaporation processes influenced the groundwater, implying that a considerable ion exchange occurred between groundwater and solid constituents in ambient sediments ([
46];
Figure 6).
The evaporation dominance, on the other hand, indicated that saline groundwater may be the consequence of groundwater mixing with saline surface water, older deep water, and/or evaporites dissolved along the groundwater flow channel [
23,
46,
47].
3.4. Water Type
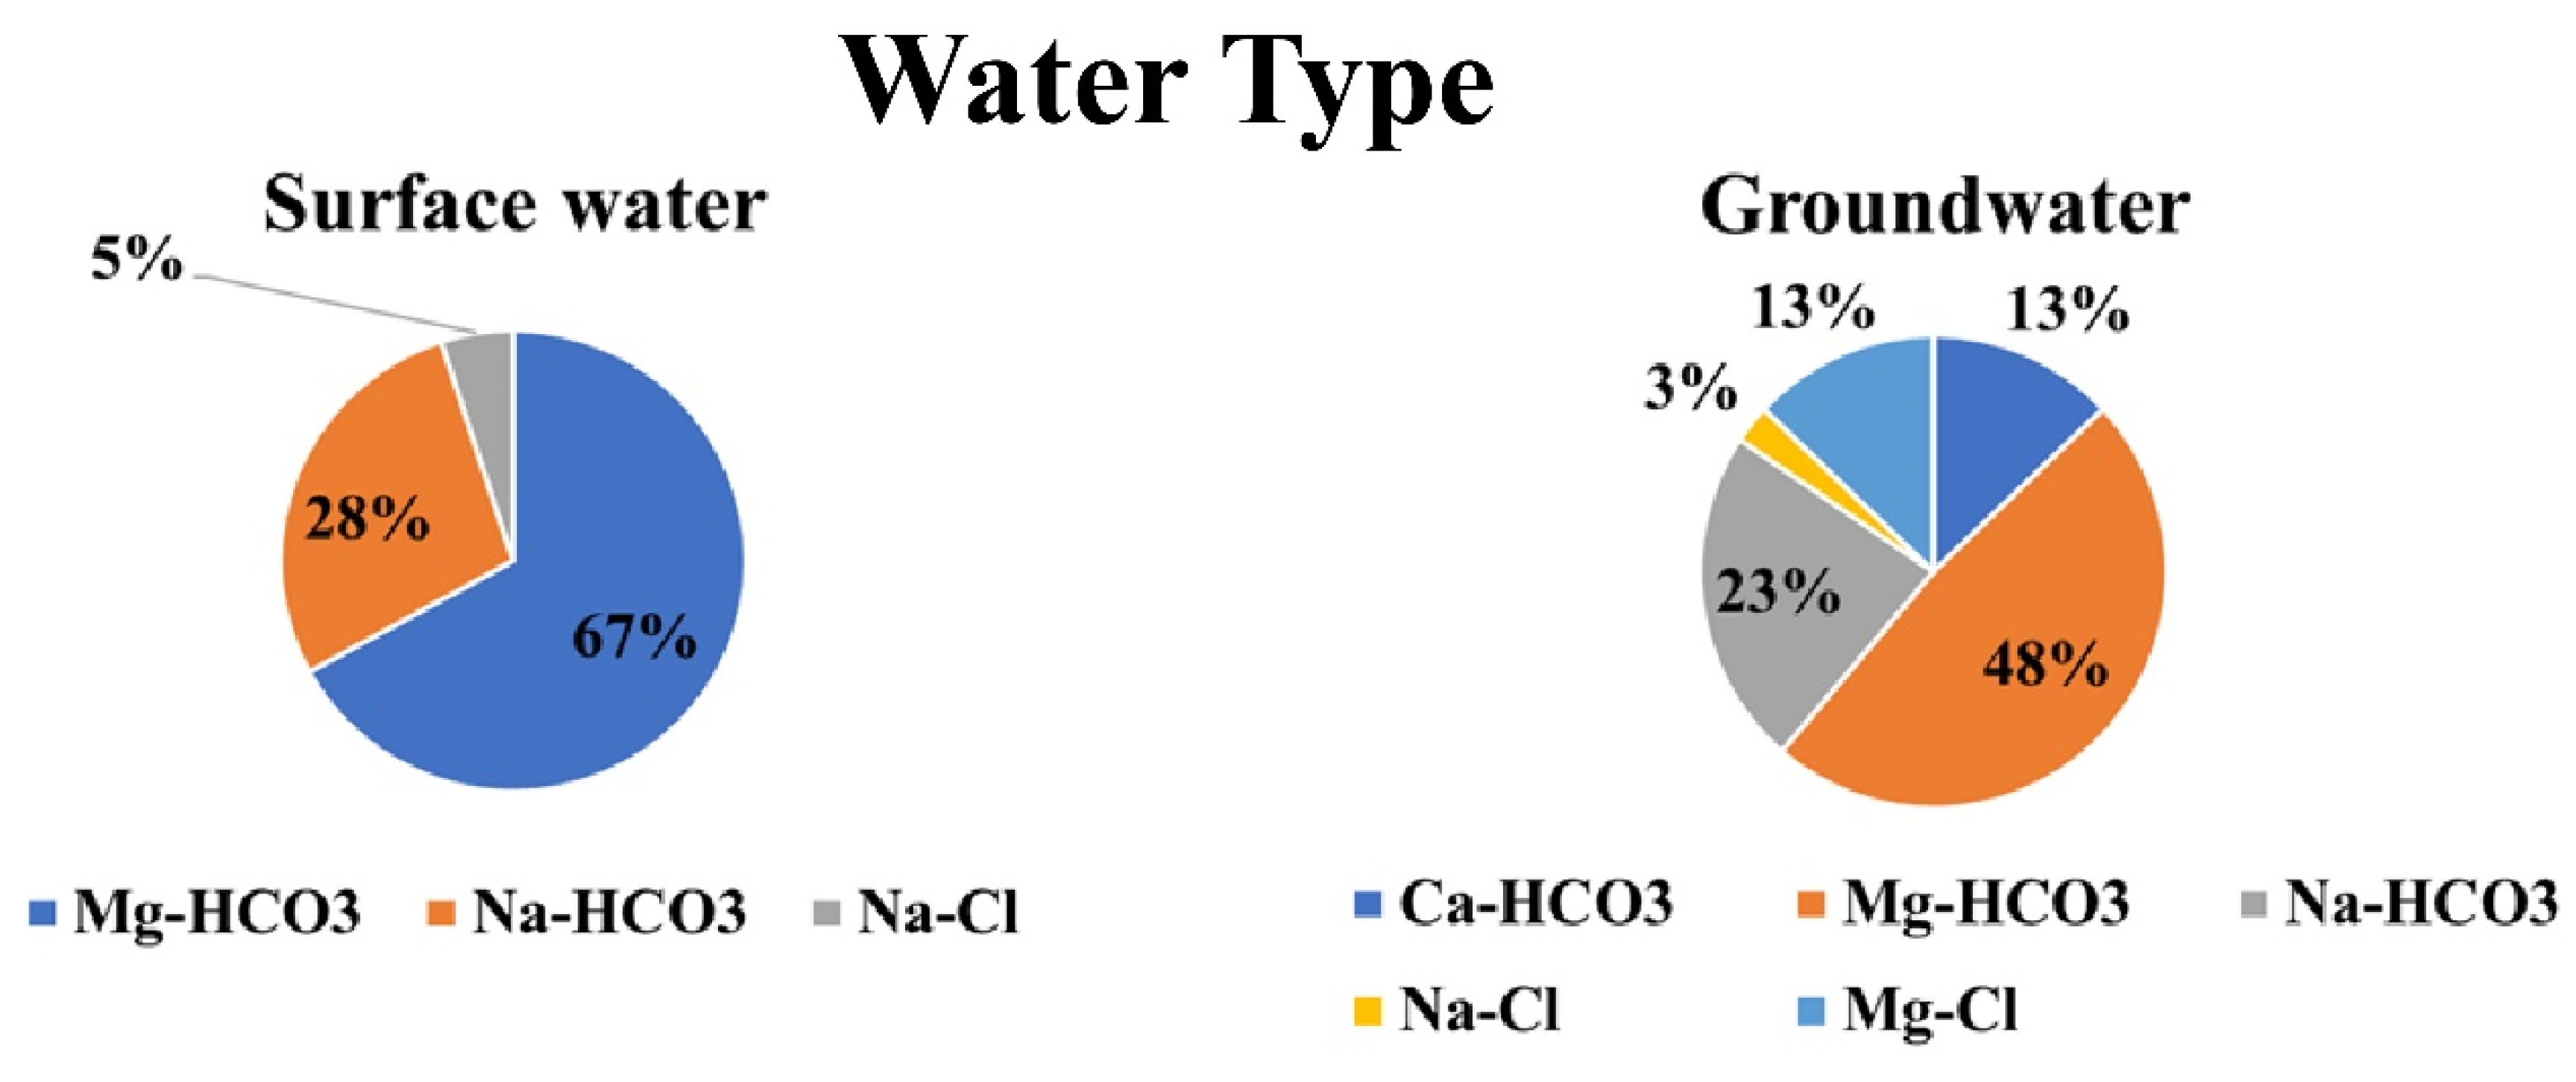
Figure 7 shows the water types, with Ca-HCO
3 (13%), Mg-HCO
3 (48%), and NaHCO
3 (23%), indicating the higher solubility of carbonate minerals, particularly calcite, in groundwater samples [
20,
45,
47]. Mg-Cl (13%) and Na-Cl (3%), respectively, are present in the other samples of groundwater, owing to the evaporite minerals’ high solubility [
20,
45,
47]. Surface water samples, on the other hand, revealed Mg-HCO
3 (67%), Na-HCO
3 (28%), and Na-Cl (5%), indicating that the groundwater is mostly replenishing from the surface water. The bicarbonate ions are prevalent in the groundwater samples, according to the water type data.
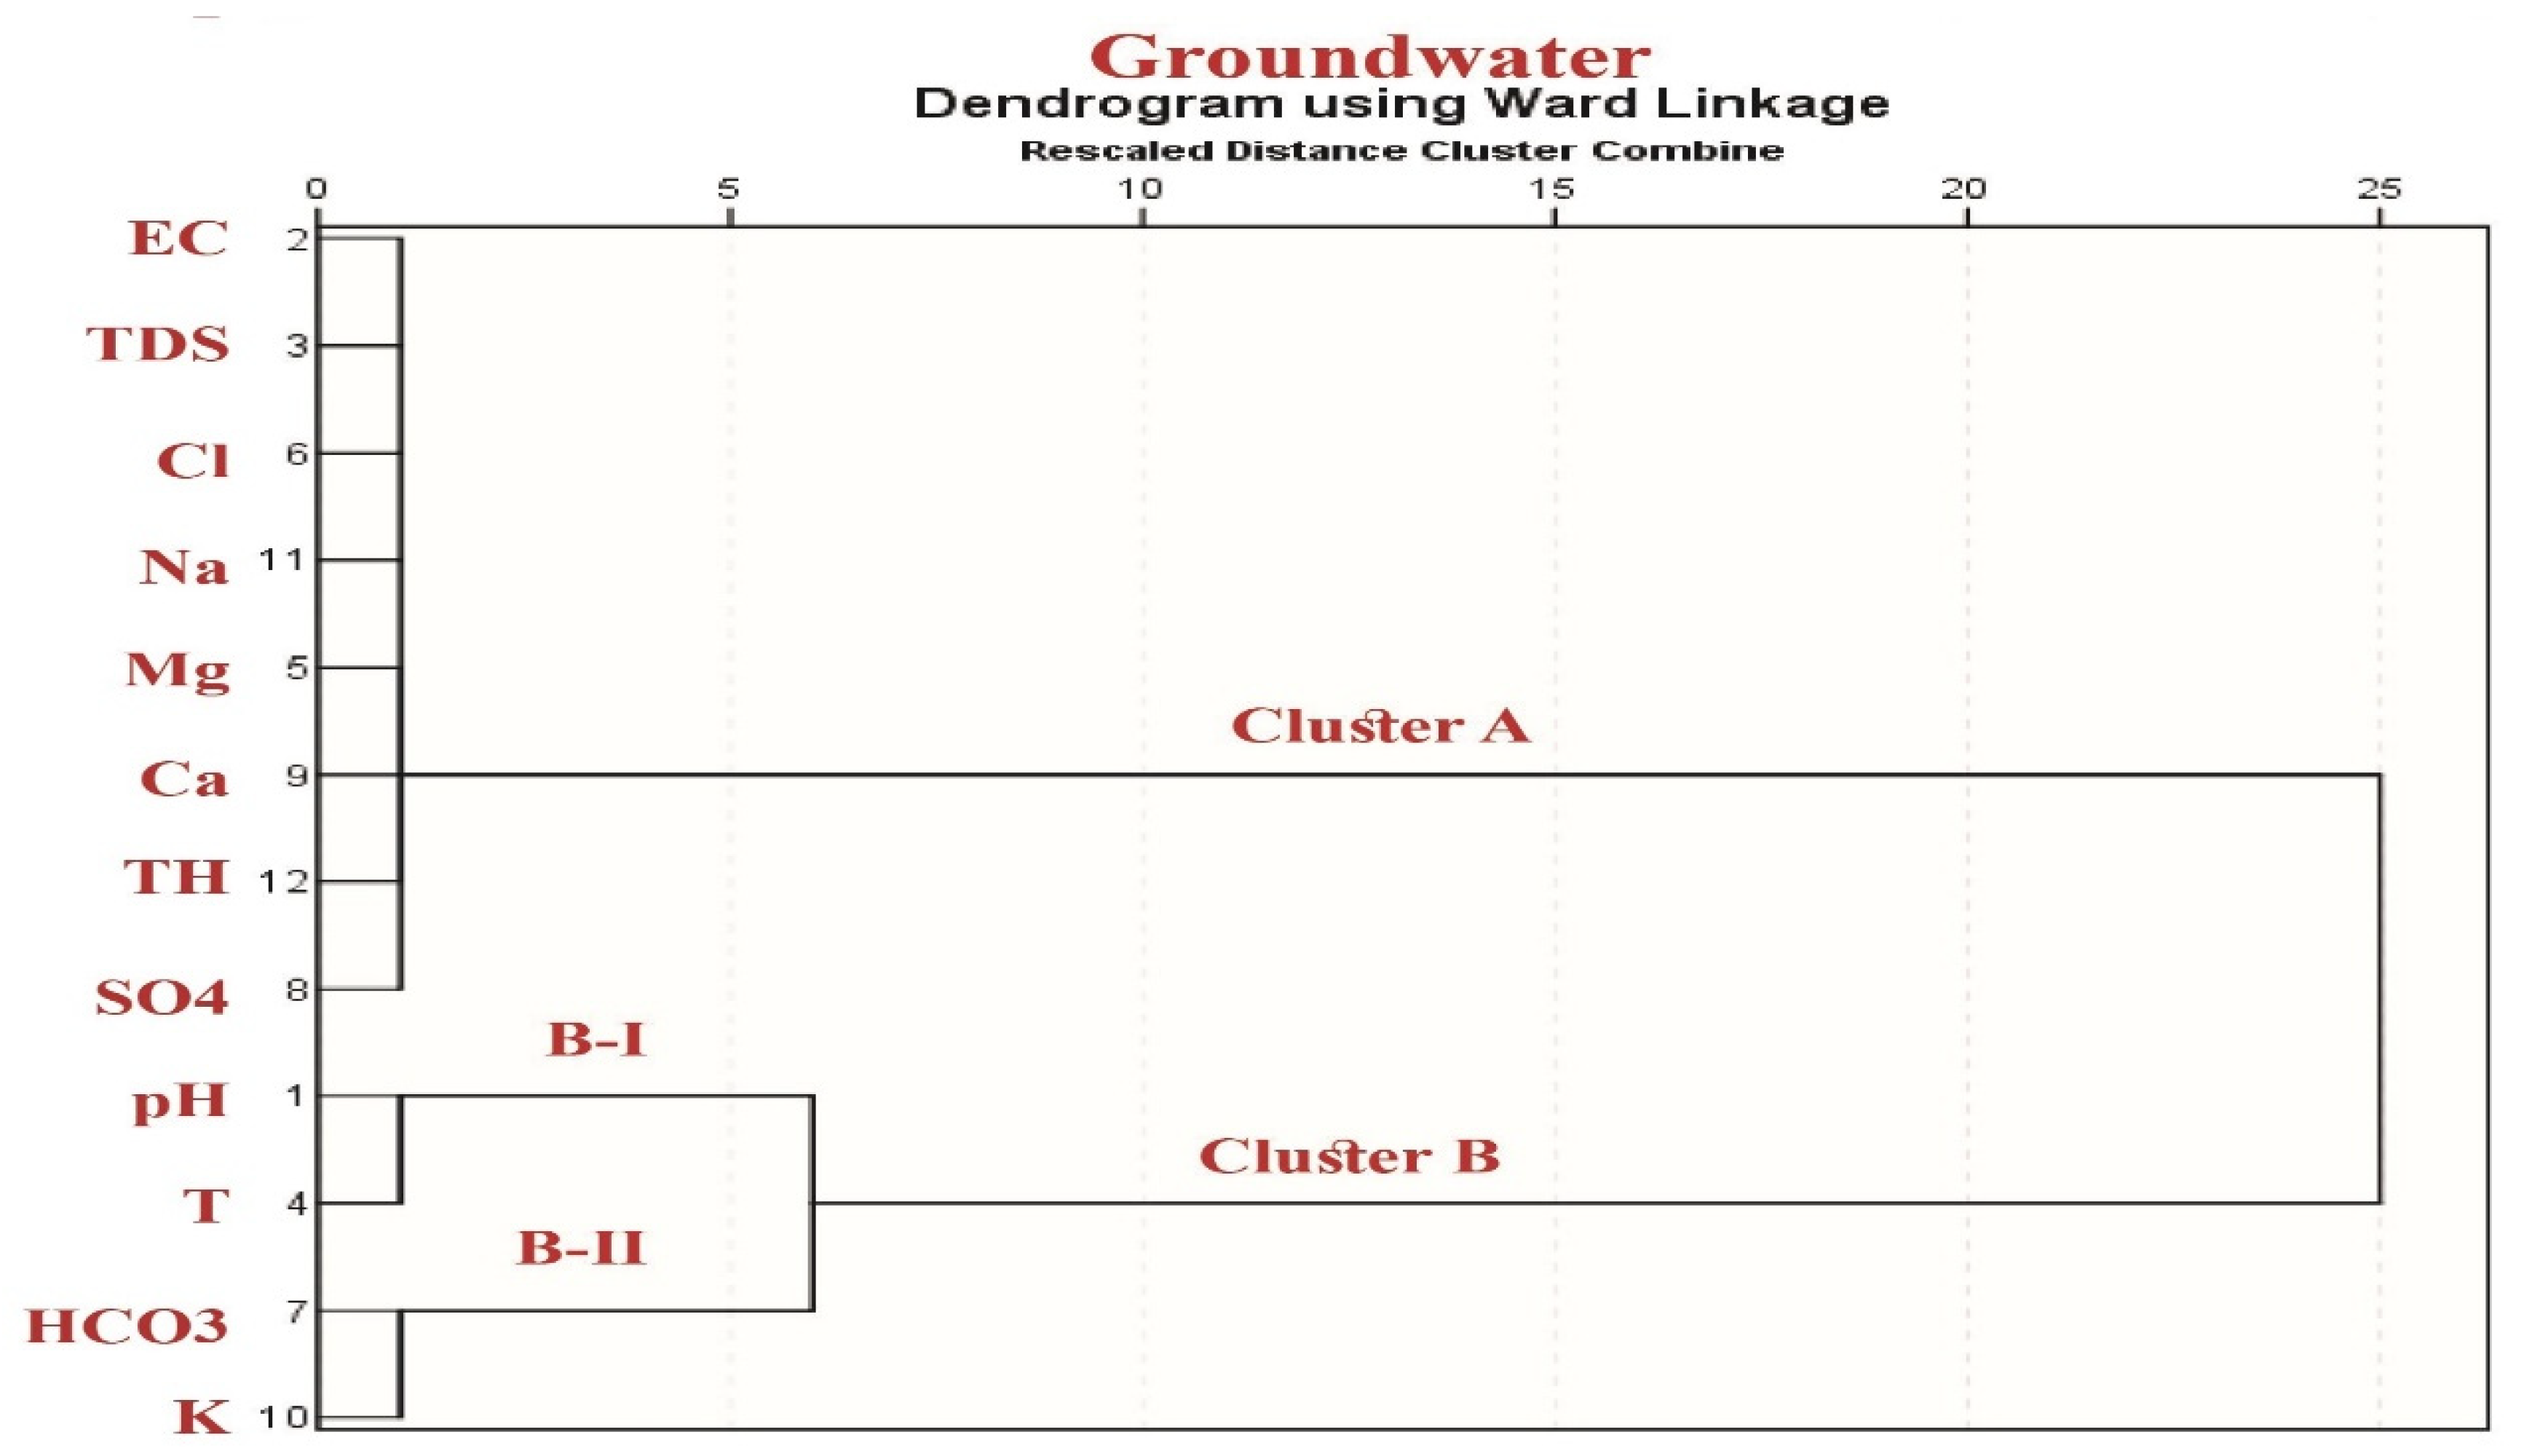
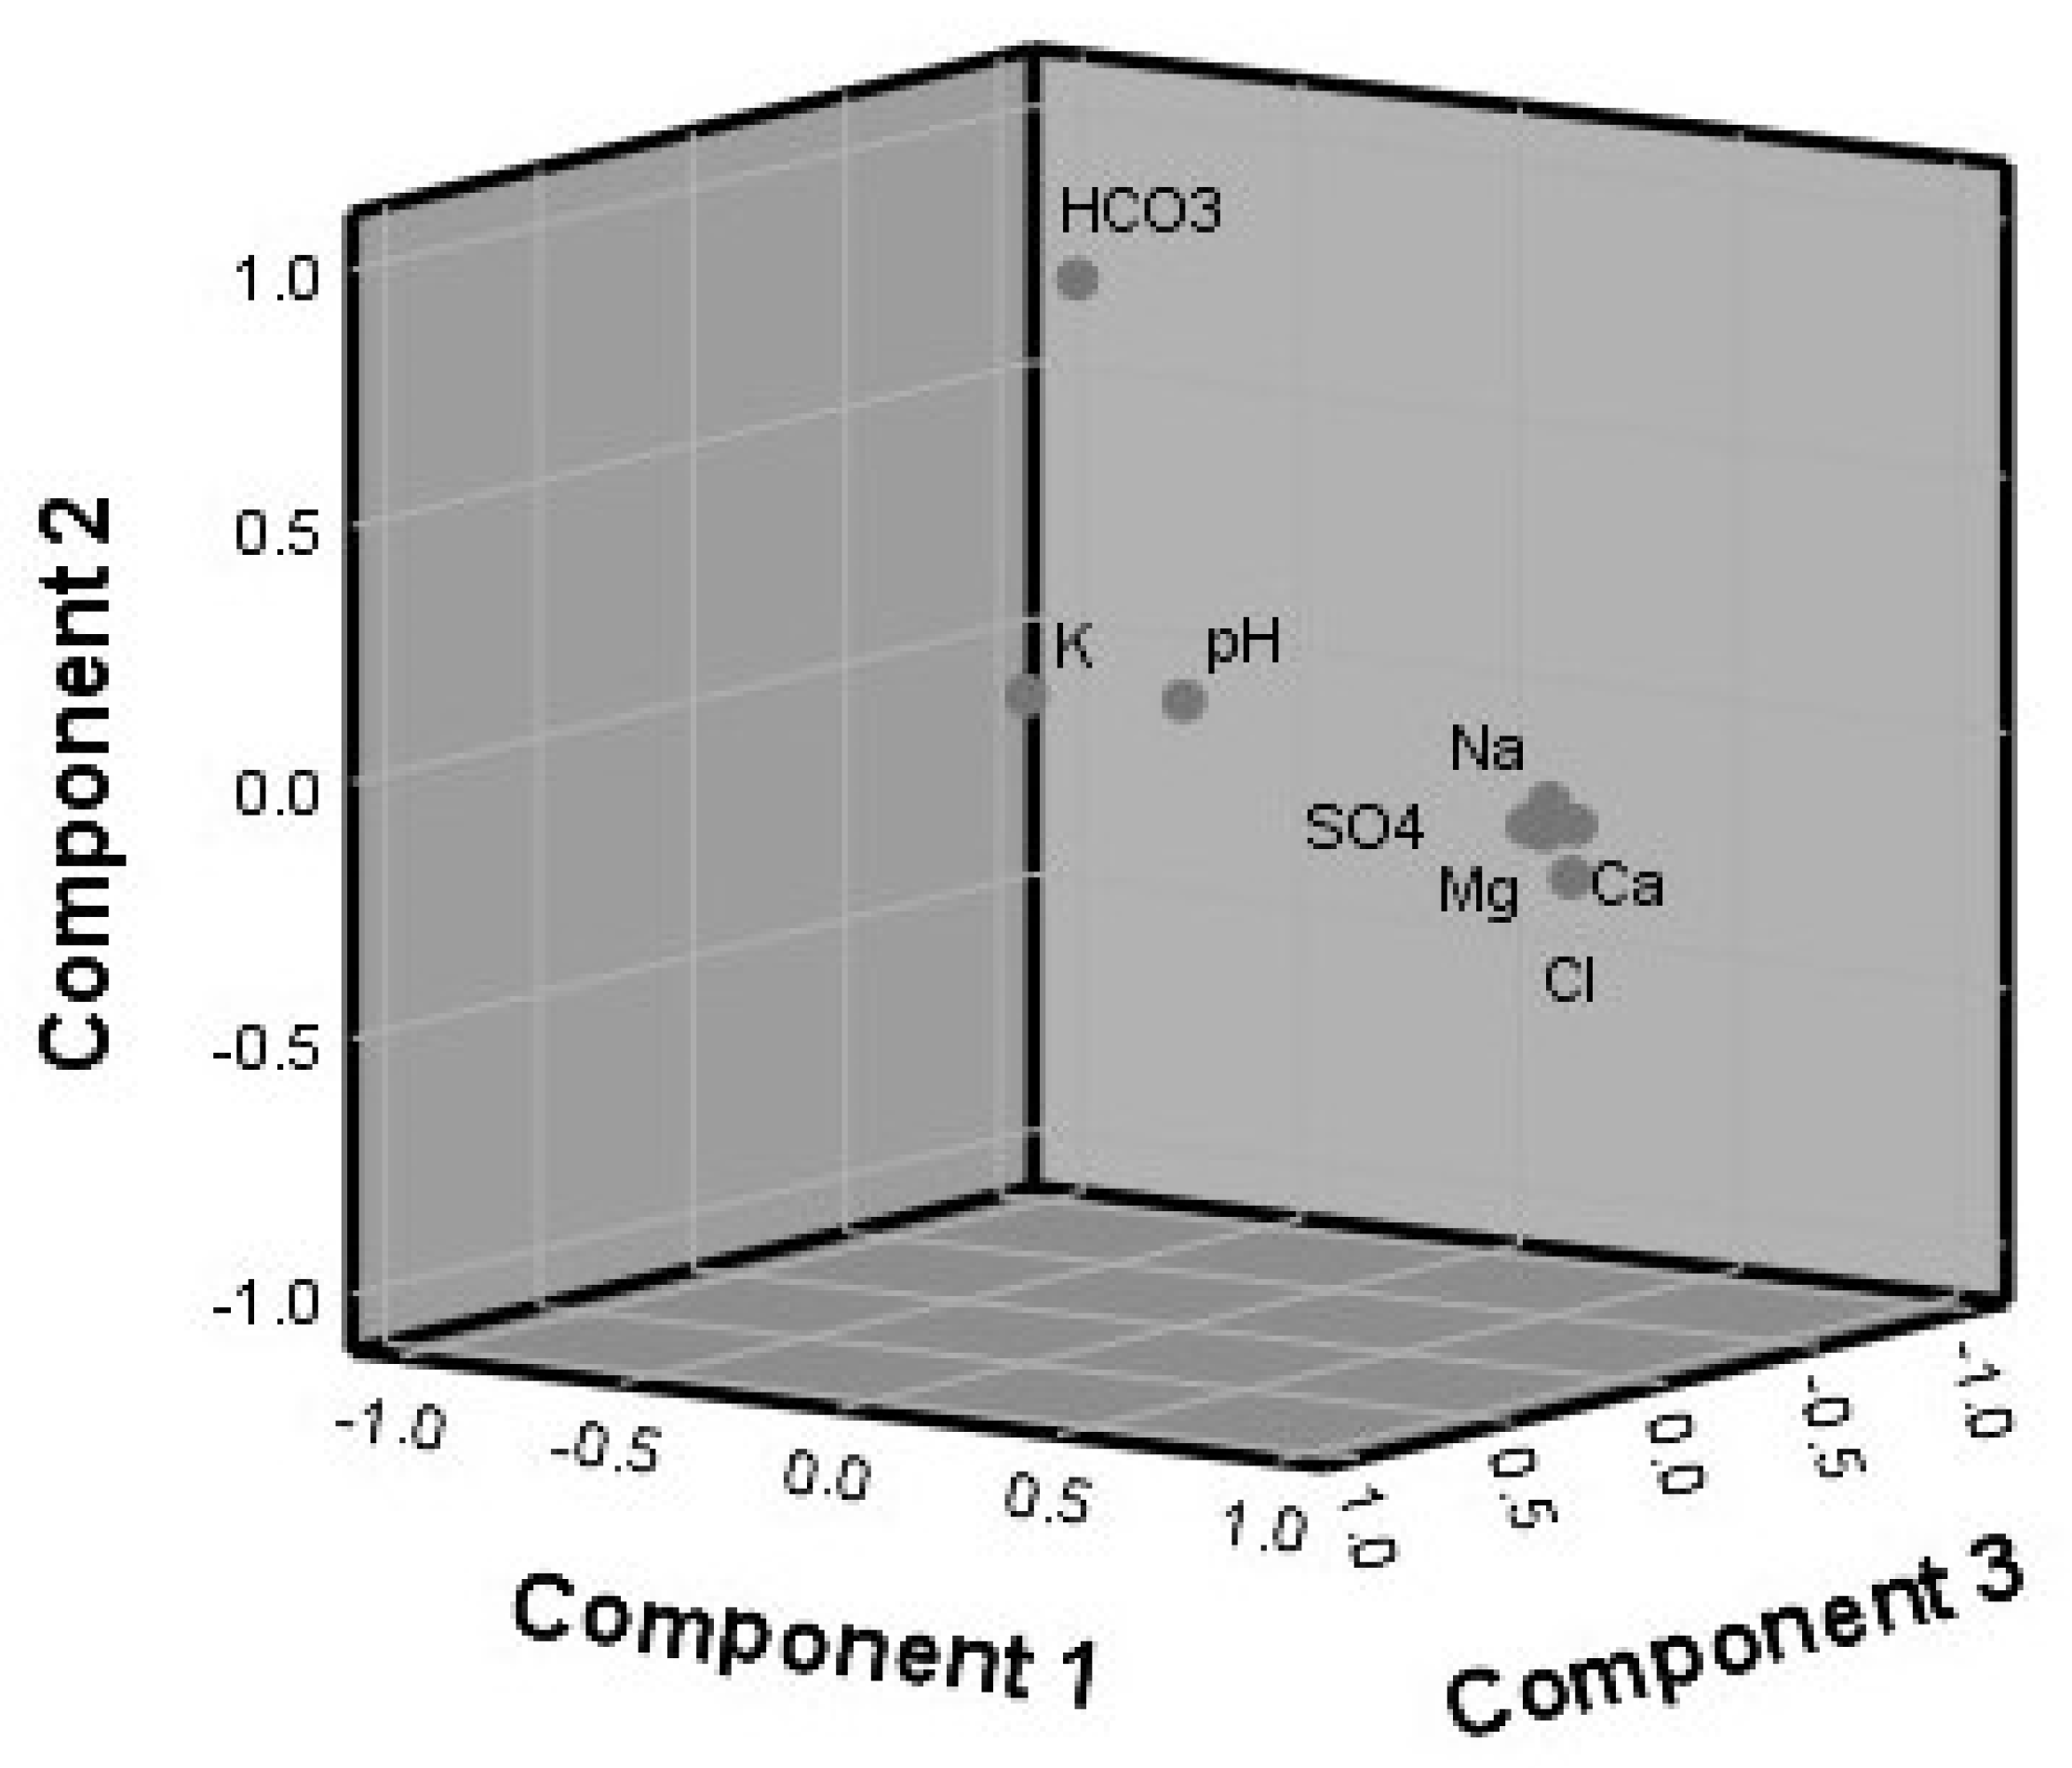
3.5. Principal Component Analysis (PCA) and Hierarchical Cluster Analysis (HCA)
The major goal of using such factor analysis methods is to explain the variance in the data and to discover the essential processes that drive the pumped water’s quality. The main components are shown in
Table 3 and
Figure 8. PC1 contains very substantial positive loadings for Ca
2+, Mg
2+, Na
+, Cl
−, SO
42−, and TDS, accounting for 64.8 percent of the variance. This implies that the main source of groundwater salinity is the dissolution of carbonate and evaporite minerals. PC2 and PC3 account for 16.7% and 10.4% of the total variation, respectively. PC2 had a lot of HCO
3− positive loadings, whereas PC3 had a lot of pH-positive loadings. This is due to the fact that in the case of groundwater salinity, both HCO
3− and pH are ineffective (
Table 3 and
Figure 8). The HCA analysis confirmed that Ca
2+, Mg
2+, Na
+, and Cl- are the primary components of TDS in pumped water, with these parameters grouped in one group (cluster A) and the HCO
3− and pH parameters clustered in group B, as indicated by HCA (
Figure 9).
4. Conclusions
Many activities, such as dissolution, interaction with rocks, and evaporation during flow paths, have a significant impact on groundwater chemistry. Carbonate minerals (calcite, dolomite, and aragonite) and evaporite minerals were undersaturated in the majority of groundwater samples, according to saturation indices (anhydrite, gypsum, halite, and sylvite). The positive chloro-alkaline indices imply that the alkali ions (Na+, k+) in groundwater are exchanged with earth alkaline ions (Ca2+ + Mg2+) in ambient sediments of solid surface materials. As a result, the earth’s alkaline ions increase, and the dominant carbonate mineral dissolution in the groundwater is noticed. The chloro-alkaline indices of minor groundwater samples were negative, indicating reverse exchange and an increase in alkali ions; thus, evaporite mineral dissolution is dominant in the groundwater. The majority of the samples were plotted in the rock dominance field and are fresh groundwater recharging from fresh surface water, as shown by the Gibbs diagram. The minor samples were saline groundwater, implying that the groundwater has been mixed with saline surface water, older deep water, and/or evaporites that were dissolved along the flow path. Carbonate and evaporite mineral dissolution were dominant in the groundwater samples. The findings showed that the groundwater is mostly recharged from surface water sources with Mg-HCO3 (67%), Na-HCO3 (28%), and Na-Cl (5%) water types, and the presence of bicarbonate ions in the groundwater. The alkali, earth alkaline elements, and sulphate ions are the key regulating variables affecting groundwater salinity. Groundwater in the western half of the research region is slightly saline and should not be used for residential purposes.
Author Contributions
Data curation, A.M. and A.A. (Ahmed Asmoay); Funding acquisition, F.A.; Investigation, A.M. and A.A. (Ahmed Asmoay); Methodology, A.A. (Ahmed Asmoay); Resources, F.A., A.A. (Ahmed Abdelrady) and A.O.; Software, F.A. and A.O.; Writing—original draft, A.M. and A.A. (Ahmed Asmoay); Writing—review & editing, A.M. and A.A. (Ahmed Abdelrady). All authors have read and agreed to the published version of the manuscript.
Funding
The authors extend their appreciation to the Abdullah Alrushaid for Earth Science Remote Sensing Research for funding.
Data Availability Statement
The data is available upon request from the authors.
Conflicts of Interest
The authors declare that they have no known competing financial interest or personal relationships that could have appeared to influence the work reported in this paper.
References
- Yousif, M.; El-Aassar, A.H.M. Rock-water interaction processes based on geochemical modeling and remote sensing applications in hyper-arid environment: Cases from the southeastern region of Egypt. Bull. Natl. Res. Cent. 2018, 42, 4. [Google Scholar] [CrossRef]
- Salman, A.S.; Asmoay, A.A.; El-Gohary, A.; Sabet, H. Evaluation of human risks of surface water and groundwater contaminated with Cd and Pb south of El-Minya Governorate, Egypt. Drink. Water Eng. Sci. 2019, 12, 23–30. [Google Scholar] [CrossRef] [Green Version]
- Mohamed, A.; Ahmed, E.; Alshehri, F.; Abdelrady, A. The Groundwater Flow Behavior and the Recharge in the Nubian Sandstone Aquifer System during the Wet and Arid Periods. Sustainability 2022, 14, 6823. [Google Scholar] [CrossRef]
- Mohamed, A.; Sultan, M.; Ahmed, M.; Yan, E.; Ahmed, E. Aquifer recharge, depletion, and connectivity: Inferences from GRACE, land surface models, and geochemical and geophysical data. Bulletin 2017, 129, 534–546. [Google Scholar] [CrossRef] [Green Version]
- Mohamed, A. Hydro-geophysical study of the groundwater storage variations over the Libyan area and its connection to the Dakhla basin in Egypt. J. Afr. Earth Sci. 2019, 157, 103508. [Google Scholar] [CrossRef]
- Mohamed, A. Gravity based estimates of modern recharge of the Sudanese area. J. Afr. Earth Sci. 2019, 163, 103740. [Google Scholar] [CrossRef]
- Mohamed, A. Gravity applications in estimating the mass variations in the Middle East: A case study from Iran. Arab. J. Geosci. 2020, 13, 364. [Google Scholar] [CrossRef]
- Mohamed, A. Gravity applications to groundwater storage variations of the Nile Delta Aquifer. J. Appl. Geophys. 2020, 182, 104177. [Google Scholar] [CrossRef]
- Taha, A.I.; Al Deep, M.; Mohamed, A. Investigation of groundwater occurrence using gravity and electrical resistivity methods: A case study from Wadi Sar, Hijaz Mountains, Saudi Arabia. Arab. J. Geosci. 2021, 14, 1–10. [Google Scholar] [CrossRef]
- Mohamed, A.; Gonçalvès, J. Hydro-geophysical monitoring of the North Western Sahara Aquifer System’s groundwater resources using gravity data. J. Afr. Earth Sci. 2021, 178, 104188. [Google Scholar] [CrossRef]
- Mohamed, A.; Eldeen, E.R.; Abdelmalik, K. Gravity based assessment of spatio-temporal mass variations of the groundwater resources in the Eastern Desert, Egypt. Arab. J. Geosci. 2021, 14, 1–15. [Google Scholar] [CrossRef]
- Mohamed, A.; Abdelrahman, K.; Abdelrady, A. Application of Time-Variable Gravity to Groundwater Storage Fluctuations in Saudi Arabia. Front. Earth Sci. 2022, 10, 873352. [Google Scholar] [CrossRef]
- Mohamed, A.; Al Deep, M.; Othman, A.; Taha Al Alshehri, F.; Abdelrady, A. Integrated Geophysical Assessment of ground-water potential in southwestern Saudi Arabia. Front. Earth Sci. 2022, 10, 937402. [Google Scholar] [CrossRef]
- Mohamed, A.; Al Deep, M. Depth to the bottom of the magnetic layer, crustal thickness, and heat flow in Africa: Inferences from gravity and magnetic data. J. Afr. Earth Sci. 2021, 179, 104204. [Google Scholar] [CrossRef]
- Mohamed, A.; Al Deep, M.; Abdelrahman, K.; Abdelrady, A. Geometry of the Magma Chamber and Curie Point Depth Beneath Hawaii Island: Inferences from Magnetic and Gravity Data. Front. Earth Sci. 2022, 10, 847984. [Google Scholar] [CrossRef]
- Hu, S.; Xiao, C.; Liang, X.; Cao, Y.; Wang, X.; Li, M. The influence of oil shale in situ mining on groundwater envi-ronment: A water-rock interaction study. Chemosphere 2019, 228, 384–389. [Google Scholar] [CrossRef]
- Zhang, Q.; Liang, X.; Xiao, C. The hydrogeochemical characteristic of mineral water associated with water-rock interaction in Jingyu County, China. Procedia Earth Planet. Sci. 2017, 17, 726–729. [Google Scholar] [CrossRef]
- Belkhiri, L.; Mouni, L.; Tiri, A. Water–rock interaction and geochemistry of groundwater from the Ain Azel aqui-fer. Alger. Environ. Geochem Health 2012, 34, 1–13. [Google Scholar] [CrossRef]
- Olea-Olea, S.; Escolero, O.; Mahlknecht, J.; Ortega, L.; Taran, Y.; Moran-Zenteno, D.J.; Zamora-Martinez, O.; Tadeo-Leon, J. Water-rock interaction and mixing processes of complex urban groundwater flow system subject to intensive exploitation: The case of Mexico City. J. South Am. Earth Sci. 2020, 103, 102719. [Google Scholar] [CrossRef]
- Appelo, C.A.J.; Postma, D. Geochemistry, Groundwater and Pollution; A. A. Balkema Publishers: London, UK, 2005. [Google Scholar]
- Asmoay, A.S.A. Hydrogeochemical Studies on the Water Resources and Soil Characteristics in the Western Bank of the River Nile between Abu Qurqas and Dayr Mawas, El Minya Governorate, Egypt. Ph.D. Thesis, Al-Azhar University, Cairo, Egypt, 2017. [Google Scholar]
- Eang, K.E.; Igarashi, T.; Kondo, M.; Nakatani, T.; Tabelin, C.B.; Fujinaga, R. Groundwater monitoring of an open-pit limestone quarry: Water-rock interaction and mixing estimation within the rock layers by geochemical and statistical analyses. Int. J. Min. Sci. Technol. 2018, 28, 849–857. [Google Scholar] [CrossRef]
- Ibrahim, R.G.M.; Korany, E.A.; Tempelc, R.N.; Gomaa, M.A. Processes of water–rock interactions and their im-pacts upon the groundwater composition in Assiut area, Egypt: Applications of hydrogeochemical and multivariate analy-sis. J. Afr. Earth Sci. 2019, 149, 72–83. [Google Scholar] [CrossRef]
- Nassria, S.M.; Lucasb, Y.; Schäferb, G.; Dridia, L.; Majdouba, R. Coupled hydrogeochemical modelling using KIRMAT to assess water-rock interaction in a saline aquifer in central-eastern Tunisia. Appl. Geochem. 2019, 102, 229–242. [Google Scholar] [CrossRef]
- Newman, C.P.; Poulson, S.R.; Hanna, B. Regional isotopic investigation of evaporation and water-rock interaction in mine pit lakes in Nevada, USA. J. Geochem. Explor. 2019, 210, 106445. [Google Scholar] [CrossRef]
- Temizel, E.H.; Gültekin, F.; Ersoy, A.F. Major, trace, and rare earth element geochemistry of the Ayder and İkizdere (Rize, NE Turkey) geothermal waters: Constraints for water–rock interactions. Geothermics 2020, 86, 101810. [Google Scholar] [CrossRef]
- Reghunath, R.; Murthy, T.R.S.; Raghavan, B.R. The utility of multivariate statistical techniques in hydrogeochemi-cal studies: An example from Karnataka, India. Water Res. 2002, 36, 2437–24442. [Google Scholar] [CrossRef]
- Kim, J.-H.; Kim, R.-H.; Lee, J.; Cheong, T.-J.; Yum, B.-W.; Chang, H.-W. Multivariate statistical analysis to identify the major factors governing groundwater quality in the coastal area of Kimje, South Korea. Hydrol. Process. 2004, 19, 1261–1276. [Google Scholar] [CrossRef]
- Peyraube, N.; Lastennet, R.; Denis, A.; Malaurent, P.; Villanueva, J.D. Interpreting CO2- SIc relationship to estimate CO2 baseline in limestone aquifers. Environ. Earth Sci. 2014, 72, 4207–4215. [Google Scholar] [CrossRef] [Green Version]
- Farnham, I.M.; Johannesson, K.H.; Singh, A.K.; Hodge, V.F.; Stetzenbach, K.J. Factor analytical approaches for evaluating groundwater trace element chemistry data. Anal. Chim. Acta 2003, 490, 123–138. [Google Scholar] [CrossRef]
- Mahlknecht, J.; Steinich, B.; de León, I.N. Groundwater chemistry and mass transfers in the Independence aquifer, central Mexico, by using multivariate statistics and mass-balance models. Environ. Geol. 2004, 45, 781–795. [Google Scholar] [CrossRef]
- Love, D.; Hallbauer, D.; Amos, A.; Hranova, R. Factor analysis as a tool in groundwater quality management: Two southern African case studies. Phys. Chem. Earth Parts A/B/C 2004, 29, 1135–1143. [Google Scholar] [CrossRef]
- Said, R. The Geological Evolution of the River Nile; Springer: Berlin/Heidelberg, Germany, 1981. [Google Scholar]
- Said, R. The Geology of Egypt; Balkema A.A. Publishers: London, UK, 1990; 734p. [Google Scholar]
- Waleed, S.S.; El-Monaim, A.A. Evaluation of groundwater aquifer in the area between el-qusiya and manfalut using vertical electric soundings (ves) technique. JES. J. Eng. Sci. 2009, 37, 1193–1207. [Google Scholar] [CrossRef]
- Sadek, M.A. Isotopic criteria for upward leakage in the alluvial aquifer in north El Minia district. Egypt. Ann. Geol. Surv. Egypt 2001, XXIV, 585–596. [Google Scholar]
- Conoco. Egyptian general authority for petroleum. In Scale (1:500,000) between El-Minia and Sohag; Conoco: Ponca City, OK, USA, 1987. [Google Scholar]
- APHA. Standard Methods for the Examination of Water and Wastewater, 19th ed.; American Public Health Association: Washington, DC, USA, 1995. [Google Scholar]
- Zaidi, F.K.; Mogren, S.; Mukhopadhyay, M.; Ibrahim, E. Evaluation of groundwater chemistry and its impact on drinking and irrigation water quality in the eastern part of the Central Arabian graben and trough system, Saudi Arabia. J. Afr. Earth Sci. 2016, 120, 208–219. [Google Scholar] [CrossRef]
- Deutsch, W.J. Groundwater Geochemistry: Fundamentals and Applications to Contamination; CRC Press: Boca Raton, FL, USA, 1997. [Google Scholar]
- Wang, H.; Jiang, X.-W.; Wan, L.; Han, G.; Guo, H. Hydrogeochemical characterization of groundwater flow systems in the discharge area of a river basin. J. Hydrol. 2015, 527, 433–441. [Google Scholar] [CrossRef]
- Gomaah, M.; Al-Bassam, A. Geochemistry and Origin of the Hyper Salinity of Groundwater in Wasia-Biyadh Aquifer, Saudi Arabia. J. Geosci. Environ. Prot. 2021, 9, 1–14. [Google Scholar] [CrossRef]
- Schoeller, H. Geochemistry of Groundwater. Chapter 15. In Groundwater Studies an International Guide for Research and Practice; UNESCO: Paris, France, 1977; pp. 1–18. [Google Scholar]
- Collins, A.G. Geochemistry of Oilfield Waters; Elsevier: Amsterdam, The Netherlands, 1975; 296p. [Google Scholar]
- Gibbs, R.J. Mechanisms controlling World’s water chemistry. Science 1970, 170, 1088–1090. [Google Scholar] [CrossRef]
- Gao, Z.; Liu, J.; Feng, J.; Wang, M.; Wu, G. Hydrogeochemical Characteristics and the Suitability of Groundwater in the Alluvial-Diluvial Plain of Southwest Shandong Province, China. Water 2019, 11, 1577. [Google Scholar] [CrossRef] [Green Version]
- Marandia, A.; Shand, P. Groundwater chemistry and the Gibbs Diagram. Appl. Geochem. 2018, 97, 209–212. [Google Scholar] [CrossRef]
- Fatima, S.U.; Khan, M.A.; Siddiqui, F.; Mahmood, N.; Salman, N.; Alamgir, A.; Shaukat, S.S. Geospatial assessment of water quality using principal components analysis (PCA) and water quality index (WQI) in Basho Valley, Gilgit Baltistan (Northern Areas of Pakistan). Environ. Monit. Assess. 2022, 194, 151. [Google Scholar] [CrossRef]
- Granato, D.; Santos, J.S.; Escher, G.B.; Ferreira, B.L.; Maggio, R.M. Use of principal component analysis (PCA) and hierarchical cluster analysis (HCA) for multivariate association between bioactive compounds and functional properties in foods: A critical perspective. Trends Food Sci. Technol. 2018, 72, 83–90. [Google Scholar] [CrossRef]
- SPSS Statistical Tool, Version 25. IBM SPSS Statistics for Windows. IBM Corp.: Armonk, NY, USA, 2021.
- El-Anwar, E.A.A.; Mekky, H.S.; Salman, S.A.; Elnazer, A.A.; Wahab, W.A.; Asmoay, A.S. Mineralogical and petrographical studies of agricultural soil, Assiut Governorate, Egypt. Bull. Natl. Res. Cent. 2019, 43, 30. [Google Scholar] [CrossRef]
| Publisher’s Note: MDPI stays neutral with regard to jurisdictional claims in published maps and institutional affiliations. |
© 2022 by the authors. Licensee MDPI, Basel, Switzerland. This article is an open access article distributed under the terms and conditions of the Creative Commons Attribution (CC BY) license (https://creativecommons.org/licenses/by/4.0/).


