1. Introduction
Urban land use patterns are linked to transportation, which nowadays has an increasing and dominant impact on air pollution. Everyday life decisions related to travel behavior, both by private [
1,
2] and public transportation [
3,
4], depends, amongst other factors, on urban form.
A systematic literature review on the interaction between land use and travel behavior [
5], as well as on the relationship between travel behavior and urban structure [
6], concludes that the most popular assumptions and beliefs about the relationship are generally supported by empirical studies. In that sense [
7] provides empirical evidence that good urban planning can successfully influence travel behavior. Land use and urban transport interaction [
8] represents policy challenges [
9] related to everyday lives travel behavior [
10].
Urban public transport is a fundamental aspect in shaping the spirit and habitat of each city [
11]. Due to its relevance in land use pattern, everyday lives, and city form, urban public transport is undergoing a continuous process of modernization in terms of management, planning, and technology, which has been well documented in the recent history of public transport [
12].
Historically, transport technology and the associated transport costs have always been among the dominant determinants of urban location and form [
13], nevertheless in current time the priority focuses on energy use and CO
2 emissions of urban passenger transport [
14].
In addition to urban form, which is the physical characteristics of a city, the determination of public transport alternatives is also based on management decisions, related to budgetary issues, the efficiency of alternatives, and the environmental awareness of policy makers.
The planning of urban public transport has a significant impact on shaping land use patterns, air pollution and welfare [
15]. Therefore, political and citizen awareness related to the strategic importance of green public transport in urban transport is growing and leading to a transformation in terms of low energy consumption, urban viability and livability of cities [
16,
17].
Current air pollution levels remain dangerously high in both developing and developed countries [
18]. According to [
19], 9 out of 10 people breathe air containing high levels of pollutants. One of the reasons for the previous figures is that at the present time 55 percent of the world’s population is residing in urban areas, and by 2050, 68% of the world’s population is expected to be urban [
20].
In Europe, in particular, a large majority of citizens live in an urban environment, with more than 60% living in urban areas of more than 10,000 inhabitants. Increasing urbanization and population concentration in Europe leads to high levels of air pollution. Urban mobility in Europe accounts for 40% of all CO
2 emissions from road transport and up to 70% of other transport pollutants [
21].
Even though air quality in Europe has improved over recent decades, the levels of air pollutants still exceed European Union standards and the most stringent World Health Organization guidelines [
22].
The urban structure can affect city sustainability from an air quality perspective [
23], and the stronger relationship between trends in transport pollution and urban land use has been well documented [
24]. In this sense, the urban form has been identified as a crucial dimension of sustainable cities [
25].
The analysis of energy use in urban transport and associated emissions from an urban land use planning perspective [
26], suggests the implementation of integrated urban models and policy-sensitive analytical tools. Therefore, the investigation of how urban policy makers can reduce negative impacts on air quality is an emerging priority in both empirical and theoretical research.
The transport sector is one of the largest contributors of pollutant emissions [
27], and more specifically, individual motorized transport causes 59% of greenhouse gas emissions [
28]. Compared to private vehicles, public transportation is reducing annual emissions of pollutants that create smog, volatile organic compounds, and nitrogen oxides [
29].
Public road transport is as a competitive alternative to the private cars, which are the major source of air pollutants. Nevertheless, not all public road transport vehicles are equally effective in mitigating pollutant emissions [
30].
The emissions from public road transportation depend on the type of fuel technologies used by the vehicles. Most urban transportations systems use a combination of the main types of buses available on the market: CNG, diesel, diesel hybrid, plug-in electric, and induction electric [
31].
Therefore, the objective of this study is to identify which type of bus propulsion engine technology is the most efficient in terms of air pollution and therefore the most suitable for use as an urban public road transport vehicle.
European cities have similar pollution problems [
32], the common goal of reducing air pollution from public transportation systems [
33], and similar vehicle alternatives by fuel type in the European urban bus market [
34].
According to [
34] Madrid ranks 5 out of 75 European cities in terms of fleet size, and additionally this city uses 45 different types of vehicles [
35] including all main vehicle alternatives by fuel type available in the global urban bus market [
36]. Hence the capital of Spain has a sufficiently large and heterogeneous fleet of urban public buses, and it has an extended urban form, which makes it convenient as a case study for which the results can be extrapolated to other metropolises.
The urban bus transport fleets of European cities, which have a heterogeneous mix of vehicles using different fuel alternatives, are in a process of migration from economically inefficient and highly polluting vehicles to more economically efficient and environmentally friendly buses [
37].
This is a relevant and consolidated topic of research, which subject has been addressed extensively in recent years, including a profusion of specialize publications on the topic of the public transport systems pollution problems [
38], and specifically those produced by buses [
39,
40,
41,
42,
43] in Spain [
44,
45] and in particular in Madrid [
46,
47].
Although previous academic literature has studied the air pollution effects of public buses considering the propulsion technologies of their engines and the type of fuel used by these vehicles, as well as the comparison of environmental consequences of using different types of fuel propulsion has been extensively studied [
48,
49,
50,
51,
52], assessing their environmental impact [
53], a research gap has been identified in relation to the application of data envelopment analysis on the efficiency of urban public road transport in terms of air pollution.
The role of urban public road transport to mitigate local air pollutants, such as nitrogen oxides (NO
x) and particulate matter (PM10 and PM2.5), is relevant [
54] and of growing importance in the political priorities of Europe’s most important municipalities [
55].
With the Paris climate agreement in place, the EU is more committed than ever to the global transition to a low-carbon economy, and has committed to reducing carbon emissions, by improving the transport system, and more specifically public road transport, through the declaration of intent on promoting the large-scale deployment of clean and alternative fuel buses in Europe, making them cleaner, more energy efficient, and more sustainable [
56].
The main environmental goal of Europe is represented by the reduction of the global greenhouse gas emission, and the transport sector plays a main role in the achievement of this objective. In fact, the European Commission proposed a reduction of 60% in greenhouse gas emissions from transport by 2050, as measured against the 1990 levels [
57].
Public policy objectives related to the sustainability have been in the agenda of international organizations since 1987 [
58]. The ongoing more relevant global commitment is the 2030 Agenda for Sustainable Development [
59], which includes two targets, 11.2 and 11.6, underlining the effects of urban transport on sustainability.
The target 11.2 is related to “affordable and sustainable transport systems”, states that “by 2030, provide access to safe, affordable, accessible and sustainable transport systems for all, improving road safety, notably by expanding public transport, with special attention to the needs of those in vulnerable situations, women, children, persons with disabilities and older persons, meanwhile the target 11.6, that refers to “reduce the environmental impact of cities”, states that “by 2030, reduce the adverse per capita environmental impact of cities, including by paying special attention to air quality and municipal and other waste management”.
Achieving the targets set in international agreements, such as the Paris Agreement [
60] and the Kyoto Protocol [
61], as well as respecting the air quality recommendations of international bodies, is not only a moral commitment of European cities, but also from a practical point of view it is necessary in order to avoid sanctions imposed by the European Commission for non-compliance with World Health Organization and European Commission recommendations.
European Commission request the member states to comply with World Health Organization air quality requirements [
62], taking an active role on monitoring and forcing Member states to reduce local levels of air pollution to keep EU legislation on ambient air quality [
63]. In case pollutant particles exceed the legal threshold, and no effective measures to reduce air pollution are implemented, then European Commission refer countries to the Court of Justice of the EU, as it happened to Bulgaria and Spain on 2019 [
64].
Public transport is a very common means of transport in Spain, although its use varies considerably depending on the urban form. Specifically, Madrid residents use public transport 34% of journeys made in the city, with an average annual use per citizen of 244 times a year [
65].
After the aforementioned sanctions, the city council of Madrid has made a firm commitment to alternative fuels in compliance with the Euro V European regulations on emission levels of air pollutants, resulting on a seventy-two percent green public transport buses fleet [
66].
Green fleet is a broad concept, which includes vehicles propelled by different types of fuels and different engine technologies. In the case of Madrid its 72% green fleet is made up 42% of natural gas buses, 29% of Euro V diesel buses, and 1% of electric buses. Nevertheless, not all green fleet buses are equally effective in terms of air pollution.
Hence, the aim of this research is to compare, under a ceteris paribus condition, the main fuel alternative technologies available in the urban public buses market, that is diesel, diesel hybrid, CNG, plug-in electric, and induction electric, aiming to identify which one is the most efficient in terms of air pollution and therefore environmentally suitable for use in public road transport systems.
For that purpose this study proposes a novel and consistent data envelopment analysis, which objective is to identify which Madrid urban public transport vehicle is the most efficient in terms of air pollution.
Therefore, this study raises the following research question:
- -
Research Question: Which type of alternative fuel technology for urban public buses is the most efficient in terms of air pollution?
The result of previous research question can be useful and unambiguous evidence to support public administrations decisions regarding sustainable urban transport policies.
The rest of this paper is organized as follows.
Section 2 presents the data source and methodological description. This section explains the data envelopment analysis model and formulas.
Section 3 includes the model results and discussion.
Section 4 offers the main conclusions and recommendations of the study, including results implications for management, research limitations and future lines of research.
2. Materials and Methods
Diviz software [
67] has been used to implement the proposed data envelopment analysis, from now on DEA [
68].
The source of the used data has been published by the Madrid City Council in two of its entities: the Empresa Municipal de Transportes de Madrid (Madrid urban public road transport company) [
69] and the Consorcio Regional de Transportes de Madrid (Regional Transport Consortium of Madrid) [
70].
In order to determine the model criteria weights, a panel of 20 experts participated in a Delphi method [
71].
This research studies the efficiency of urban public road transport vehicles in terms of air pollution. The efficiency, from an environmental point of view, of the five main different types of public buses used in the City of Madrid (CNG, diesel, diesel hybrid, plug-in electric, and induction electric), will be measured using the DEA technique.
2.1. Materials
The analysis of which types of buses are efficient from the point of view of pollutant emissions, by applying a DEA model, requires input and output data.
Specifically, it is analysed which engines are able to cover the same kilometers while emitting fewer pollutant gases. Therefore the output data or the service indicator used is the number of kilometers per vehicle for each type of engine, and the input data or the pollutant emission indicators are the NOx (kg), PM (kg) and CO2 (kg) emissions for each engine type.
A particular bus line [
72] has been selected to apply the suggested DEA model to a real case of study. For this analysis, the bus line 21 was chosen as a representative sample of the urban bus lines in the city of Madrid for three reasons: (a) it carries out a long-term route that crosses the entire capital, combining light traffic areas with heavy traffic areas in the same proportion; (b) it has a route with an average distance of 9.21 km per journey that is on the average of all routes; (c) to cover this line, buses of all the technologies included in our study are being used. This line, operating 18 h daily during one year of service, will have unequal resource requirements caused by differences in range, engine performance and refuelling time, depending on the type of fuel used by each type of vehicle. Therefore the required number of vehicles will be different, the distance travelled will be different on the same route, and the total time spent will also be different.
On one hand induction electric vehicles take 20 min longer than other buses to complete a full journey, because they must recharge their batteries at bus terminals, which forces them to stand still for 10 min on each outbound journey. On the other hand CNG, diesel, and diesel hybrid vehicles have the same requirements in terms of range, but plug-in and induction electric vehicles have a maximum range of 155 km without refuelling, so these buses cannot provide a full-day service and therefore more vehicles are needed due to their limited range.
According to the aforementioned limitations of different alternatives,
Table 1 shows the data requirements by type of fuel of one particular line during one year of service.
Table 2, based on
Table 1 data, shows the kilometers travelled divided by the number of vehicles, which are the output of the model.
Additionally, and based on Madrid City Council data, the following table shows the pollutant emission indicators NOx (kg), PM (kg) and CO2 (kg) emissions for each DMU or vehicle alternative, which are the input data of the model.
The
Table 2 resumes the information needed for the DEA method model, which will be used to assign technical efficiency to each vehicle type, named as DMU alternative.
2.2. Methods
The DEA is an efficiency measurement technique based on obtaining an efficiency frontier from the set of observations considered without the estimation of any production function, i.e., without the need to know any form of functional relationship between inputs and outputs.
DEA attempts to optimise the efficiency measure of each unit analysed to create an efficient frontier based on the Pareto criterion, allowing the use of multiples inputs and outputs without imposing any functional form on the data or making assumptions of inefficiency.
Using DEA, the efficient frontier is the benchmark against which the relative performance of different types of engines is measured. The engines that form the efficient frontier use a minimum amount of inputs to produce the same amount of outputs.
The distance to the efficient frontier represents the measure of efficiency or lack thereof.
Basic DEA model, called CCR, was firstly applied in 1978 [
73]. The relative efficiency of a decision making unit, from now on DMU, is calculated as the ratio between the weighted sum of outputs and the weighted sum of inputs.
The weights are determined by linear programming so that the DMU maximises its efficiency value.
Let
be the efficiency score of the observed
. Let
,
be the outputs and
,
the inputs used to compute the efficiency, and
the total number of DMUs (
. Then, the relative efficiency of
is calculated as:
where
and
are the non-negative weights. If the condition that the efficiency be less or equal than 1 is imposed, then it is obtained the classical CCR model under the Constant Return to Scale (CRS) assumption:
The transformation developed by [
73] for linear fractional programming selects a concrete weight solution for which
and leads to the following linear problem:
DEA solves different LP problems for a set of DMUs.
A DMU is efficient if its efficiency score is equal to one and there exists at least one optimal solution with non-zero weights.
The work in [
74] proposed a version of the CCR model with VRS, or variable returns to scale, which is commonly known as the BCC model, and use to be applied for situations where the CRS assumption is not met.
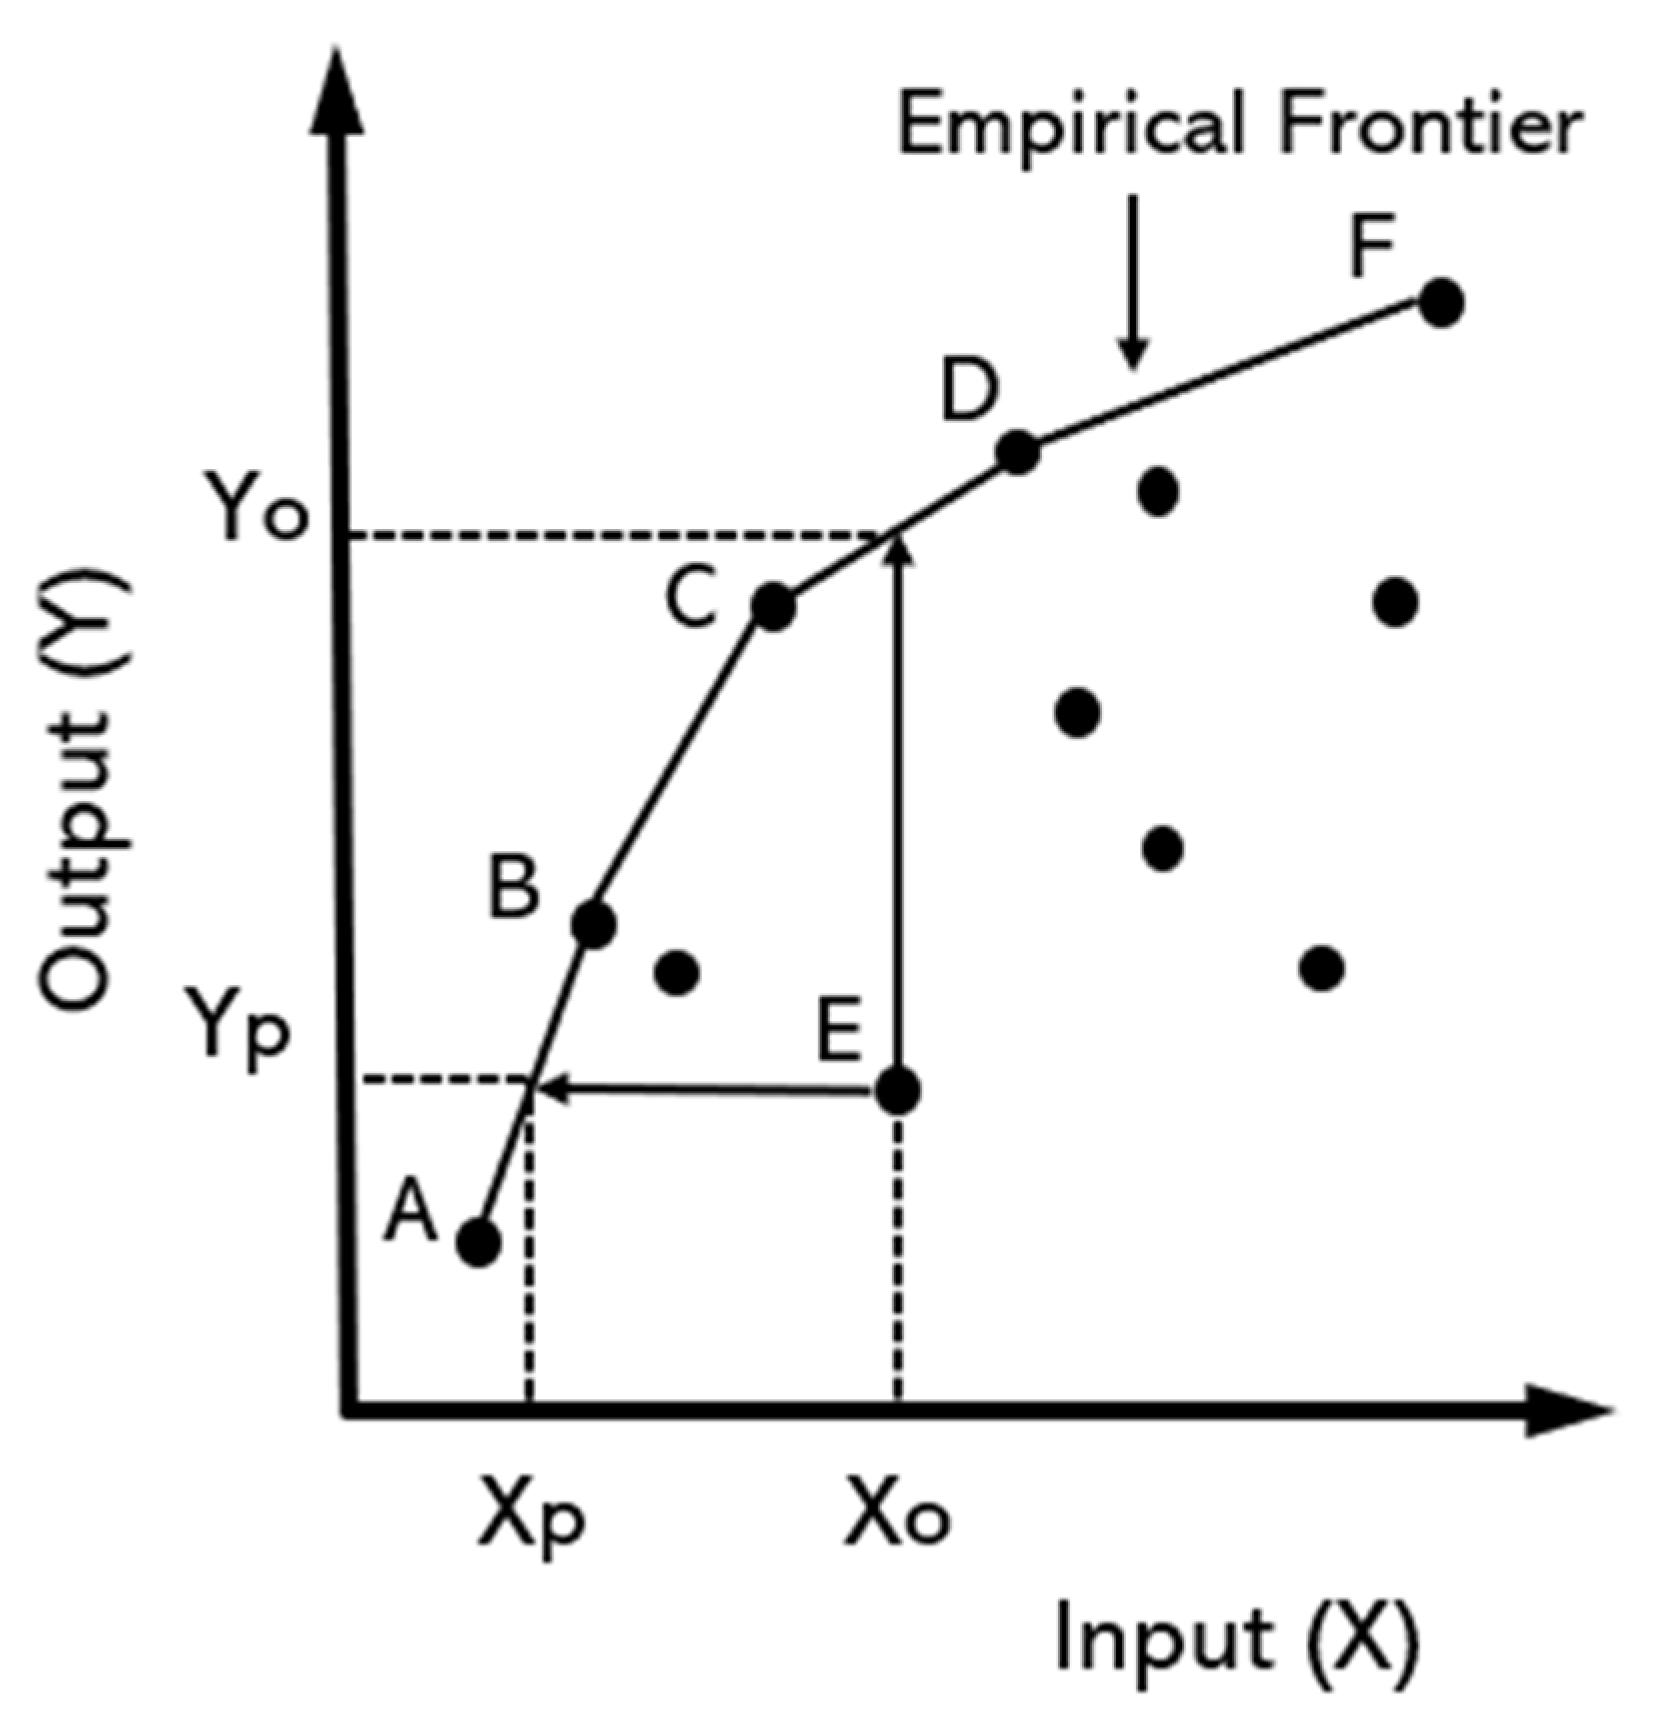
Figure 1 shows graphically the interpretation of DEA results. As it is shown best practice DMUs are A, B, C, D and F. Peer groups for DMU E are input minimization (A, B) and output maximization (C, D). The efficiency of DMU E in input minimization is Xp/Xo, and in the output maximization is Yo/Yp.
There is sufficient evidence in the literature that the number of DMUs must be greater than the number of inputs and outputs, although there is no fixed rule as to the ratio [
75] pointed out that there are situations where a significant number of DMUs are in fact efficient, and in some cases, the population size is small and does not permit one to add actual DMUs beyond a certain point.
In addition, as it is graphically represented, targets for DMU E are the two projections onto the efficient frontier. This research implemented the classical DEA model incorporating weight restrictions to overcome two model problems.
The first problem has to do with the number of inputs and outputs considered in the case study. The number of inputs and outputs considered in a DEA influences the number of efficient DMUs, in this case types of engines or bus alternatives. The higher the number of inputs and outputs, the higher the number of efficient DMUs.
The second problem has to do with the variability of the weights obtained in the DEA. The original DEA proposal provides for complete freedom of variation in the weights, which puts the DMU being evaluated in the best possible light.
Without the possibility to introduce weight constraints, a total flexibility of the weights is allowed. This can lead to the identification of a DMU with unrealistically efficient weighting behavior.
Problems arising from full weight flexibility in the DEA model are usually addressed by incorporating weight restrictions.
Hence, to solve the two problems mentioned above, restrictions on the weights have been introduced. In particular, Assurance Regions (AR), which impose restrictions on the ratios between the weights of inputs and/or outputs, will be imposed on the inputs.
The DEA-CCR-efficiency module of Diviz software has been used to compute efficiency scores for the given DMUs (vehicle types) using the proposed CCR data envelopment analysis model.
The number of inputs and outputs considered in the DEA model influences the number of efficient alternatives, in this case types of engines or bus alternatives. The higher the number of inputs and outputs, the higher the number of efficient alternatives.
In order to avoid unrealistic weights appearing that allow some DMU to seem as efficient, a panel of twenty experts has been consulted to determine the model criteria weights.
For that purpose, the commonly used Delphi method [
71,
76] has been applied to determine the weights of the criteria. The Delphi method produces a consensus on the average value attributed to each criterion. The selected group of experts were professionals or scholars of the transport industry (45%) or energy in transport (35%) or both (20%), with at least three years’ experience.
Two rounds of individual online consultation were needed for achieving agreement on the importance of the weights of the criteria.
In the second consultation the mean values of first round answers were communicated to experts before their second response.
Table 3 shows the mean weights determined by the group of experts to each criterion, as well as the standard deviation, the first-round coefficient of variation, the second-round coefficient of variation, and the absolute difference between the coefficients of variation of the two rounds.
From the information provided by the Delphi and considering the values of the mean and standard deviation, the following restrictions have been imposed on weights of the inputs:
where:
Previous restrictions will be hereafter named as “Set 1 of restrictions”.
3. Results and Discussion
The DEA method model has been implemented by using the Diviz software.
Figure 2 shows the Diviz workflow to implement the DEA model with restrictions over the weights [
77].
Table 4 shows the result of the analysis of which types of buses are efficient from the point of view of pollutant emissions, by applying the previous DEA model with “Set 1 of restrictions”, to assess which engines are able to cover the same kilometers while emitting fewer pollutant gases.
In order to obtain more accurate results, it has been decided to include more restrictive conditions on the weights based on the relationships that exist between the mean values assigned by the experts to the weights:
The previous more restrictive conditions will be hereafter named as “Set 2 of restrictions”. By applying these conditions, the solution provided by DEA model is shown in the
Table 5.
According to DEA model theory [
68] a DMU will be efficient if the efficiency value is equal to 1 with non-zero weights.
As can be seen in
Table 4 and
Table 5, in both cases the efficient solution is the plug-in electric motor. Hence, the only efficient engine, from the point of view of pollutant emissions, is the plug-in electric.
This means that it is not worth investing in induction electric vehicles from a pollution point of view because they are not efficient.
In addition, the infrastructure required to operate induction electric vehicles is complex in built-up areas.
A graphical representation of the DEA model solutions has been created, aiming to provide a clearer and visual solution. Two axes have been considered: one represents the output (which is intended to be maximized) and the other one represents the input (which is intended to be minimized).
To construct a single function that represents the three initial inputs, a principal component analysis, from now on PCA, has been performed. The values for this PCA of the inputs are shown in the
Table 6.
The
Table 7 shows that the first component, which has been denoted F1, accumulates 95.975% of the total information. Therefore, without loss of generality, it is possible to work with it to graphically represent the inputs on a plane.
In that case, the input and output values for each DMU are as shown in the
Table 8.
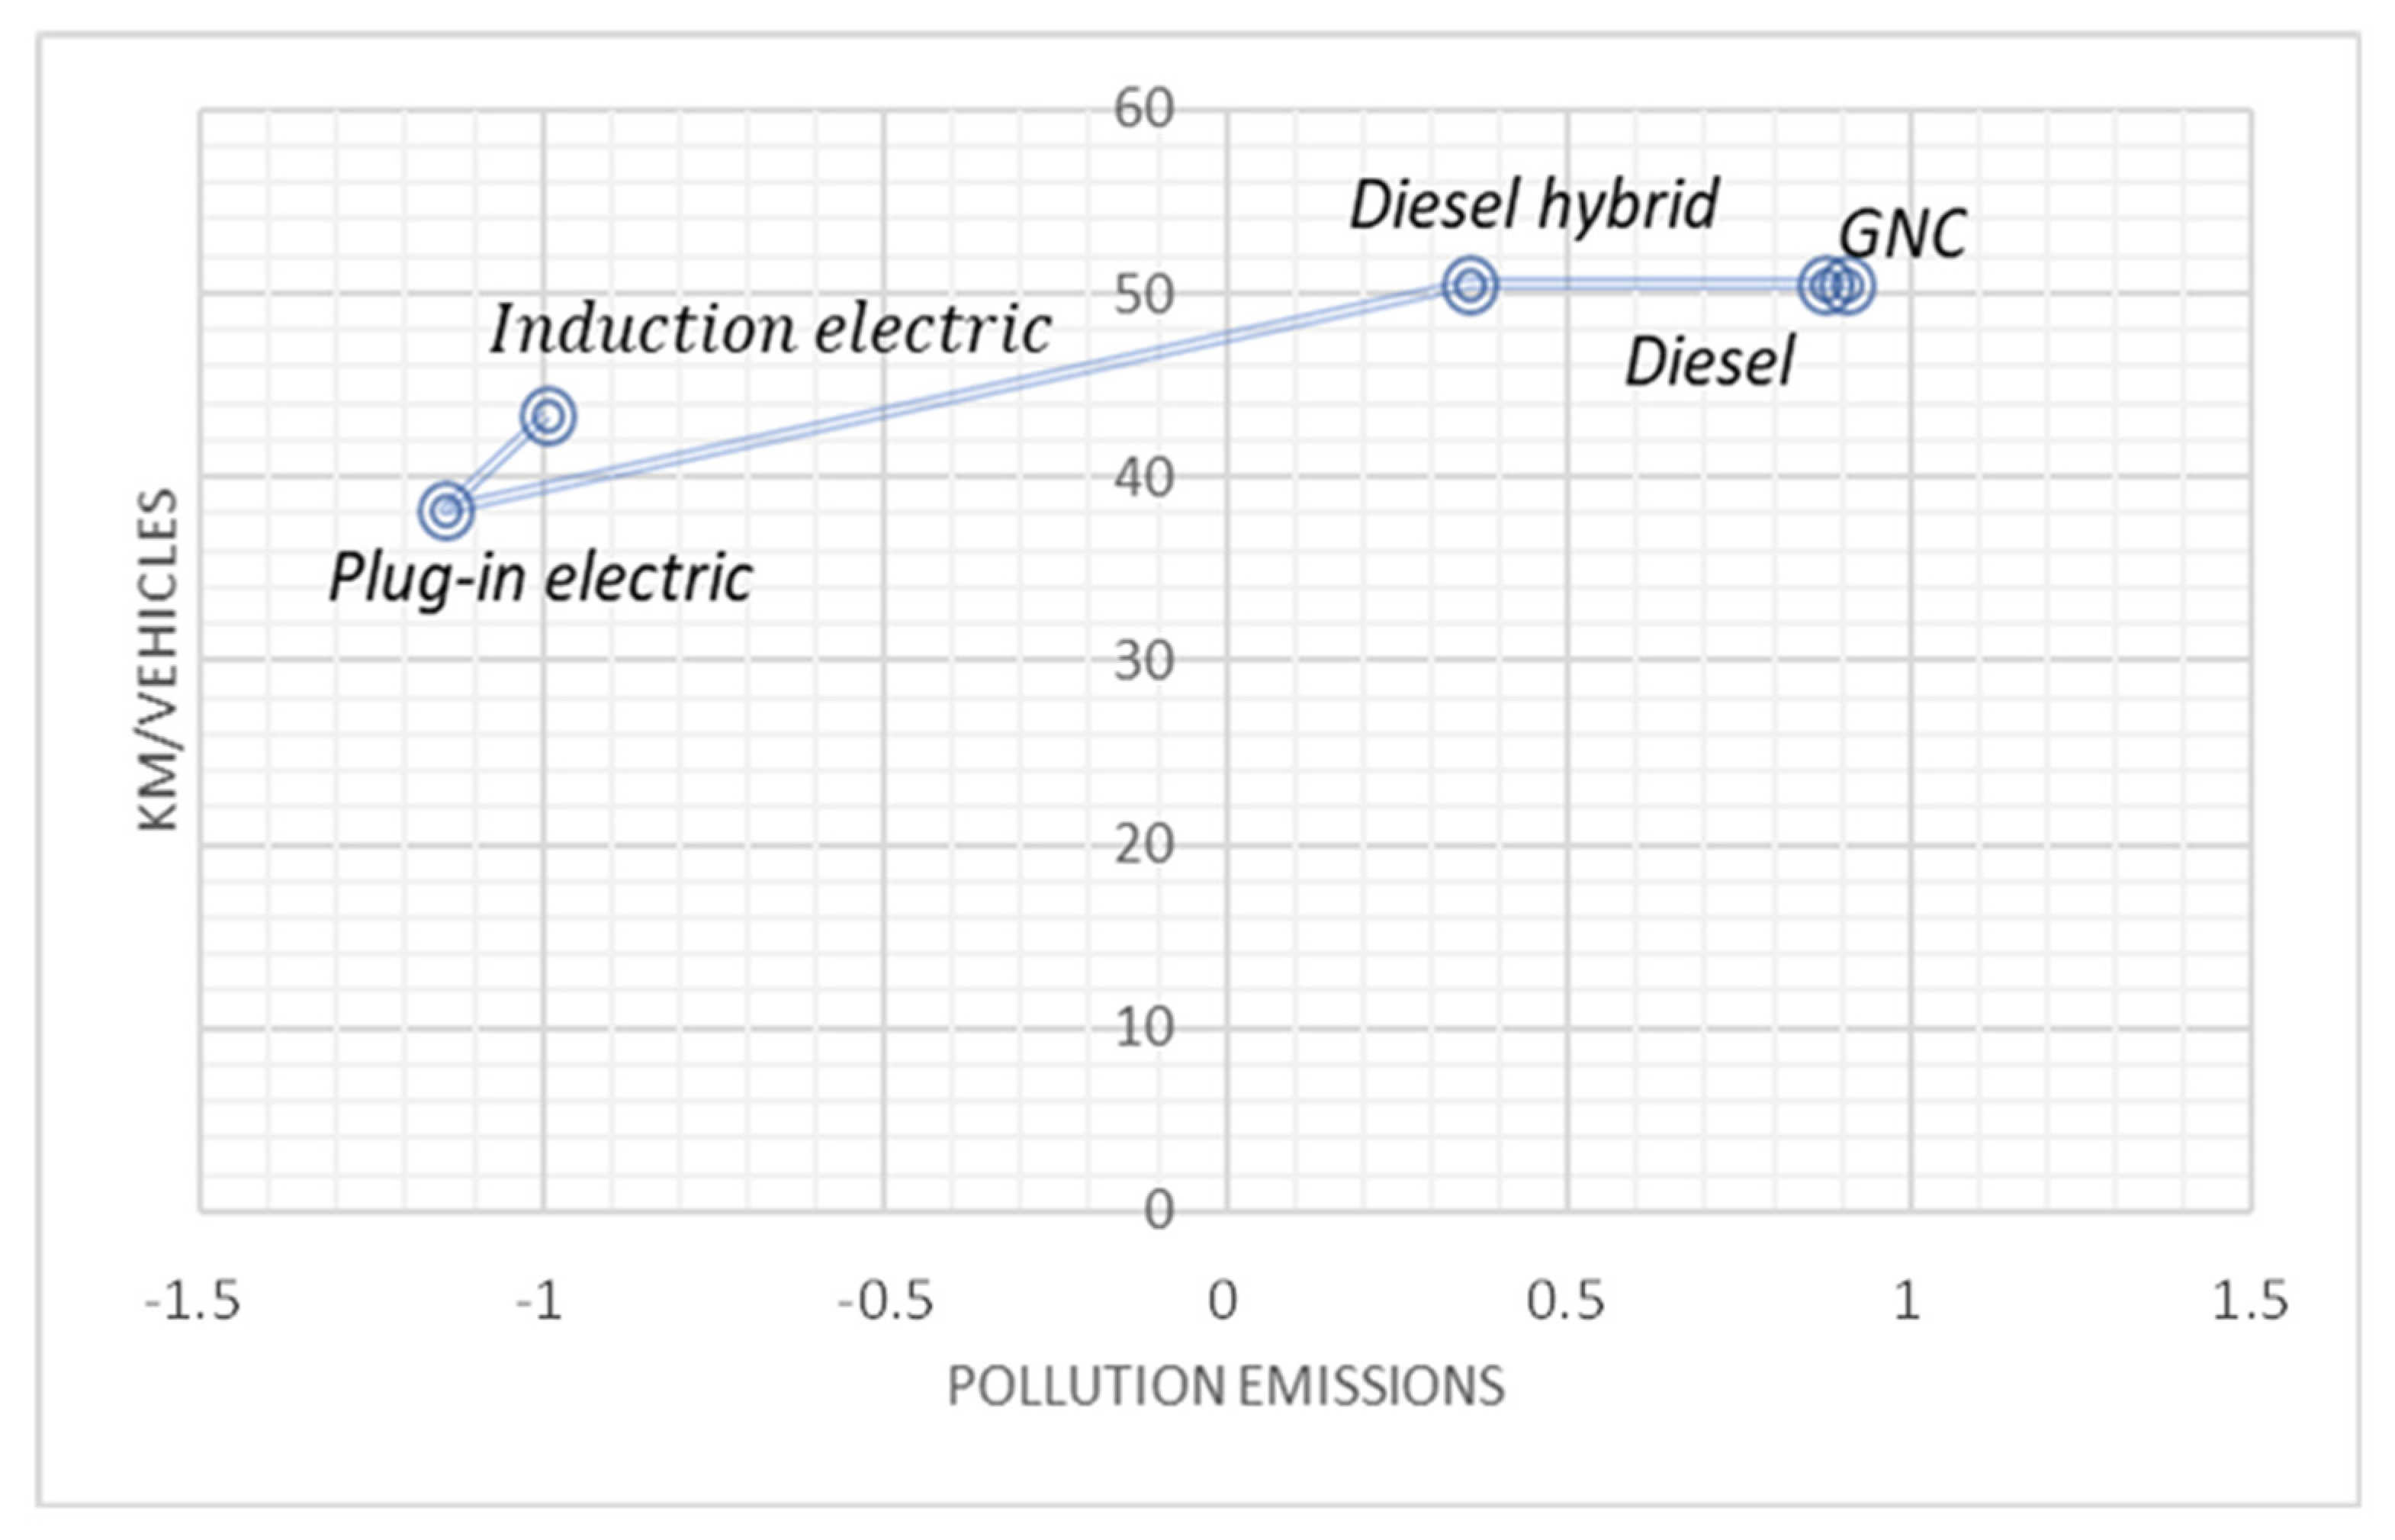
The graphical representation of the DMUs on a map is shown in
Figure 3.
To find which DMUs are efficient, it is necessary to look at the top left-hand side of the map. In this corner there will be the DMUs that provide higher values of outputs (kilometers travelled) with smaller values of inputs (less pollutant emissions).
The most efficient DMU is DMU4 (plug-in electric) because there is no other DMU, with the pollutant emission values of this type of engine, capable of providing a higher output.
4. Conclusions and Recommendations
The most relevant conclusion of this research is that plug-in electric vehicles are the only efficient motor from the point of view of polluting emissions. Plug-in electric buses can make the same kilometers emitting the lowest level of polluting gases.
Based on research results, the answer to the main research question is:
- -
Answer to the Research Question: The most efficient alternative fuel technology, in terms of air pollution, for urban public buses, is the plug-in electric.
4.1. Implications for Management
The high level of pollution caused by road traffic in large cities is one of the main challenges for cities to ensure a sustainable and environmentally efficient future.
It is essential to ensure the transition from fossil fuels based mobility model to one based on clean energy although this transition is very complex in terms of fuel/energy taxes. Moreover, climate change further complicates the challenge of urbanization.
As the challenges of urbanization increase, so does the global commitment to get it right.
The research results favor the development of an efficient urban transport model based on vehicles powered by electric motors clarifiying the previous doubts about which type of electrical technology, among the existing ones, is really efficient in environmental terms.
In addition, there are other types of implications that also condition the type of electrical technology to be used for the development of urban transport systems in large cities.
Plug-in electric vehicles, although they are the most efficient technological option in environmental terms, still have many limitations in the autonomy due to the types of batteries and the lack of a sufficiently dimensioned charging network infrastructure.
However, in the medium term continued technological advances will further enhance the dominant position of this plug-in electrical technology in terms of efficiency because new urban and long-distance charging solutions will get an enough level of implementation.
Regarding to the induction vehicles, it is important to highlight the fact that they are not considered efficient from an environmental point of view according to DEA results. Induction vehicles need more buses travelling more kilometers to guarantee the same level of transport service, as the vehicles have to stop for twenty minutes per trip to recharge their batteries by induction.
For this recharge, induction electric buses need to be placed and keep stopped near a charging station or inductive platform located under the pavement of the bus stop. This type of integrated system under the pavement is very expensive to build in economic terms and is the main handicap for its implementation in large developed cities such as Madrid.
Nevertheless, it may prove to be a suitable solution for planning green and sustainable urban transport systems in new urban areas.
In addition, countries must meet the commitments they have made to reduce pollution levels set out in the SDGs of the 2030 Agenda in a period of time shorter than the period of time necessary to implement the induction recharging infrastructures that allow the use of the induction technology intensively.
Based on these limitations on induction vehicles, in the short term it is not worth assuming the economic, operational, and time costs of using induction technology. As a result, public administrations are finally opting for technologies that are quicker and cheaper to deploy, such as plug-in electric vehicles.
In the long term, it is possible that these limitations can be overcome, and new induction recharging systems are developed to allow greater flexibility in their implementation.
Overall, the results of the analysis make it possible to reinforce the strength of plug-in electric technology (compared to others of the same nature, such as induction electric vehicles), which cannot yet be used to develop new sustainable urban transport systems due to its limitations.
4.2. Research Limitations and Future Lines of Research
The main limitation of our model is to only incorporate the traditional variables to assess the air pollution caused by vehicles, such as the NOx (kg), PM (kg) and CO2 (kg) emissions for each engine type. Following mainstream theory, some other relevant variables have been ignored.
The buses pollution is not only atmospheric, as they also produce acoustic pollution. Additionally, the production of electricity to charge electric vehicles does pollute, unless it is totally obtained from renewable energies, such as solar or wind.
Aforementioned limitations are an inspiration of future lines of research, which could incorporate new pollutant variables in order to obtain a much more accurate analysis.
In addition, from a methodological perspective, the following ideas can be taken into consideration in future research: (1) to use alternative methods to calculate external costs, such as the classical one; (2) to use non-DEA approaches to calculate efficiency, such as efficiency calculation based on the weights from the Delphi method, or efficiency calculation based on using the weights obtained from the PCA, which could be a good comparison points with DEA results; (3) to consider additional lines, ideally in diverse different areas of Madrid, to create a larger sample for a DEA windows analysis, which could be more representative of the city; (4) to consider three different approaches of DEA without, and with the two proposed weight restrictions.
Another avenue for future research could be related to the feasibility of implementing new alternatives depending on the degree of urban development and the city form. There is agreement in the scientific community that the electric public road transport is the benchmark to reach for mobility and travel behavior in cities.
In the case of buses, there are different possibilities when choosing an electric motor. According to the research results, the most environmentally efficient is the use of plug-in electric motors. Nevertheless, the urban form, and especially its level of urban development, also determines the choice of the environmentally efficient bus from the point of view of economic efficiency and urban viability, i.e., the urban form also determines the choice of the environmentally efficient bus.
As a consequence, it might seem that the choice of type of electric motor (plug-in or induction) depends primarily on the urban form. Those cities that are already urbanized require modifications to existing infrastructure that would not make induction motors viable. Non-urbanized areas or new planned cities could be the ideal location for such induction motors.
An interesting potential study is the analysis of the viability of these new type of technology in newly designed cities, such as the new capital of Indonesia or the imminent new capital of Equatorial Guinea. The contrast between theoretical studies on the efficiency and feasibility of electric buses and practical cases of their implementation in new cities is a line of future research with great potential.


