Article

Supercritical Carbon Dioxide Extraction of Phenolic Compounds from Potato (Solanum tuberosum) Peels

by
Micael de Andrade Lima
1,2,*,
Rafaela Andreou
2,
Dimitris Charalampopoulos
2 and
Afroditi Chatzifragkou
2
1
Institute of Biological, Environmental and Rural Sciences, Aberystwyth University, Aberystwyth SY23 3EE, UK
2
Department of Food and Nutritional Sciences, University of Reading, Reading RG6 6UR, UK
*
Author to whom correspondence should be addressed.
Appl. Sci. 2021, 11(8), 3410; https://doi.org/10.3390/app11083410
Submission received: 19 March 2021 / Revised: 6 April 2021 / Accepted: 8 April 2021 / Published: 10 April 2021

Abstract

:
In the last three decades, greener technologies have been used, aiming at extracting phenolic compounds from vegetable matrices due to the inherent advantages compared to organic solvent-based methodologies. In this work, supercritical CO2 was investigated for recovering phenolic acids from potato peels. Following screening runs for assessing the significant extraction parameters, a Central Composite Design of Experiments was carried out aiming at process optimization, with methanol concentration (MeOH, %) and CO2 flow rate (qCO2, g/min) as independent variables. Both parameters were deemed to impart a significant effect on the final response. Although the major phenolic acid in potato peels is chlorogenic acid (CGA), the main compound extracted was caffeic acid (CFA), present at a concentration of 0.75 mg/g dry peel in the extracts. The optimum extraction conditions were 80 °C, 350 bar, MeOH 20%, and flow rate of 18.0 g/min, which enabled a total phenolic recovery of 37% and a CFA recovery of 82%. The antioxidant activity of the supercritical fluid extraction (SFE) extracts was also measured, with the highest scavenging capacity reaching 73%. The need for using mixtures of water and organic solvents as co-solvents in SFE to enable CGA recovery seems necessary, possibly due to its better dissolution in aqueous solutions than in pure solvents.

1. Introduction

Potato peels are one of the most common vegetable by-products in Europe and are considered a zero-value waste in potato processing plants [1]. In the UK alone, potato waste accounts for 400,000 tons every year, and in Europe, this figure can reach 5 million tons [2]. Depending on the peeling process, waste can comprise up to 40% of the raw product mass [1], but the average waste produced in the processing of potatoes is 90 kg/ton (9%), apportioned as 50 kg of peels, 30 kg of starch, and 10 kg of other components, such as sprouts and roots [3]. However, potato peels contain a vast group of nutritionally and pharmaceutically interesting components, such as phenolic compounds, that can be used as natural antioxidants [4,5,6]. Phenolics have shown a plethora of benefits to the human health, such as antioxidant [7], antimicrobial, antivirus [8], and even anti-parasite properties [9], among others.
Given such potential, the extraction of these compounds for valorizing an otherwise zero-value matrix is highly interesting from an industrial perspective [6,10]. Phenolic extraction by conventional organic solvents is widely reported in the literature but, although efficient, the approach presents technological and environmental challenges, such as long extraction times, very diluted final extracts, the need for extra post-processing operations, and the toxicity and difficult disposal of some solvents [11]. Non-conventional technologies, such as microwave-, ultrasound-, enzyme-, and electric field-assisted extractions, as well as extractions via pressurized liquids, subcritical water, and supercritical fluids, have been able to circumvent many of these drawbacks and a growing number of works from the literature have reported on their application for extracting phenolic compounds from a variety of matrices [12], including potato peels [11,13,14,15,16,17,18].
Given the fact that, to the best of our knowledge, there are no studies on the extraction of phenolics from potato peels by supercritical CO2, the aim of this work was to assess and optimize this process via a central-composite design of experiments. The process parameters tested included extraction temperature and pressure, cosolvent concentration, and CO2 flow rate, with responses being analyzed as total phenolic contents and antioxidant activities. Insights on possible causes to the observed trend of phenolic extractions by SFE usually being less efficient than other technologies were also discussed.

2. Materials and Methods

2.1. Sample Preparation

Maris Piper potatoes (Solanum tuberosum) harvested in 2016 were purchased from a local market in Reading, UK. Following a thorough washing, the potatoes were manually peeled. Potato flesh and peel samples were subsequently frozen at −20 °C for 36 h, and freeze-dried (VirTis SP Scientific, UK) at −46 °C for 72 h. The samples were then grinded and sieved through W.S. Tyler sieves (Ø = 810 − 75 μm), for particle size and distribution measurement. The mean particle size of the samples was 280 μm for the peels, and 305 μm for the flesh.

2.2. Chemical Characterization of Potato Samples

In order to compare the macronutrient composition of the samples of potato flesh and peels, analyses of total protein, lipid, carbohydrate, and starch content were carried out.
Total protein content was determined by the Kjeldahl method [19]. Briefly, 0.4 g of sample were wrapped in Whatman #1 paper and submitted to digestion with 25 mL of H2SO4 (>95%, v/v) at 85 °C for 60–90 min, until the samples had been fully digested. The solutions were then cooled to room temperature, distilled (323 Distillation Unit, Büchi, UK), and re-suspended in water and 1.0 M NaOH. At this point, 50 mL of H3BO3 was added to the final solution, which was titrated with 0.1N H2SO4, with methyl red used as indicator. The amount of nitrogen and protein present (%, w/w) was calculated according to Equations (1) and (2), respectively:
%   N i t r o g e n = V H 2 S O 4 ( mL ) N 14 , 007 100 w s a m p l e ( m g )
%   P r o t e i n =   %   N i t r o g e n 6.25
where VH2SO4 is the volume (mL) of 0.1 N sulfuric acid consumed during titration, N is the normality of H2SO4, and wsample is the weight of the sample submitted to digestion.
The lipid content was determined gravimetrically, by Soxhlet method [20]. Briefly, 1.0–2.0 g of sample were added to a cotton thimble and placed in a Soxhlet extractor, along with pre-weighted boiling flasks. Petroleum ether was used as solvent (Merck Life Science UK Limited, Dorset, UK, 60 °C boiling point) and extraction was carried out for 4 h. The flasks containing the fat residue were oven-dried, placed in a desiccator, and weighed. The total lipid content was calculated by weight difference.
The total carbohydrate content was determined according to the protocol of the National Renewable Energy Laboratory (NREL) [21]. In brief, 300 mg of sample were submitted to hydrolysis with 3 mL H2SO4 (72%, v/v) and incubated at 30 °C for 1 h. The resulting solution was diluted with water to 3% H2SO4 (v/v) and autoclaved at 121 °C for 30 min. Samples were allowed to cool down to room temperature, the pH of the supernatant was adjusted to 5.0 with CaCO3 and filtered, and analysis in a High Pressure Liquid Chromatography (HPLC) system (Agilent Infinity, 1260 series) was performed. This consisted of DAD/RI detectors and an Aminex HPX-87H (300 × 7.8 mm, Biorad, Hertfordshire, UK) column. An isocratic mobile phase of 0.005 M H2SO4 was used, and the flow rate was set at 0.6 mL/min. The sample injection volume was 20 μL and sugar identification and quantification were attained through data comparison to previously plotted calibration curves of external standards.
Finally, the starch analysis was performed using an enzymatic kit (Megazyme, Wicklow, Ireland), which followed the specific AOAC method [20]. The absorbance of the final samples at 510 nm was measured against a blank and a glucose standard in a UV-Vis spectrophotometer (Life Technologies Ltd., Paisley, UK).

2.3. Phenolic Acids

2.3.1. Total Phenolic Content (TPC)

The total phenolic content (TPC) was analyzed using a modified Folin-Ciocalteu method [22]. In short, 20 μL of the extracts (in triplicates) were added of 1.5 mL of deionized water, 100 μL of the Folin-Ciocalteu reagent (Merck Life Science UK Limited, Dorset, UK), and 300 μL of 8% (w/v) sodium carbonate. The mixture was incubated in the dark for 90 min and the absorbance was read at 765 nm on a UV-Vis spectrophotometer (Life Technologies Ltd., Paisley, UK). Gallic acid (Merck Life Science UK Limited, Dorset, UK) was used as a standard, and the TPC of the samples were expressed in milligrams of gallic acid equivalents per g of potato samples (mg GAE/g).

2.3.2. Phenolic Acid Identification and Quantification

50 mg of potato samples were added and mixed with 1 mL of 80% methanol using a vortex mixer (Fisher Scientific, UK) for 1 min for extracting the free phenolic acids [5]. The sample was then centrifuged for 15 min at 5000 rpm in a benchtop centrifuge Life Technologies Ltd., Paisley, UK). The supernatant was transferred to a new Eppendorf tube and evaporated using a speedvac (Life Technologies Ltd., Paisley, UK), for approximately 1 h. After repeating this step three times to ensure complete extraction of the free phenolic acids, the final supernatants were combined and evaporated to dryness in a last speedvac routine. The dried precipitate was dissolved in 1 mL of 2% (v/v) aqueous acetic acid and centrifuged for 5 min at 13,000× g. The supernatant was filtered and transferred into a glass vial for the HPLC analysis.
The HPLC analysis of phenolic acids, adapted from Kim et al. [23], was performed with a Zorbax C18 reversed-phase column (100 × 4.6 mm) combined with a 1260 DAD detector (Agilent Technologies, Stockport, UK). The phenolic acids were identified and quantified by comparing to the retention times and areas of individual standards (Merck Life Science UK Limited, Dorset, UK). The mobile phases used were (A) 1% (v/v) acetic acid and (B) acetonitrile. A binary gradient was performed as follows: 95% A (0–19 min), 85% A (20–32 min), 50% A (33–36 min), 30% A (37–39 min), 0% A (40–41 min) 95% A (41–45 min). The injection volume was 10 μL, and the flow rate was fixed at 1.0 mL/min. Peaks were monitored at 280 and 320 nm.

2.4. Supercritical Fluid Extraction (SFE)

The SFE system (SCIMED, Stockport, UK) consisted of a CO2 cylinder, a recirculating chiller, CO2 and co-solvent pumps, a heat exchanger, an extraction vessel, a separating vessel, an automated back pressure regulator, and a controlling computer. In each extraction, 5.0 g of potato peels were placed in the extractor with 95.0 g of inert glass beads (Sigma-Aldrich UK). Four main parameters—temperature (T, °C), pressure (P, bar), methanol concentration (MeOH, % cosolvent-to-solvent ratio), and CO2 flow rate (qCO2, g/min)—were varied across extractions.
First, screening experiments were conducted aiming at identifying the parameters that imparted the strongest effects on phenolic acid recovery. Five initial extractions were performed: the first (E1), at 45 °C, 150 bar, 5 g/min CO2, and 7% (v/v) MeOH. The second extraction (E2) was performed by increasing T and p (60 °C, 350 bar), and maintaining MeOH% and qCO2 constant. The other four extractions were performed under constant T and p (80 °C and 350 bar), and varying MeOH and qCO2: E3, at 7% MeOH and 10 g/min CO2; E4, at 15% MeOH and 10 g/min; and E5, at 15% MeOH and 15 g/min. The extraction time was fixed at 60 min for all runs. The extracts were collected in glass flasks, had their volumes standardized, and stored at −20 °C until further analysis.

2.5. Design of Experiments (DoE) and Process Optimization

In order to attain the maximum recovery of the phenolic acids, an optimization of extraction conditions was performed. For this, a non-Factorial, Central-Composite Design of Experiments (CCD) was carried out. The study included a full two factor, two level (22) design plus additional axial (“star”) points and a central point run in triplicate. Following the results of the preliminary runs, MeOH% and qCO2 were assessed in the CCD, while T and p were fixed at 80 °C and 350 bar, respectively. Thus, MeOH% was tested at 10% and 20% (central point: 15%), and qCO2 at 8 g/min and 18 g/min (central point at 13 g/min). Eleven runs were performed in total (eight individual runs and a triplicate run on the central point).
For generating the response surface plots, the software Statistica v. 10.0 (StatSoft, Palo Alto, CA, USA) was used. All the other statistical analyses, unless otherwise stated, were performed in triplicates for error calculation and data validation.

2.6. Antioxidant Activity (AA)

For the determination of the antioxidant activity of the samples and in the final extracts, the DPPH (2,2-diphenyl-1-picrylhydrazyl) method was used [24], measured in scavenging capacity (%). Briefly, 200 μL of sample (in triplicates) were mixed with 2 mL of the DPPH reagent (Sigma-Merck, UK). The mixture was incubated for 30 min in the dark, and the absorbance was measured at 517 nm in a UV-Vis spectrophotometer (Thermo Election corp., UK). AA results were expressed in percentage of color consumption by the samples in relation to that of the control sample (200 μL of methanol +2 mL of DPPH reagent).

3. Results

3.1. Sample Characterization

The results concerning the characterization of the samples of peels and flesh as to their macronutrients are shown in Table 1. It can be noted that potato peels show a higher amount of proteins (11%), while the flesh is richer in lipids (2.6%) and in total carbohydrates (76%), especially starch. Apart from starch, which is made up of glucose monomers, potato peels contain other carbohydrates such as cellulose, hemicellulose (composed by glucose, arabinose, and galactose), and pectin (glucose, arabinose, and galacturonic acid). This explains the difference between the monomeric sugar profile observed in the samples of peels and that found in the flesh.
According to similar works from the literature, the values reported for the fat, protein, carbohydrate, and starch content of potato peels are 0.7–2.9%, 11.1–17.2%, 68–88%, and 28% d.b., respectively [6,25]. In our work, results within these ranges were also found. The slight variances observed are most likely due to environmental factors that affect the nutrient content of potato peels, such as variety type, harvest season, ripening stage, and climate conditions [4,26]. Additionally, the potatoes in this work were hand-peeled, which may explain, for example, the slightly higher starch content due to the higher amount of flesh attached to the peels.

3.2. Phenolic Identification and Quantification

Table 2 shows the phenolic acid results in potato peels, both as TPC (mg GAE/g, via the Folin–Ciocateu method) and as concentration of individual phenolics (mg/g).
According to the literature, the main phenolic acid in potato peels is chlorogenic acid, which can constitute up to 90% of the TPC [27]. Other phenolic acids reported in potato peels, but not present in our samples, include crypto-chlorogenic, ferulic, gallic, and protocatechuic acids [5,6]. Some of these may be present in this matrix in esterified (conjugated to small peptides or oligosaccharides) or in bound form, i.e., covalently attached to cell wall components, such as cellulose, hemicellulose, lignin, pectin or structural proteins [13,28].
As expected, chlorogenic acid was the most abundant phenolic in our samples (3.87 mg/g), comprising around 64% of the TPC, followed by caffeic acid (0.92 mg/g, 15% of the TPC). These two major phenolics make up around 80% of the total phenolic content, and it is clear that extraction protocols should focus primarily on their recovery. Similar concentrations and ratios for these phenolics are reported in other works from the literature [14,17,27]. Additionally, the literature reports lower phenolic contents for samples of potato flesh: 0.17–2.83 mg/g chlorogenic acid and 0.25–0.72 mg/g caffeic acid [4]. The TPC differences observed between both matrices can be explained by the fact that the concentration of the phenolic acids is always higher in the peels than in the flesh [29]. This is because, in vegetables, these secondary metabolites play a key role in many physiological reactions, such as pigmentation, growth, reproduction, and protection [30]. Therefore, because it acts as a natural barrier between the flesh and the external environment, vegetable peels tend to contain a higher phenolic content, as they can provide good resistance against mechanical stresses and pathogens [31].

3.3. SFE Screening Experiments

Table 3 shows the results of the preliminary SFE runs, performed for screening the effect of temperature (T), pressure (P), methanol concentration (MeOH%), and CO2 flow rate (qCO2) on the individual and the total phenolic recovery (TPR) from potato peels. The literature reports the testing of vast ranges for all these parameters, but especially for temperatures (30–120 °C) and pressures (80–650 bar) [32]. Since no studies specifically on the extraction of potato peels by SFE are available in the literature, the values of these four factors were decided based on works that assessed the extraction of phenolics from other vegetable waste matrices by SFE, such as grapes [33], red pitaya [34], orange [35], lemon [36], and apple [37]. For these materials, it was observed that all the optimized conditions for TPC were usually pinpointed at the lower end of the range of temperatures and pressures employed (40–50 °C and 100–250 bar). This is likely due to the fact that lower temperatures and pressures result in a lower solvation power of the supercritical CO2. Higher temperatures, on the other hand, may lead to diminishing returns (i.e., considerable increase in energy consumption resulting in marginal solvation gains), or even the degradation of more thermolabile compounds [38].
Looking at E1 and E2, where the four factors being studied are at their lowest values, it is clear that low CO2 flow rates were not effective for extracting phenolics from the matrix, even when the T and P were slightly increased (E2). In E1, the recovery of caffeic acid is only 3%, and the total phenolic recovery, 0.5%. This is probably owing to potato peels having a higher starch concentration than the other fruit matrices mentioned. Due to the more complex arrangement of structural polysaccharides such as fibers and starch, the dissolution of certain compounds in the supercritical fluid, e.g., phenolics and tannins, can be made difficult, especially if there are chemical interactions involved [39]. In this scenario, the supercritical CO2 may present a lower relative matrix penetration capacity, and this effect is amplified due to the low values of the T vs. P binomial, MeOH%, and qCO2 employed in these runs, which result in low solvation power, low solvent polarity, and low mass transfer rates from the matrix to the fluid phase, respectively [38]. Solely increasing the solvation power of the solvent (via T and P) in E2 does not impart significant effects to the extraction yield or to the phenolic profile, as the only compound recovered in both runs was caffeic acid (CFA), and at very low concentrations.
From E3 to E5, all the investigated parameters were substantially increased and the extraction efficiency started to show noticeable improvements. In E3, T was further increased and qCO2 was doubled, which caused a considerable improvement in the extraction yields. Increasing the latter parameter seems to increase the TPR owing to a more efficient convective mass transfer from the solid phase to the solvent phase. As a result, the recovery of 88% of the total isochlorogenic acid (ICA) content could be observed.
Again, very high temperatures can lead to the degradation of heat sensible compounds, and 80 °C is at the upper limit of the temperature ranges usually reported in the literature for the extraction of peels. Therefore, in E4, only MeOH% was changed. CO2 is a nonpolar solvent and to achieve the extraction of polar compounds, as is the case with phenolics, its polarity must be increased by a cosolvent [38]. Additionally, higher amounts of co-solvent aid the dissolution of heavier molecules on the fluid phase. As a result, the same phenolics recovered in the previous runs were also extracted in E4, but in considerably higher concentrations.
In E5, qCO2 was increased and, although TPR also increased due to the improved extraction of ISA and the first recovery of p-coumaric acid (PCA), the extraction of CFA experiences a significant decrease. This is likely to have happened because higher flow rates result in lower solvent residence times, i.e., the CO2 does not remain in the extraction vessel for a period of time long enough to interact with the phenolic molecules and hence, compound affinity starts to play a major role in the extraction profile. It is very likely that continuing to increase qCO2 would further lower TPR values.
One noteworthy fact is that even though chlorogenic acid (CGA) is the most abundant phenolic acid in potato peels, only traces were recovered in all the runs performed. Possible reasons for why this is the case are explored in detail in the next section.
Finally, it is clear that increasing MeOH% and qCO2 seems to affect yields more than increasing T and P. This can be observed by comparing the results of E3–E5 to those of E1 and E2. Thus being, in order to find the optimal extraction conditions for maximizing the TPR of the SFE extraction, an experimental design varying the two most influential parameters was carried out. This is shown in the next section.

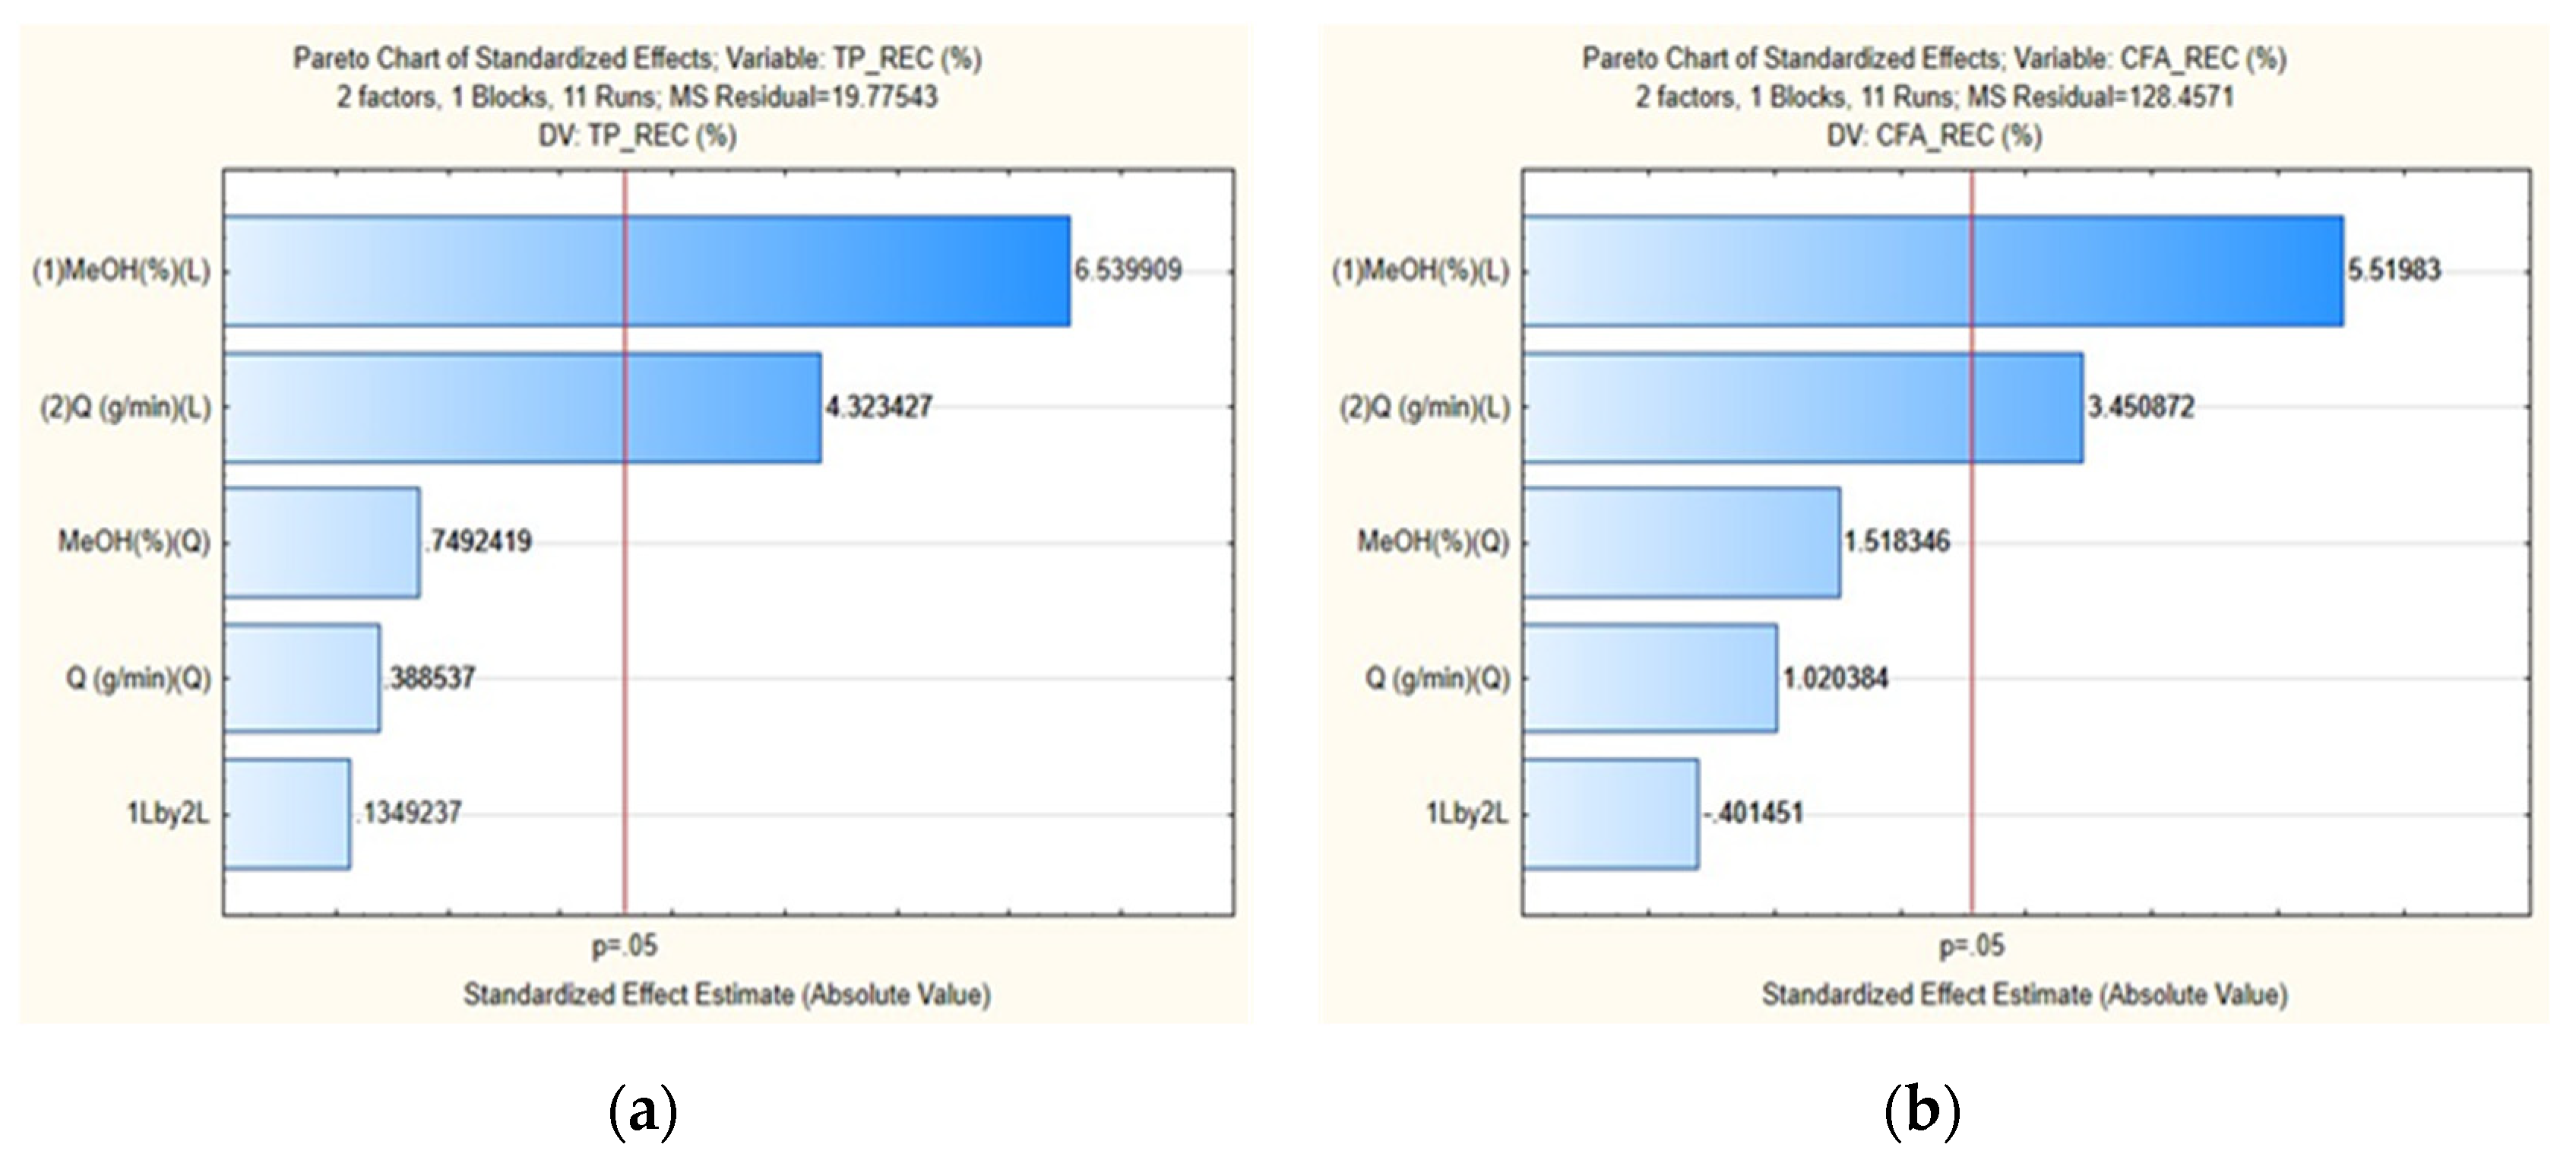
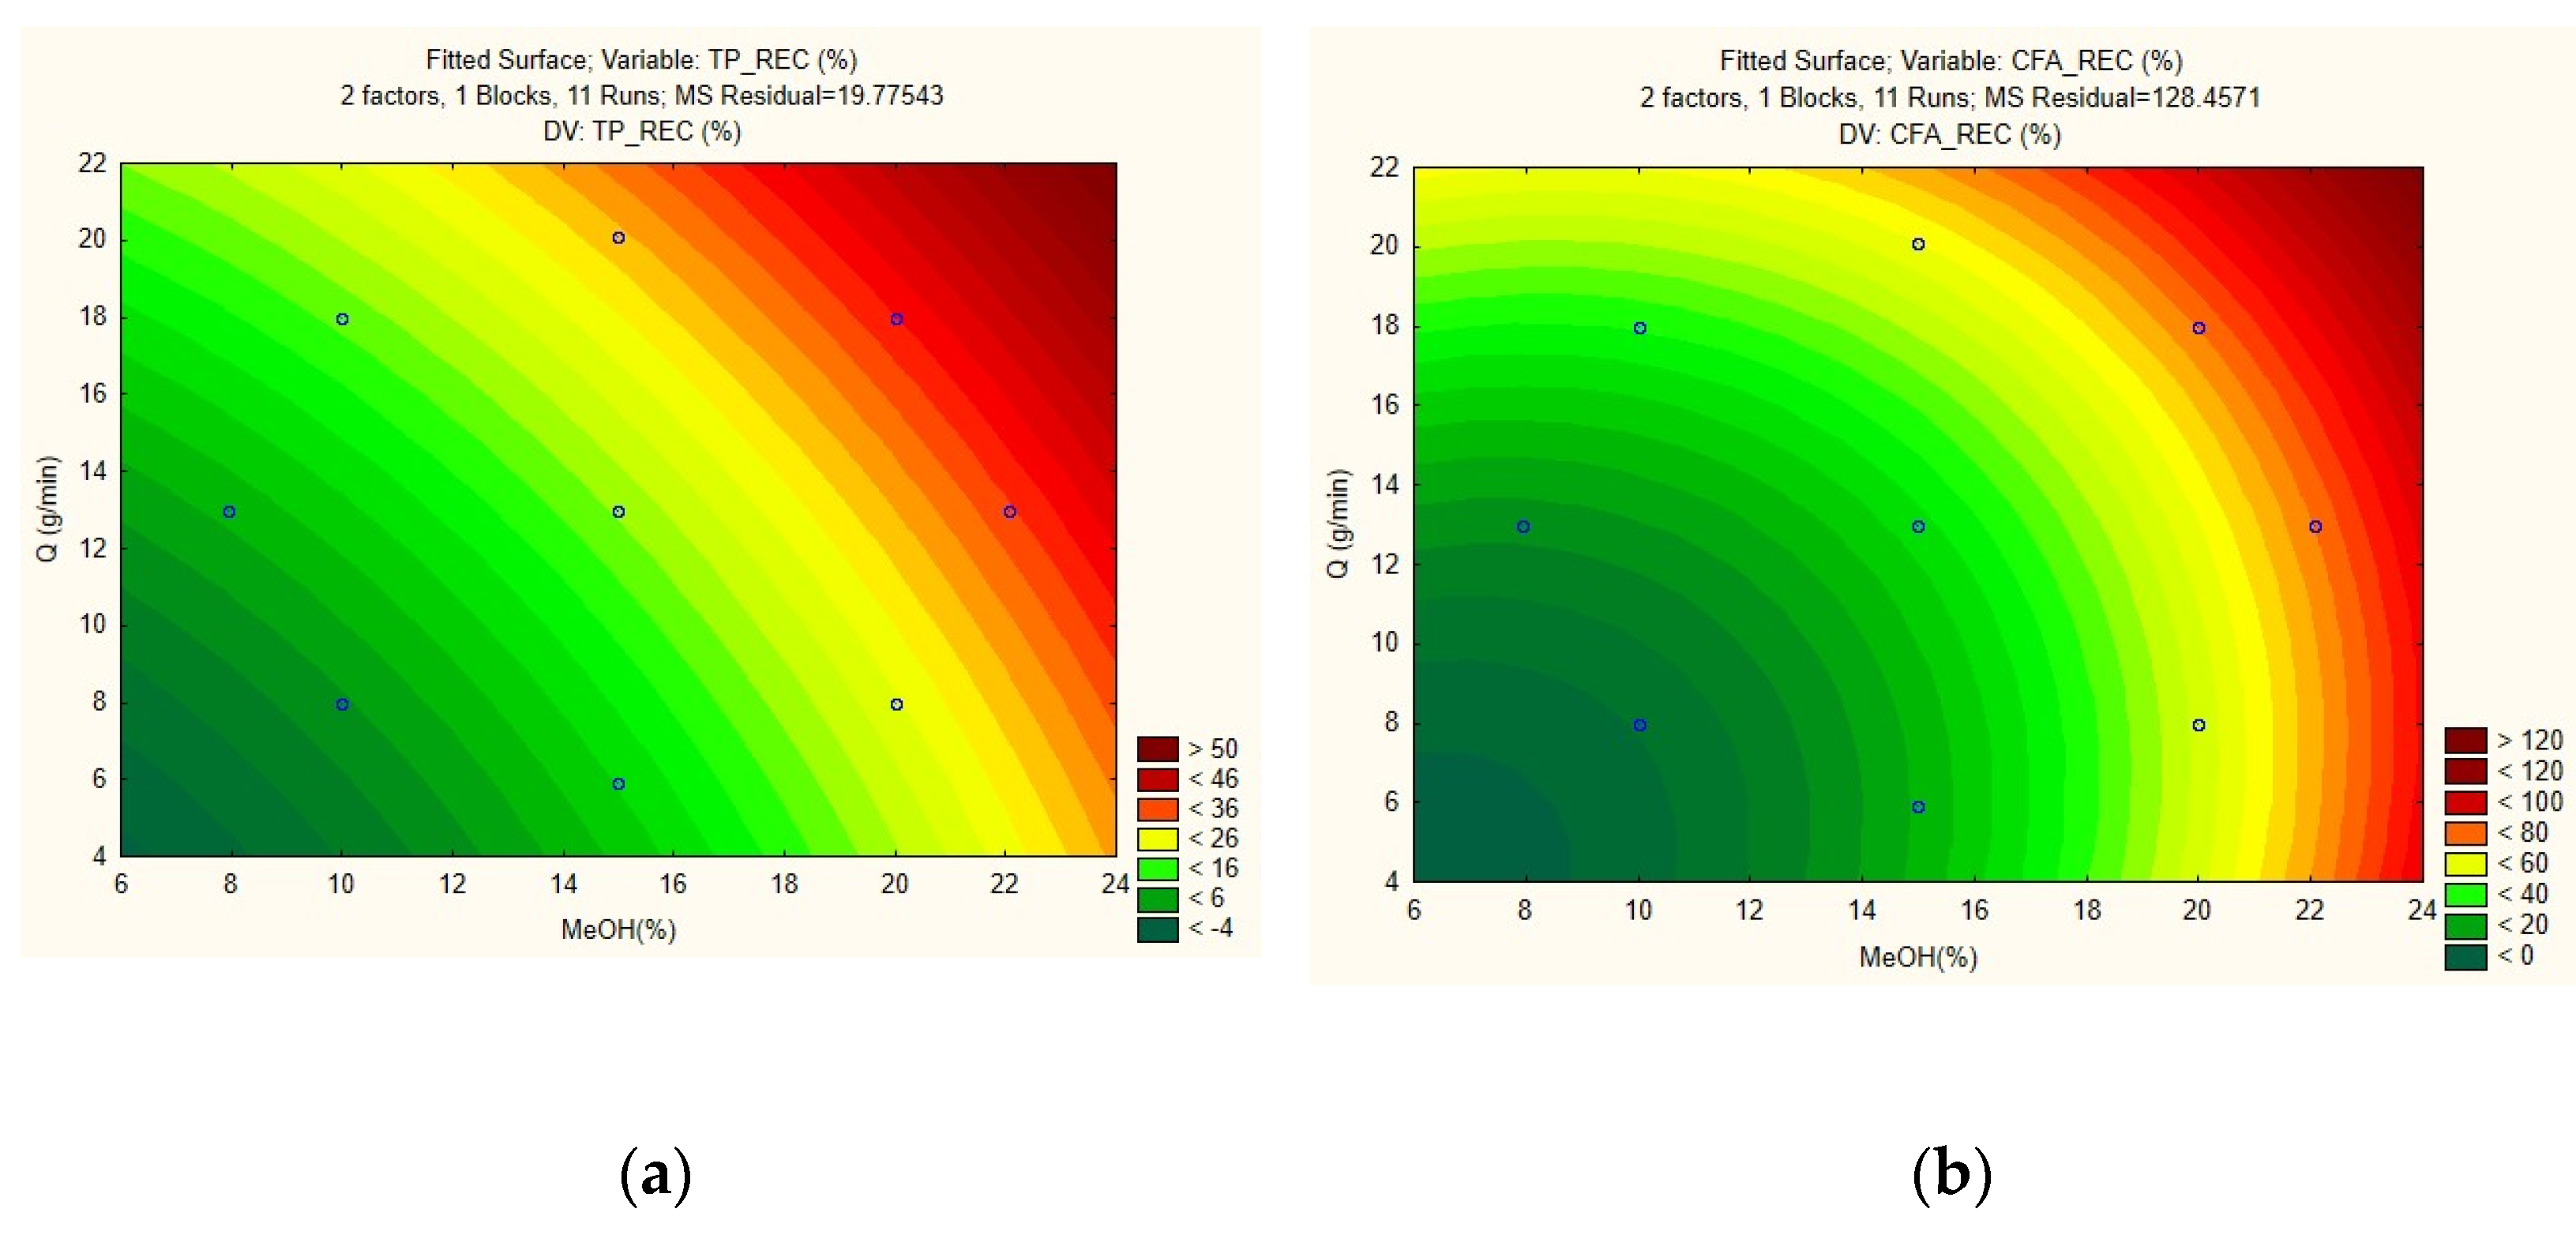
3.4. Design of Experiments (DoE) and Process Optimization

Table 4 shows the combinations of the SFE conditions for MeOH and qCO2 used in the DoE, which comprised a 2 factor, 2 level Central Composite Design (CCD). The results were expressed both as TPR and as CFA recovery, since this is the main phenolic compound in the extracts. The extraction temperature and pressure were fixed at 80 °C and 350 bar, respectively, due to the higher recoveries observed in the screening runs under these conditions. Additionally, other preliminary runs showed that increasing both parameters further had no effects on recovery (data not shown).
The maximum TPR and CFA recoveries observed were 37% and 82%, respectively, obtained in run 04; and the minimum, 3.4% and 5.6%, in run 01 (under the lowest MeOH% and qCO2). The Pareto charts of effects show the variables that significantly influenced the TPR (Figure 1a) and CFA (Figure 1b) recovery at a significance level of 95%. As observed, both linear variables affect the responses but, judging by the magnitude of the positive coefficients of both variables, it is clear that MeOH% is the governing parameter, i.e., the polarity of the solvent is the most important factor to consider in the phenolic extraction of potato peels. This can be directly noted in run 01, performed under the same qCO2 conditions as run 03, but the latter at double the MeOH concentration of the first. As a result, the TPR increased from 3.4% to 27.1%, and the CFA recovery from 5.3% to 67.3%. Similarly, the positive effect of qCO2 can be seen by comparing runs 01 and 02, for example, which have the same MeOH%, but the latter had a higher qCO2. In this case, the TPR increased from 3.4% to 12.1%, and the CFA from 5.6% to 29.4%, due to the higher convective mass transfer rates imparted by increasing the solvent flow rate [38].
A mathematical model describing the extraction of both components was generated (Equations (3) and (4)), and to validate them statistically, an F-test (lack of fit) was performed. Table 5 shows the results of the analysis of variance (ANOVA) performed for both models.
TPR ( % )   =   0.218 [ MeOH ]   +   0.0561 [ MeOH ] 2   +   0.423 [ Q ]   +   0.029 [ Q 2 ]   +   0.012 [ MeOH ] [ Q ]     10.31
where: TPR(%): Total Phenolic Recovery; [MeOH]: Methanol concentration (%); [Q]: CO2 flow rate (g/min).
CFA ( % )   =   3.08 [ MeOH ]   +   0.29 [ MeOH ] 2     0.93 [ Q ]   +   0.194 [ Q ] 2     0.091 [ MeOH ] [ Q ]   +   8.49
where: CFA(%): Caffeic Acid Recovery; [MeOH]: Methanol concentration (%); [Q]: CO2 flow rate (g/min).
For both models, the F-calculated values (12.41 and 9.04) is greater than the F-tabulated value (5.05), which implies that the mathematical model is valid to describe the extraction with confidence. Additionally, the models can be deemed reliable, given their high R2 values (TPR: 0.925, CFA: 0.90), and low errors. Thus being, the response surface plots for TPR and CFA recovery are illustrated in Figure 2a and Figure 2b, respectively. They show the correlation between the recoveries versus the independent variables MeOH% and qCO2. In both graphs, it can be seen that the optimum conditions for the process are located near the top region of the plot, i.e., where the MeOH% and qCO2 are at their highest.
The optimized conditions, found by calculating the global maxima of the graphs, were pinpointed at a temperature of 80 °C, pressure of 350 bar, 21% of MeOH, at 20 g/min of CO2 flow rate. These conditions were tested in triplicates and the results found were compared with those predicted by the model. Under these conditions, for TPR, the result obtained was 25.2%, while the model predicted a value of 44.2%. For CFA, a 45.0% recovery was obtained, while the model predicted a result of 92.7%. As observed, the predicted responses of the model did not match experimental values.
A common consensus in optimization studies via DoE is that for a model to be deemed predictive, the Fcalc value must be at least 3-fold higher than the Ftab value, which was not the case for either model. Therefore, the model validated in this work can be considered descriptive, but not predictive, i.e., it is only valid for values that fall within the boundaries tested, but it cannot be used for extrapolation purposes. In practical terms, this reinforces the trend that was already observed in the screening runs: Increasing MeOH% and qCO2 concurrently increases TPR and CFA up to a certain point, before they start decreasing. From a model standpoint (Figure 2), however, increasing both variables outside the range tested would result in even higher recoveries. Nevertheless, using an excessive amount of co-solvent is not desirable, because apart from not bringing any further polarity gains to the main solvent [38], this approach would probably impart extra extraction costs. Additionally, it can be seen from the plot that if the MeOH% were fixed and only qCO2 were increased, there would be a certain threshold from where a negative effect would start to be seen on the final response. This is because, as emphasized before, the solvent would probably not have enough residence time in the extraction vessel to penetrate the matrix structures or interact with the molecules of interest, lowering the extraction yields.
In order to put this theory to test, yet another extraction (Run 12, Table 6) was performed using a very high qCO2 (25 g/min), while maintaining the other conditions constant. The results of this extraction along with the results of the two axial points and the central point of the optimization study (runs 07, 08, and 09, respectively; Table 4), are replicated in Table 6 for ease of comparison. At the very high flow rate of 25 g/min, both dependent variables decreased. Thus, the limit for qCO2 can be set at around 20 g/min and the adjusted optimum conditions of the DoE then become: 80 °C, 350 bar, MeOH at 20%, and 18 g/min, which corresponds exactly to run 04 of the DoE (Table 4).
Despite the good recovery of caffeic acid (CFA) observed, it is clear that the central reason for the relatively low overall recovery was the complete absence of chlorogenic acid (CGA) in the extracts. In potato peel samples, this compound accounted for 64% of the TPC and hence the low TPR observed across the experiments. It is not easy to explain exactly why this happens, but we discuss some possible explanations for this in the following paragraphs. Although the theories debated are specifically related to the results of this work, the arguments made could also provide good insights on how to tackle and improve the extraction of other phenolic compounds by SFE.
One possible reason for the null recovery of CGA may be linked to the molecular weight and polarity of this molecule. While CFA, successfully extracted in this work, has a molecular weight of 180 g/mol, CGA is almost twice as heavy (354 g/mol) [40]. Usually, to aid the dissolution of heavier molecules in supercritical fluids, the cosolvent concentration can be increased [38], but as a result, the fluid phase becomes highly polar. However, CGA is an ester of CFA, and consequently, less polar than its simpler counterpart. Due to the opposing nature of these properties at play during SFE, the extraction of CGA from potato peels with the aid of very polar solvents may be difficult to achieve. Very high cosolvent concentrations (25% and above) could potentially increase recoveries, as confirmed by the model generated in this work, and also by the work of Omar et al. [36], who used 40% of ethanol as cosolvent in the SFE of lemon peels. However, it is also important to keep in mind that by definition, cosolvents should be efficient at very small concentrations [38]. Their addition in large amounts is also not interesting from an economic standpoint, since this would result in more energy and solvent requirements, apart from the need for longer post-operations of concentration, isolation, and purification. It is important to acknowledge that one counterargument to molecular weight being a limiting property could be the very successful extraction of other molecules heavier than phenolics by SFE, such as carotenoids [41], which weigh around 500–600 g/mol. However, such molecules are non-polar, as is the supercritical solvent, and this characteristic strongly aids their migration to the fluid phase and explains the very high yields observed.
Another possible explanation for the poor CGA extraction performance might be that, when submitted to high T and P during extraction, the compound can conjugate to other matrix components (e.g., carbohydrates) or to cell wall structures [42], or even undergo hydrolysis to caffeic and quinic acids with the amount of free water still present in the samples, even with this being considerably low. For instance, Singh and Saldana [16], report an increase in the CFA contents of potato peel extracts from SWE owing to the fact that the subcritical water provides access to ionic reaction conditions that enhance acid- and base-catalyzed reactions, which can cause hydrolysis of CGA to CFA. In our work, we also observed an increase in CFA and the occurrence of other CGA isomers, such as ICA, as we increase the levels of the extraction parameters. We cannot be sure, however, if this was due to a more efficient extraction of these individual compounds, or if they are products of either CGA hydrolysis or of isomerization reactions.
A possible solution for improving the extraction of phenolics from waste matrices by SFE in general could be the combination and integration of different techniques, solvents, and extraction conditions [43,44,45]. Alternatively, another approach could be the pretreatment of samples with weak alkalis or enzymes [13]. However, these steps are likely to incur on extra production costs and this also needs to be considered in the design of pilot-scale extractions.
Looking at the very few works from the literature specifically reporting on the extraction of CGA by SFE, Machmudah et al. [46], when simulating and modelling the extraction and fractionation of caffeine from coffee beans by SFE and water as a cosolvent, mentioned that CGA could only be extracted in the water phase. Solana et al. [47], tested different cosolvents in the SFE of asparagus and reported that there was no recovery of CGA when using methanol or ethanol. Only when the authors used a mixture of water:ethanol (1:1) did they observe some recovery of CGA. Other works also confirm the absence of CGA in their supercritical extracts obtained with pure solvents as cosolvents, such as in those of Echinacea purpurea [48].
Additionally, the vast majority of the works from the literature that do report some success in extracting CGA via SFE employed plant leaves or flowers as matrices, such as Hibiscus sabdariffa [49], Lonicera japonica [50], and Chrysanthemum indicum [51], which most likely present a simpler structure than the starch-rich peels used in this study, facilitating CGA extraction. The only two exceptions to this involved the use of aqueous solvent solutions as cosolvents: The work of Daraee et al. [52], who successfully recovered 52% of the initial CGA content of samples of sun flower seed kernels with a SFE performed at 180 bar, 40 °C, 105 min, 5% ethanol as cosolvent, and 1.6 mL/min (=1.3 g/min) of CO2 flow rate; and the SFE of apple peel [37], in which the authors used 4% of water in their ethanolic solution employed as a cosolvent at a 25% cosolvent-to-solvent concentration [37]. Even so, the recovery of CGA was comparatively low.
Thus being, a final experiment was carried out to test our general theory that the SFE recovery of CGA might be null due to the technique not involving a liquid phase that facilitates cell disruption and heavy-molecule dissolution in the fluid phase. A solution of water + methanol (1:1) was used as a co-solvent in an SFE run in replacement of the pure methanol used across the experiments in this work. The other optimized conditions were maintained constant (20% cosolvent-to-solvent ratio, 80 °C, 350 bar, and 15 g/min of CO2). The results showed a 34.4% recovery of CGA and similar levels of CFA and antioxidant activity to those reported previously. The increase of the sample moisture inside the extractor via the aqueous part of the methanolic solution used as cosolvent may have caused a more efficient disruption of the cell wall structures of the matrix, and some of the CGA content was able to successfully dissolve in the supercritical CO2. It is known that the presence of some moisture in raw samples can be beneficial in that it allows for a more efficient solvent–solute interaction, as seen in the extraction of caffeine from green coffee beans [53], or due to their role in the swelling of the solid matrix cells, which facilitates the flow of the solvent into these.
Naturally, further work on the structural characterization of the extracts and of the solid particles of the samples before and after the extraction are still necessary to completely elucidate the extraction of CGA by SFE, but the data and the discussions presented in this work can aid the advancement of the research on this topic towards higher extractions yields and recoveries via this technique.

3.5. Antioxidant Activity

Not only do high antioxidant activities usually point to good phenolic acid recoveries, but this specific analysis can also be useful in the monitoring of the effect of the extraction conditions (high temperatures and pressures) on the bioactivity of the extracts. The results regarding the antioxidant activity of the extracts from the optimization study can be found in Table 4. With regard to phenolic concentration, Run 04 was expected to have had the highest % of antioxidant activity, since it showed the highest TPR and CFA recoveries. This is the trend observed in other works reporting on phenolic extraction by other extraction techniques [13,17,54]. However, as it can be observed in Table 4, runs 01–03 presented the highest antioxidant capacities among the runs.
Apparently, the lowest methanol concentration and CO2 flow rate are directly correlated to highest antioxidant activities, but it is not clear what combination of variable levels translate into low extract activities. We may need to consider, for example, the possible presence of glycoalkaloids in the extracts, given the high concentration of these molecules in potato peels [34], and the fact that they are very polar and present high antioxidant activity against the DPPH radical [35]. There is a chance that during the extraction of the phenolic acids, the coextraction of glycoalkaloids also take place; this was already observed in other extraction protocols by other methodologies [55]. This might also explain the apparently random relationship between low-TPR extractions and high antioxidant activities. However, further studies are necessary to confirm the presence of such compounds in the final extracts, since no reports from the literature were found on their extraction by SFE.

3.6. Extraction of Phenolics by SFE vs. Other Techniques

Literature data usually points to the fact that the recovery of phenolic acids by other novel extraction technologies, such as microwave-assisted (MAE), enzyme-assisted (EAE), ultrasound-assisted (UAE), subcritical-water (SWE), and pressurized-liquid (PLE) extractions, among others, tend to be more efficient than their recovery by SFE. In very recent reviews, Osorio-Tobon [43] and Tyskiewicz et al. [32] compare the efficiency of some of these technologies for extracting phenolic compounds from a wide variety of matrices and confirm that, among the techniques assessed (MAE, PLE, UAE, and SFE), SFE shows the lowest yields and the highest extraction times overall. This trend is also confirmed by other research articles [35,56].
In older articles, and even in some of the more recent studies, the results regarding phenolic concentrations and/or recoveries via different methods are shown as TPC (total phenolic content) of gallic acid equivalents, measured by the Folin–Ciocalteu method. Some of these works also include information regarding the antioxidant activity (AA) of the extracts, measured via the DPPH method. The issue with this approach is that, since individual phenolics were not identified by more reliable techniques, such as HPLC, the results of TPC and AA could potentially be affected by widely known interferents in the extracts, such as reducing sugars, acids, and/or other antioxidant compounds [57,58]. Another related challenge is the disparity in the presentation of results across works from the literature. Some authors report extract yields as mass of phenolics (either in TPC or GAE) per dry matrix, others per mass of extract, volume of extract, and some even do so in wet basis. A more efficient way to present the results would be as % of recovery of individual and total phenolics in the extracts (relative to the raw samples), as this would enable a direct contrast between different processes and extraction protocols. Therefore, a thorough literature comparison with the results from this work is challenging.
Despite the aforementioned limitations, an in-depth analysis of the literature data still allows for interesting conclusions. Table 7 presents the articles from the last decade that aimed at extracting phenolics from the peels of potato as well as of a few other vegetables by different technologies, along with the process conditions, the phenolics identified, and the yields/recoveries attained.
The extraction of phenolics from potato peels has been assessed via a number of novel technologies, with satisfactory results being reported overall. Regarding the individual phenolics identified, it is interesting to notice the different profiles of phenolic acids in the structures of potato peels. The main compounds identified in the extracts are chlorogenic, caffeic, ferulic, gallic, sinapic, vanillic, syringic, isochlorogenic, protocatechuic, and p-coumaric acids.
As previously mentioned, because the results of potato peel extractions are reported in different formats and units, a direct comparison is difficult, but there are still some key points to be made. The main solvents used in low-pressure techniques (MAE, UAE, SWE, etc.) are aqueous solutions of ethanol or methanol, with the optimized concentration varying across different methods. Extractions are also usually quite fast, with most of them lasting only a few minutes in the case of MAE, UAE, and SWE. This is in agreement with Osorio-Tobon [43], who confirms that MAE and UAE usually require shorter extraction times than high-pressure extractions, such as pressurized-liquid extraction (PLE) and SFE. However, the temperatures used in these methodologies are very high (80–220 °C), which can lead to the degradation of phenolic molecules. Osorio-Tobon [43] also mentions that SFE requires much lower working temperatures, but that MAE still yields the highest TPCs, followed by PLE, UAE, and SFE.
Another advantage of the aforementioned techniques relative to SFE is that samples do not have to undergo previous drying and milling, since the extraction is carried out in contact with liquid solvent. In the case of SFE, however, drying the sample is usually required because the high amounts of water present in vegetable matrices are believed to compete with the solute and to interact with the solvent, decreasing the yield of the process [38].
One noticeable trend in the SFE of phenolics from other vegetable peels is that, across almost all the matrices tested, the optimized conditions for their extraction were found at the lowest levels of the extraction parameters. Optimal temperatures usually ranged from 35 to 50 °C; pressures, from 100 to 250 bar; cosolvent concentration, from 7 to 10%; and extraction times were 20–30 min. The only exceptions to this trend were the extraction of apple peels, which was optimal at 80 °C and with MeOH at 25% for 200 min, and of potato peels (this work), also performed at 80 °C and with MeOH at 20%, for 60 min. The former was also the only other work to report the yields of individual phenolics, with a 0.16 mg CGA per g of extract recovered in the final extracts.
Despite some similarities, each of the above methodologies relies on slightly different mechanisms of action, and effective molecule extraction happens according to the nature of the distinct solvent–matrix interactions involved. The high efficiency of UAE, for example, is associated with the phenomenon of ultrasound-induced cavitation, where the constant collapsing of bubbles disrupts the vegetable cells and facilitate compound migration to the liquid solvent. This is similar to what happens in MAE, where microwaves overheat the water structures and cause cell burst. In the case of SWE, this is obtained via the extremely high water temperatures involved, which greatly increase compound solubility. A similar characteristic across all these techniques, however, is that the samples, prior to extraction, are put in contact with a liquid solvent, which serves as the fluid phase that will later dissolve the molecules extracted.
From this perspective, a clear difference in SFE, relative to the aforementioned techniques, is that the fluid phase is a solvent in its supercritical state, which grants the fluid gas-like properties of diffusion, viscosity and surface tension, and liquid characteristics of density and solvation power. This combination of features renders SFE a highly efficient methodology for the extraction of many phytochemicals. However, comparatively, the extraction of phenolics from vegetable food matrices by SFE tends to deliver lower yields. On this, it is important to highlight that while there is evidence to suggest that the conditions used in SFE processes (especially T and P) are strong enough to also promote some disturbance of the vegetable cell structures, this effect does not seem nearly as pronounced as in the other techniques mentioned above [45]. This also indicates that successful extraction is still possible for molecules that are easily dispersed on the surface of the solid particles, and which can be transferred to the fluid phase via fluid convection. However, if the molecules of interest are found more strongly bound to the matrix structures (as we know to be the case with some phenolics), their extraction by supercritical CO2 might be impaired. Several models for modeling SFE extraction curves have shown that mass transfer via diffusion is the last mass transfer stage [38], and the contribution of this phenomenon to the overall extraction yields is very small, compared to extraction due to fluid convection. This can explain the comparatively low yields delivered by the SFEs of phenolics reported in the literature.

4. Conclusions

Under the optimized process conditions (80 °C, 350 bar, MeOH 20%, and CO2 flow rate of 18.0 g/min), the SFE technique was successfully employed to add value to potato peels by extracting 37% of the total phenolic acid content and 82% of the caffeic acid originally present in this matrix, along with a few other minor phenolics. The antioxidant activity of the SFE extracts was also measured, with the highest scavenging capacity reaching 84%. However, further studies addressing the null and the very low recoveries of the main phenolic in this matrix (chlorogenic acid) by the technique are still needed. According to the literature reviewed in light of the results of this work, the recovery of chlorogenic acid can possibly be enabled by testing the use of aqueous solutions of organic solvents in different concentrations as cosolvents. This approach could also potentially further improve the extraction of other phenolic compounds, which is highly interesting to consolidate SFE as a technique of comparable efficiency to other green counterparts for the recovery of these molecules.

Author Contributions

Conceptualization, M.d.A.L., D.C., and A.C.; methodology, M.d.A.L. and A.C.; software, M.d.A.L.; validation, M.d.A.L. and R.A.; formal analysis, R.A.; investigation, M.d.A.L. and R.A.; data curation, M.d.A.L. and R.A.; writing—original draft preparation, M.d.A.L. and R.A.; writing—review and editing, M.d.A.L. and A.C.; supervision, A.C. and D.C.; project administration, A.C. and D.C.; funding acquisition, A.C., D.C. and M.d.A.L. All authors have read and agreed to the published version of the manuscript.

Funding

This research was funded by CAPES—Coordination for the Improvement of Higher Education Personnel (Brazil), grant number 99999.011894/2013-00.

Institutional Review Board Statement

Not applicable.

Informed Consent Statement

Not applicable.

Data Availability Statement

The data that support the findings of this study are available from the corresponding author, [M.d.A.L.], upon reasonable request.

Conflicts of Interest

The authors declare no conflict of interest.

References

  1. Gebrechristos, H.Y.; Chen, W. Utilization of potato peel as eco-friendly products: A review. Food Sci. Nutr. 2018, 6, 1352–1356. [Google Scholar] [CrossRef] [Green Version]
  2. FAOSTAT. Global Food Losses and Food Waste: Extent, Causes and Prevention. 2012. Available online: http://faostat.fao.org (accessed on 1 March 2021).
  3. Israilides, C.; Vlyssides, A.G.; Arapoglou, D.; Marchant, R.; Vlysides, A.A. Integrated managemnet of potato starch waste. Proc. Waste 2008 Waste Resour. Manag. A Shar. Responsib 2008, 11, 36. [Google Scholar]
  4. Akyol, H.; Riciputi, Y.; Capanoglu, E.; Caboni, M.F.; Verardo, V. Phenolic Compounds in the Potato and Its Byproducts: An Overview. Int. J. Mol. Sci. 2016, 17, 835. [Google Scholar] [CrossRef]
  5. Gaudino, E.C.; Colletti, A.; Grillo, G.; Tabasso, S.; Cravotto, G. Emerging Processing Technologies for the Recovery of Valuable Bioactive Compounds from Potato Peels. Foods 2020, 9, 1598. [Google Scholar] [CrossRef]
  6. Sampaio, S.L.; Petropoulos, S.A.; Alexopoulos, A.; Heleno, S.A.; Santos-buelga, C.; Barros, L.; Ferreira, I.C.F.R. Trends in Food Science & Technology Potato peels as sources of functional compounds for the food industry: A review. Trends Food Sci. Technol. 2020, 103, 118–129. [Google Scholar]
  7. Samarin, A.M.; Poorazarang, H.; Hematyar, N.; Poorazarang, H. Phenolics in Potato Peels: Extraction and Utilization as Natural Antioxidants. World Appl. Sci. J. 2017, 18, 16–21. [Google Scholar]
  8. Silva-beltrán, N.P.; Chaidez-quiroz, C.; López-cuevas, O.; Ruiz-cruz, S.; López-Mata, M.A.; Del-Toro-Sánchez, C.L.; Marquez-Rios, E.; Ornelas-Paz, J.d. Phenolic Compounds of Potato Peel Extracts: Their Antioxidant Activity and Protection against Human Enteric Viruses. J. Microbiol. Biotechnol. Res. 2017, 27, 234–241. [Google Scholar] [CrossRef] [PubMed] [Green Version]
  9. Friedman, M.; Huang, V.; Quiambao, Q.; Noritake, S.; Liu, J.; Kwon, O.; Chintalapati, S.; Young, J.; Levin, C.E.; Tam, C.; et al. Potato Peels and Their Bioactive Glycoalkaloids and Phenolic Compounds Inhibit the Growth of Pathogenic Trichomonads. J. Agric. Food Chem. 2018, 66, 7942–7947. [Google Scholar] [CrossRef] [PubMed]
  10. Venturi, F.; Bartolini, S.; Sanmartin, C.; Orlando, M.; Taglieri, I.; Macaluso, M.; Lucchesini, M.; Trivellini, A.; Zinnai, A.; Mensuali, A. Applied sciences Potato Peels as a Source of Novel Green Extracts Suitable as Antioxidant Additives for Fresh-Cut Fruits. Appl. Sci. 2019, 9, 2431. [Google Scholar] [CrossRef] [Green Version]
  11. Panzella, L.; Moccia, F.; Nasti, R.; Marzorati, S.; Verotta, L.; Napolitano, A. Bioactive Phenolic Compounds From Agri-Food Wastes: An Update on Green and Sustainable Extraction Methodologies. Front. Nutr. 2020, 7, 60. [Google Scholar] [CrossRef] [PubMed]
  12. Pimentel-Moral, S.; Cadiz-Gurrea, M.d.; Celia, R.-P.; Segura-carretero, A. Functional and Preservative Properties of Phytochemicals; Elsevier: Amsterdam, The Netherlands, 2020; pp. 208–239. [Google Scholar]
  13. Zhu, X.; Cheng, Y.; Chen, P.; Peng, P.; Liu, S.; Li, D.; Ruan, R. Effect of alkaline and high-pressure homogenization on the extraction of phenolic acids from potato peels. Innov. Food Sci. Emerg. Technol. 2016, 37, 91–97. [Google Scholar] [CrossRef] [Green Version]
  14. Wu, T.; Yan, J.; Liu, R.; Marcone, M.F.; Aisa, H.A.; Tsao, R. Optimization of microwave-assisted extraction of phenolics from potato and its downstream waste using orthogonal array design. Food Chem. 2012, 133, 1292–1298. [Google Scholar] [CrossRef]
  15. Frontuto, D.; Carullo, D.; Harrison, S.M.; Brunton, N.P.; Ferrari, G.; Lyng, J.G.; Pataro, G. Optimization of Pulsed Electric Fields-Assisted Extraction of Polyphenols from Potato Peels Using Response Surface Methodology. Food Bioprocess Technol. 2019, 12, 1708–1720. [Google Scholar] [CrossRef]
  16. Singh, P.P.; Saldaña, M.D. Subcritical water extraction of phenolic compounds from potato peel. Food Res. Int. 2011, 44, 2452–2458. [Google Scholar] [CrossRef]
  17. Martinez-Fernandez, J.S.; Gu, X.; Chen, S. Techno-economic assessment of bioactive compound recovery from potato peels with sequential hydrothermal extraction. J. Clean. Prod. 2021, 282, 124356. [Google Scholar] [CrossRef]
  18. Kumari, B.; Tiwari, B.K.; Hossain, M.B.; Rai, D.K.; Brunton, N.P. Original article Ultrasound-assisted extraction of polyphenols from potato peels: Profiling and kinetic modelling. Int. J. Food Sci. Technol. 2017, 52, 1432–1439. [Google Scholar] [CrossRef] [Green Version]
  19. AOAC. Official Methods of Analysis of AOAC International, 20th ed.; AOAC International: Gaithersburg, MD, USA, 2016; pp. 1122–1124. [Google Scholar]
  20. AOAC International. Official Methods of Analysis, 15th ed.; AOAC International: Gaithersburg, MD, USA, 1990; ISBN 0849328993. [Google Scholar]
  21. Sluiter, A.; Hames, B.; Ruiz, R.; Scarlata, C.; Sluiter, J.; Templeton, D.; Crocker, D. NREL/TP-510-42618 analytical procedure—Determination of structural carbohydrates and lignin in Biomass. Lab. Anal. Proced. 2012, 1617, 1–16, Technical Report: NREL/TP-510-42618. [Google Scholar]
  22. Dai, J.; Mumper, R.J. Plant Phenolics: Extraction, Analysis and Their Antioxidant and Anticancer Properties. Molecules 2010, 15, 7313–7352. [Google Scholar] [CrossRef]
  23. Kim, K.-H.; Tsao, R.; Yang, R.; Cui, S.W. Phenolic acid profiles and antioxidant activities of wheat bran extracts and the effect of hydrolysis conditions. Food Chem. 2006, 95, 466–473. [Google Scholar] [CrossRef]
  24. Pisoschi, A.M.; Negulescu, G.P. Methods for Total Antioxidant Activity Determination: A Review. Biochem. Anal. Biochem. 2012, 01, 1–10. [Google Scholar] [CrossRef] [Green Version]
  25. Mohdaly, A.A.A.; Sarhan, M.A.; Smetanska, I.; Mahmoud, A. Antioxidant properties of various solvent extracts of potato peel, sugar beet pulp and sesame cake. J. Sci. Food Agric. 2009, 90, 218–226. [Google Scholar] [CrossRef] [PubMed]
  26. Ezekiel, R.; Singh, N.; Sharma, S.; Kaur, A. Beneficial phytochemicals in potato—A review. Food Res. Int. J. 2013, 50, 487–496. [Google Scholar] [CrossRef]
  27. Joly, N.; Souidi, K.; Depraetere, D.; Wils, D.; Martin, P. Potato By-Products as a Source of Natural Chlorogenic Acids and Phenolic Compounds: Extraction, Characterization, and Antioxidant Capacity. Molecules 2020, 26, 177. [Google Scholar] [CrossRef] [PubMed]
  28. Acosta-Estrada, B.A.; Gutiérrez-Uribe, J.A.; Serna-Saldívar, S.O. Bound phenolics in foods, a review. Food Chem. 2014, 152, 46–55. [Google Scholar] [CrossRef] [PubMed]
  29. Waldron, K. Handbook of Waste Management and Co-Product Recovery in Food Processing (v.1); CRC Press, Woodhead Publishing Limited: Cambridge, UK, 2007. [Google Scholar]
  30. Lattanzio, V. Bioactive polyphenols: Their role in quality and storability of fruit and vegetables. J. Appl. Bot. 2003, 77, 128–146. [Google Scholar]
  31. Lattanzio, V.; Lattanzio, V.M.T.; Cardinali, A. Role of Phenolics in the Resistance Mechanisms of Plants against Fungal Pathogens and Insects. Phytochem. Adv. Res. 2006, 661, 23–67. [Google Scholar]
  32. Tyśkiewicz, K.; Konkol, M.; Rój, E. The Application of Supercritical Fluid Extraction in Phenolic Compounds Isolation from Natural Plant Materials. Molecules 2018, 23, 2625. [Google Scholar] [CrossRef] [PubMed] [Green Version]
  33. Ghafoor, K.; Park, J.; Choi, Y.-H. Optimization of supercritical fluid extraction of bioactive compounds from grape (Vitis labrusca B.) peel by using response surface methodology. Innov. Food Sci. Emerg. Technol. 2010, 11, 485–490. [Google Scholar] [CrossRef]
  34. Fathordoobady, F.; Mirhosseini, H.; Selamat, J.; Manap, M.Y.A. Effect of solvent type and ratio on betacyanins and antioxidant activity of extracts from Hylocereus polyrhizus flesh and peel by supercritical fluid extraction and solvent extraction. Food Chem. 2016, 202, 70–80. [Google Scholar] [CrossRef]
  35. M’hiri, N.; Ioannou, I.; Boudhrioua, N.M.; Ghoul, M. Food and Bioproducts Processing Effect of different operating conditions on the extraction of phenolic compounds in orange peel. Food Bioprod. Process. 2015, 96, 161–170. [Google Scholar] [CrossRef]
  36. Omar, J.; Alonso, I.; Garaikoetxea, A.; Etxebarria, N. Optimization of Focused Ultrasound Extraction (FUSE) and Supercritical Fluid Extraction (SFE) of Citrus Peel Volatile Oils and Antioxidants. Food Anal. Methods 2013, 6, 1244–1252. [Google Scholar] [CrossRef]
  37. Massias, A.; Boisard, S.; Baccaunaud, M.; Leal, F.; Subra-paternault, P. The Journal of Supercritical Fluids Recovery of phenolics from apple peels using CO 2 + ethanol extraction: Kinetics and antioxidant activity of extracts. J. Supercrit. Fluids. 2015, 98, 172–182. [Google Scholar] [CrossRef]
  38. De Melo, M.; Silvestre, A.; Silva, C. Supercritical fluid extraction of vegetable matrices: Applications, trends and future perspectives of a convincing green technology. J. Supercrit. Fluids 2014, 92, 115–176. [Google Scholar] [CrossRef]
  39. Veggi, P.C.; Prado, J.M.; Bataglion, G.A.; Eberlin, M.N.; Meireles, M.A.A. Obtaining phenolic compounds from jatoba (Hymenaea courbaril L.) bark by supercritical fluid extraction. J. Supercrit. Fluids 2014, 89, 68–77. [Google Scholar] [CrossRef]
  40. Kim, S.; Chen, J.; Cheng, T.; Gindulyte, A.; He, J.; He, S.; Li, Q.; Shoemaker, B.A.; A Thiessen, P.; Yu, B.; et al. PubChem in 2021: New data content and improved web interfaces. Nucleic Acids Res. 2021, 49, D1388–D1395. [Google Scholar] [CrossRef]
  41. Lima, M.D.A.; Kestekoglou, I.; Charalampopoulos, D.; Chatzifragkou, A. Supercritical Fluid Extraction of Carotenoids from Vegetable Waste Matrices. Molecules 2019, 24, 466. [Google Scholar] [CrossRef] [PubMed] [Green Version]
  42. Khoddami, A.; Wilkes, M.A.; Roberts, T.H. Techniques for Analysis of Plant Phenolic Compounds. Molecules 2013, 18, 2328–2375. [Google Scholar] [CrossRef]
  43. Osorio-Tobón, J.F. Recent advances and comparisons of conventional and alternative extraction techniques of phenolic compounds. J. Food Sci. Technol. 2020, 57, 4299–4315. [Google Scholar] [CrossRef] [PubMed]
  44. Garmus, T.T.; Paviani, L.C.; Queiroga, C.L.; Cabral, F.A. Extraction of phenolic compounds from pepper-rosmarin (Lippia sidoides Cham.) leaves by sequential extraction in fixed bed extractor using supercritical CO2, ethanol and water as solvents. J. Supercrit. Fluids 2015, 99, 68–75. [Google Scholar] [CrossRef]
  45. Dias, A.L.B.; Sergio, C.S.A.; Santos, P.; Barbero, G.F.; Rezende, C.A.; Martínez, J. Effect of ultrasound on the supercritical CO2 extraction of bioactive compounds from dedo de moça pepper (Capsicum baccatum L. var. pendulum). Ultrason. Sonochem. 2016, 31, 284–294. [Google Scholar] [CrossRef] [PubMed]
  46. Machmudah, S.; Martin, A.; Sasaki, M.; Goto, M. Mathematical modeling for simultaneous extraction and fractionation process of coffee beans with supercritical CO2 and water. J. Supercrit. Fluids 2012, 66, 111–119. [Google Scholar] [CrossRef]
  47. Solana, M.; Boschiero, I.; Dall’Acqua, S.; Bertucco, A. Extraction of bioactive enriched fractions from Eruca sativa leaves by supercritical CO2 technology using different co-solvents. J. Supercrit. Fluids 2014, 94, 245–251. [Google Scholar] [CrossRef]
  48. Konar, N.; Dalabasmaz, S.; Poyrazoglu, E.S.; Artik, N.; Colak, A. The determination of the caffeic acid derivatives of Echinacea purpurea aerial parts under various extraction conditions by supercritical fluid extraction (SFE). J. Supercrit. Fluids 2014, 89, 128–136. [Google Scholar] [CrossRef]
  49. Pimentel-Moral, S.; Borrás-linares, I.; Lozano-sánchez, J. Supercritical CO2 extraction of bioactive compounds from Hibiscus sabdariffa. J. Supercrit. Fluids 2019, 147, 213–221. [Google Scholar] [CrossRef]
  50. Wu, Y.; Liu, B.; Chang, Y.; Wang, Q. Optimization of Modified Supercritical CO2 Extraction of Chlorogenic Acid from the Flower Buds of Lonicera japonica Thunb and Determination of Antioxidant Activity of the Extracts Optimization of Modified Supercritical CO2 Extraction of Chlorogenic Acid f. J. Liq. Chromatogr. Relat. Technol. 2015, 38, 443–450. [Google Scholar] [CrossRef]
  51. Wu, X.-L.; Li, C.-W.; Chen, H.-M.; Su, Z.-Q.; Zhao, X.-N.; Chen, J.-N.; Lai, X.-P.; Zhang, X.-J.; Su, Z.-R. Anti-Inflammatory Effect of Supercritical-Carbon Dioxide Fluid Extract from Flowers and Buds ofChrysanthemum indicumLinnén. Evid. Based Complement. Altern. Med. 2013, 2013, 1–13. [Google Scholar] [CrossRef] [PubMed] [Green Version]
  52. Daraee, A.; Ghoreishi, S.M.; Hedayati, A. Supercritical CO2 extraction of chlorogenic acid from sunflower (Helianthus annuus) seed kernels: Modeling and optimization by response surface methodology. J. Supercrit. Fluids 2019, 144, 19–27. [Google Scholar] [CrossRef]
  53. Pereira, C.G.; Meireles, M.A.A. Supercritical Fluid Extraction of Bioactive Compounds: Fundamentals, Applications and Economic Perspectives. Food Bioprocess Technol. 2010, 3, 340–372. [Google Scholar] [CrossRef]
  54. Singh, A.; Sabally, K.; Kubow, S.; Donnelly, D.J.; Gariepy, Y.; Orsat, V.; Raghavan, G. Microwave-Assisted Extraction of Phenolic Antioxidants from Potato Peels. Molecules 2011, 16, 2218–2232. [Google Scholar] [CrossRef] [PubMed] [Green Version]
  55. Maldonado, A.F.S.; Mudge, E.; Gänzle, M.G.; Schieber, A. Extraction and fractionation of phenolic acids and glycoalkaloids from potato peels using acidified water/ethanol-based solvents. Food Res. Int. 2014, 65, 27–34. [Google Scholar] [CrossRef]
  56. Solana, M.; Boschiero, I.; Dall’Acqua, S.; Bertucco, A. A comparison between supercritical fluid and pressurized liquid extraction methods for obtaining phenolic compounds from Asparagus officinalis L. J. Supercrit. Fluids 2015, 100, 201–208. [Google Scholar] [CrossRef]
  57. Roslan, A.S.; Ando, Y.; Azlan, A.; Ismail, A. Effect of Glucose and Ascorbic Acid on Total Phenolic Content Estimation of Green Tea and Commercial Fruit Juices by Using Folin Ciocalteu and Fast Blue BB Assays. J. Trop. Agric. Sci. 2019, 42, 545–556. [Google Scholar]
  58. Schaich, K.; Tian, X.; Xie, J. Hurdles and pitfalls in measuring antioxidant efficacy: A critical evaluation of ABTS, DPPH, and ORAC assays. J. Funct. Foods 2015, 14, 111–125. [Google Scholar] [CrossRef]
  59. Paleologou, I.; Vasiliou, A.; Grigorakis, S.; Makris, D.P. Optimisation of a green ultrasound-assisted extraction process for potato peel (Solanum tuberosum) polyphenols using bio-solvents and response surface methodology. Biomass Convers. Biorefinery 2016, 6, 289–299. [Google Scholar] [CrossRef]
  60. Alvarez, V.H.; Cahyadi, J.; Xu, D.; Saldaña, M.D. Optimization of phytochemicals production from potato peel using subcritical water: Experimental and dynamic modeling. J. Supercrit. Fluids 2014, 90, 8–17. [Google Scholar] [CrossRef]
  61. Wang, S.; Lin, A.H.-M.; Han, Q.; Xu, Q. Evaluation of Direct Ultrasound-Assisted Extraction of Phenolic Compounds from Potato Peels. Processes 2020, 8, 1665. [Google Scholar] [CrossRef]
  62. Kadiri, O.; Gbadamosi, S.O.; Akanbi, C.T. Extraction kinetics, modelling and optimization of phenolic antioxidants from sweet potato peel vis-a-vis RSM, ANN-GA and application in functional noodles. J. Food Meas. Charact. 2019, 13, 3267–3284. [Google Scholar] [CrossRef]
Figure 1. Pareto chart of effects for both responses of the optimization study for the SFE of potato peels: TPR (a) and CFA recovery (b).
Applsci 11 03410 g001
Figure 2. Response surfaces of MeOH% vs. qCO2 of the models generated for (a) TPR and (b) CFA recovery of potato peels by SFE.
Applsci 11 03410 g002
Table 1. Macronutrient composition of potato peels and flesh in d.b. (dry basis).
Compound (%, w/w)Potato PeelsPotato Flesh
Moisture6.6 ± 0.4 a7.2 ± 0.4 a
Protein11.0 ± 0.15 a7.1 ± 0.21 b
Lipids1.75 ± 0.02 a2.61 ± 0.05 b
Total carbohydrates,
of which:
62.4 ± 3.3 a76.4 ± 3.3 b
Starch20.0 ± 1.347.7 ± 2.8
Cellulose32.4 ± 0.728.7 ± 0.5
Hemicellulose,
of which:
10.0 ± 0.70
Galacturonic acid2.64 ± 0.21n.d.
Galactose6.34 ± 0.33n.d.
Arabinose1.01 ± 0.09n.d.
n.d.: Not detected. Identical superscript letters in the same rows indicate no significant difference between the samples.
Table 2. Identification and quantification of phenolics in the samples of potato peels.
Phenolic AcidConcentration (mg/g)Total Phenolic Content (mg GAE/g)
Chlorogenic acid3.875.24
Caffeic acid0.92
Neochlorogenic acid0.44
Isochlorogenic acid B0.33
Vanillic acid0.31
Isochlorogenic acid A0.21
p-coumaric acidTrace
Salicylic acidTrace
Total6.085.24
Table 3. Phenolic acid supercritical fluid extraction from potato peels in screening runs. The extraction time was fixed at 60 min in all runs.
RunConditionsPhenolic AcidConcent (mg/g)Individual Recovery (%)Total Phenolic Recovery (%)
T (°C)P (bar)MeOH (%)qCO2 (g/min)
E1451507.05.0Caffeic0.0313.0 a10.5 a
E2603507.05.0Caffeic0.0414.0 a10.7 a
E3803507.010.0Caffeic0.18119.4 b16.0 b
Isochlorogenic A 0.18487.6 a2
E48035015.010.0Caffeic0.47451.6 c111.1 c
Isochlorogenic A0.20296.1 b2
E58035015.015.0Caffeic0.40444.0 d113.5 d
P-coumaric0.140
Isochlorogenic A0.280133 c2
Concerning the individual recovery column, identical superscript letters indicate no significant difference among the extraction runs in relation to the respective phenolic acid (1: Caffeic acid, 2: Isochlorogenic acid A). Similarly, in the total phenolic recovery column, identical superscript letters indicate no significant difference among the extraction runs.
Table 4. Experimental conditions for the optimization study regarding the supercritical fluid extraction (SFE) of potato peels. The responses were analyzed as a function of % of total phenolic recovery (TPR), caffeic acid recovery, and antioxidant activity. Fixed independent variables: T: 80 °C, P: 350 bar, text: 60 min. CFA: Caffeic acid.
RunMeOH (%)qCO2 (g/min)CFA (%)TPR (%)Antioxidant Activity (%)
011085.63.483.1 ± 3.3 a
02101829.412.184.0 ± 2.9 a
0320867.327.183.8 ± 3.6 a
042018823773.0 ± 2.7 b
057.91319.39.856.8 ± 2.1 c
0622.11363.633.669.0 ± 2.2 b
07155.911.27.765.1 ± 1.8 d
081520.162.23373.5 ± 3.1 b
09151335.321.878.6 ± 2.8 b
10151332.219.278.7 ± 3.1 b
11151323.91477.1 ± 3.1 b
Concerning antioxidant activity, identical superscript letters indicate no significant difference among results.
Table 5. Analysis of variance of the models generated for TPR and CFA recovery.
ResponseANOVA ParametersSquare SumDegrees of FreedomMean SquareF-Valuep-Value (%)R2
Total phenolic recovery (TPR)Regression1227.55245.5012.4150.925
Residual98.9519.78
Total1326.410
Ftab (95%) 5.05
Caffeic acid (CFA) recoveryRegression5806.851161.49.0450.90
Residual642.35128.5
Total6449.110-
Ftab (95%) 5.05
Table 6. Run 12 (very high CO2 flow rate) compared to runs with lower solvent flow rates.
RunMeOH (%)QCO2 (g/min)CFA (%)TPR (%)
07155.911.27.7
09151335.321.8
081520.162.233
12152532.121.9
Table 7. Literature data on the extraction of phenolic acids from potato peels via different green technologies in the last decade.
MatrixExtraction TechniqueOptimal ConditionsPhenolic Characterization (HPLC)Optimized Yield (Y, mg/g Extract) or Recovery (R, %)% AARef.
Potato peelConventional solventWater + ethanol, Csolv: 59%, RL/S: 84 mL/g; T: 77 °Cn.r.Y: 9.11 mg CFA/gn.r.[59]
46% water + 51% ethanol + 3% acetic acid. T: 40 °C.CGA, NCA, CFAY: 1.03 mg TPC/g (wet basis); R: 89–97%n.r[55]
Hydrolysis + HPH0.3 M NaOH; 18 h hydrolysis, 2 homogenisation cycles.CGA, CFA, FRA, GLA, SNA, VLA, SGA, PHA, PCAY: 1.36 mg TPC/g (wet basis)34–59[13]
MAE60% ethanol, T: 80 °C, text: 2 min, RS/S: 1:40CGA, CFA, FRA, PCAY: 1.12 mg GAE/g34–96[14]
64% methanol, text: 2 min, MP: 14.7%CGA, CFA, FRAY: 3.94 mg TPC/g34–86[54]
PEF52% ethanol + 48% water, text: 230 min, T: 50 °C, E: 1 kV/cm, WT: 5 kJ/kgCGA, CFA, PCA, SGA, PHAY: 0.462 mg TPC/g (wet basis)n.r.[15]
SWE100% methanol, T: 180 °C, text: 60 min.CGA, GLA, CFA, PCA, FRA, PCA, SGA, PBAY: 0.818 mg TPC/g (wet basis)n.r.[16]
P: 40 bar, T: 190 °C, SHT: 9 min, text: 30 min, q: 3 mL/minCGA, GLA, SGAY: 20 mg GAE/g dry peeln.r.[60]
SHE (modified SWE)T: 170 °C and 220 °C, text: 20 minCGA, GLA, CFA, FRA, SGA, PCAR: 32.87 mg TPC/g dry peel40–92[17]
UAE80% methanol, T: 45 °C, RS/S: 10%, text: 60 min, f: 33 Hz CGA, CFAY: 7.7 mg GAE/gn.r.[18]
50% methanol, T: 70 °C, RS/S: 5%, text: 60 min, f: 40 Hzn.rY: 9.3 mg GAE/g50–67[61]
SFET: 80 °C, P: 350 bar, Ccos: MeOH at 20% q: 18 g/minCFA, PCA, ISAY: 2.24 mg TPC/g dry peel, R: 37% TPC57–84This work
Sweet potato peelConventional solventWater, T: 98.7 °C, RS/S: 11.68%, text: 60.5 minn.r.Y: 19.74 mg GAE/g and 0.396 mg TPC/g.61.8 μg AAE/g[62]
Grape peelsSFET: 45 °C, P: 160 bar, Ccos: MeOH at 7%, q: 2 mL/min, text: 30 minn.r.Y: 0.216 mg GAE/mL ext.93[33]
Red pitaya peelsT: 50 °C, P: 250 bar, Ccos: EtOH at 10% q: 2 mL/min.n.r.Y: 0.028 mg betacyanins/mL ext.44–86[34]
Orange peelsT: 80 °C, P: 100 bar, Ccos: 80% EtOH at 10% q: 15 g/min, text: 30 minn.r.Y: 15.0 mg GAE/g n.r.[35]
Lemon peelsT: 35 °C, P: 170 bar, Ccos: EtOH at 40% q: 2 mL/min, text: 20 minn.r.Y: 6.63 mg GAE/gn.r.[36]
Apple peelsT: 50 °C, P: 250 bar, Ccos: 96% EtOH at 25% q: 10 g/min, text: 200 minCGA, flavonoids (catechin, epi-catechin, phlorizin, quercetin)Y: 0.16 mg GLA/g ext.; 34.7 mg GAE/g ext.n.r.[37]
HPH: High pressure homogenization; MAE: Microwave-assisted extraction; PEF: Pulsed electric fields extraction, SWE: Subcritical water extraction, SHE: Sequential hydrothermal extraction, UAE: Ultrasound assisted extraction; T: Temperature; P: Pressure; text: Extraction time; q: Flow rate, f: Frequency, MP: Microwave power, Csolv: Solvent concentration, Ccos: Cosolvent concentration; RL/S: Liquid to solvent ratio, RS/S: Solid to solvent ratio, E: Electric field intensity, WT: Specific energy input, SHT: Static holding time; CGA: Chlorogenic acid, CFA: Caffeic acid, FRA: Ferulic acid, GLA: Gallic acid, SNA: Sinapic acid, VLA: Vanillic acid, SGA: Syringic acid, ISA: Isochlorogenic acid, PHA: Protocatechuic acid, PCA: p-coumaric acid, PBA: p-hydroxyl benzoic acid; GAE: Gallic acid equivalents, CAE: Caffeic acid equivalents, AAE: Ascorbic acid equivalents; n.r.: Not reported.
Publisher’s Note: MDPI stays neutral with regard to jurisdictional claims in published maps and institutional affiliations.

