Abstract
Compared with the commonest geosynthetics-reinforced soil structures, layered geogrids–sand–clay reinforced (LGSCR) structures (School of Architecture and Civil Engineering, Shenyang University of Technology, Shenyang 110870, China) can replace granular materials with clay as the primary backfill material. Up until now, the performance of LGSCR structures under triaxial compression has been unclear. In this paper, the discrete element method was used to simulate the triaxial compression test on the LGSCR samples. Based on the particle flow software PFC3D, three types of cluster particle-simulated sand and the reinforced joints of the geogrid were constructed by secondary development. The effects of the geogrid embedment in sand layers, the number and thickness of sand layers in relation to the deviatoric stress, and the axial strain and the shear strength index of the LGSCR samples were analyzed. The results showed that laying the sand layers in the samples can improve their post-peak strain-softening characteristics and increase their peak strengths under a high confining pressure. A geogrid embedment in sand layers can further enhance the ductility and peak strength of the samples, and in terms of the shear strength index, there is a 41.6% to 54.8% increase in the apparent cohesion of the samples.
1. Introduction
The commonest geosynthetics-reinforced soil (GRS) structures that embed geosynthetics in the soil have been widely used in practical engineering. The backfill material is one of the main components of GRS structures and accounts for 30–40% of their cost [1]. The existing design specifications generally consider free-draining granular substances as the backfill material in the reinforced region [2,3,4,5]. As clay is one of the most abundant and inexpensive building materials, if the modified clay available on-site can be used as the backfill material of GRS structures, then the cost can be reduced and the environmental impact associated with the disposal of the excavated soil can be lessened [6,7].
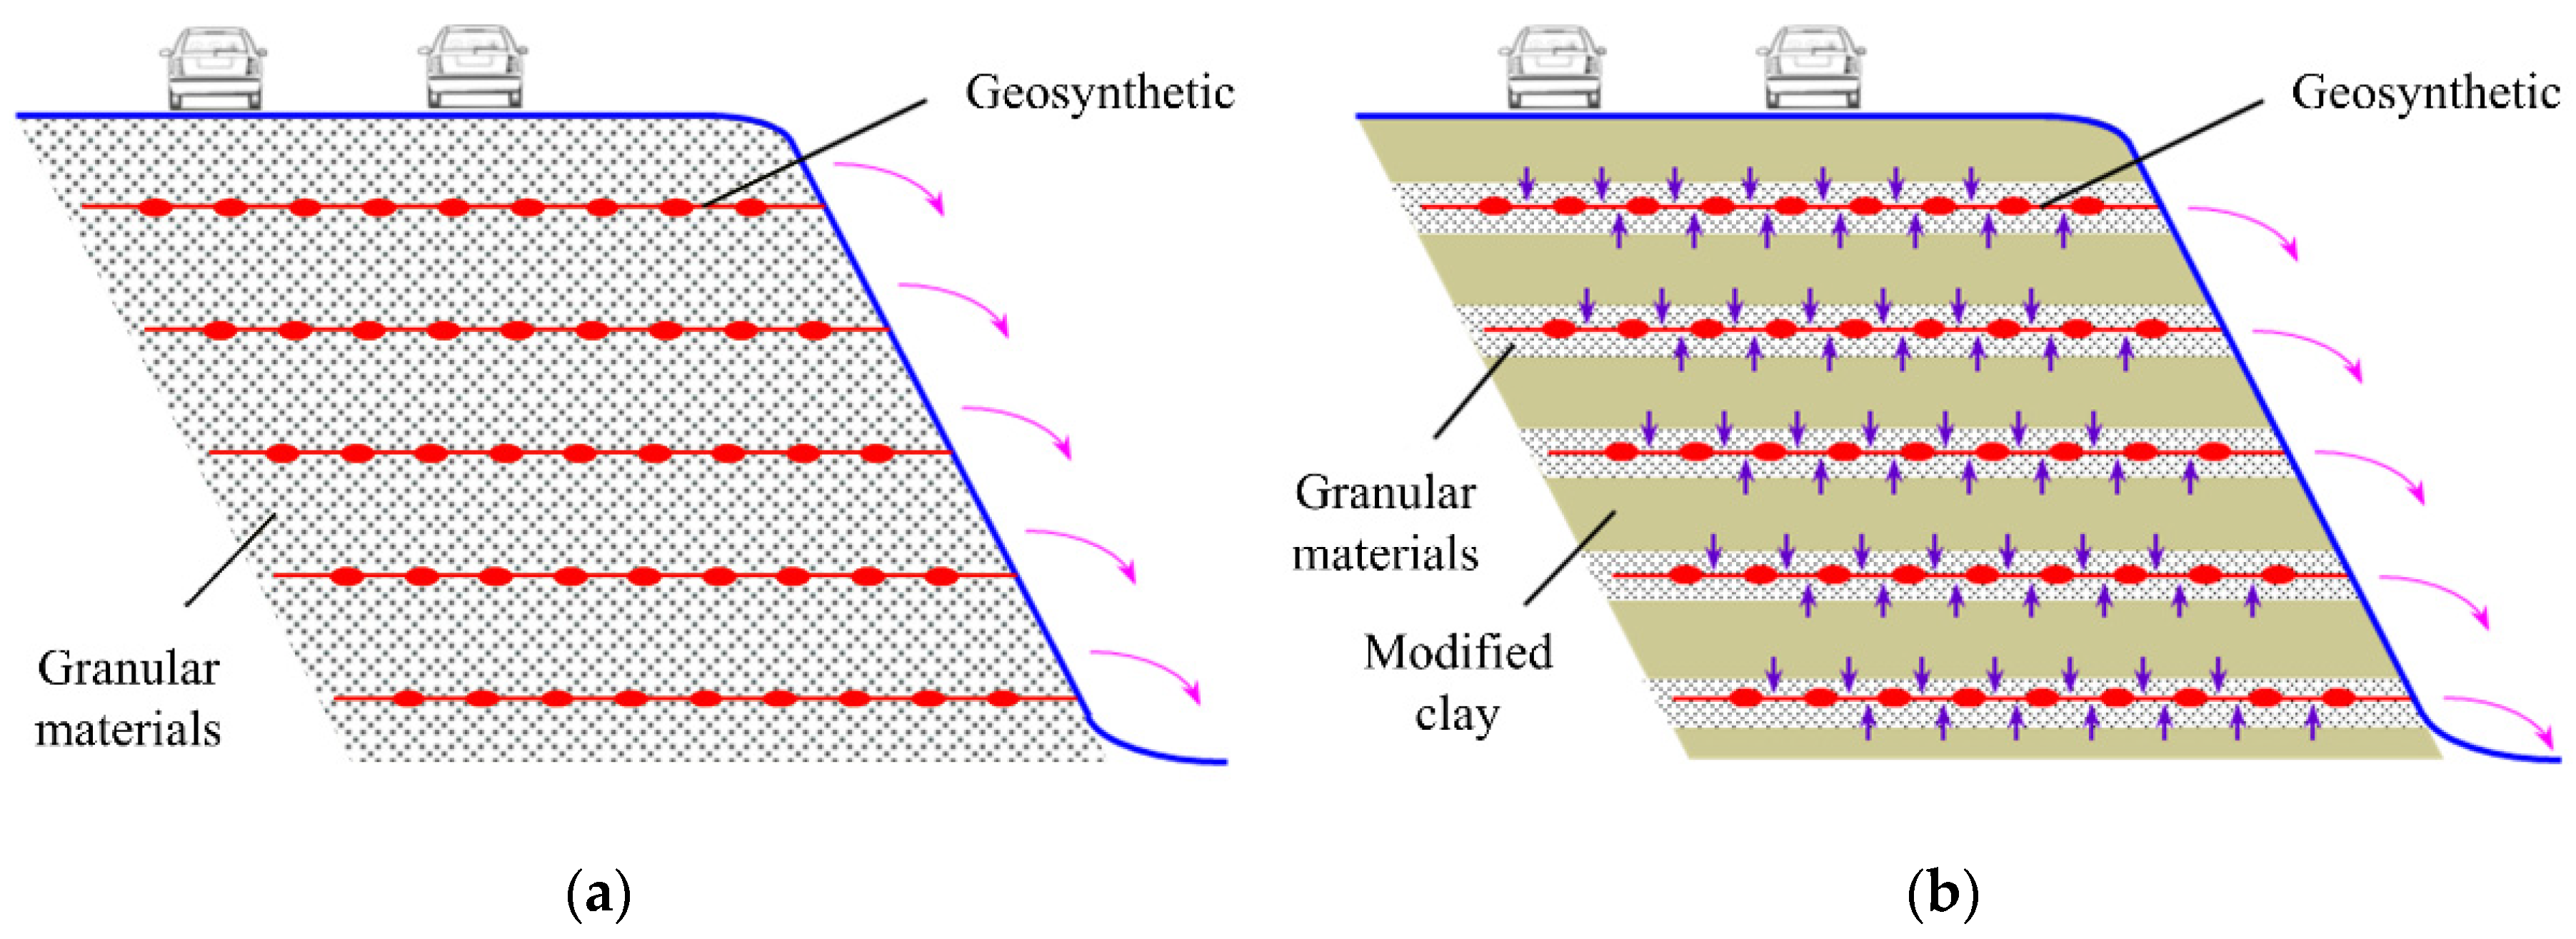
During the long-term operation of GRS structures, factors such as rainfall, the freeze–thaw cycle, and the change in the groundwater level can lead to a significant increase in the water content of fillers. When clay is used as the backfill material for the commonest GRS structures, the strength of the geosynthetics–clay interface decreases significantly with an increase in the water content of the clay [8], resulting in the instability of the structure. In order to solve this problem, the layered geosynthetics–granule–clay reinforced structure was proposed based on commonest geosynthetics-reinforced soil structures [9,10], as shown in Figure 1. The proposed structures adopt a sandwich technology by laying a thin layer of sand around the geosynthetics and use a clay filler outside the thin layer of the sand. By using clay as the primary filler, some experimental studies conducted on the proposed structures [10,11,12,13] demonstrate that they fully exploit the high-quality drainage performance of the granular material along with the superior friction between the geosynthetics and the granular material to ensure the long-term stability of structures.
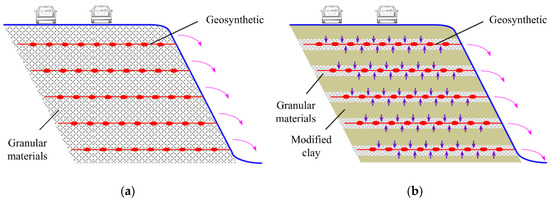
Figure 1.
Schematic drawing of the structures: (a) commonest geosynthetics-reinforced soil structure; (b) layered geosynthetics–granule–clay reinforced structure.
Based on the equivalent confining stress concept [14] and the pseudo-cohesion concept [15], the triaxial compression test is commonly used to study the mechanical responses of the geosynthetics-reinforced soil structure. To date, there is a lack of research on layered geosynthetics–granule–clay reinforced structures under triaxial compression. The simulation technique using three-dimensional particle flow software can accurately realize the triaxial compression test [16,17,18,19]. This paper utilizes the three-dimensional particle flow software PFC3D to carry out the triaxial compression test of the layered geosynthetics–granule–clay reinforced structure. The geogrids and sand are used as the geosynthetics and granular materials of a layered geosynthetics–granule–clay reinforced structure. Based on PFC3D, three types of cluster particles were secondarily developed to simulate sand and to construct the reinforced joints of the geogrid. Thus, the numerical triaxial compression test model of the layered geogrids–sand–clay reinforced (LGSCR) structure is established. Furthermore, the influences of the laying parameters of the sand layer and the geogrid-reinforced sand layer on the numerical triaxial compression test results of the samples are examined, which can provide a frame of reference for the study of the physical and mechanical properties of LGSCR structures.
2. DEM Modeling
The confined space for the triaxial compression test of the LGSCR samples in PFC3D is a frictionless, flexible cylinder with a height (H) of 80 mm and a diameter (D) of 40 mm and two frictionless rigid-loading plates. In the triaxial compression test process, the axial load is applied by setting the speed of the rigid-loading plates, and the servomechanism controls the radial movement of the cylinder to maintain the stability of the confining pressure. In order to reduce the boundary effect, a stiffness reduction factor of 0.5 was used to consider the flexible constraint of the cylindrical wall; however, a stiffness amplification factor of 5.0 was adopted for the two loading plates to realize the axial rigid loading.
2.1. Particle Flow Simulation of Filler and Geogrid
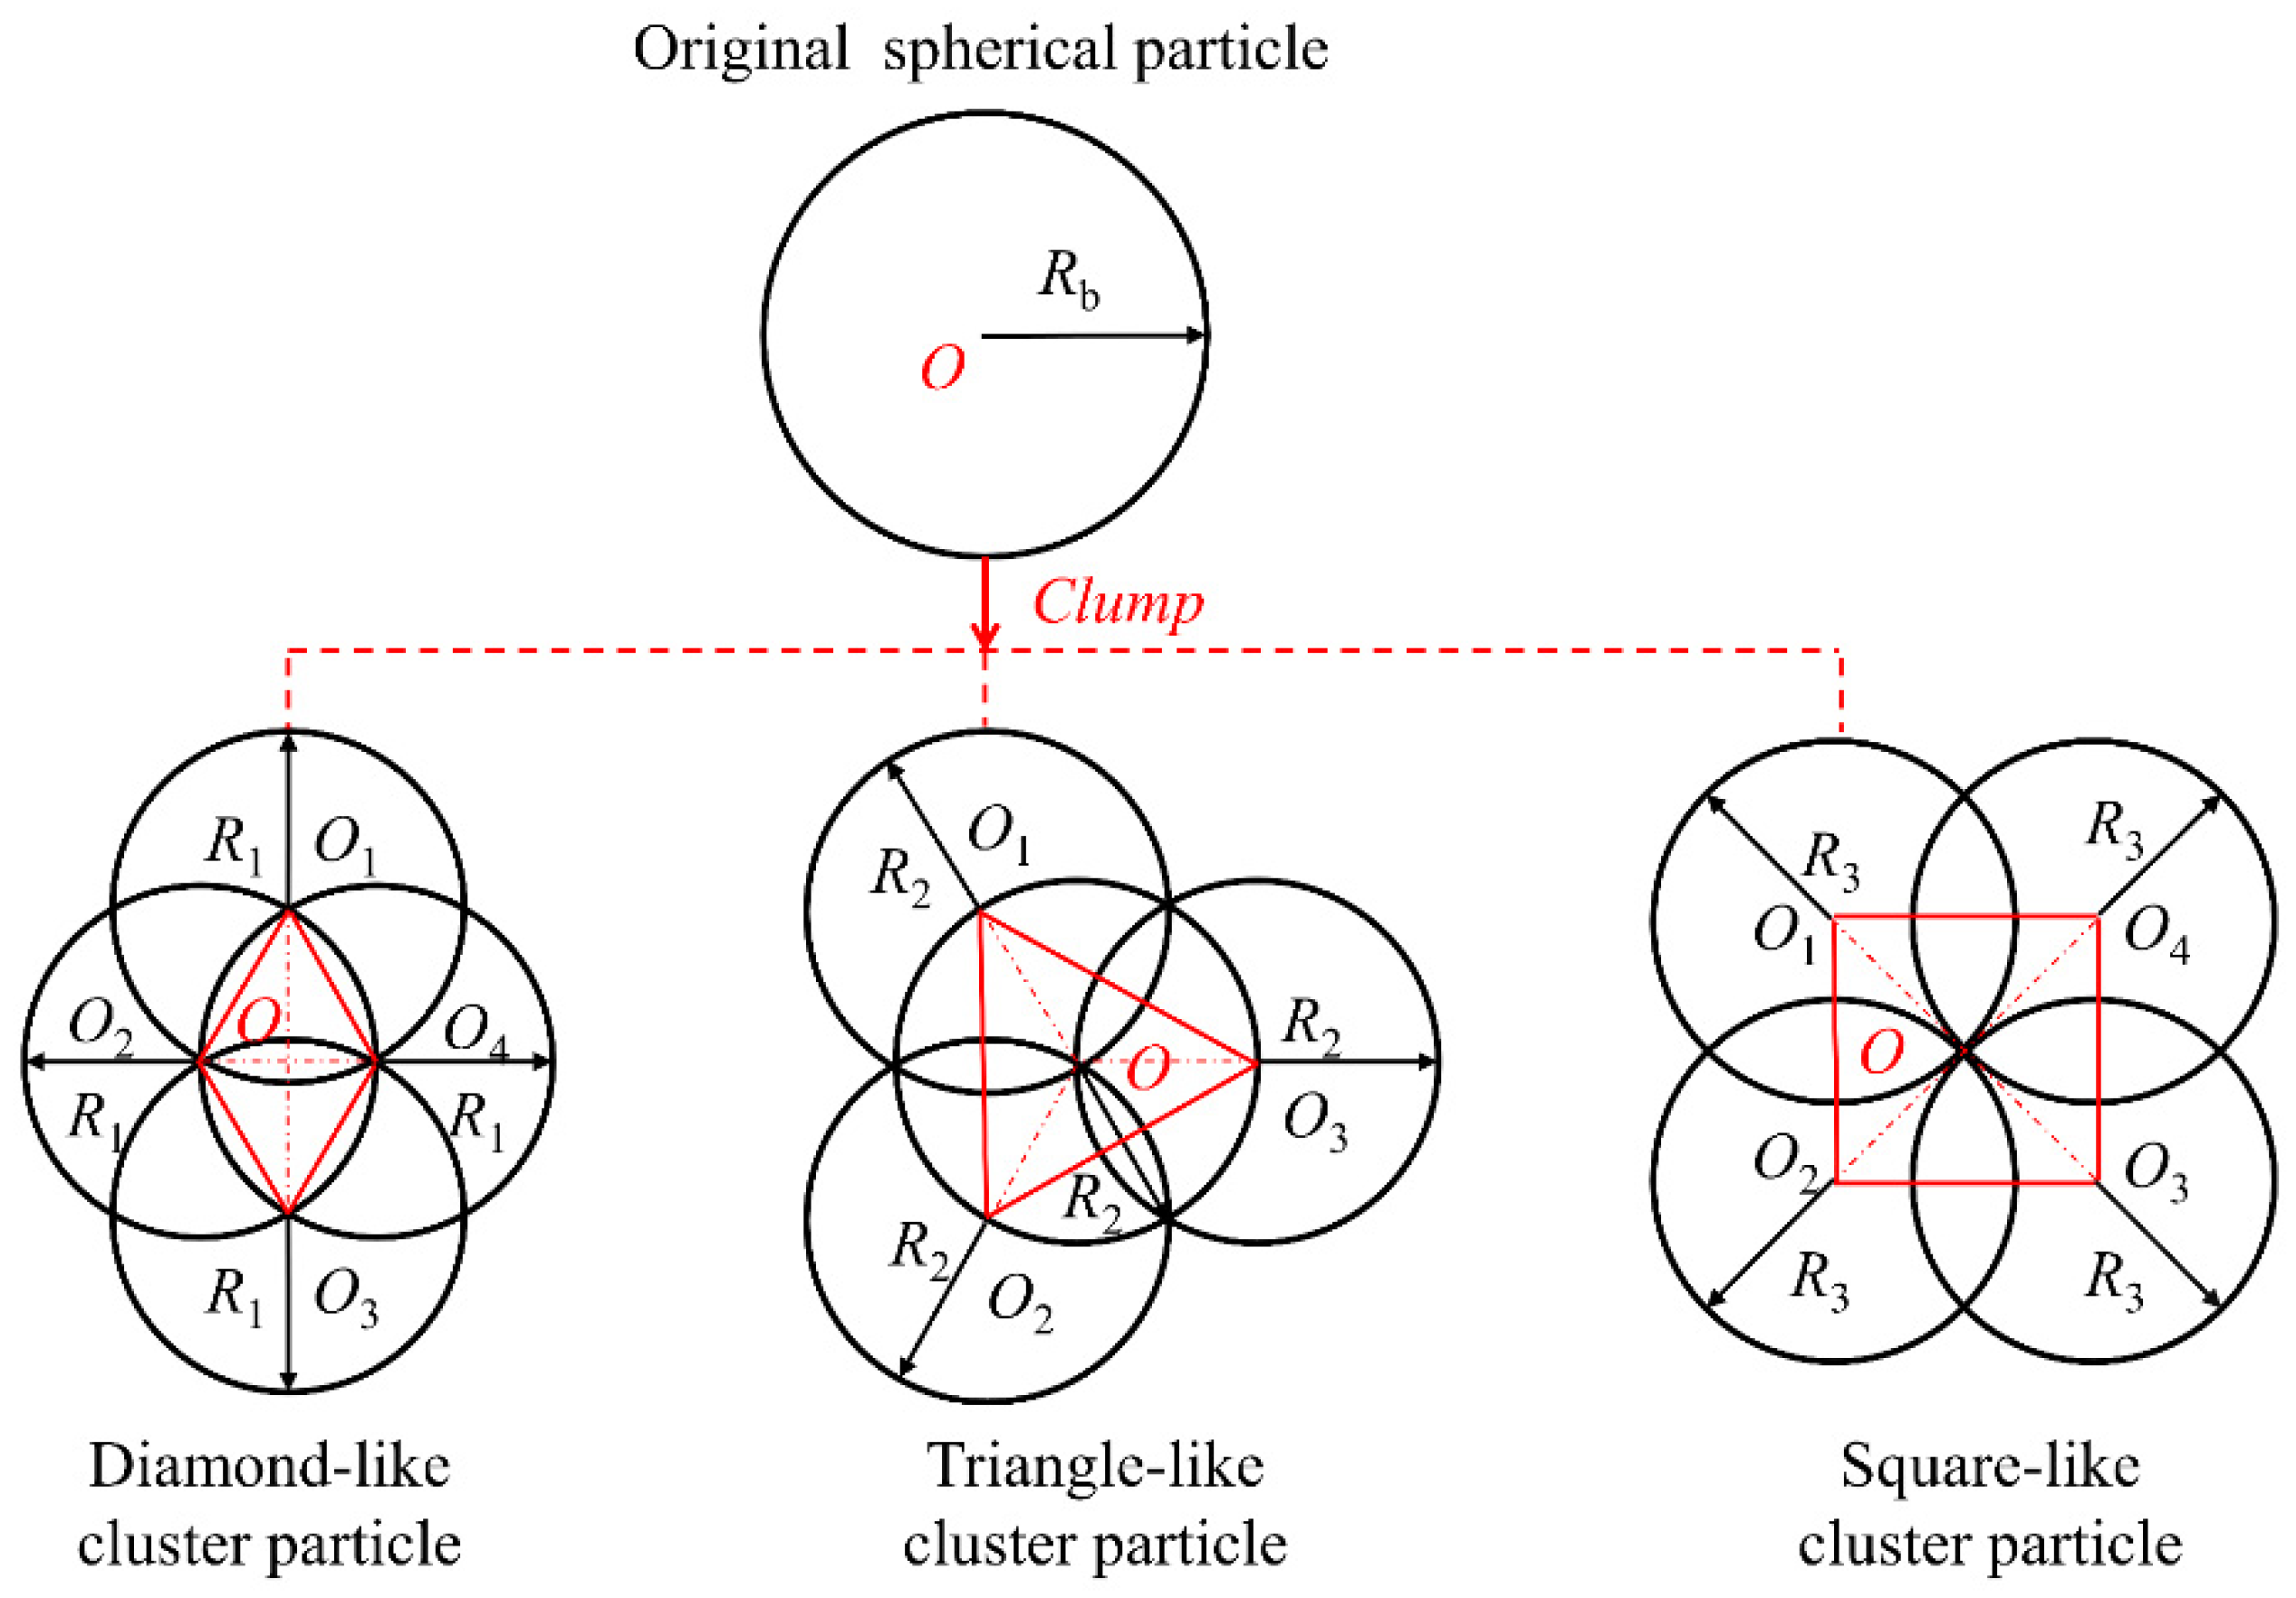
Since sand is a non-cohesive material, this paper employs the contact stiffness model to simulate its constitutive behavior. The contact-bonding constitutive model is used to simulate the mechanical behavior of clay [20,21,22]. The basic elements provided in PFC3D are spherical particles. However, the spherical particles are unable to replicate the requirements of the actual sand layer in terms of the particle shape and arrangement; therefore, the excessive rotation during the particle interaction will lead to the underestimation of the shear strength of the sand layer. Given the shortcomings of the spherical particles in simulating the sand layer, three types of cluster particles, namely diamond-like, triangle-like, and square-like particles, are secondarily developed by using the “clump” command, as depicted in Figure 2. In each cluster particle, the sub-particles have the same radius. The lines connecting the sub-particles’ centers are coplanar and can form diamond, triangle and square shapes, respectively. The three types of cluster particles can effectively improve the diversity of the particle corner angles and particle arrangement, so that the excessive rotation will not occur during the particle interaction.
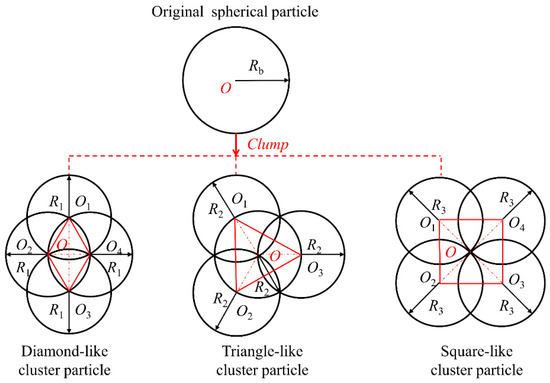
Figure 2.
The geometric diagram of the cluster particles.
Based on the principle that the volume, mass, and center of gravity remain unchanged before and after conversion, the radius and density of the sub-particles of the three types of the cluster particles after conversion can be defined as:
where Rb and db indicate the radius and density of the original spherical particle, respectively; R1, R2, and R3 are the radius of the diamond-like, triangle-like, and square-like sub-particles, respectively; d1, d2, and d3 represent the density of the diamond-like, triangle-like, and square-like sub-particles, respectively. The long axes of the cluster particles are randomly oriented.
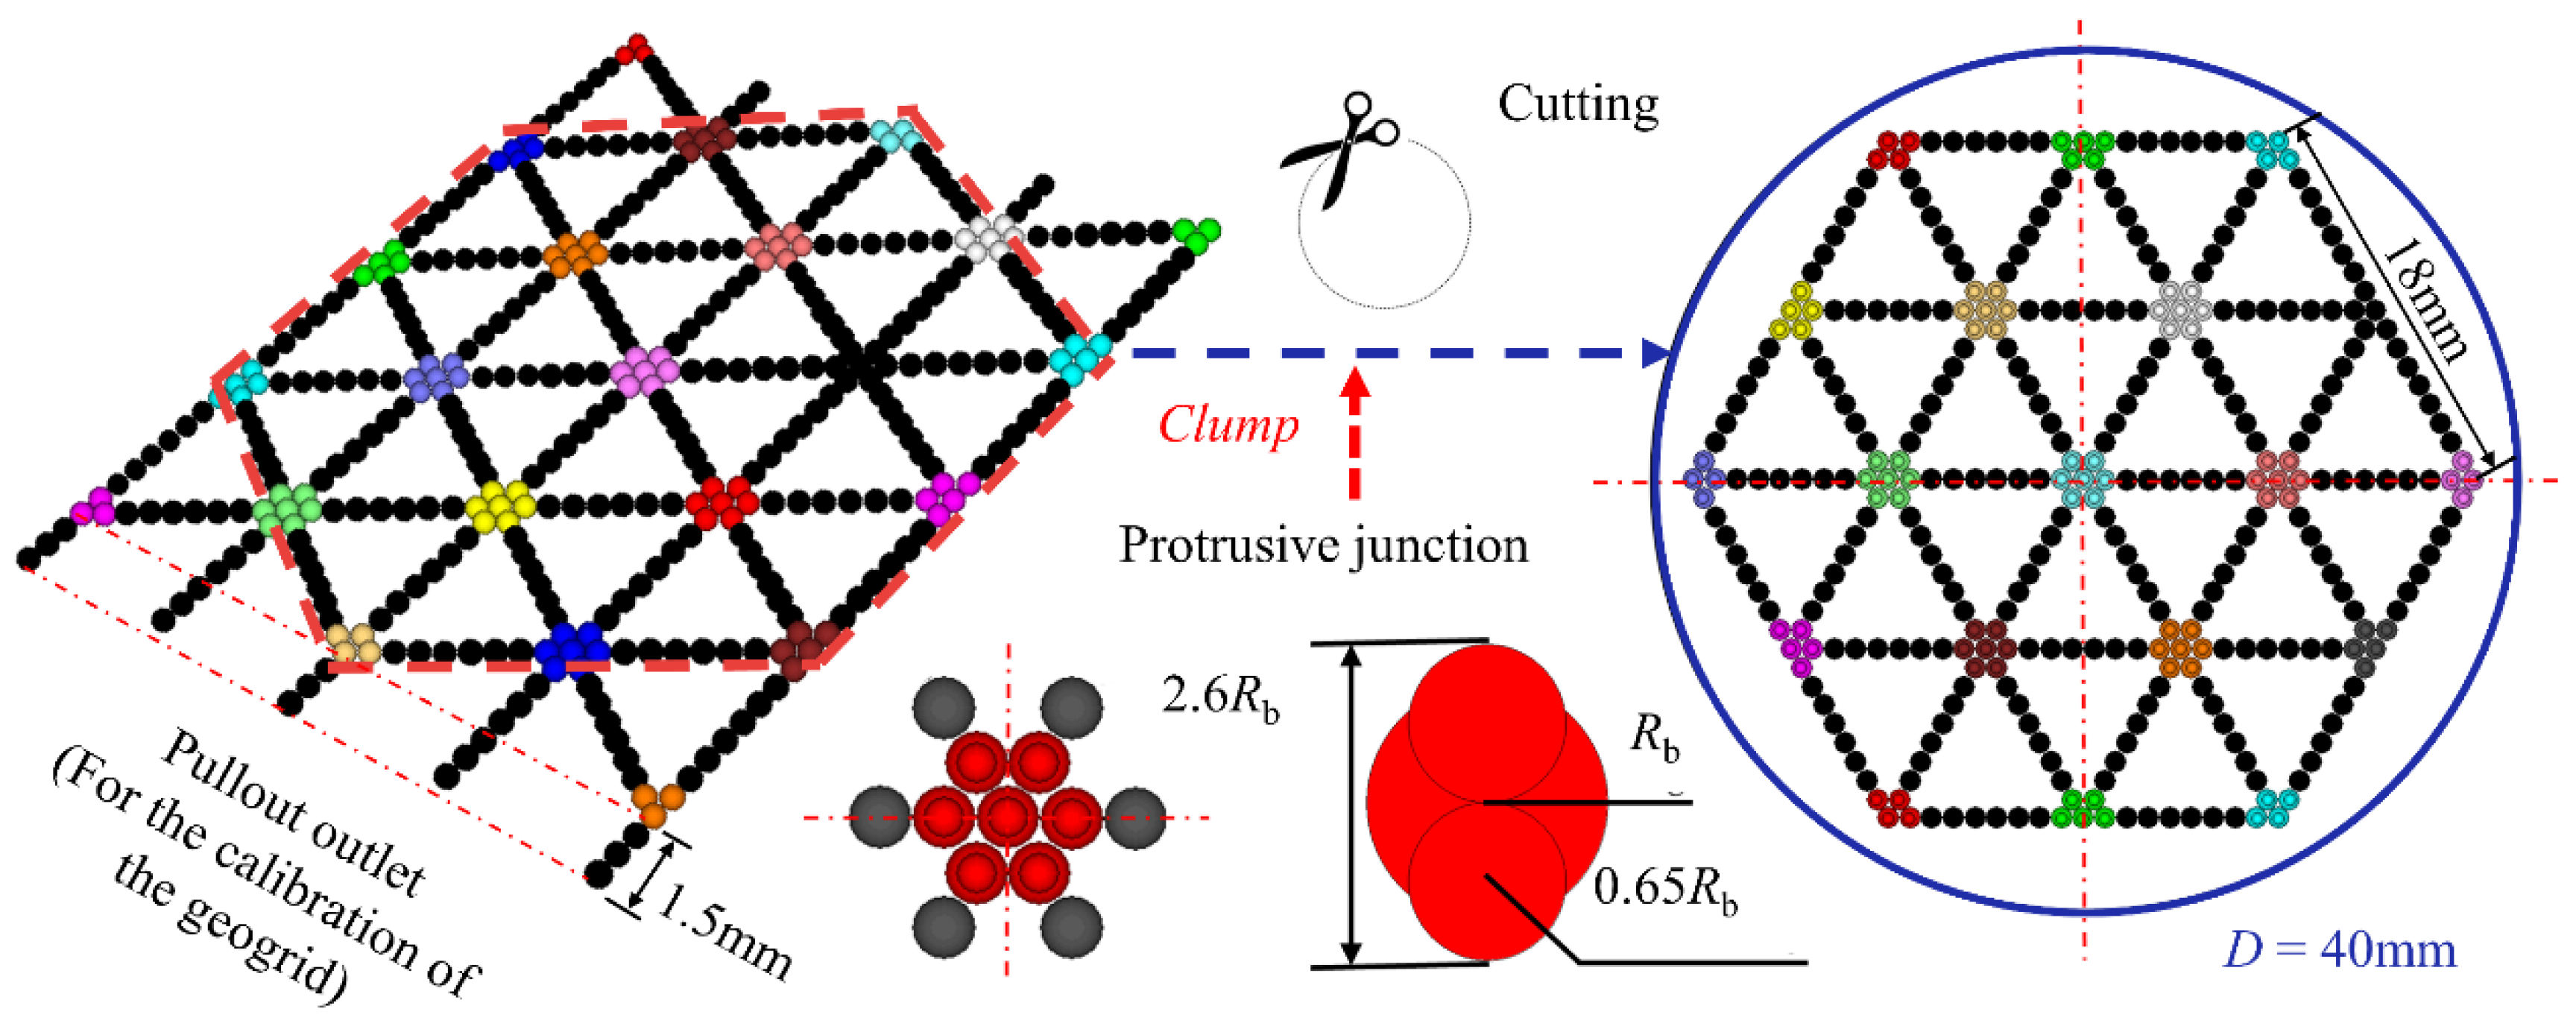
According to the transverse rib and mesh form of the geogrid, the parallel-bonding constitutive model is used to establish the triaxial geogrid numerical model, as shown in Figure 3. Particles with a radius of 0.5 mm (i.e., Rb = 0.5 mm) compose the longitudinal and transverse ribs of the geogrid. Reinforced joints are constructed to improve the restraint effect of the geogrid on the surrounding filler. The construction method is as follows. Based on the original joint, two sub-particles tangent to the center of the host particle are introduced. Then, the host particle and the sub-particles are bound by “clump” command to form an independent protrusive junction. After the protrusion is introduced, the height of the joint is 1.3 mm (i.e., 2.6Rb). In order to simulate the local strengthening effect at the geogrid joint, we utilize the “clump” command again and combine the concept of “coordination number” to bind each protrusion junction belonging to the same joint so as to ensure that the geogrid fracture does not occur at the joint. As the mesoparameters of the geogrid need to be calibrated in the following research, a length of 1.5 mm at one end of the geogrid model is reserved. After the calibration of the geogrid model is complete, it should be cut according to the test requirements. The shape of the final geogrid model for the triaxial compression test is a regular hexagon with an 18 mm edge length.
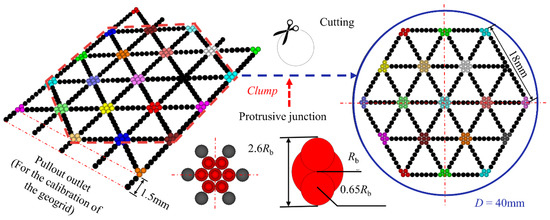
Figure 3.
The triaxial geogrid particle flow model.
2.2. Selection of Mesoparameters
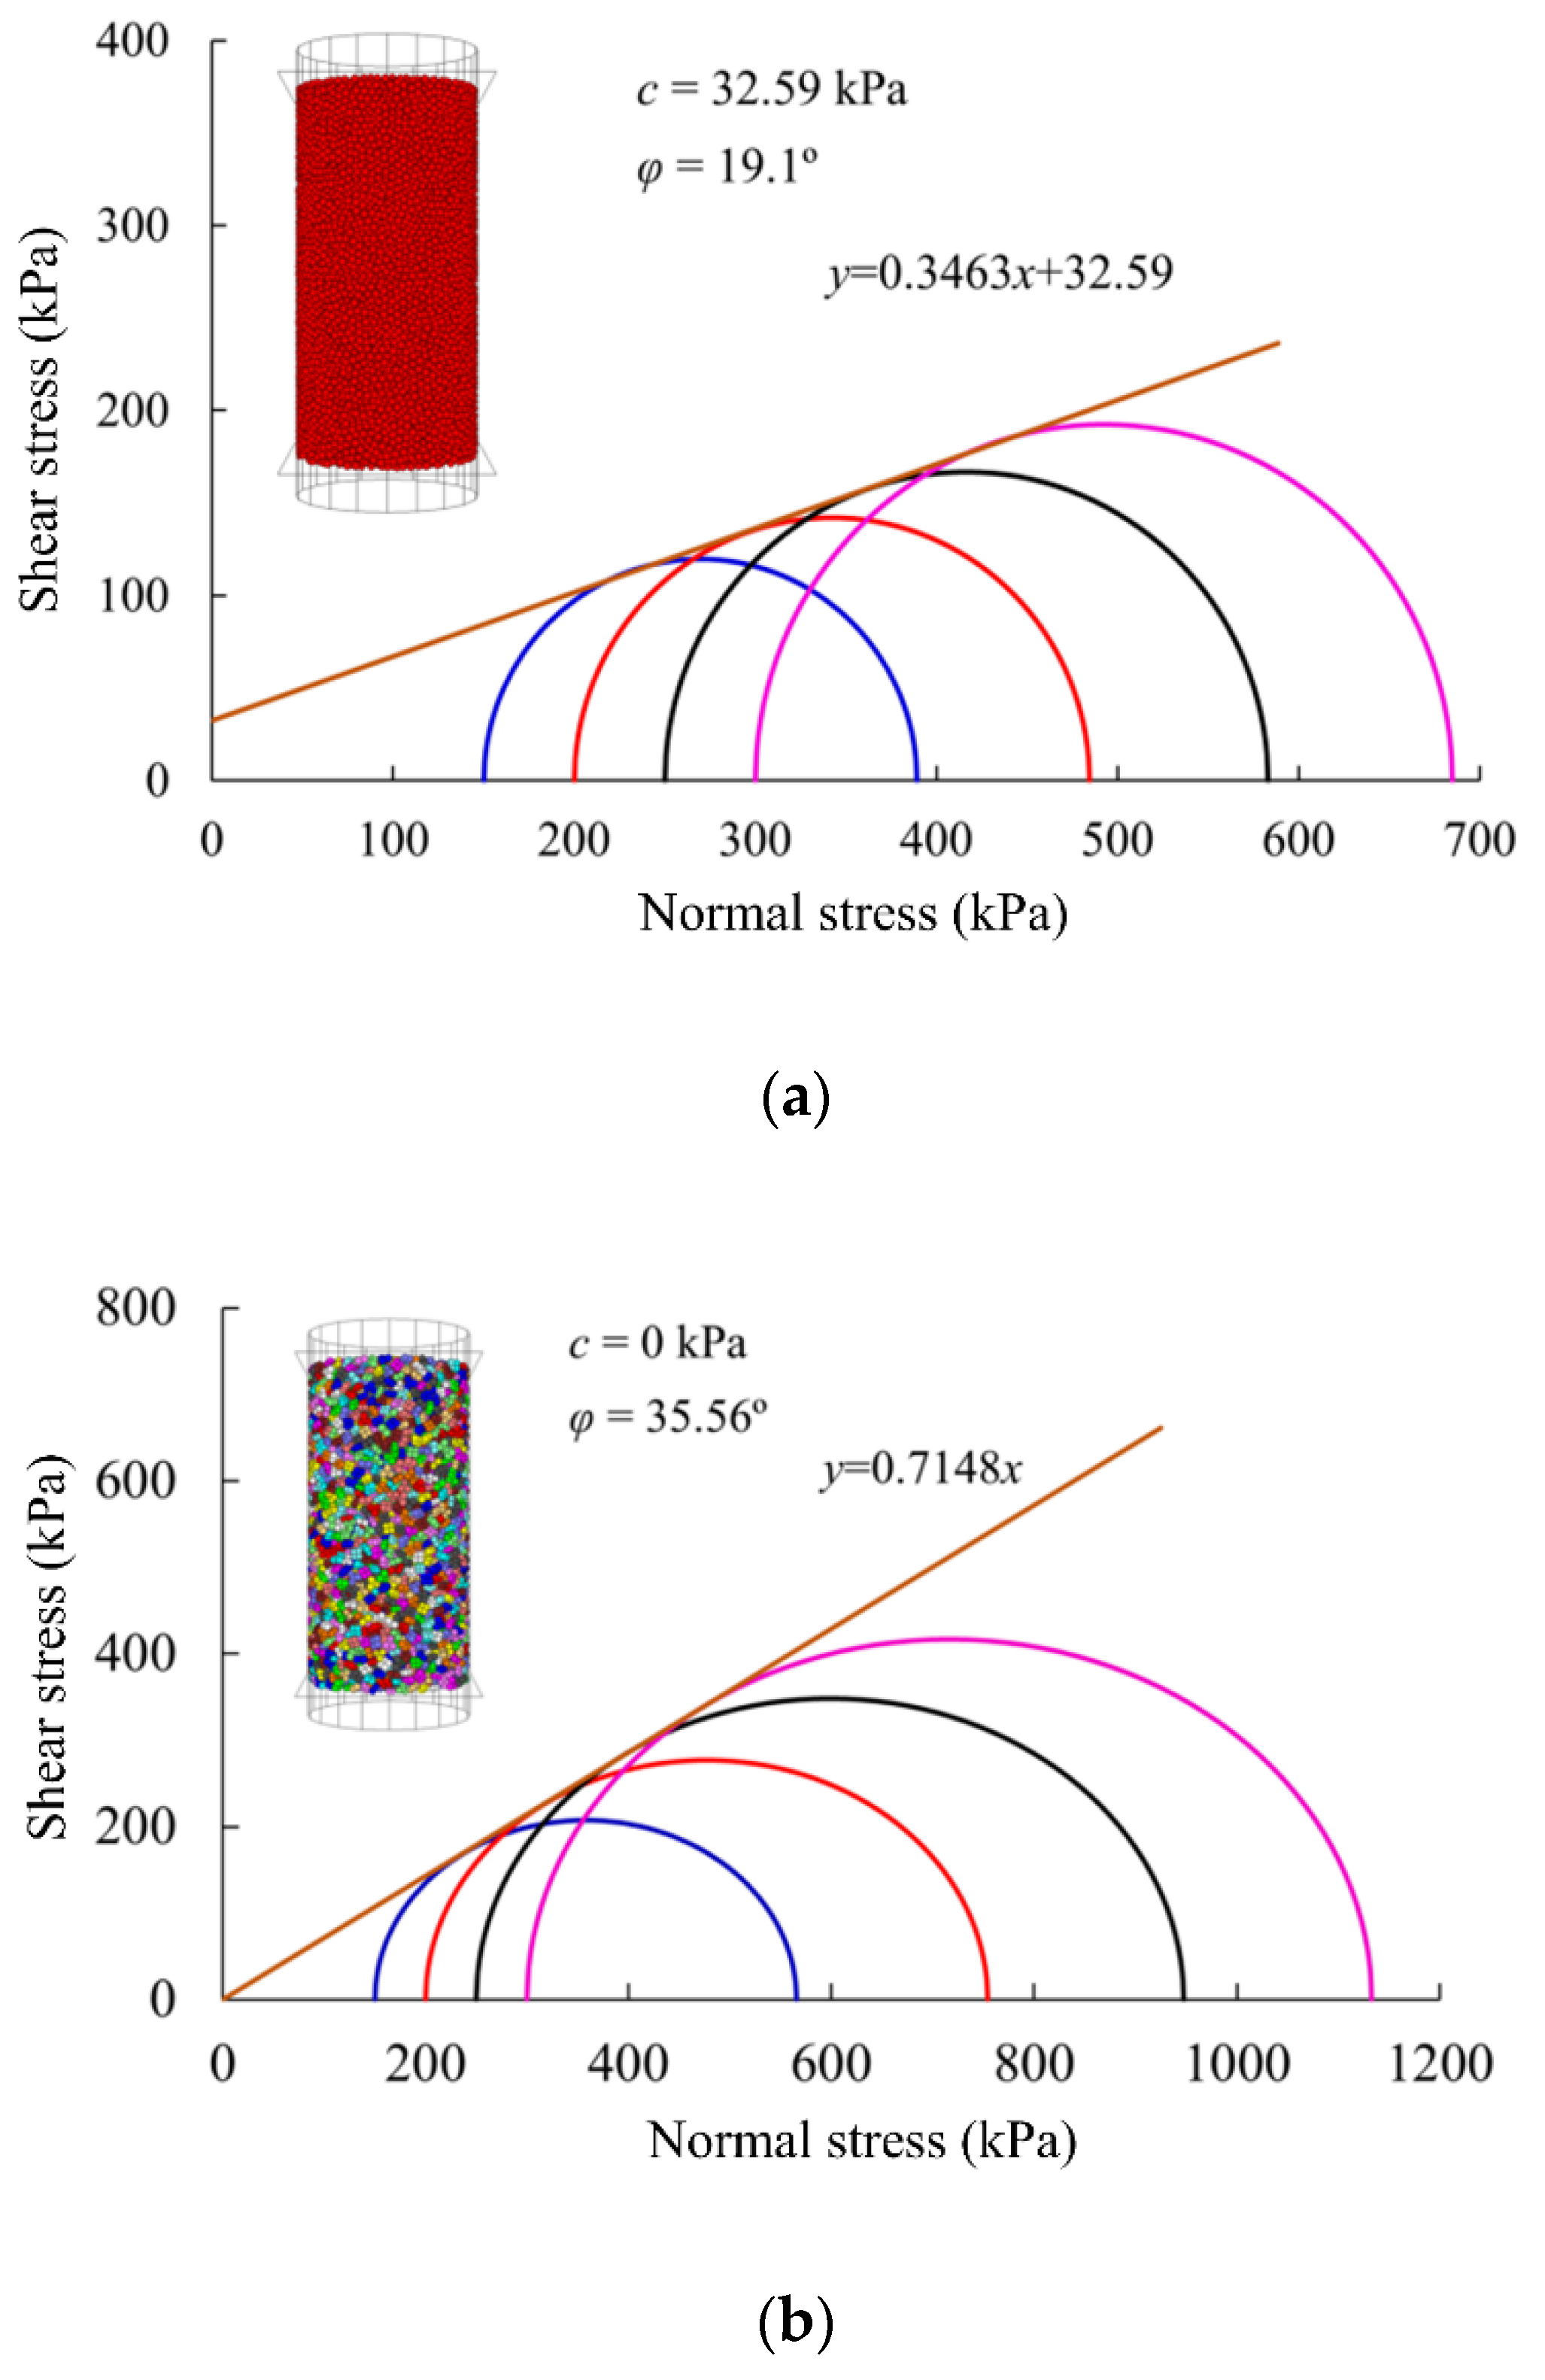
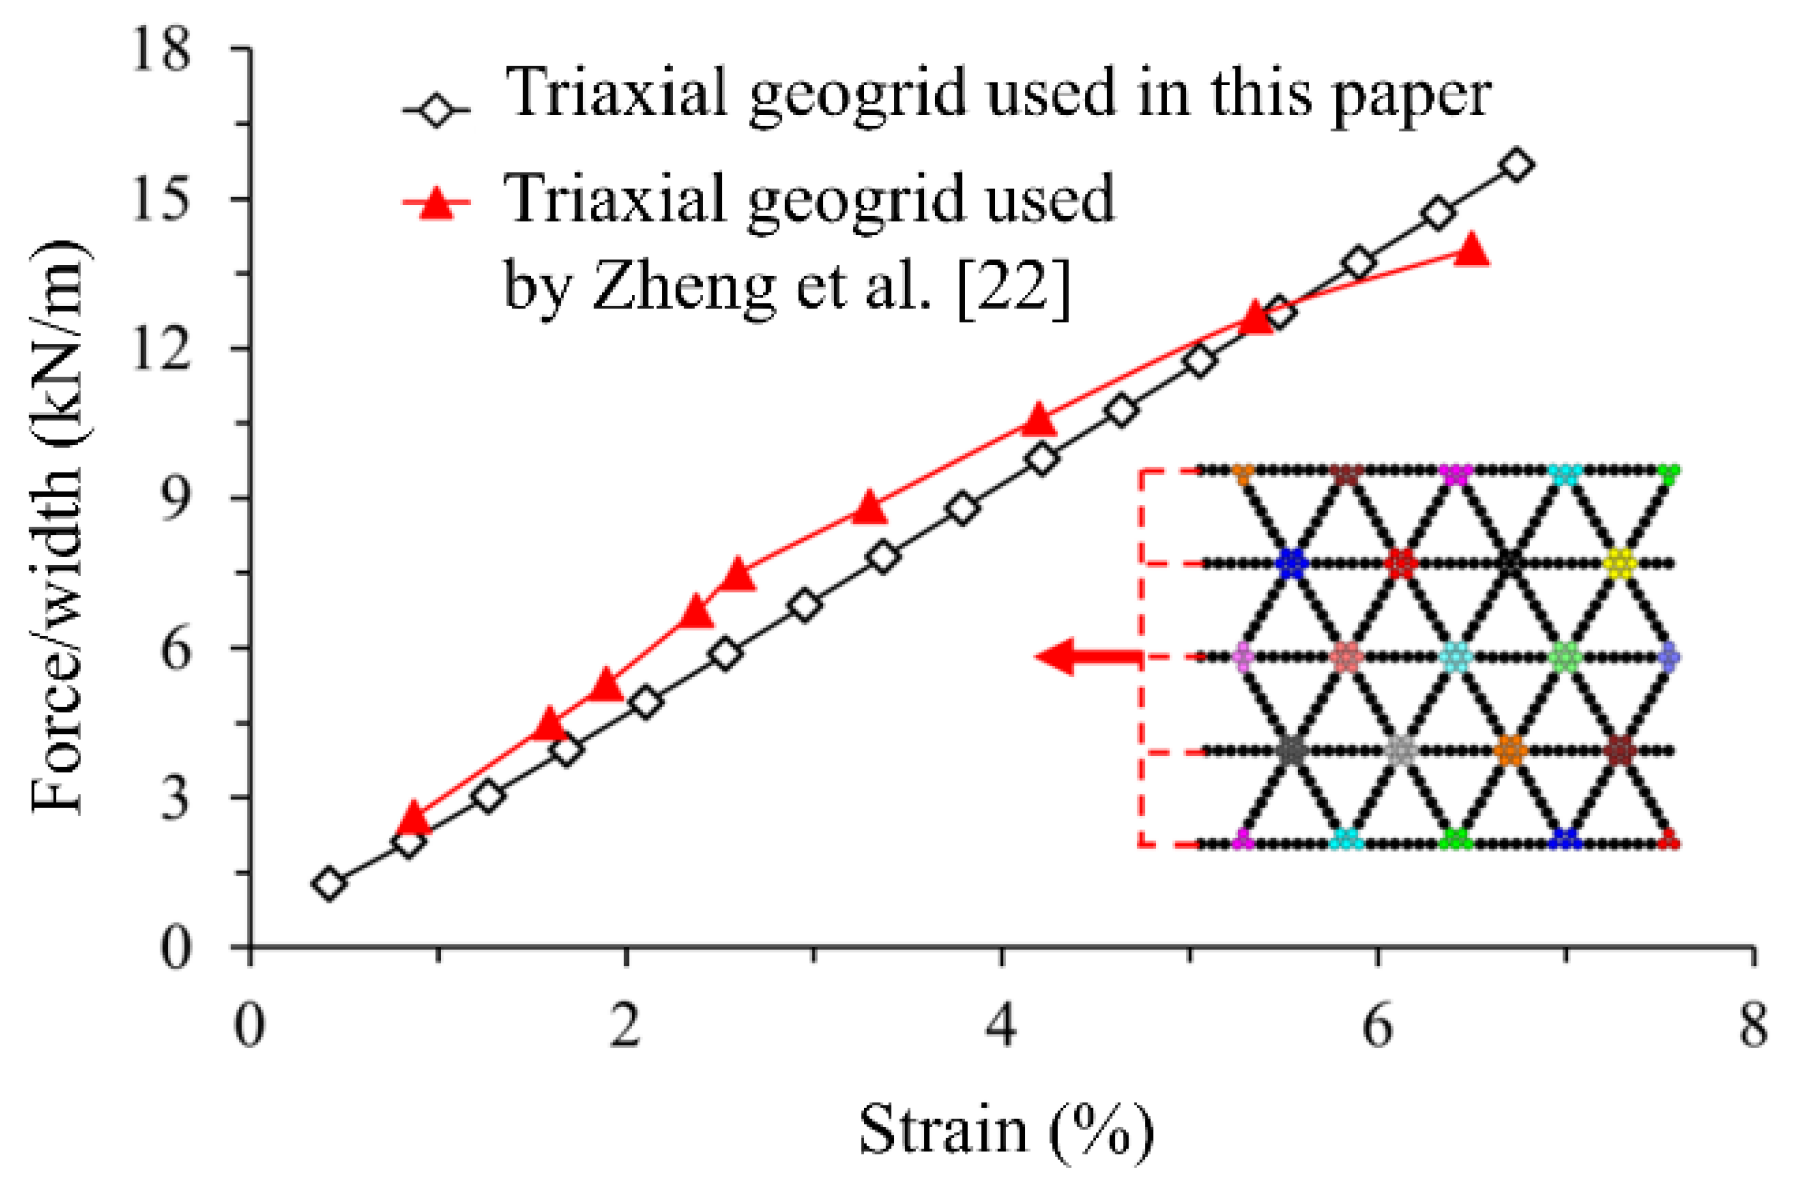
The mesoscopic mechanical parameters are obtained through numerical simulation tests, that is, parameter calibration. The numerical triaxial compression models of silty clay and medium sand are established, and the numerical tests are carried out under different confining pressures. The mesoparameters of the model are continuously adjusted to make the macroscopic mechanical performance of the numerical samples consistent with the indoor triaxial compression test. The Mohr strength criterion of the numerical triaxial compression test is illustrated in Figure 4. The mesoparameters of the geogrid are calibrated by the conventional tensile test [23]. Figure 5 compares the numerical tensile test results of the triaxial geogrid with the test results of Zheng et al. [24]. The specific mesoparameters of the particles are also presented in Table 1.

Figure 4.
Mohr circle of the triaxial compression test on: (a) clay; (b) sand.

Figure 5.
The tensile test curve of the triaxial geogrid.

Table 1.
The mesoparameters of the particle flow model.
3. Numerical Test Scheme
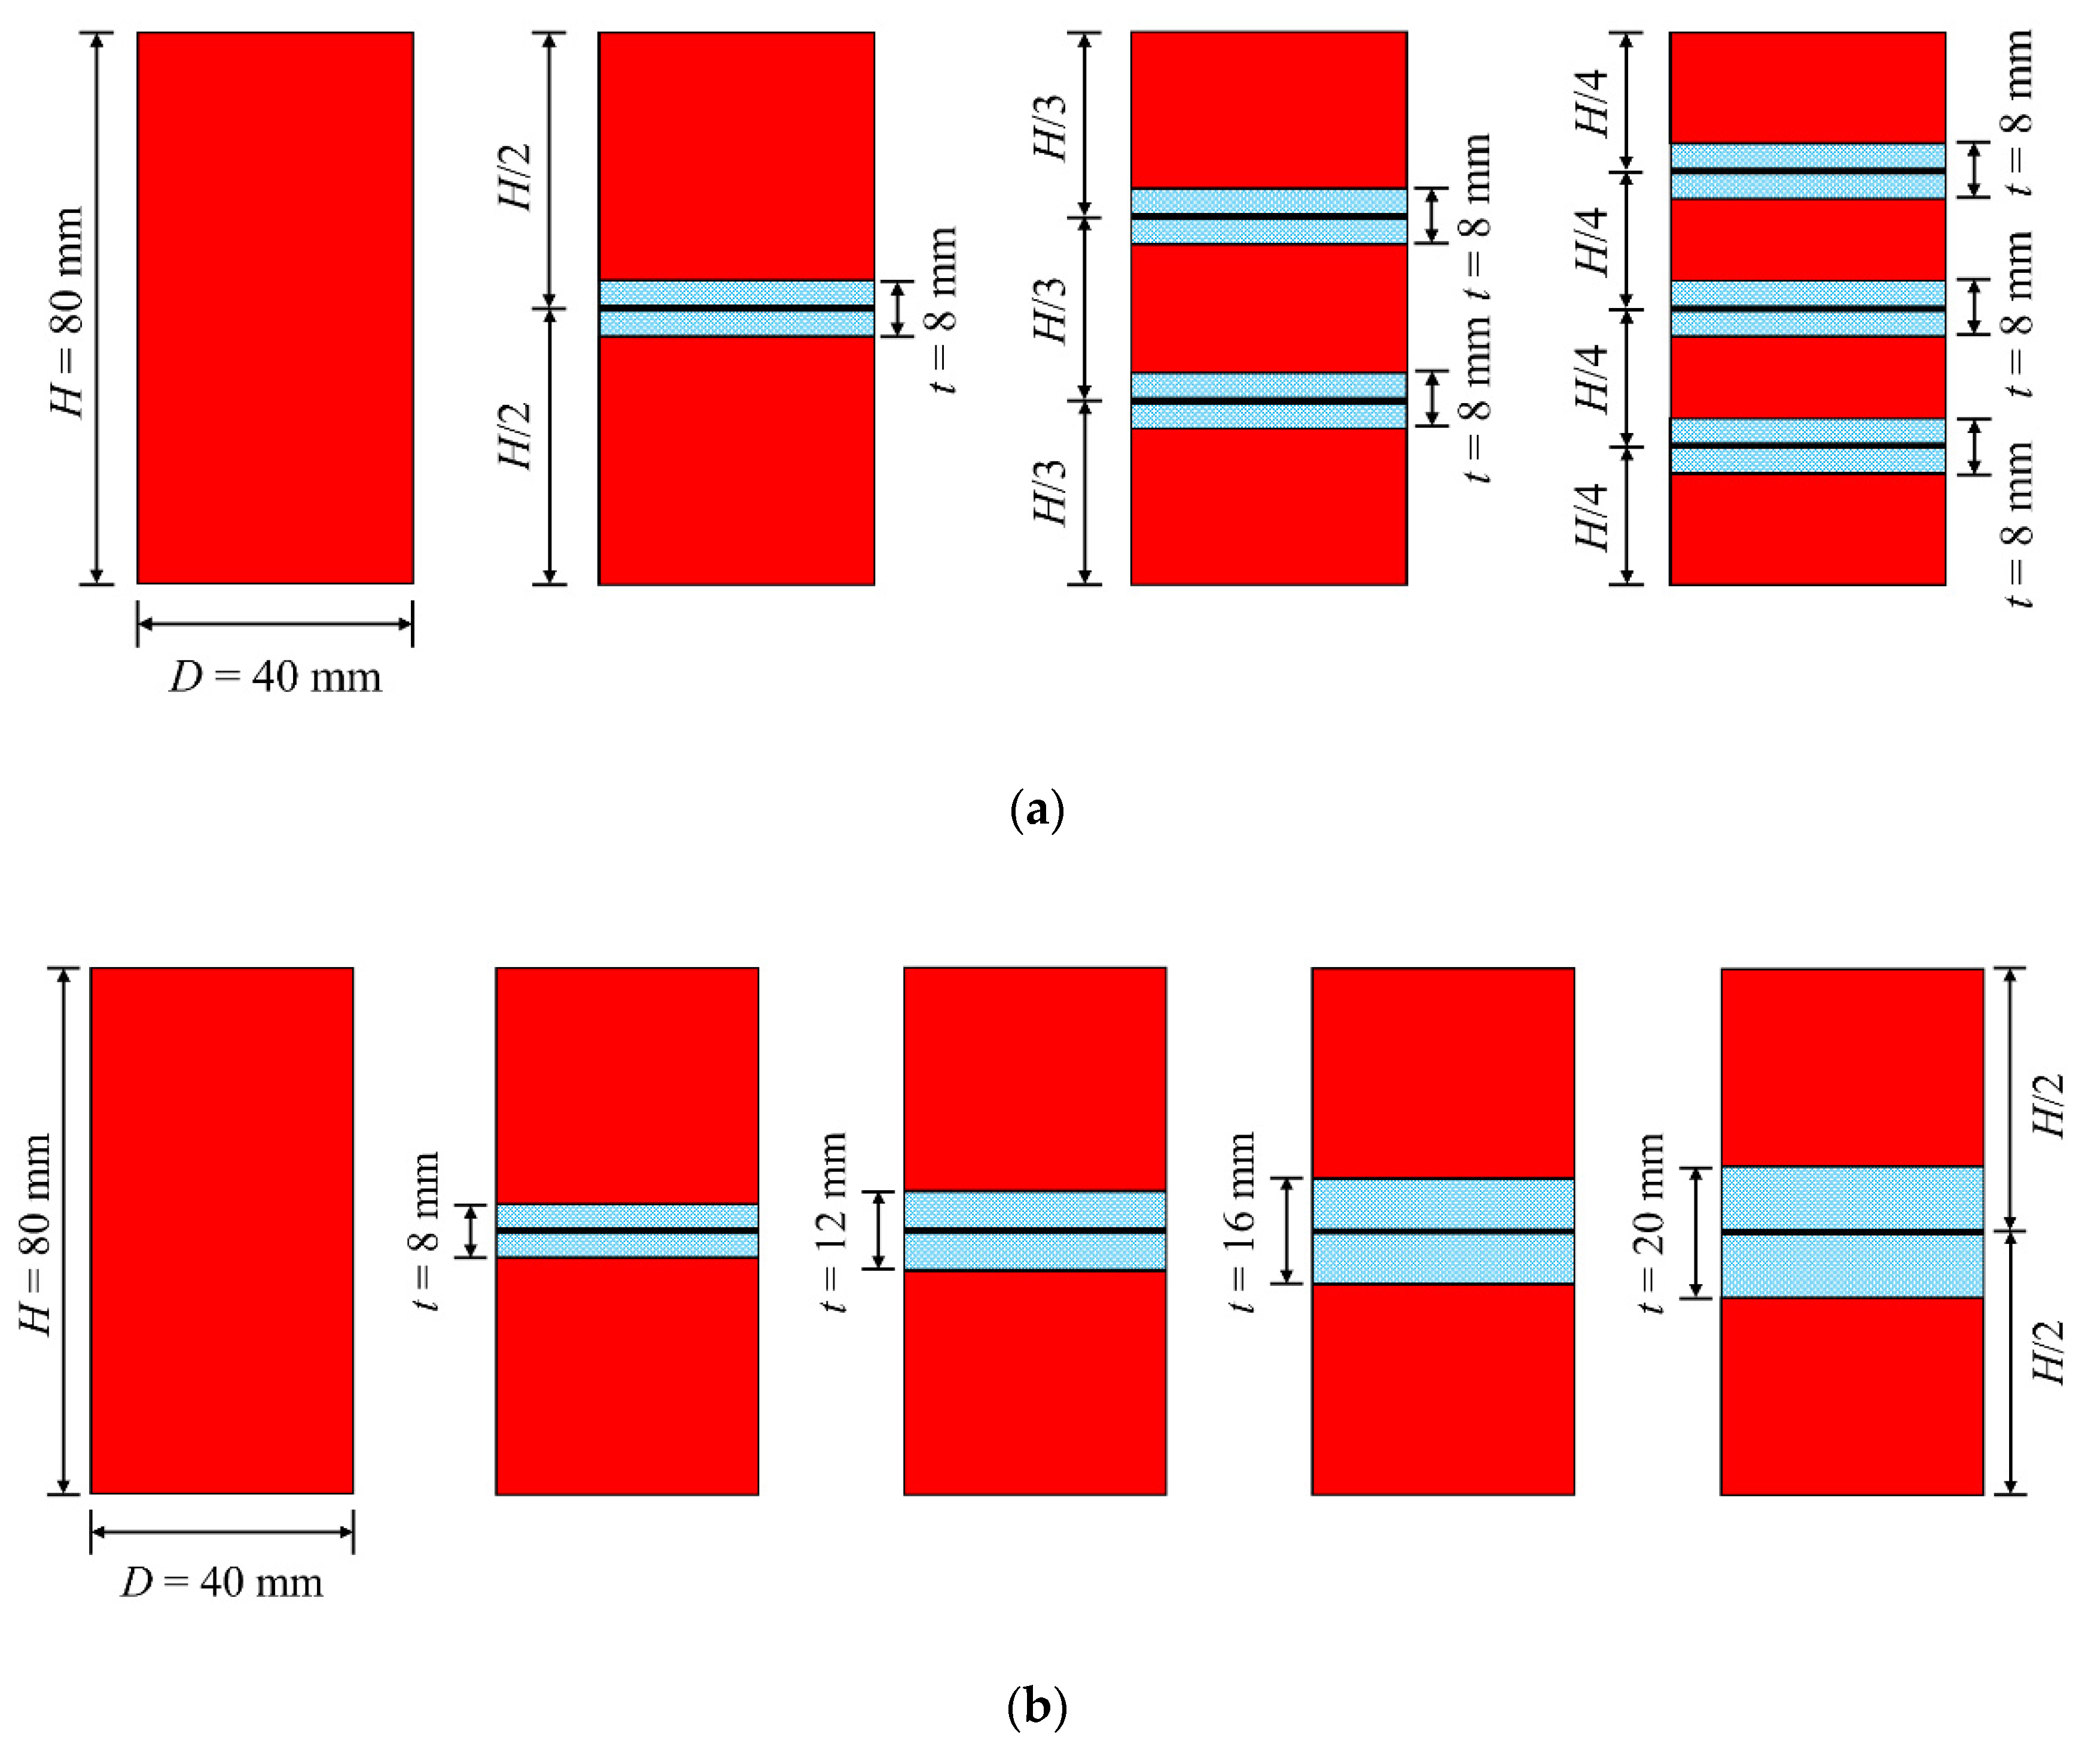
This work analyzes the influence of the number and thickness of sand layers, designated by n and t, respectively, on the deviatoric stress–axial strain relationship and the shear strength of the LGSCR samples. To this end, the effect of four sand layers (n = 0, 1, 2, and 3) on the triaxial compression test results of the LGSCR samples was examined. The geogrid-reinforced sand layers in the four samples were evenly laid vertically at equal intervals, and the thickness of each layer was 8 mm. Moreover, the effect of the five thicknesses of sand layers (t = 0, 8, 12, 16, and 20 mm) on the triaxial compression test results of the LGSCR samples was investigated. Only one layer of the reinforced sand (n = 1) was laid in the middle of the five samples. The numerical test scheme is displayed in Figure 6. In addition, the numerical model of the sand–clay–layered (SCL) structure is established by ensuring the sizes of the sand layer and the clay layer remain unchanged but removing the geogrid in the sand layer. The effect of laying the geogrid in the sand was also studied by comparing the test results of the SCL samples with those of the corresponding LGSCR specimens.

Figure 6.
The scheme for the numerical triaxial compression test on the LGSCR samples: (a) different numbers of layers; (b) different thicknesses of layers.
4. Results and Discussion
4.1. Relationship between Deviatoric Stress and Axial Strain
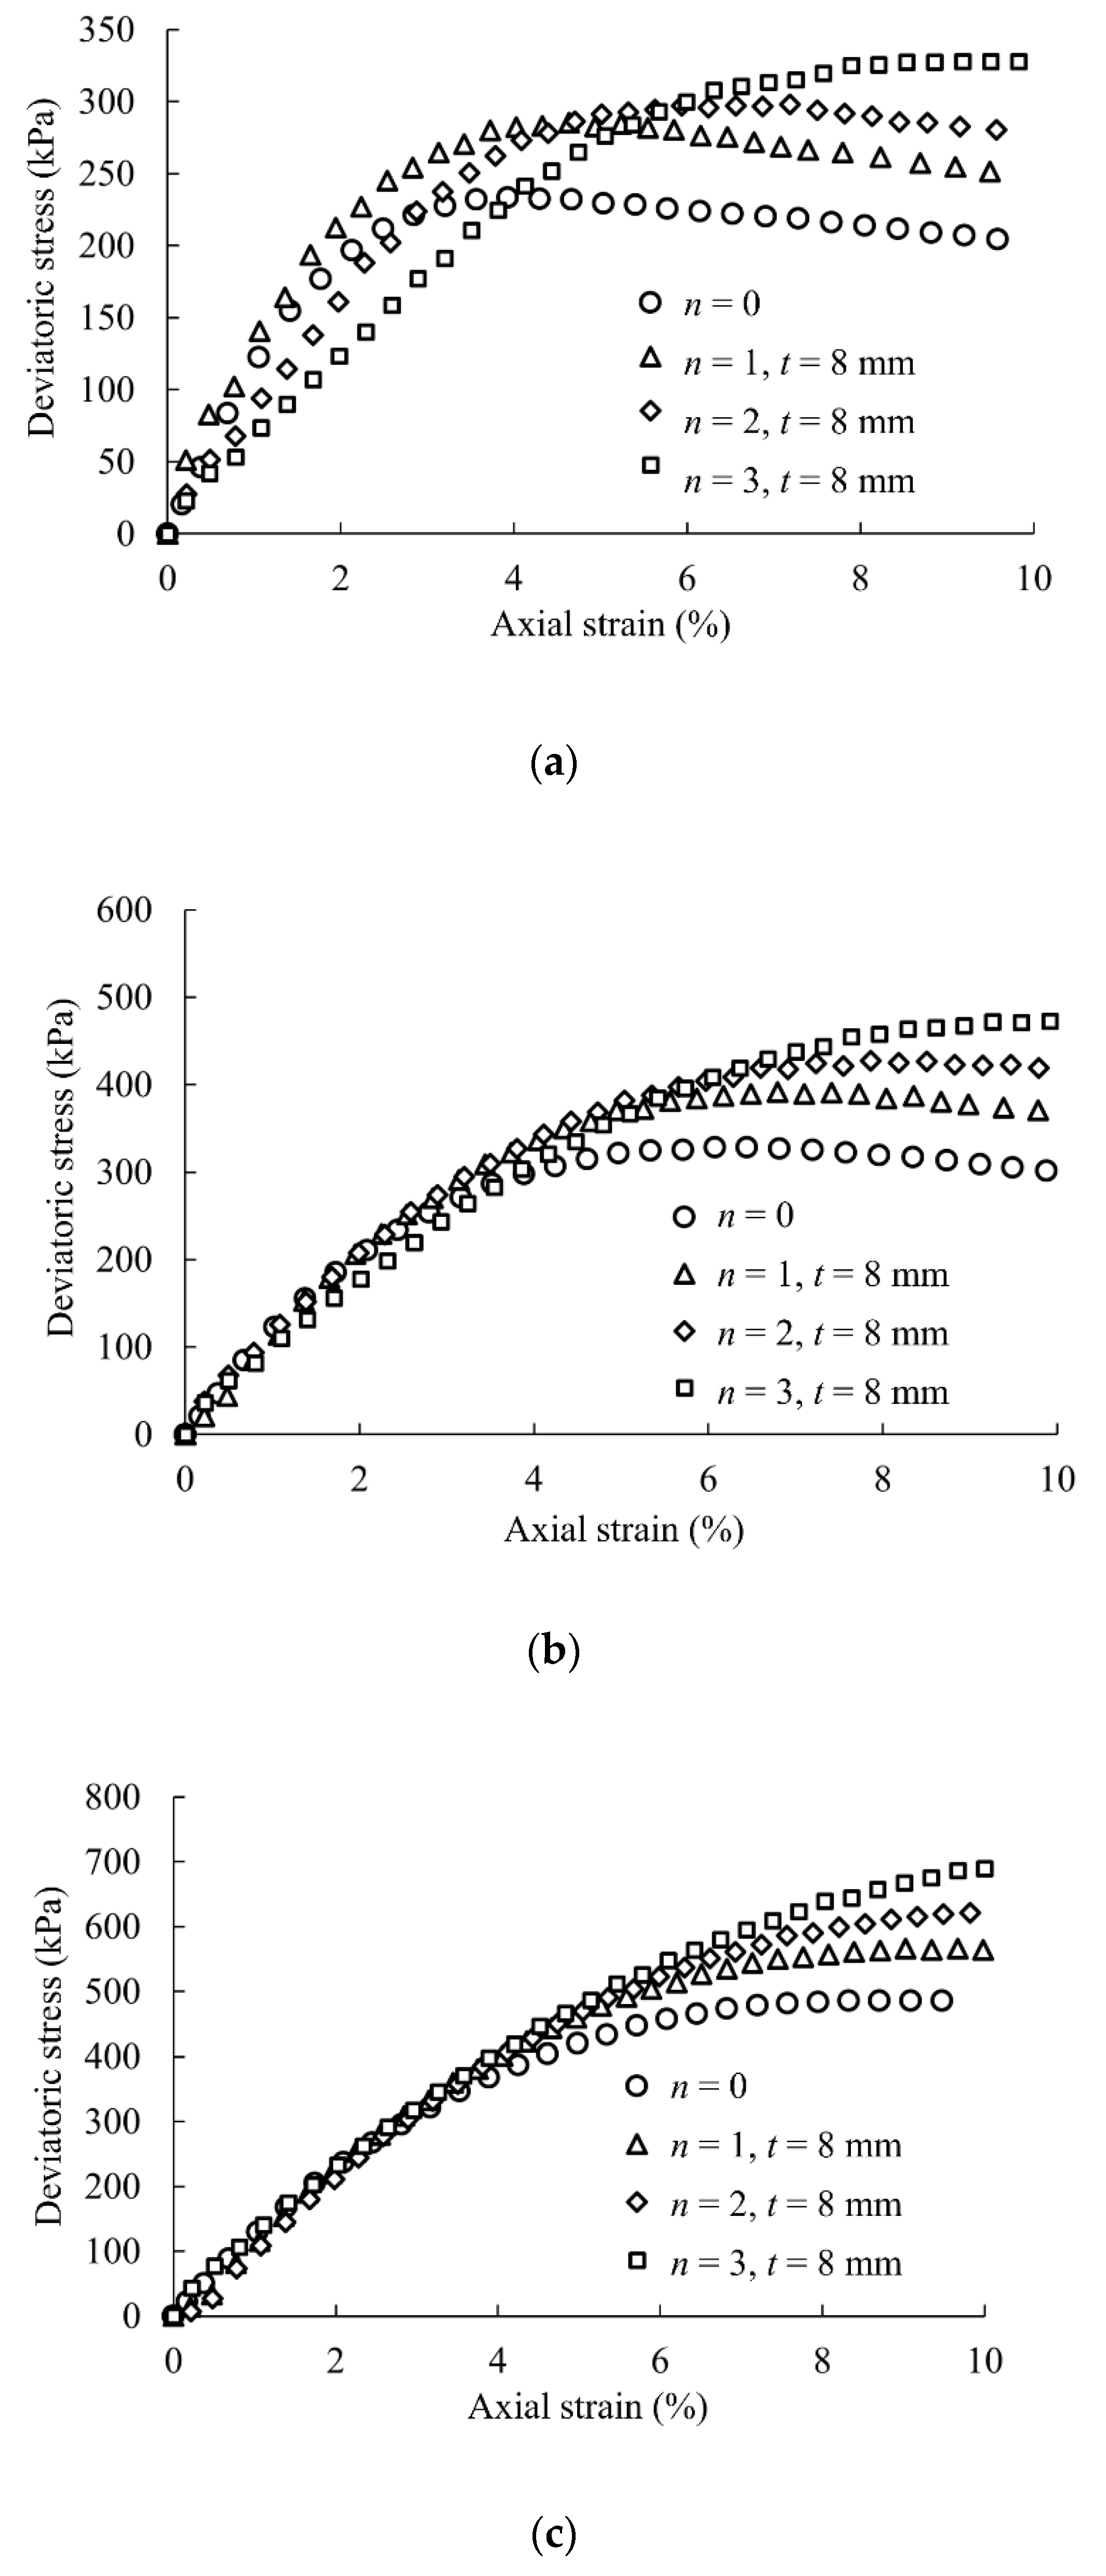
Figure 7 delineates the deviatoric stress–axial strain curves of the SCL samples at confining pressures of 150, 250, and 400 kPa and different numbers of sand layers. As can be seen in Figure 7, the SCL samples (n = 1, 2, 3) have a higher peak stress (σp) under specific confining pressures than the pure clay sample (n = 0). The σp of the samples also enlarges with an increase in the number of sand layers. It should be noted that increasing n gradually reduces the strain-softening degree of the samples but enlarges the axial strain (εn) corresponding to the σp. The smaller the confining pressure is, the more significant the increasing trend of the εn corresponding to the σp with n becomes. The above results demonstrate that laying the sand layers in the sample can significantly improve the post-peak characteristics of the samples; furthermore, the larger the number of sand layers is, the more pronounced the effect becomes. In practical engineering, the sand layers can be laid in the clay filler, which can effectively avoid the sudden damage to the soil structure caused by the rapid decrease in its strength during large deformations, thereby improving the safety of the soil structure.
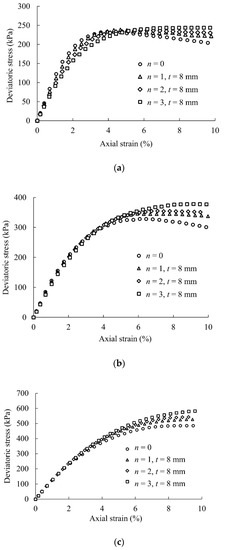
Figure 7.
The deviatoric stress–axial strain curves of the SCL samples with different numbers of sand layers and confining pressures of (a) 150 kPa, (b) 250 kPa, and (c) 400 kPa.
Figure 8 depicts the deviatoric stress–axial strain curves of the SCL samples at confining pressures of 150, 250, and 400 kPa and different thicknesses of sand layers. As can be seen from the figure, increasing the thickness of sand layers raises the σp of the SCL samples under a specific confining pressure but reduces their strain-softening degree. The εn corresponding to the σp also increases with t, but the increasing trend is not noticeable. The above results confirm that when only one layer of the sand is laid in the sample, increasing the thickness of the sand layer can only slightly reduce the post-peak, strain-softening degree of the samples and cannot effectively delay the occurrence of the peak stress. In actual projects, the laying method of thin multi-sand layers should be adopted.
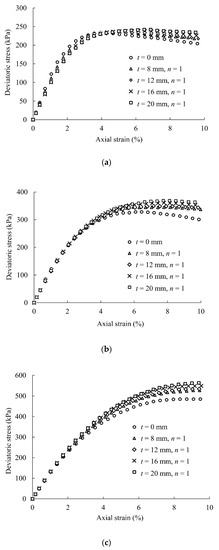
Figure 8.
The deviatoric stress–axial strain curves of the SCL samples at different thicknesses of sand layers and confining pressures of (a) 150 kPa, (b) 250 kPa, and (c) 400 kPa.
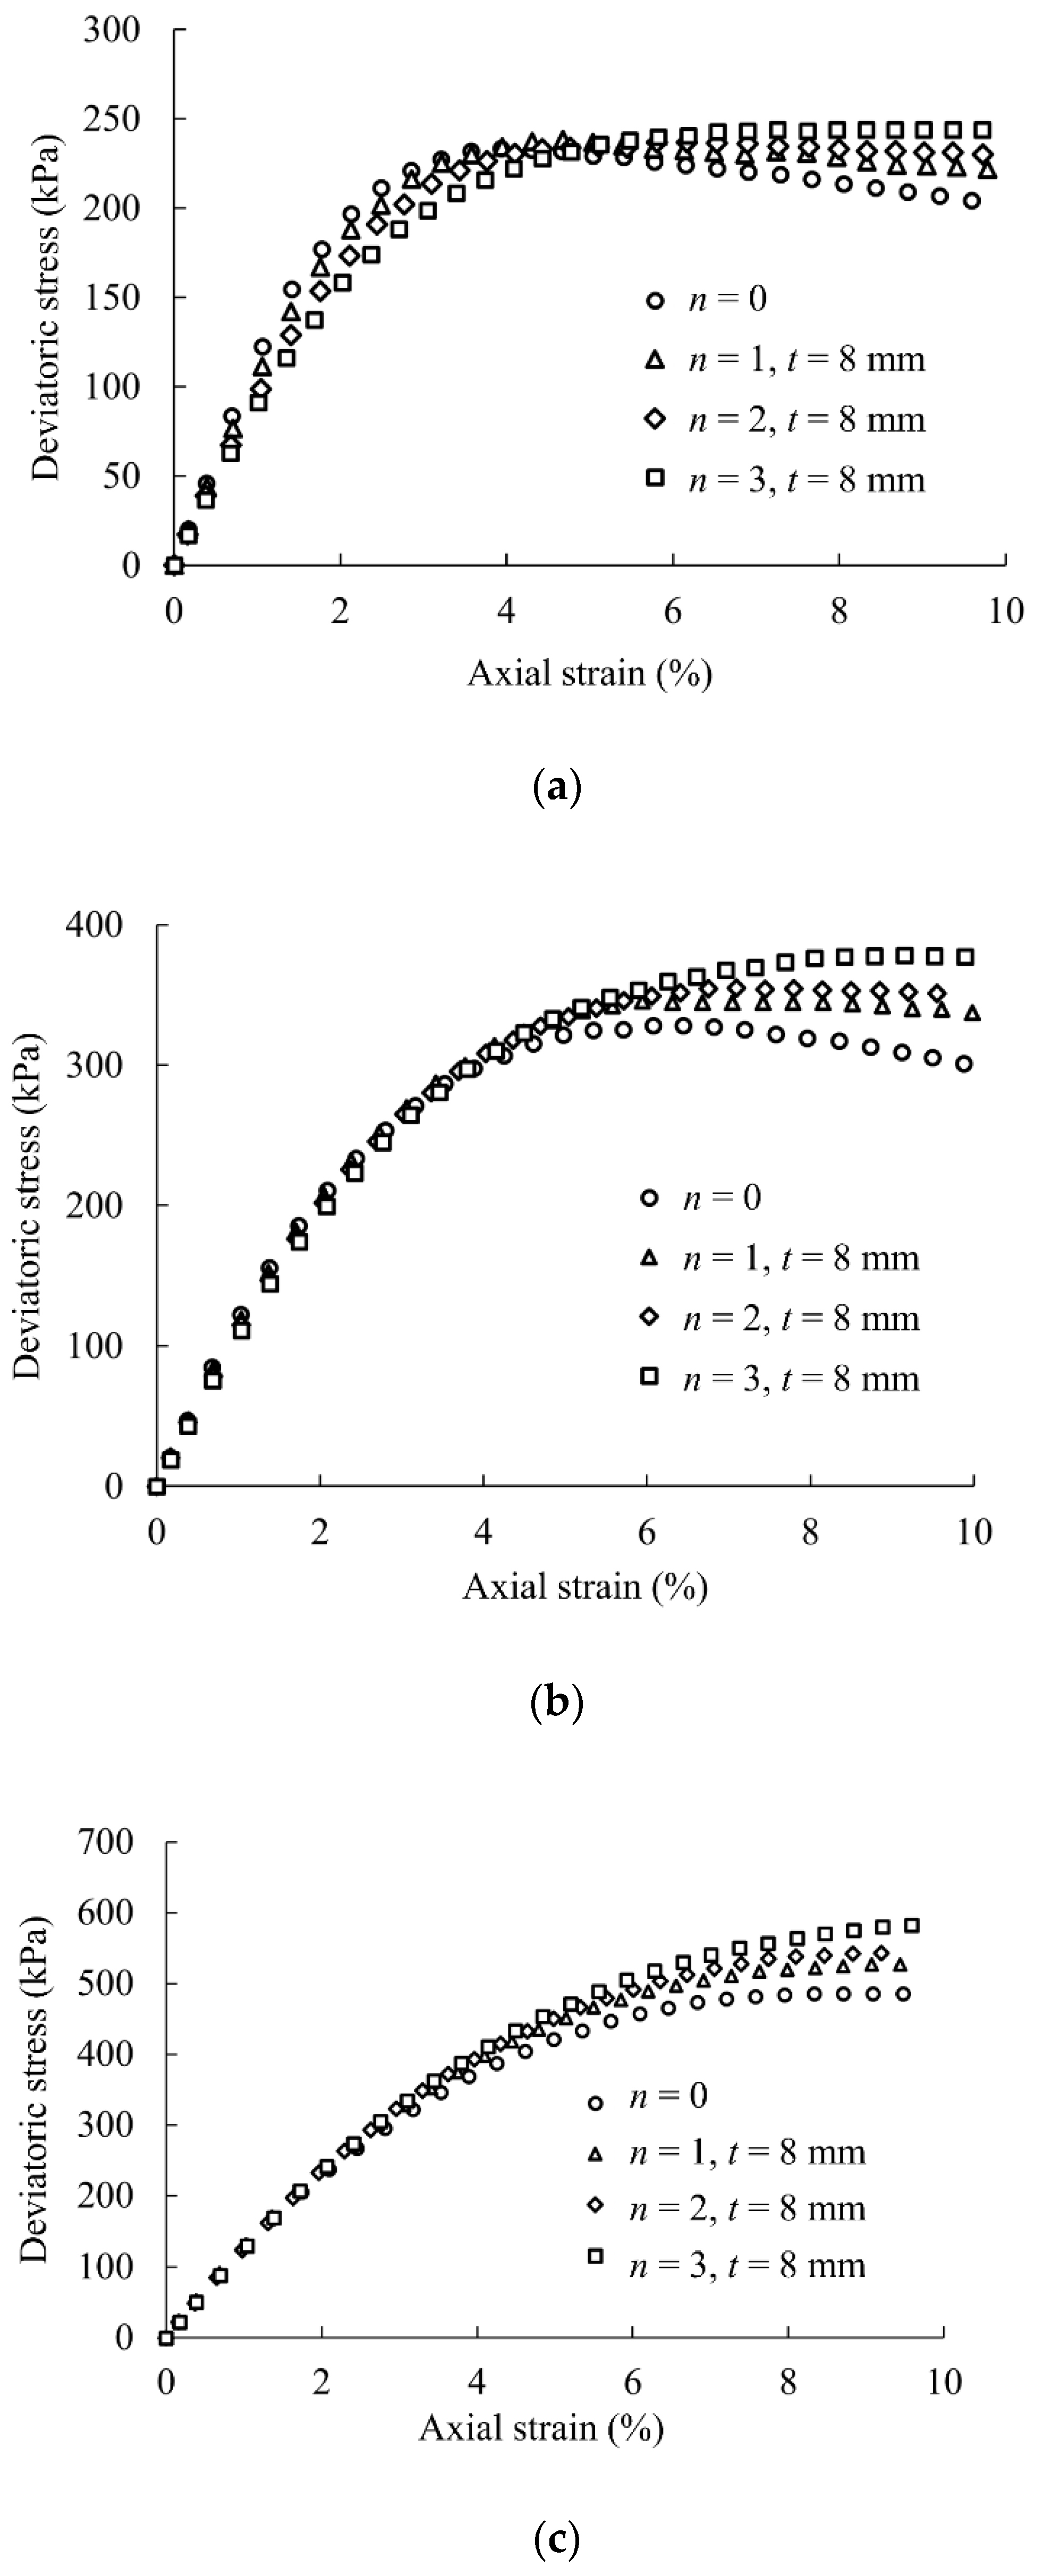
Figure 9 delineates the deviatoric stress–axial strain curves of the LGSCR samples at confining pressures of 150, 250, and 400 kPa and with different numbers of sand layers. As can be seen in this figure, the strength of the LGSCR samples under a specific confining pressure rises significantly with an increase in the number of sand layers. At the 150 kPa confining pressure, the elastic region behavior and the apparent initial tangent modulus of the four LGSCR samples have obvious differences. This phenomenon occur because the geogrid-reinforced sand layers have a negative dilatancy behavior, which is followed by a dilatancy behavior at a low confining pressure. Compared with the SCL samples, the LGSCR samples have a higher σp at the same n value. Raising the number of sand layers gradually declines the strain-softening degree of the LGSCR samples but further enlarges the εn corresponding to the σp compared with the SCL samples. The above results demonstrate that laying the geogrid in the sand layer can effectively improve the σp of the samples and further enhance their ductility. The larger the number of sand layers, the more remarkable the effect.

Figure 9.
The deviatoric stress–axial strain curves of the LGSCR samples at different numbers of sand layers and confining pressures of (a) 150 kPa, (b) 250 kPa, and (c) 400 kPa.
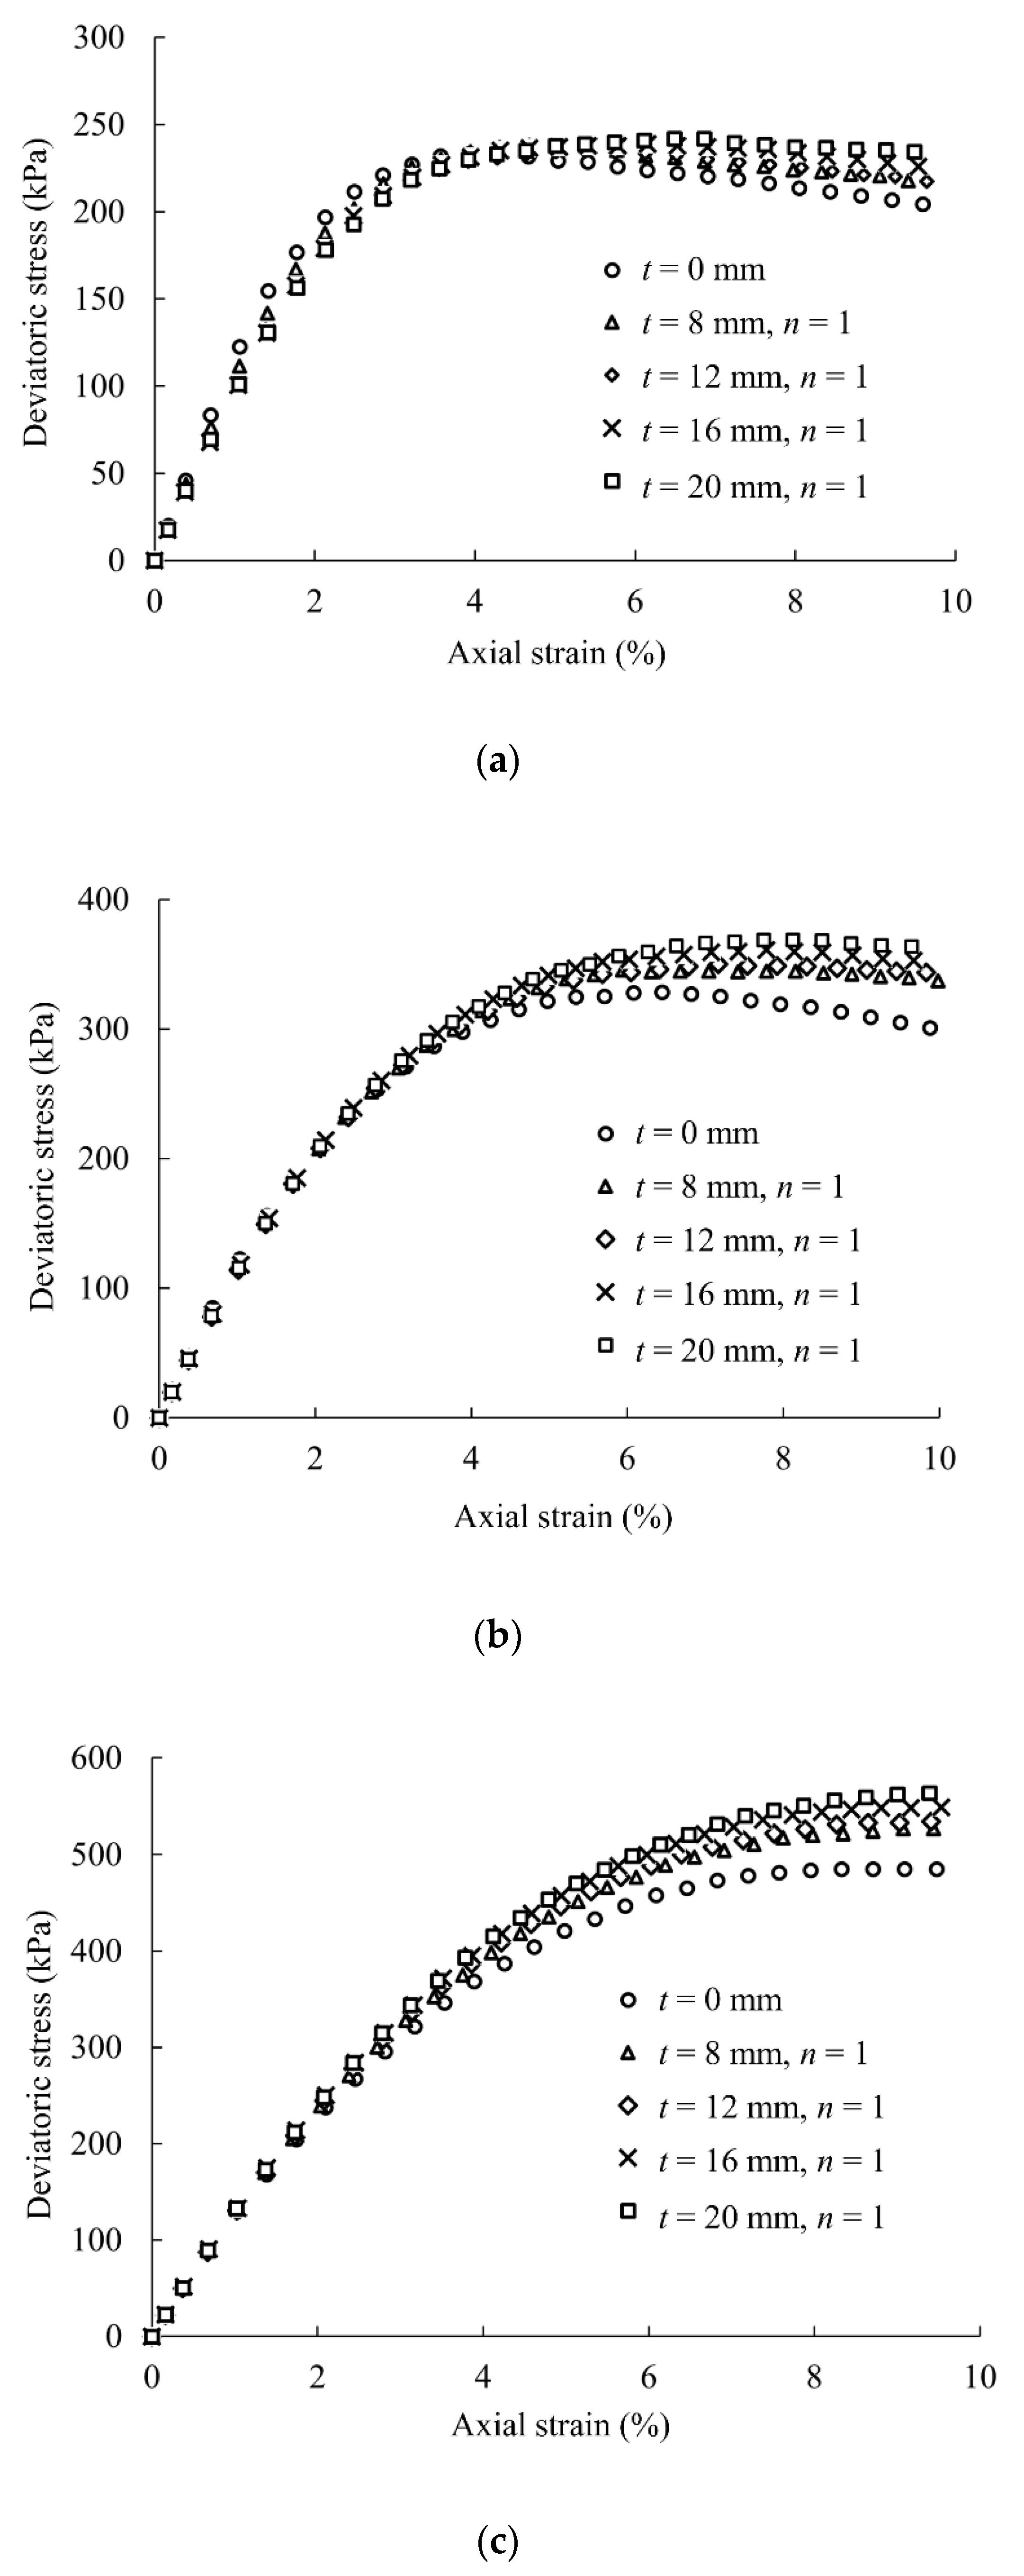
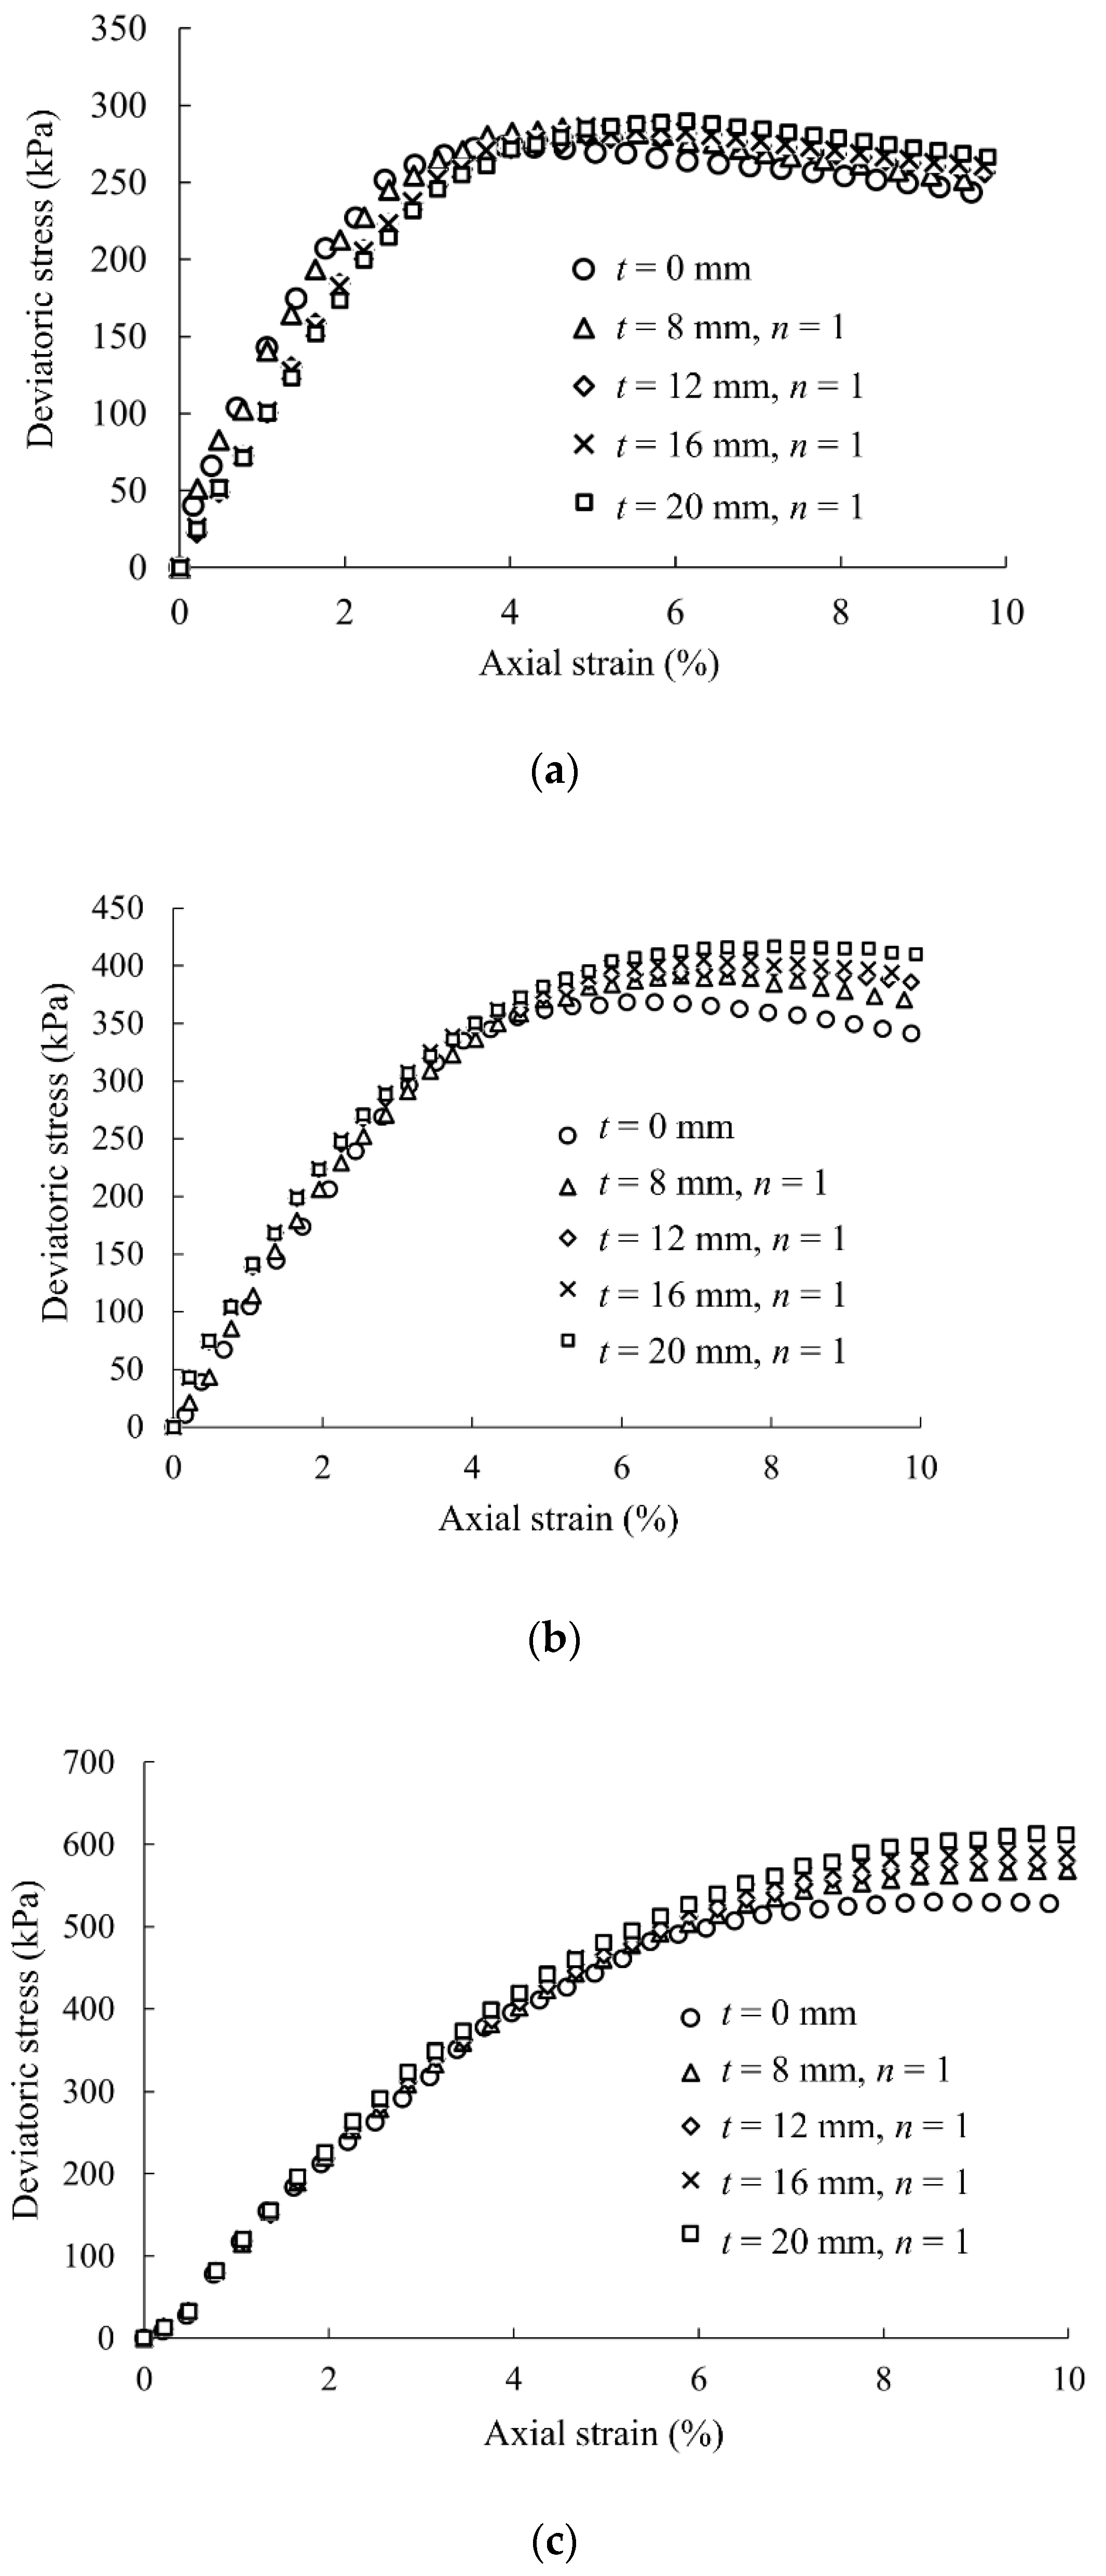
Figure 10 depicts the deviatoric stress–axial strain curves of the LGSCR samples at confining pressures of 150, 250, and 400 kPa and with different thicknesses of sand layers. As seen in this figure, the strength of the LGSCR samples under a specific confining pressure enlarges with an increase in the t value. Compared with the SCL samples, the LGSCR samples have a higher σp at the same thickness of sand layers. However, the trends of the strain-softening degree and the εn corresponding to the σp with the thickness of sand layers of the LGSCR samples are similar to those of the SCL samples. Therefore, the setting mode of thin multi-sand layers should also be adopted for the LGSCR structures in engineering applications.
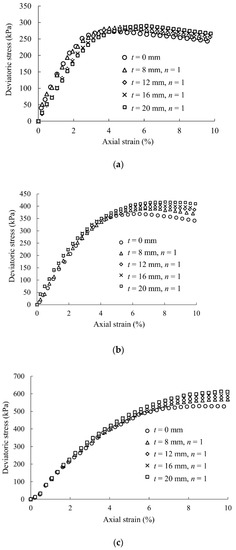
Figure 10.
The deviatoric stress–axial strain curves of the LGSCR samples at different thicknesses of sand layers and confining pressures of (a) 150 kPa, (b) 250 kPa, and (c) 400 kPa.
Furthermore, the obtained deviatoric stress–axial strain curves are compared with those of the non-woven-geotextile-reinforced sand samples under triaxial compression [25]. The researchers conducted a series of laboratory triaxial compression tests with sand specimens reinforced with nonwoven geotextiles and the results showed that the deviatoric stress increased at an approximately linear rate and then tended to plateau. As displayed in Figure 7, Figure 8, Figure 9 and Figure 10, the SCL samples in this study have a similar trend with the non-woven-geotextile-reinforced sand samples.
4.2. Shear Strength
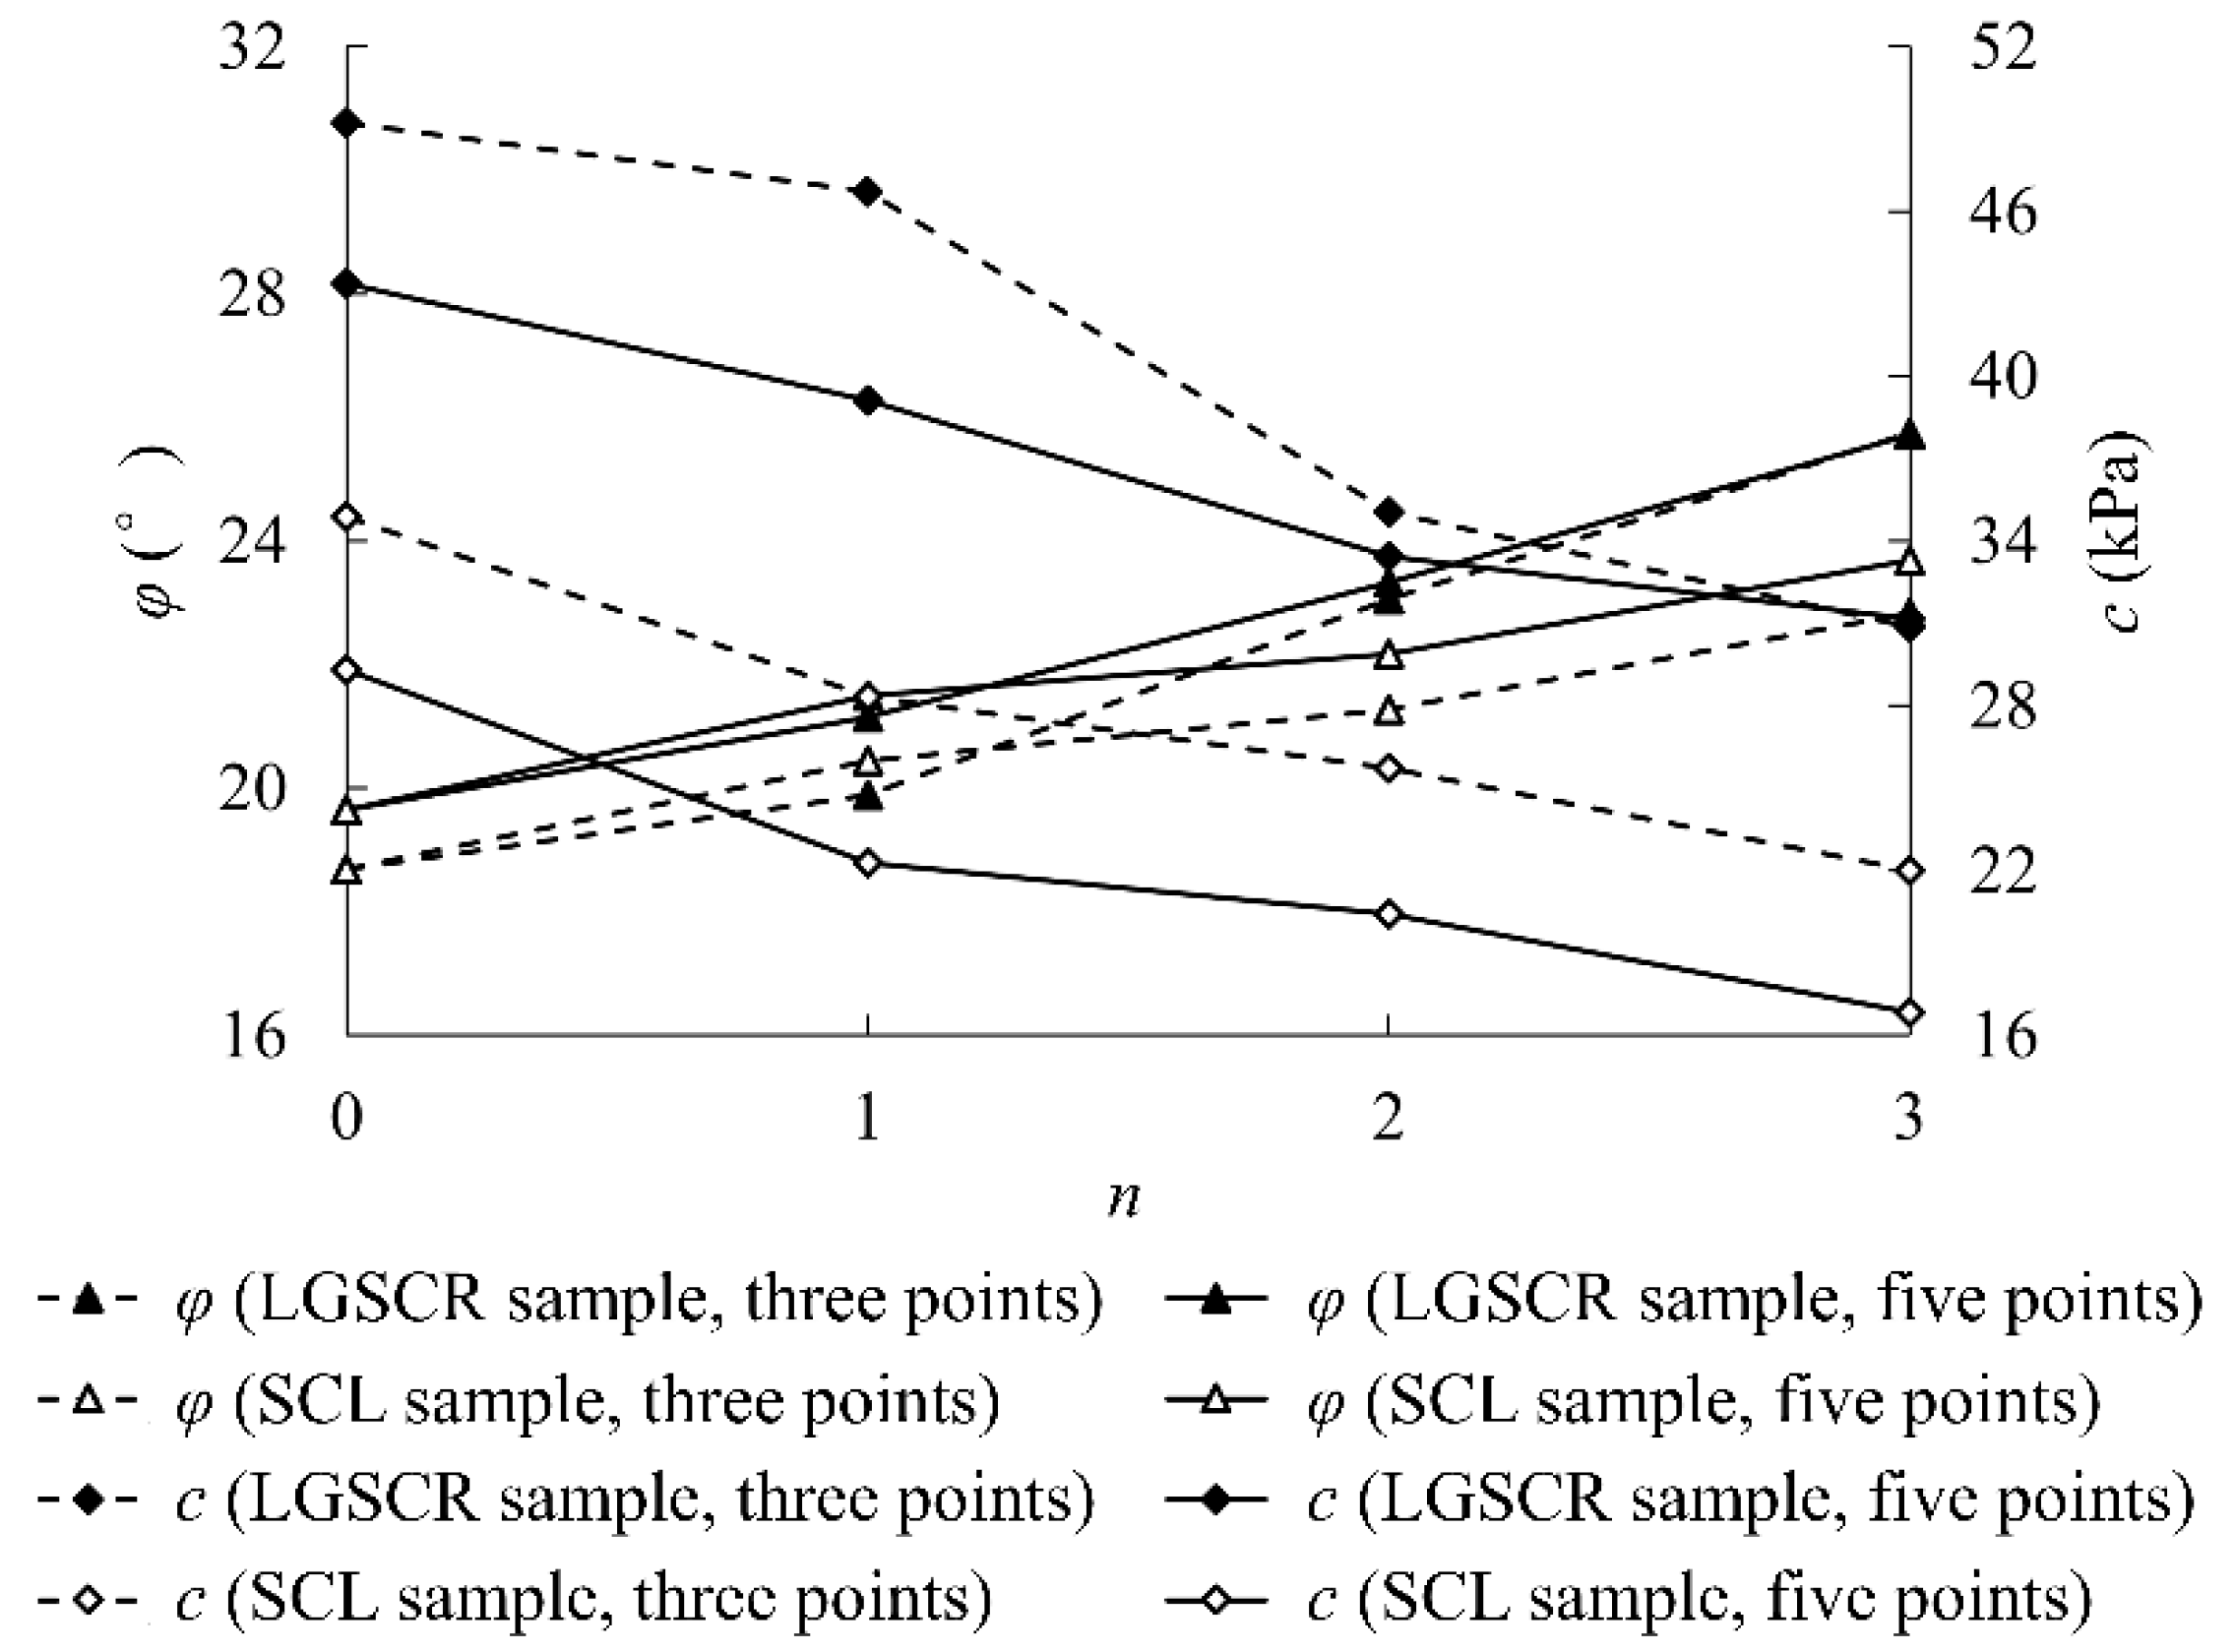
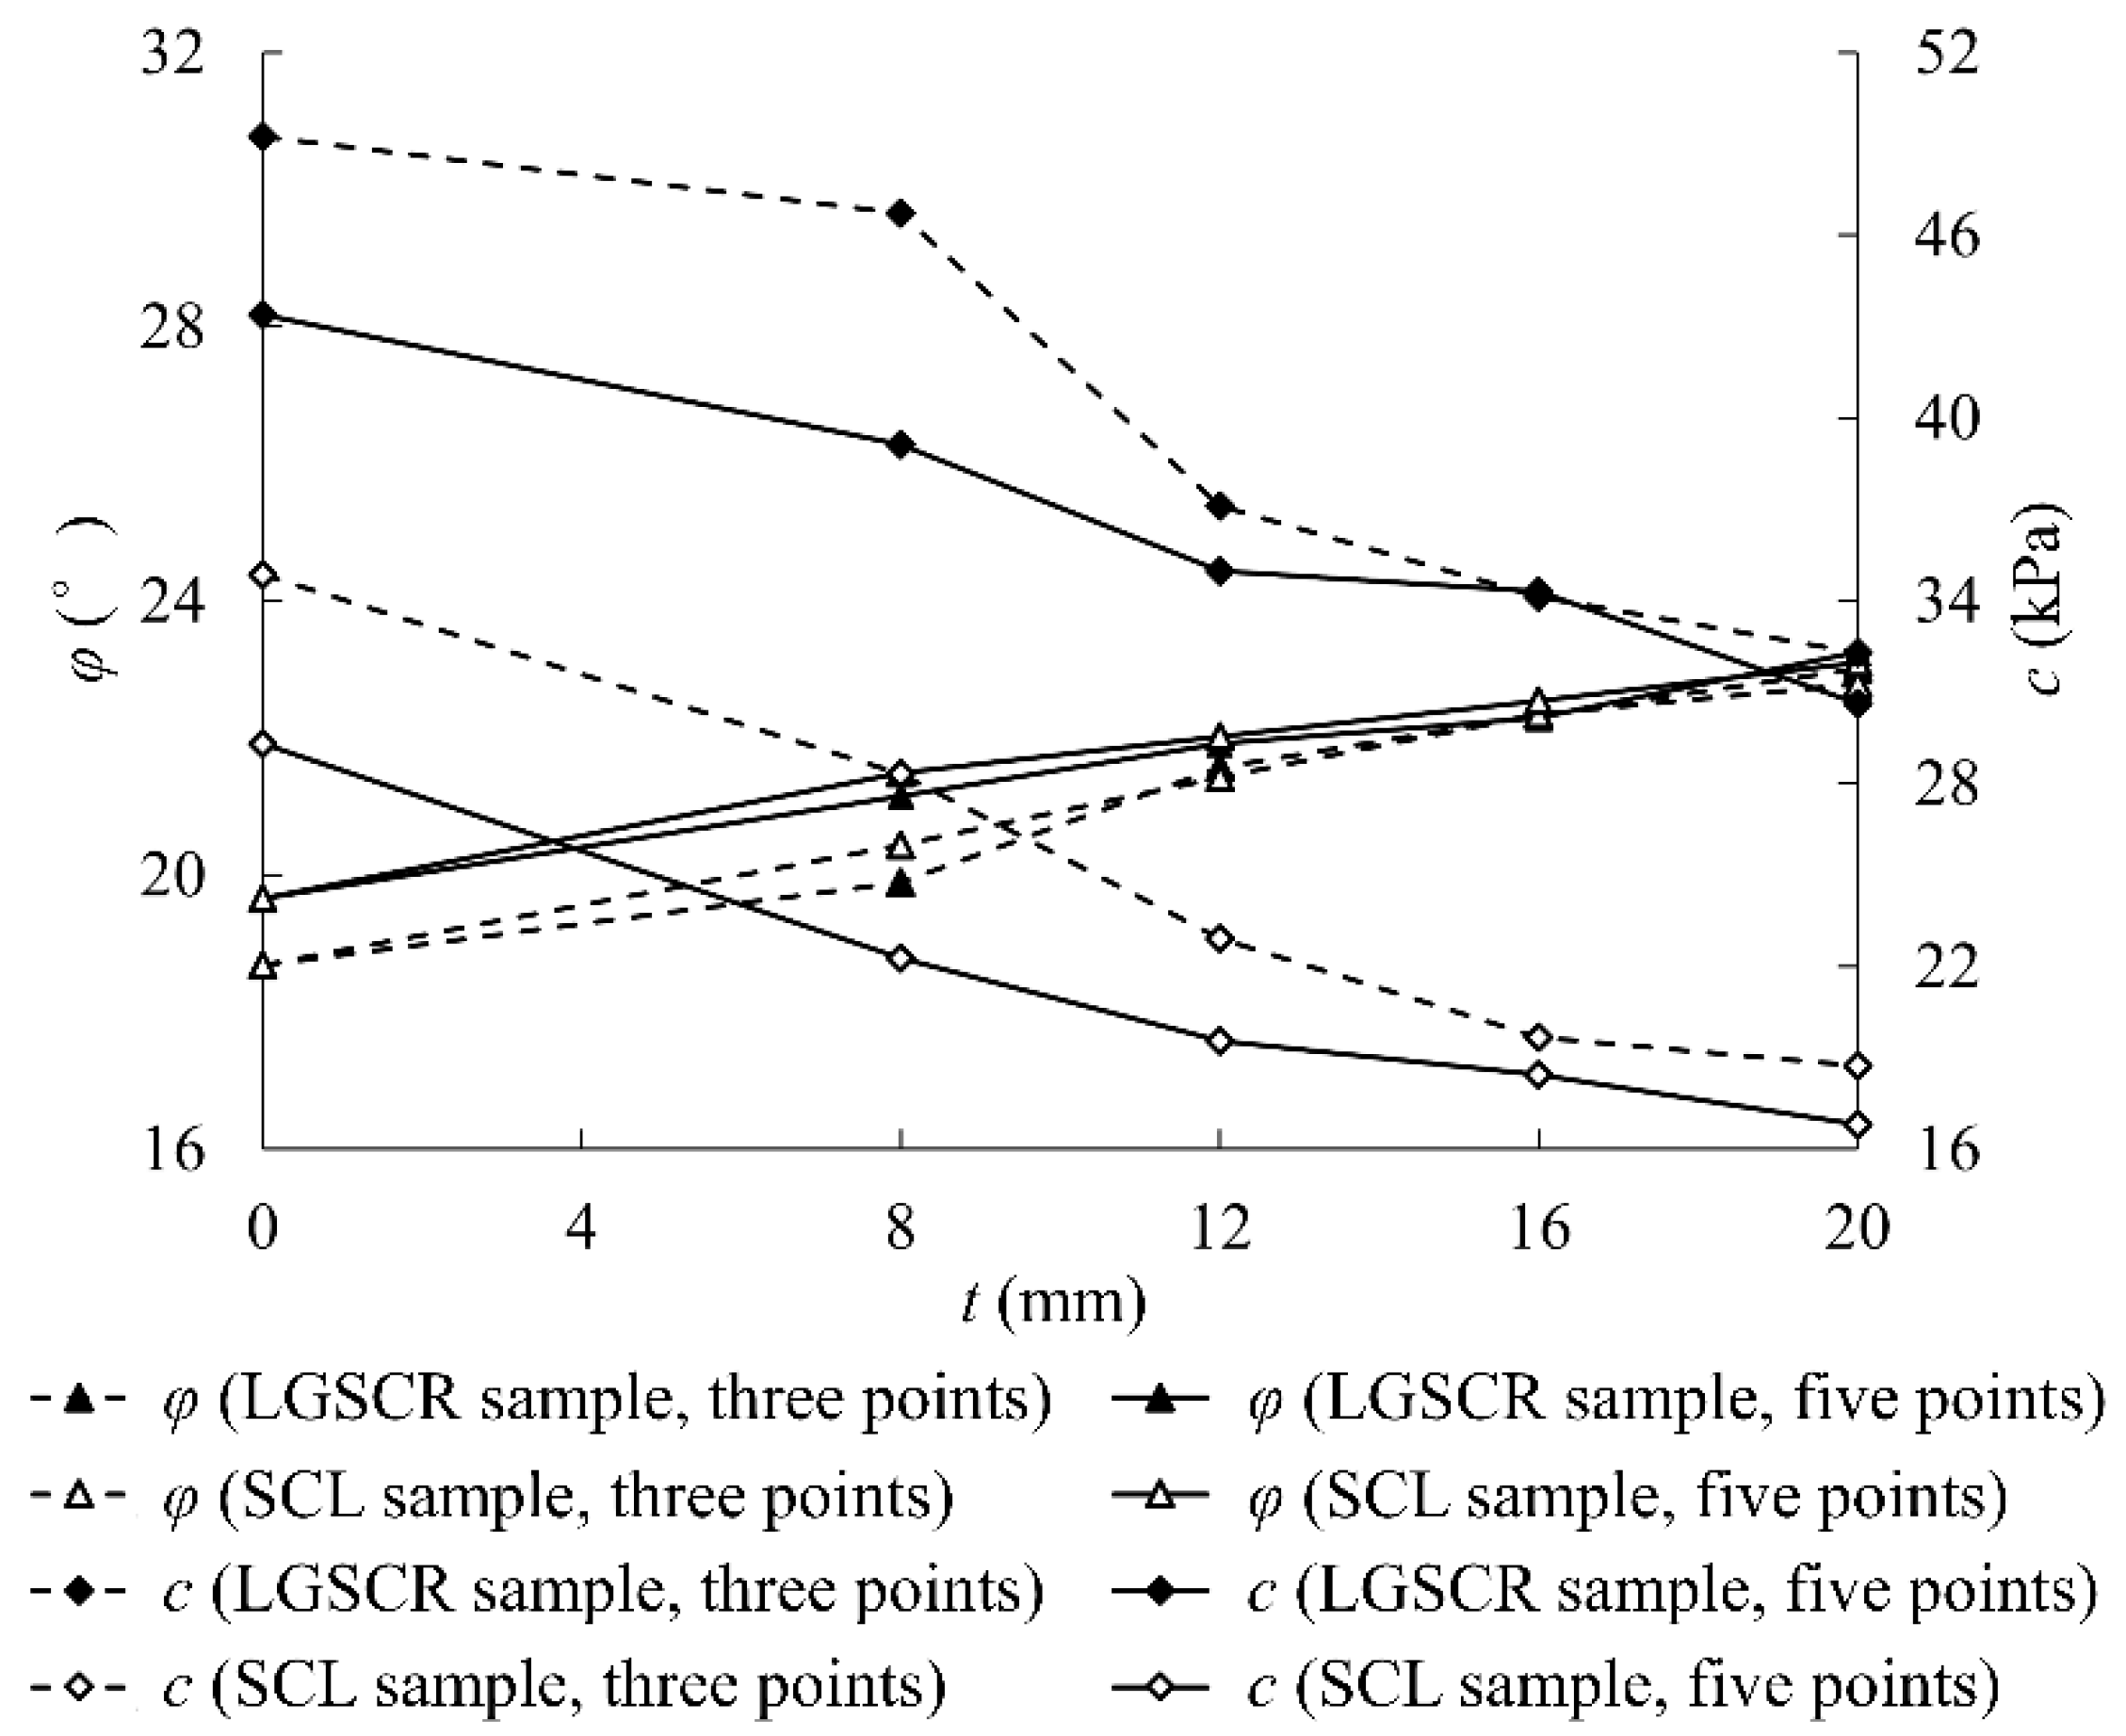
According to the confining pressure and the peak stress of the numerical triaxial compression test, the variation in the shear strength index of the samples can be determined by drawing the Mohr strength envelope. The three points in the legend represent the shear strength obtained by fitting the numerical test results under a confining pressure of 150, 200, and 250 kPa. The five points in the legend also indicate the shear strength obtained by fitting the numerical test results under confining pressures of 150, 200, 250, 300, and 400 kPa.
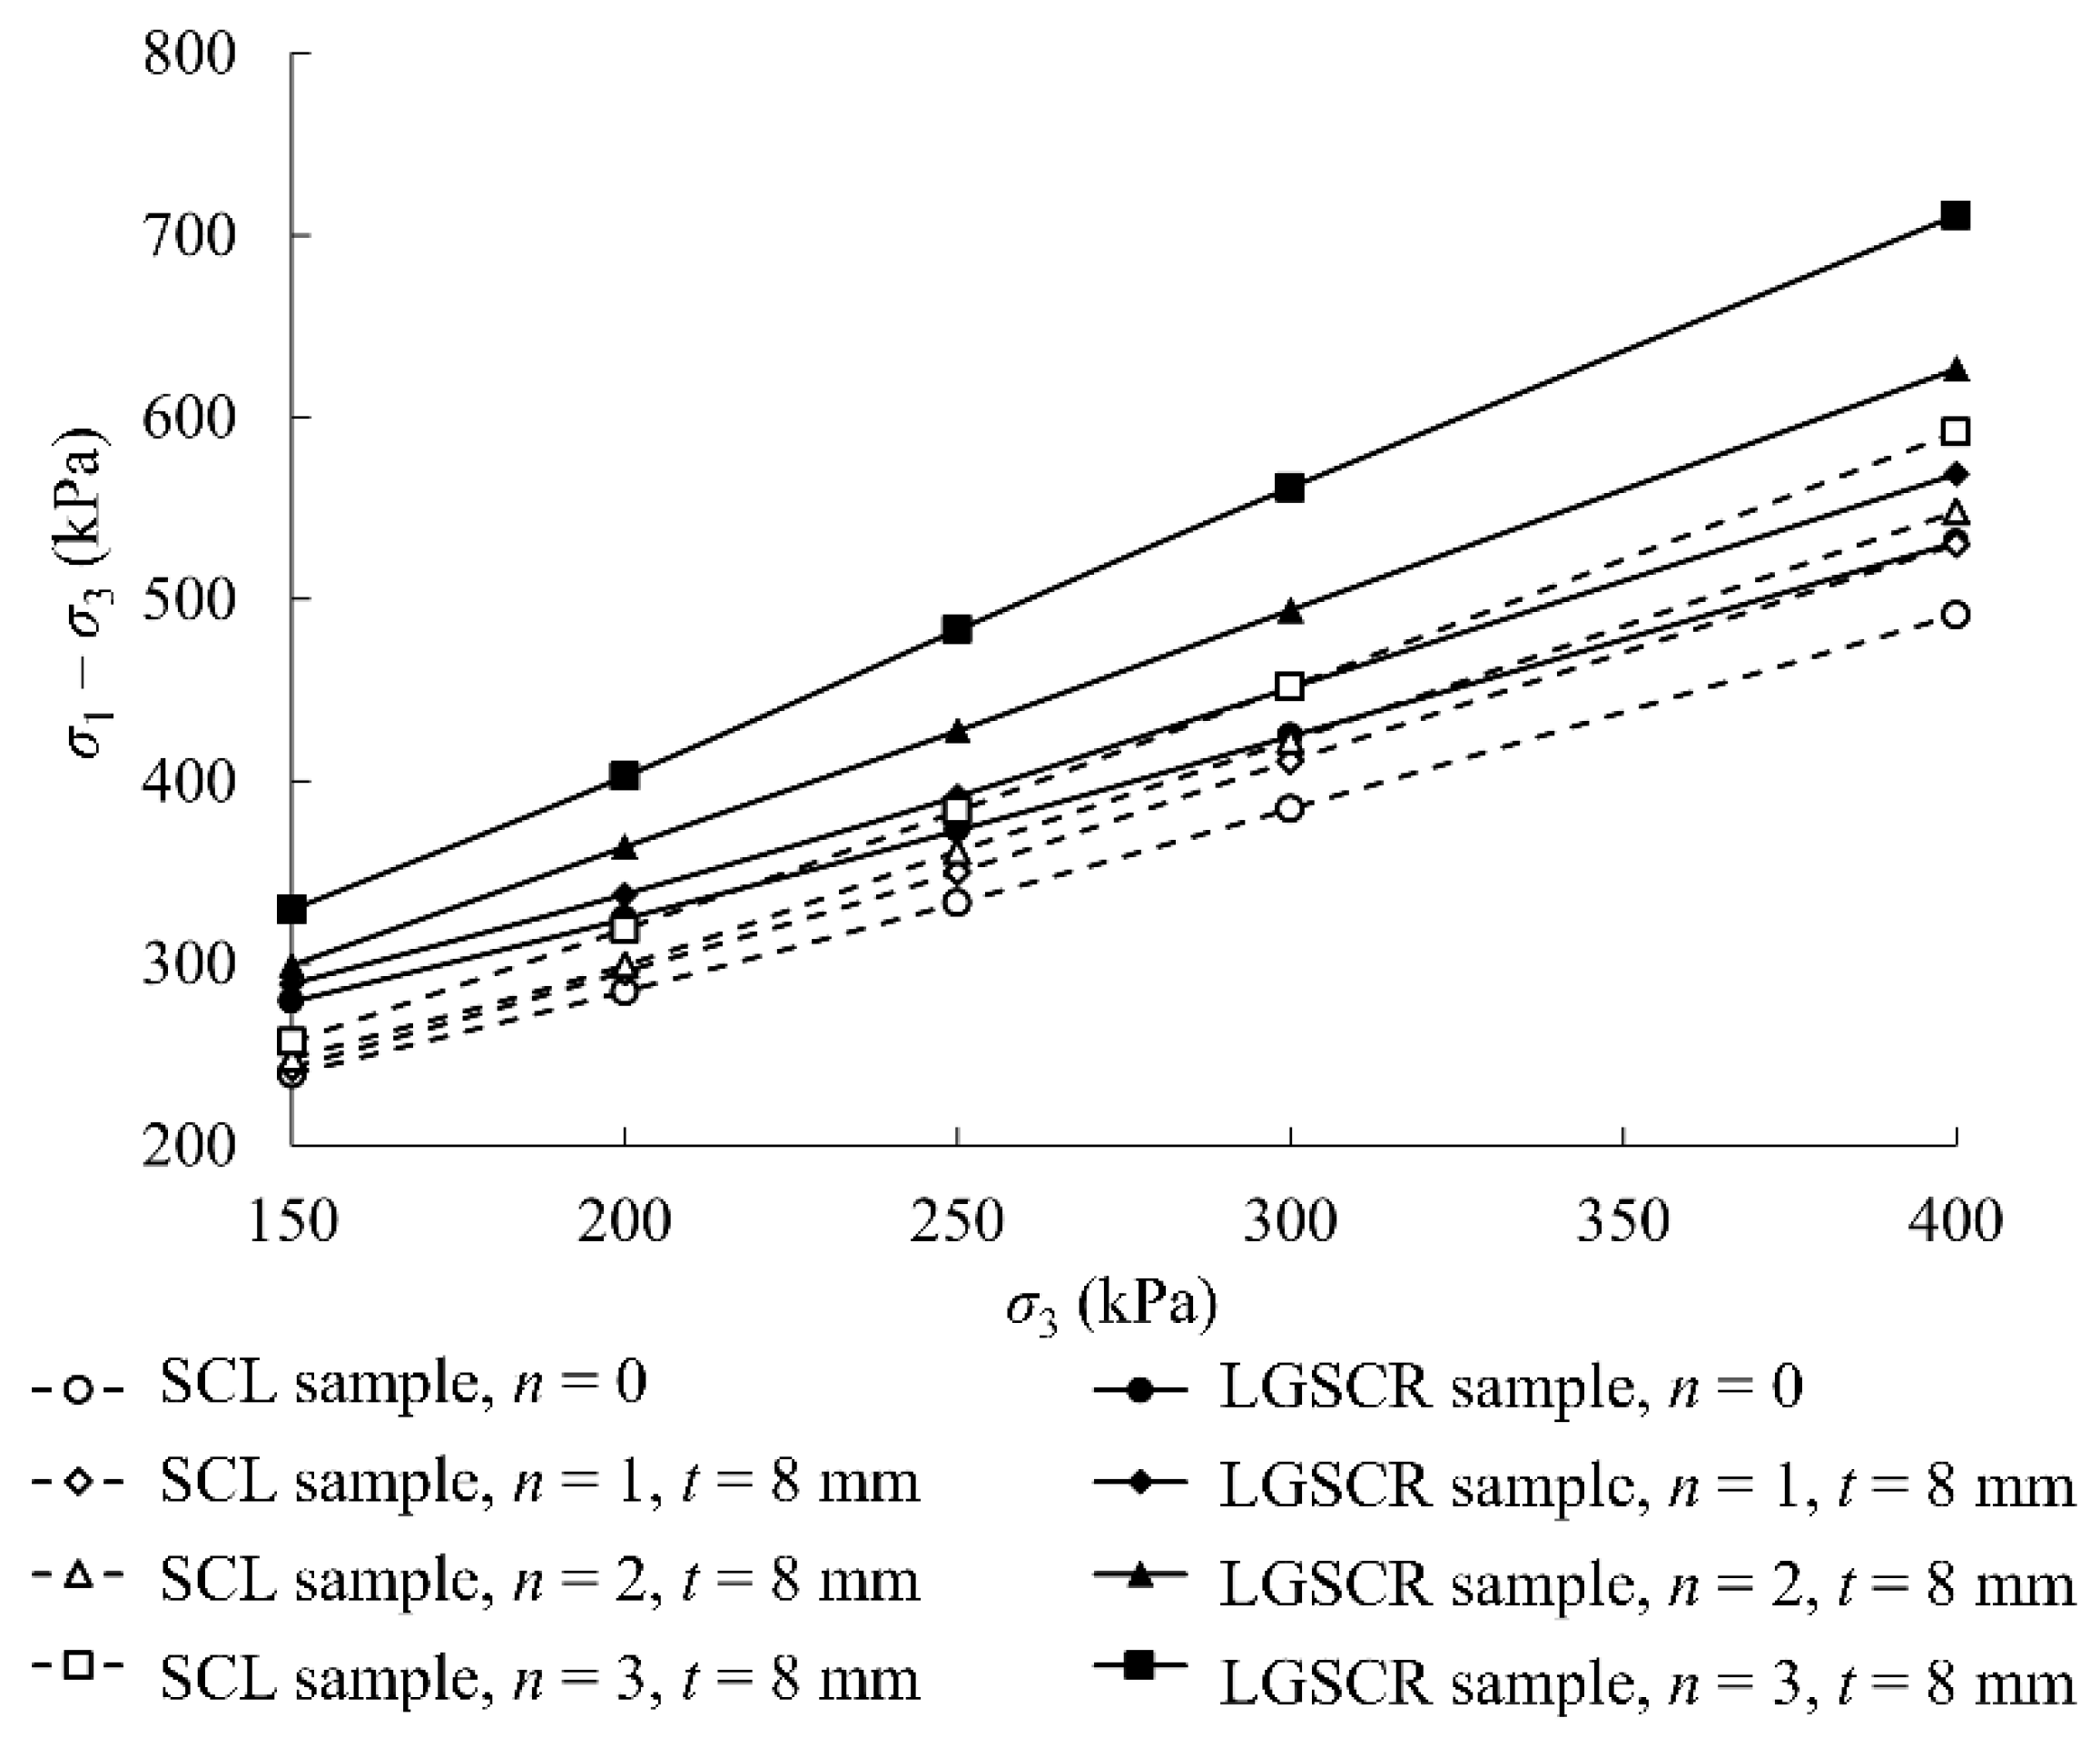
Figure 11 and Figure 12 present the peak stress–confining pressure curves and the shear strength index of the samples at different numbers of sand layers, respectively. Figure 11 shows that the σp of the samples enlarges with an increase in the confining pressure. At a constant confining pressure, the σp rises with an increase in the n value; the influence of n on the σp also continues to increase as the confining pressure enlarges. A higher confining pressure causes a greater difference in the σp of the samples with different numbers of sand layers, leading to a significant difference in the shear strength indices obtained by the two different fitting methods in Figure 12. According to the numerical triaxial compression test results, the fitted values of cohesion (c) obtained in a confining pressure range of 150–400 kPa are all lower than those obtained in a confining pressure range of 150–250 kPa. However, the variation in the regularity of the internal friction angle (φ) is precisely the opposite. Hence, a reasonable test pressure should be determined according to the actual stress state of the LGSCR structure in practical engineering.
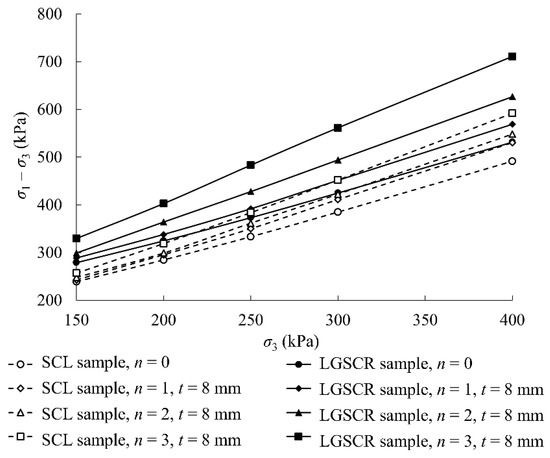
Figure 11.
The peak stress–confining pressure curves of samples at different numbers of sand layers.

Figure 12.
The variation in the shear strength index of the samples with the number of sand layers.
It can be seen in Figure 12 that increasing the number of sand layers reduces the cohesion of the samples significantly but enlarges the internal friction angle. After laying the geogrid in the sand layer of the SCL sample, the σp of the samples increases significantly. The higher the confining pressure, the greater the increasing degree of the σp. Comparing the shear strength indices of the LGSCR samples with those of the SCL samples demonstrates that the geogrid embedment improves the cohesion of the samples; the internal friction angle also rises when the number of sand layers is equal to or greater than two, that is, n ≥ 2.
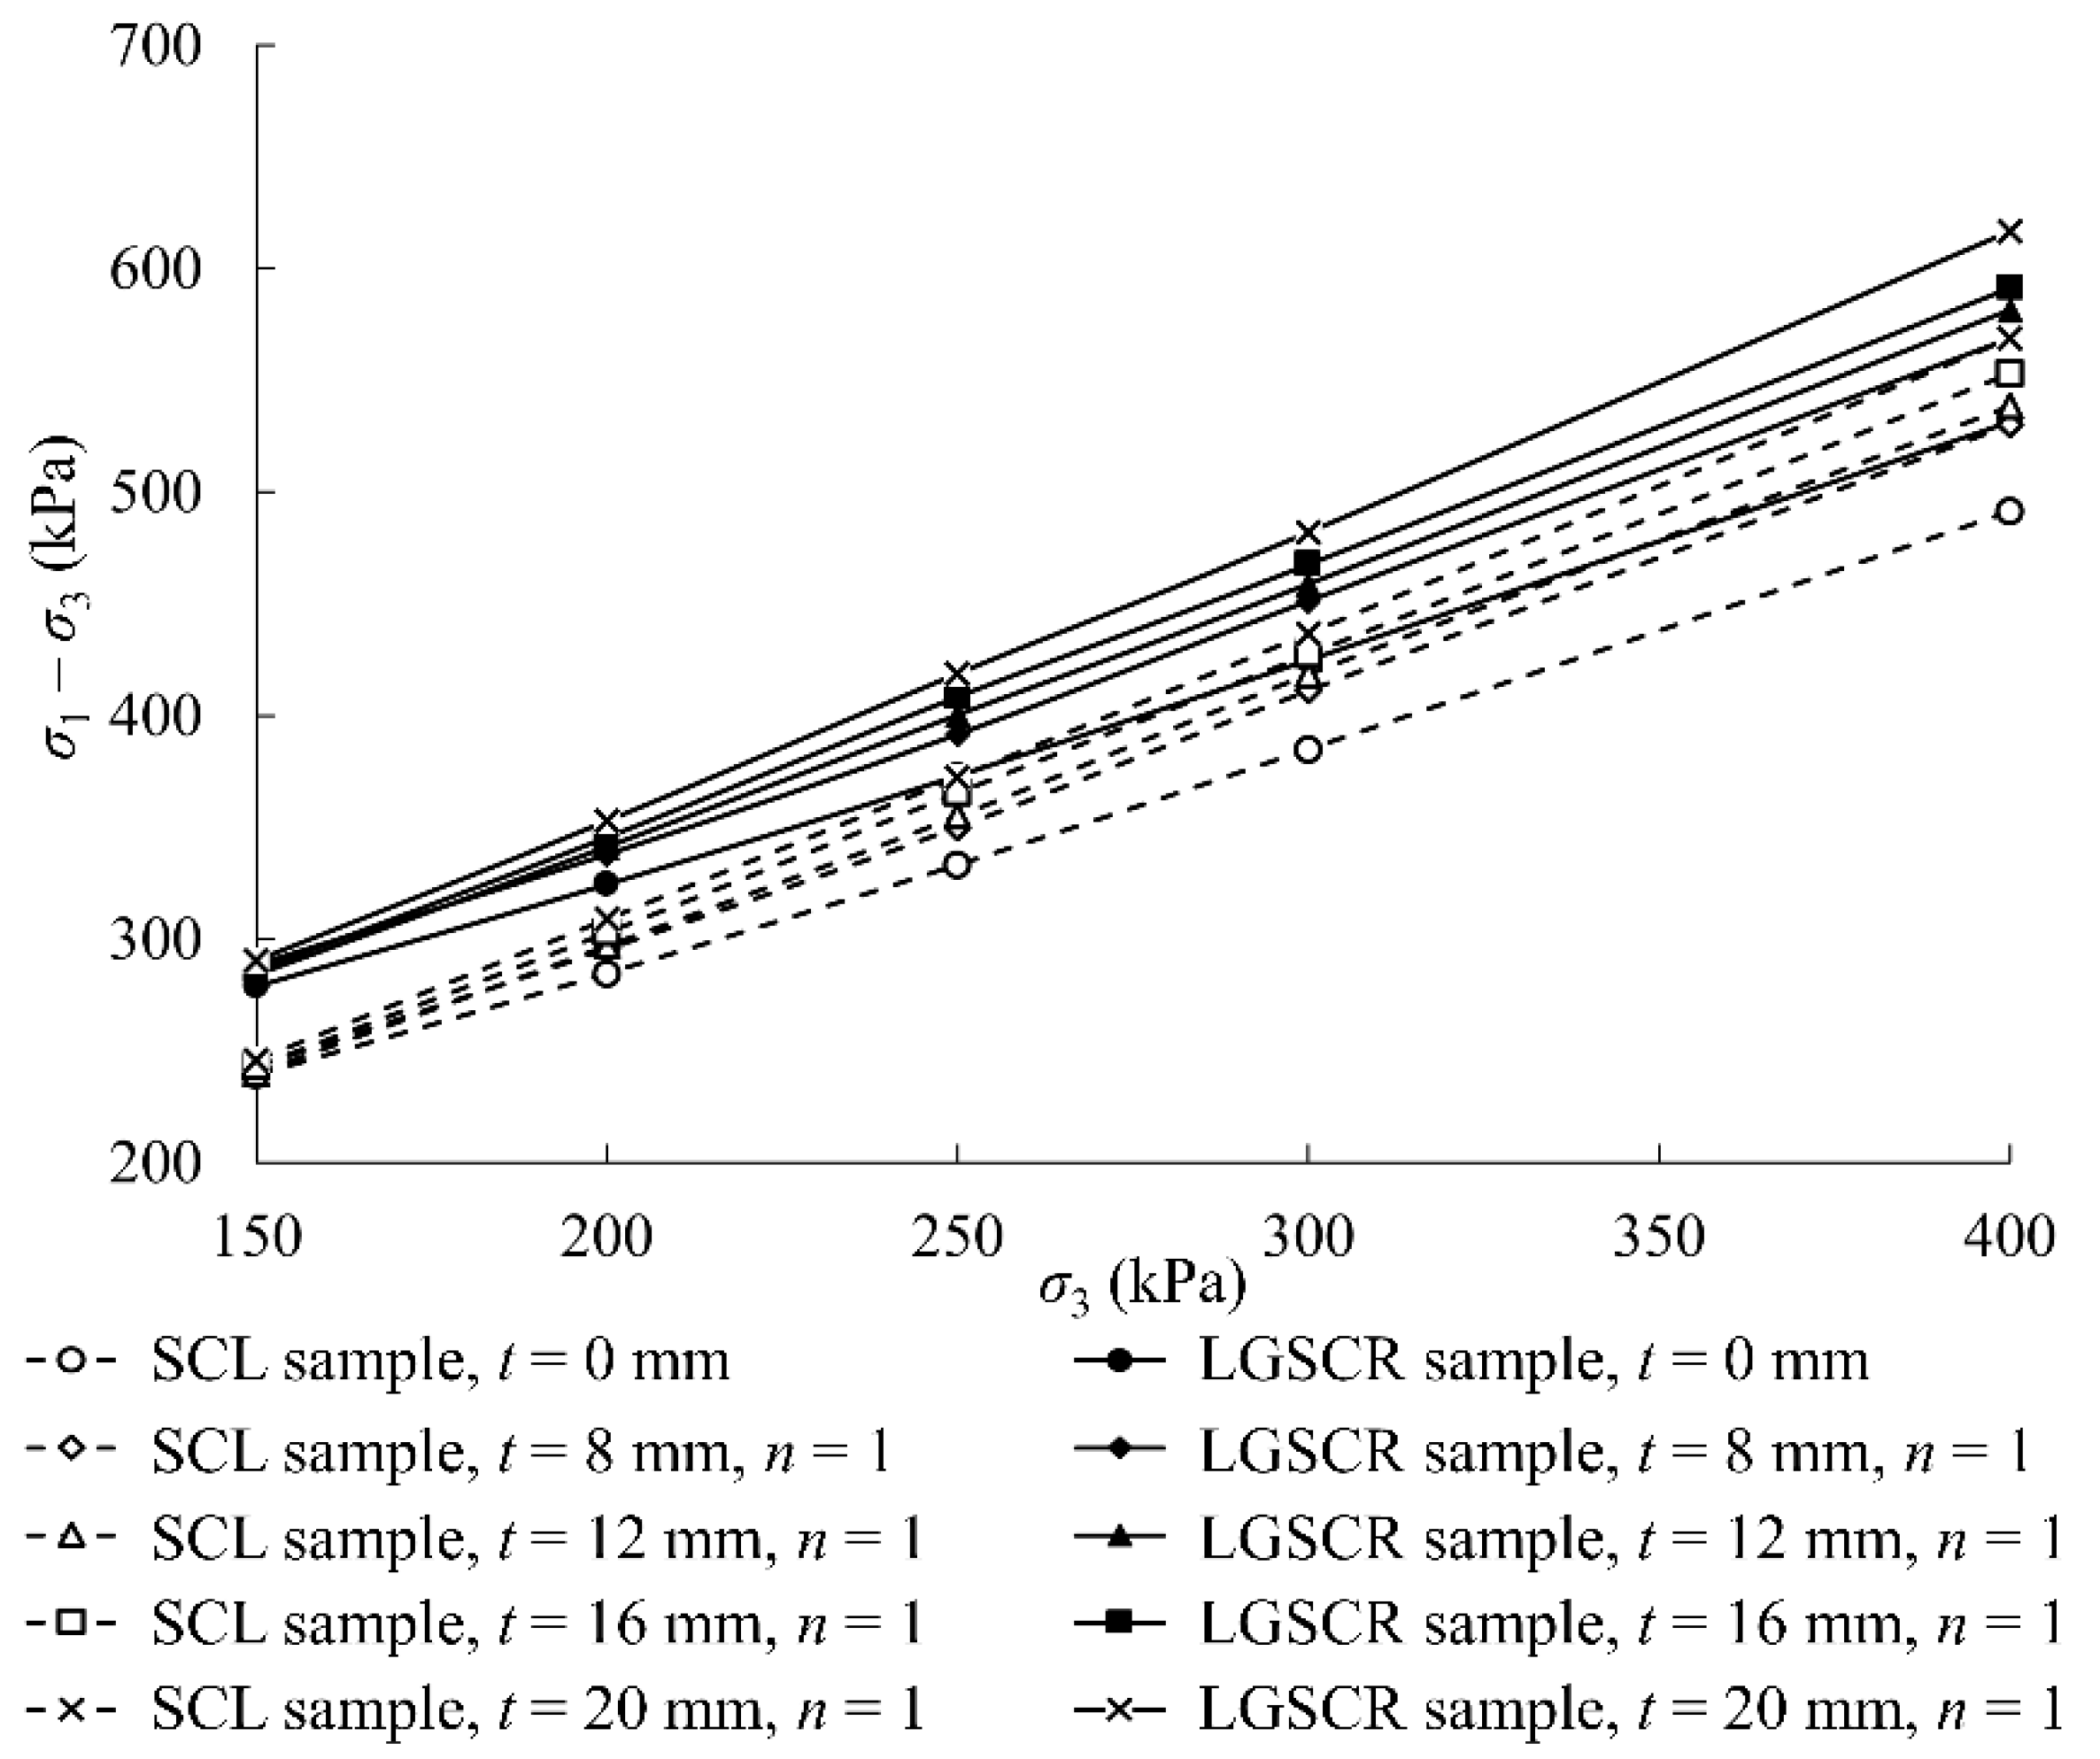
Figure 13 and Figure 14 delineate the peak stress–confining pressure curves and the shear strength index of the samples at different thicknesses of sand layers, respectively. Figure 13 shows that the σp of the samples enlarges with an increase in the confining pressure, and the influence of the thickness of sand layers on the σp improves continuously as the confining pressure rises. The higher the confining pressure, the more significant the difference in the σp of the samples at different thicknesses of sand layers. Therefore, there is also a marked difference in the shear strength calculated by the two different fitting methods. According to the numerical triaxial test results, the fitted values of cohesion obtained in a confining pressure range of 150–400 kPa are all lower than those obtained in a confining pressure range of 150–250 kPa. However, the internal friction angle shows an opposite variation trend.

Figure 13.
The peak stress–confining pressure curves of the samples at different thicknesses of sand layers.
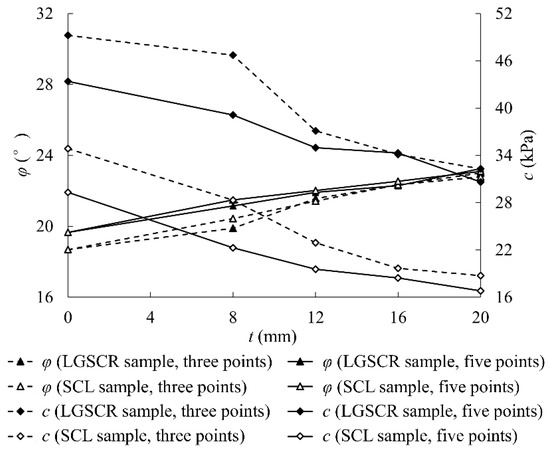
Figure 14.
The variation in the shear strength index of the samples with the thickness of sand layers.
According to Figure 14, raising the thickness of sand layers reduces the fitted cohesion of the samples but enlarges the internal friction angle. Comparing the shear strength indices of the LGSCR samples with those of the SCL samples for the sample with one sand layer (n = 1) demonstrates that the geogrid embedment can improve the cohesion of the samples but does not visibly change their internal friction angles.
To summarize the improvement or deterioration percentages corresponding the effect of adding the sand layers and geogrid, the comparison between the shear strength index of the pure clay sample, the SCL sample, and the LGSCR sample is listed in Table 2. As the setting mode of thin multi-sand layers is recommended for the LGSCR structure, the SCL sample with n = 3 and t = 8 mm and the LGSCR sample with n = 3 and t = 8 mm are selected in the comparison. The φ value of the samples can be improved by 20.9% to 22.6% by adding the sand layers in the pure clay samples, and the c value of the samples can be improved by 41.6% to 54.8% by adding the geogrids in the SCL samples.
Table 2.
The comparison between the shear strength index of the pure clay sample, the SCL sample, and the LGSCR sample.
5. Conclusions
This paper conducts triaxial tests on LGSCR and SCL samples using the discrete element method and explores the effects of the number and thickness of sand layers and geogrid-reinforced sand layers on the numerical triaxial compression test results of the samples. The following conclusions can be drawn from the findings of the current work:
- Laying the sand layers in the samples can significantly improve their post-peak strain-softening characteristics. Moreover, the geogrid embedment can further enhance the ductility of the samples. The effect of increasing the thickness of sand layers alone on the behaviors of LGSCR and SCL samples is minimal. Thus, in practical engineering, the setting mode of thin multi-sand layers should be adopted to improve the safety of LGSCR structures.
- The influence of the sand layer on the peak stress of LGSCR and SCL samples improves with an increase in the confining pressure. Higher confining pressure causes a more significant difference in the peak stress on different LGSCR or SCL samples, which indicates that the effect of the sand layer on increasing the peak stress on the samples is more noticeable. Thus, raising the number of sand layers reduces the cohesion of the samples but increases their internal friction angles. Therefore, a reasonable test pressure should be determined according to the actual stress state of the LGSCR structure in engineering applications.
- Compared with the SCL samples, the LGSCR samples with geogrid embedment have a higher peak strength under specific confining pressure, and in terms of the shear strength index, the apparent cohesion of the LGSCR samples is larger than that of the SCL samples. Furthermore, the internal friction angle of the LGSCR samples is also larger than that of the SCL samples when the number of sand layers is equal to or greater than two.
Author Contributions
Methodology, T.Y.; Project administration, W.C.; Resources, Q.S.; Writing—original draft, L.C.; Writing—review & editing, M.X. and P.X. All authors have read and agreed to the published version of the manuscript.
Funding
This work was funded by the National Natural Science Foundation of China (NSFC) (grant numbers 52009129, 52008285, and 52178341), and the Natural Science Foundation of Guangdong Province, China (grant number 2021A1515011682). The authors would like to acknowledge this financial support.
Institutional Review Board Statement
Not applicable.
Informed Consent Statement
Not applicable.
Data Availability Statement
Not applicable.
Conflicts of Interest
The authors declare no conflict of interest.
References
- Yang, K.H.; Yalew, W.M.; Nguyen, M.D. Behavior of geotextile-reinforced clay with a coarse material sandwich technique under unconsolidated-undrained triaxial compression. Int. J. Geomech. 2016, 16, 04015083. [Google Scholar] [CrossRef]
- Elias, V.; Christopher, B.R.; Berg, R. Mechanically Stabilized Earth Walls and Reinforced Soil Slopes Design and Construction Guidelines; Rep. No. FHWA-NHI-00-043; National Highway Institute, Federal Highway Administration: Washington, DC, USA, 2001.
- AASHTO. Standard Specifications for Highway Bridges, 17th ed.; AASHTO: Washington, DC, USA, 2002. [Google Scholar]
- Berg, R.; Christopher, B.R.; Samtani, N. Design of Mechanically Stabilized Earth Walls and Reinforced Soil Slopes; Rep. No. FHWA-NHI-10-024; National Highway Institute, Federal Highway Administration: Washington, DC, USA, 2009; Volumes I and II.
- NCMA. Design Manual for Segmental Retaining Walls; NCMA: Herndon, VA, USA, 2010. [Google Scholar]
- Pan, Y.T.; Liu, Y.; Tyagi, A.; Lee, F.H.; Li, D.Q. Model-independent strength-reduction factor for effect of spatial variability on tunnel with improved soil surrounds. Géotechnique 2021, 71, 406–422. [Google Scholar] [CrossRef]
- Zhang, R.; Dong, X.; Lu, Z.; Pu, H. Strength characteristics of hydraulically dredged mud slurry treated by flocculation-solidification combined method. Constr. Build. Mater. 2019, 228, 116742. [Google Scholar] [CrossRef]
- Abufarsakh, M.Y.; Coronel, J.; Tao, M. Effect of soil moisture content and dry density on cohesive soil–geosynthetic interactions using large direct shear tests. J. Mater. Civ. Eng. 2007, 19, 540–549. [Google Scholar] [CrossRef]
- Unnikrishnan, N.; Rajagopal, K.; Krishnaswamy, N.R. Behavior of reinforced clay under monotonic and cyclic loading. Geotext. Geomembr. 2002, 20, 117–133. [Google Scholar] [CrossRef]
- Abdi, M.R.; Sadrnejad, A.; Arjomand, M.A. Strength enhancement of clay by encapsulating geogrids in thin layers of sand. Geotext. Geomembr. 2009, 27, 447–455. [Google Scholar] [CrossRef]
- Balakrishnan, S.; Viswanadham, B.V.S. Centrifuge model studies on the performance of soil walls reinforced with sand-cushioned geogrid layers. Geotext. Geomembr. 2019, 47, 803–814. [Google Scholar] [CrossRef]
- Zhang, B.; Shi, M.L.; Bai, S.W. Investigation on reinforcement-sand-clay layer system using direct-shear test. J. Southeast Univ. (Engl. Ed.) 2006, 22, 544–548. [Google Scholar]
- Abdi, M.R.; Zandieh, A.R. Experimental and numerical analysis of large scale pull out tests conducted on clays reinforced with geogrids encapsulated with coarse material. Geotext. Geomembr. 2014, 42, 494–504. [Google Scholar] [CrossRef]
- Yang, Z. Strength and Deformation Characteristics of Reinforced Sand; University of California: Los Angeles, CA, USA, 1972. [Google Scholar]
- Schlosser, F.; Long, N.T. Recent results of French research on reinforced earth. J. Constr. Div. 1974, 100, 223–237. [Google Scholar] [CrossRef]
- Belheine, N.; Plassiard, J.P.; Donzé, F.V.; Darve, F.; Seridi, A. Numerical simulation of drained triaxial test using 3D discrete element modeling. Comput. Geotech. 2009, 36, 320–331. [Google Scholar] [CrossRef]
- Duan, K.; Kwok, C.Y.; Ma, X. DEM simulations of sandstone under true triaxial compressive tests. Acta Geotech. 2009, 12, 495–510. [Google Scholar] [CrossRef]
- Zhang, J.; Wang, X.; Yin, Z.Y.; Liang, Z. DEM modeling of large-scale triaxial test of rock clasts considering realistic particle shapes and flexible membrane boundary. Eng. Geol. 2020, 279, 105871. [Google Scholar] [CrossRef]
- Wu, M.; Wang, J.; Russell, A.; Cheng, Z. DEM modelling of mini-triaxial test based on one-to-one mapping of sand particles. Géotechnique 2021, 71, 714–727. [Google Scholar] [CrossRef]
- Gu, M.; Han, J.; Zhao, M. Three-dimensional DEM analysis of axially loaded geogrid-encased stone column in clay bed. Int. J. Geomech. 2020, 20, 04019180. [Google Scholar] [CrossRef]
- Zhang, R.; Li, J. Simulation on mechanical behavior of cohesive soil by Distinct Element Method. J. Terramech. 2006, 43, 303–316. [Google Scholar] [CrossRef]
- Zhang, Z.; Zhang, X.; Qiu, H.; Daddow, M. Dynamic characteristics of track-ballast-silty clay with irregular vibration levels generated by high-speed train based on DEM. Constr. Build. Mater. 2016, 125, 564–573. [Google Scholar] [CrossRef]
- Chen, C.; McDowell, G.R.; Thom, N.H. Discrete element modelling of cyclic loads of geogrid-reinforced ballast under confined and unconfined conditions. Geotext. Geomembr. 2012, 35, 76–86. [Google Scholar] [CrossRef]
- Zheng, J.J.; Cao, W.Z.; Zhou, Y.J.; Jiang, J.G. Pull-out test study of interface behavior between triaxial geogrid and soil. Rock Soil Mech. 2017, 38, 317–324. [Google Scholar]
- Nguyen, M.D.; Yang, K.H.; Lee, S.H.; Wu, C.S.; Tsai, M.H. Behavior of nonwoven-geotextile-reinforced sand and mobilization of reinforcement strain under triaxial compression. Geosynth. Int. 2013, 20, 207–225. [Google Scholar] [CrossRef]
Publisher’s Note: MDPI stays neutral with regard to jurisdictional claims in published maps and institutional affiliations. |
© 2021 by the authors. Licensee MDPI, Basel, Switzerland. This article is an open access article distributed under the terms and conditions of the Creative Commons Attribution (CC BY) license (https://creativecommons.org/licenses/by/4.0/).