Abstract
In this study, an experimental program was performed on masonry-infilled frame specimens with varied construction precision and masonry thickness. A total of five portal frame specimens, which consist of four masonry-infilled frames and a bare frame, were tested, and the results were analyzed to investigate the effects of construction precision and interaction between the masonry infill and the frame. The test results indicated that the gap in the masonry infill decreased strength by 75% to 80% and stiffness by 55% to 70%. A comparison between the measured and predicted peak strength using the current code shows that the code equations underestimate the strength by up to 70%. This is due to the fact that the contribution of friction in shear resistance of the masonry wall is actually ignored in the current code since no adequate method for estimating the normal force is provided. In addition, reflecting the observation that the failure mode of the columns changed to shear failure when thick masonry walls were used, a mechanical model that can explain the shear failure and enables the estimation of maximum strength was proposed. The maximum strengths of the specimens calculated using the proposed model were in good agreement with the experimental results.
1. Introduction
A masonry-infilled frame is a reinforced concrete or steel frame structure filled with masonry walls, which is commonly used as the exterior walls or partitions of a building. In the past, masonry infills were considered nonstructural components as they do not carry gravity load, and their structural contribution was ignored. However, experiences from past earthquakes indicated that these components have a great influence on the seismic performance of the whole structure. Since the masonry infills restrain the deformation of the frame, they increase the strength and rigidity of the whole structure and reduce the deformation capacity [1,2].
For the evaluation of seismic performance, the accurate prediction of strength, stiffness, and deformation capacity is important. In most studies, the strength of the masonry-infilled frame is calculated as the sum of the strength of the frame and the strength of the masonry infills [3,4]. In the analysis results using the equivalent compression strut, which is the most common modeling approach for masonry-infilled frame buildings, the lateral strength of the structure is almost the same as the sum of the strength of the frame and the strength of the compression struts. The strength of the masonry infill varies with the failure mode. When subjected to lateral loads, the failure modes of the masonry infill are classified into three types: bed joint sliding (BJS) failure, diagonal tensile (DT) failure, and corner compression (CC) failure. Many researchers have proposed strength equations associated with one of these failure modes [5,6,7,8,9]. In most equations, the shear strength of the masonry is the most important material property. Various experimental studies have reported that the behavior of the infill wall is affected not only by its own strength and aspect ratio but also by the stiffness and strength of the surrounding frame [2,9,10,11]. Sanada [12] proposed an analytical procedure to determine the strength of a masonry wall surrounded by a strong frame considering the interaction between the masonry and the frame. Some of the masonry strength equations consider the influence of the stiffness or strength of surrounding frames [7,13], acknowledging that there is an interaction between the masonry infills and the surrounding frame. This also indicates that the behavior of the frame can be affected by the strength and stiffness of the infill wall [14,15,16,17,18,19,20,21]. Brodsky [14] reported that the maximum strength of the masonry-filled frame depends more on the failure of the RC frame than the masonry wall, and the failure mode of the RC frame varies with the length of the contact zone between the infill wall and the frame. Noting that the reactions from the masonry wall increase the shear demand of the columns, Basha et al. [16] and Aiello et al. [17] proposed methods to prevent or delay the shear failure of columns. However, the relationship between the strength of the structure and failure mode was not investigated.
In fact, in many experimental studies, the failure mode of the frames in a masonry-infilled frame was different from that of the bare frame, even when the material strength and dimensions of columns and beams were the same. However, studies investigating the influence of masonry infill on failure mode and accordingly quantifying the change in strength or deformation capacity of the frame are limited. Some researchers [18] attempted the use of artificial neural network analyses to predict the maximum strength and inter-story drift of masonry-infilled frame buildings, which are inherently inadequate to describe the interaction between the masonry wall and surrounding frame.
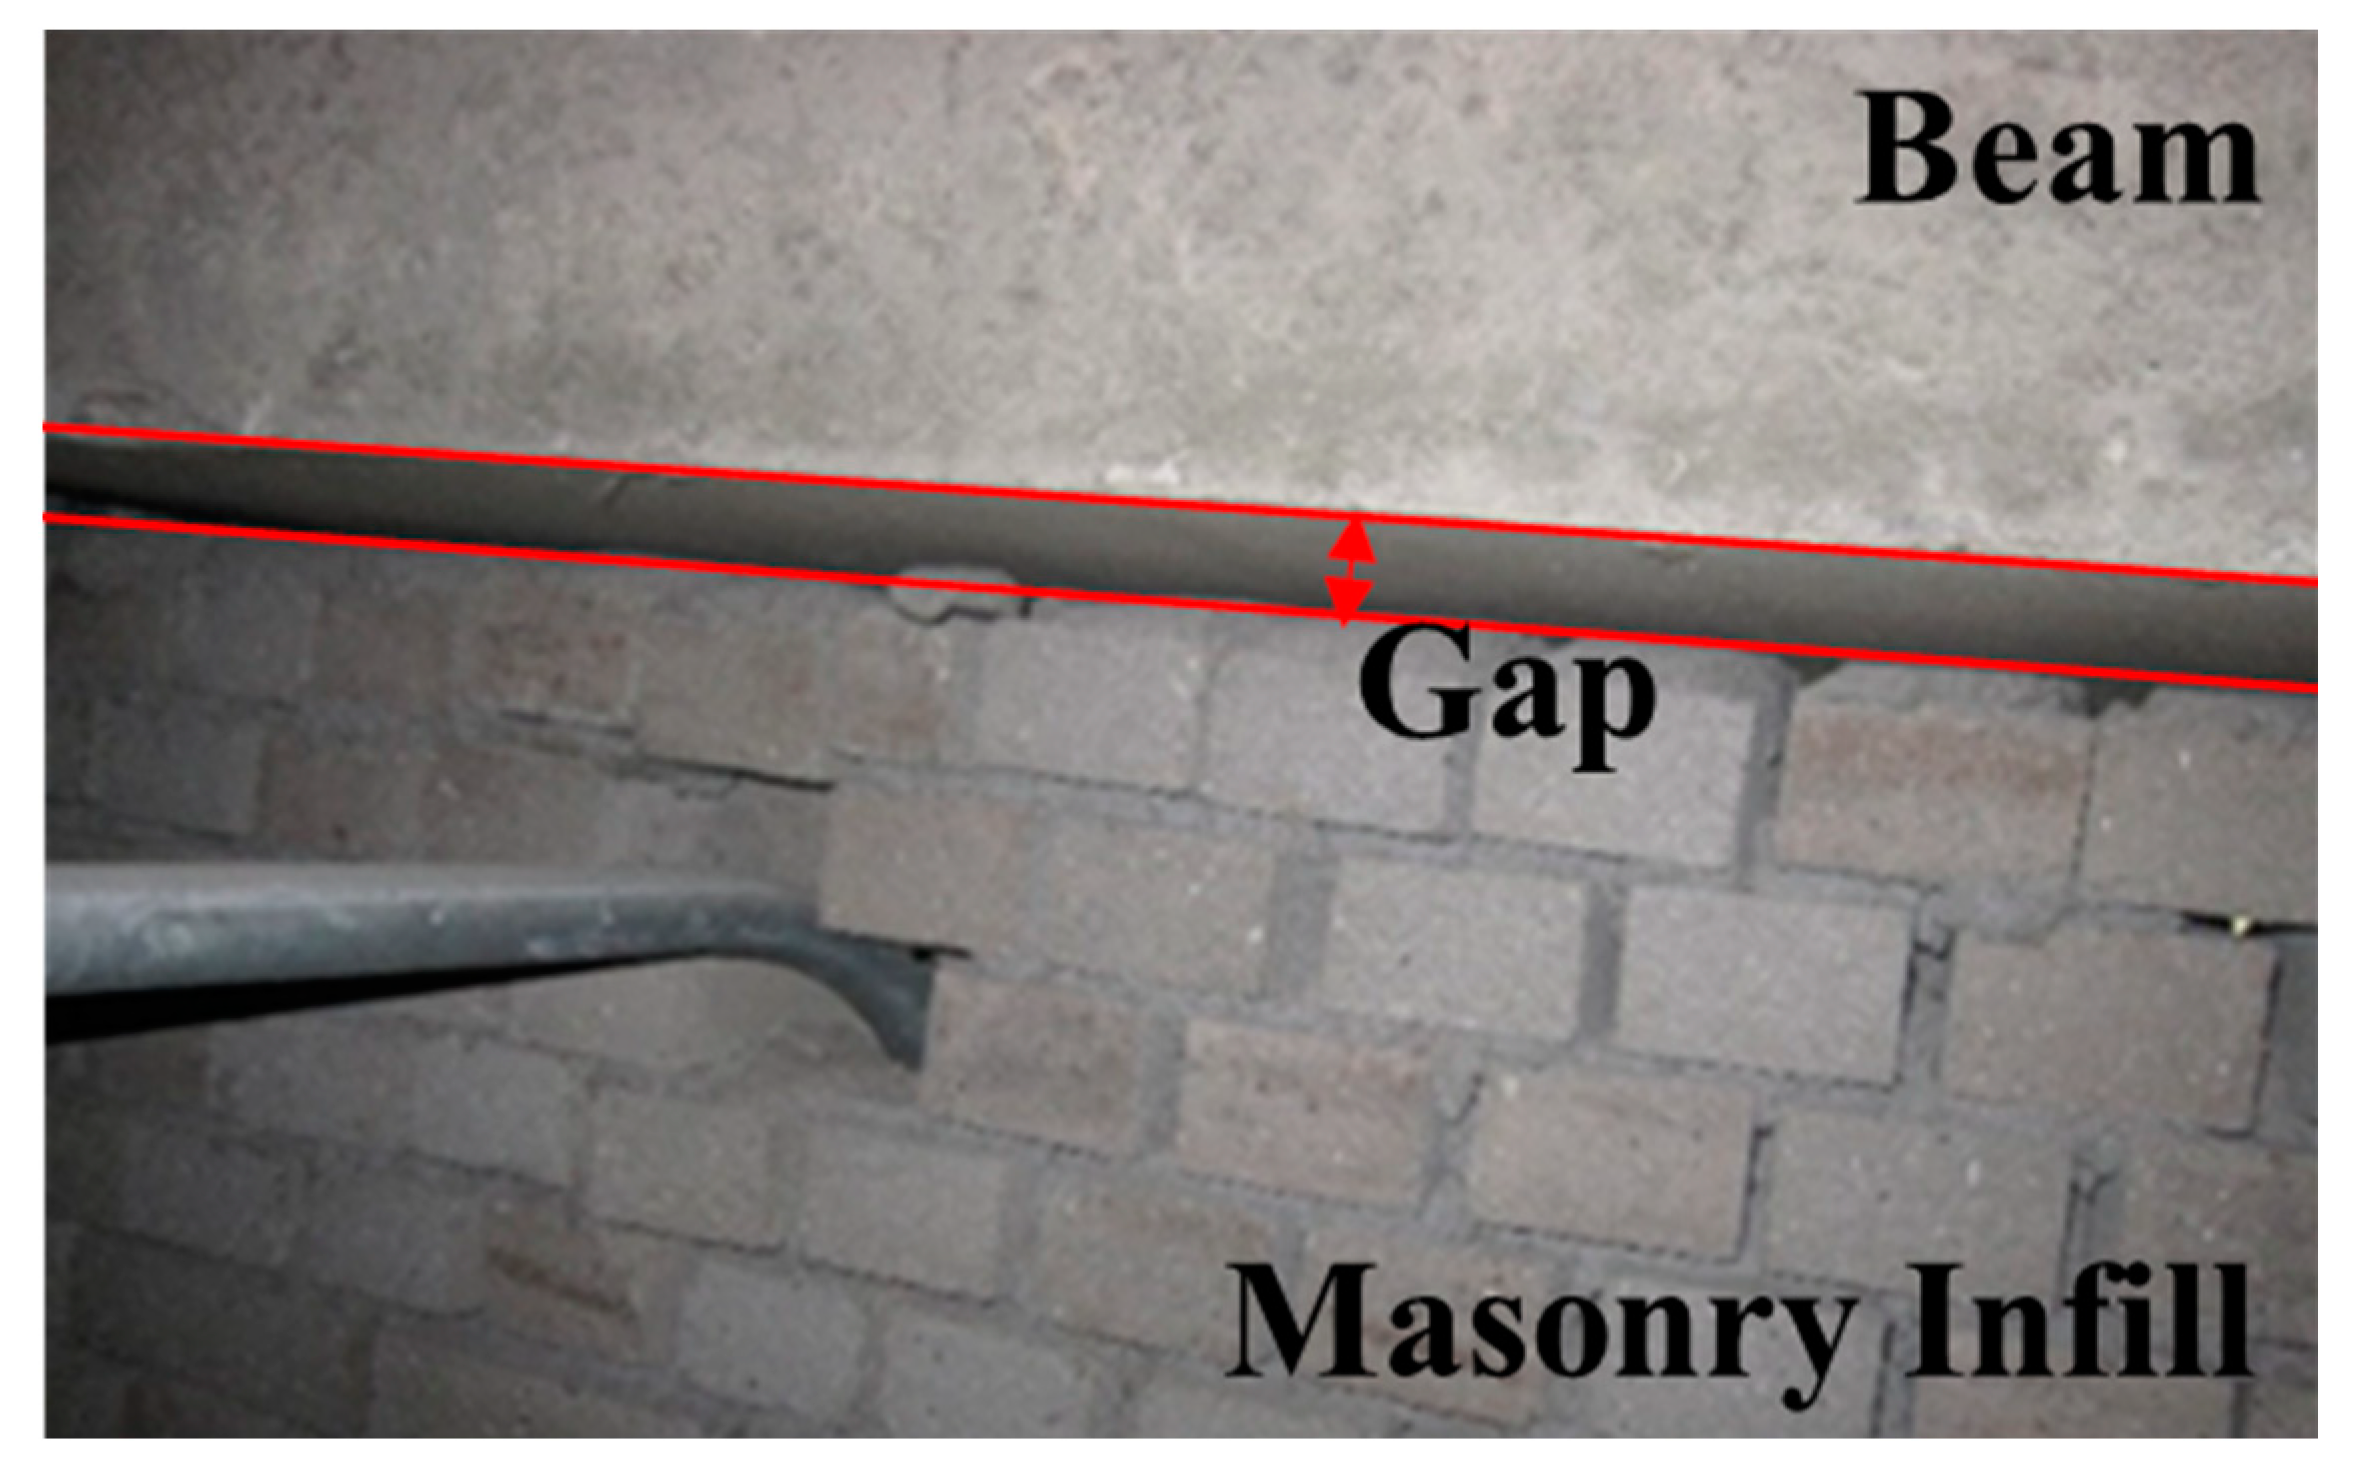
Masonry infill walls are generally installed after the construction of the frame (columns and beams) is complete. When construction precision is low, grouting of the vertical and horizontal joints between the masonry units can be flawed. Additionally, the gap between the masonry and frame (especially at the bottom of the beam and top of the masonry wall) might not be properly grouted during construction. Figure 1 shows an example of such low construction precision. The grouting adequacy of the masonry will affect its strength. Dawe and Seah [22] conducted an experiment with a masonry wall with a gap of 20 mm between the top of the wall and the bottom of the beam. They reported that the gap decreased the initial stiffness by 60% and the maximum strength by 62%. Crisafulli [23] performed a finite element analysis while changing the size of the gap from 0.01 mm to 1.0 mm. When the size of the gap was small, there was no significant difference in stress distribution as the gap could be filled properly even with a small deformation of the frame. As the size of the gap increases, the change in stress distribution in the infill wall also increases, decreasing the formulation of diagonal struts.
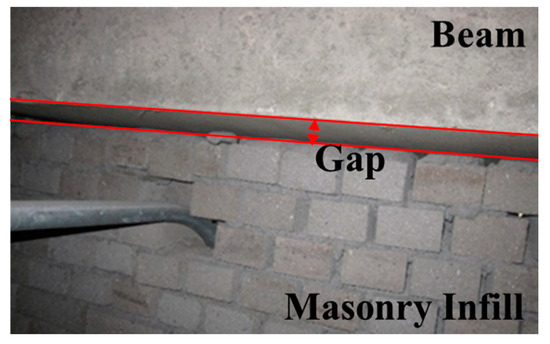
Figure 1.
Gap between beam and masonry infill wall.
In FEMA 306 [24] and ASCE 41 [25], the shear strength of masonry corresponds to BJS strength, estimated as the sum of cohesion and friction, where the friction force is the product of the friction coefficient and the normal force applied to the masonry. ASCE 41 [25] specifies that the normal force shall be calculated from the gravity load transmitted from the upper story and that friction should be ignored when there is a gap between the beam and masonry. However, since the masonry infill is constructed after the frame is finished, a dead load would not produce a normal force to masonry walls and, accordingly, the friction. FEMA 306 [24] suggests that, when the structure deforms laterally, the length of columns decreases due to the effect of curvature shortening, which produces a normal force and, subsequently, a frictional force. However, appropriate lateral displacements must be selected so that normal stresses and friction forces can be calculated.
In this study, an experimental program was performed on masonry-infilled frame specimens with varied construction precision and masonry thickness. A total of five specimens, which consist of four masonry-infilled frames and a bare frame, were tested, and the results were analyzed to investigate the effects of construction precision and interaction between the masonry infill and the frame. The test results indicated that the gap in masonry infill decreased the strength by 75% to 80% and stiffness by 55% to 70%. Comparison between the measured and predicted peak strength using the current code shows that the code equations considerably underestimate the strength. This is due to the fact that the contribution of friction in shear resistance of the masonry wall was actually ignored in the current code since no adequate method for estimating the normal force is provided. During the tests, it was observed that the failure mode of the frames changed to shear failure when thick masonry walls were used. In this study, reflecting such an observation, a mechanical model that can explain the shear failure was proposed. The maximum strengths of the specimens calculated using the proposed model were in good agreement with the test results.
2. Experimental Program
2.1. Specimen Descriptions
A total of five specimens were tested, and Table 1 shows the list of specimens, including a masonry-infilled frame with a single wythe masonry wall without a gap (IF-0.5) and with a gap (IFS-0.5). Similar names were given for the specimens with double wythe masonry walls, ‘IF-1.0’ and ‘IFS-1.0’. ‘BF’ refers to bare the frame specimen that does not have masonry infills. The variables in this experimental program were the construction precision (i.e., the existence of a gap between the bottom of the beam and top of the masonry wall) and the thickness of the masonry infill walls. The size of the gap was 30 mm.

Table 1.
Specimen list.
Figure 2 shows the elevation and section view of the specimens. The dimensions and reinforcements of the frame members are the same in all specimens, 2500 mm in span and 1750 mm in height. The dimensions of the cross-sections of the columns and beams were 300 × 300 mm and 350 × 300 mm, respectively. The columns have 8-D16 for longitudinal reinforcement and D10@150 for transverse reinforcement. The beams have identical reinforcement to the column member. Both columns and beams are designed so that flexural yield precedes shear failure. A running bond and English bond were used for single wythe and double wythe masonry walls, respectively.
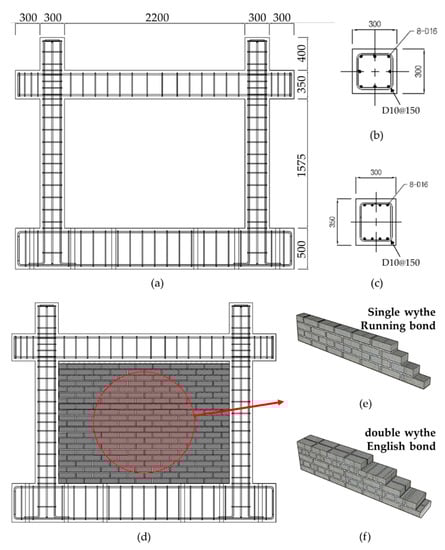
Figure 2.
Details of a test specimen (unit: mm). (a) Dimension of specimens. (b) Column section. (c) Beam section. (d) Masonry-infilled frames. (e) Masonry wall in IF-0.5 & IFS-0.5. (f) Masonry wall in IF-1.0 & IFS-1.0.
Since the purpose of the tests was to investigate the change in the behavior of the masonry with the change in construction precision and masonry thickness, the frame was designed to expect sufficiently ductile behavior. When the columns of a masonry-infilled frame fail due to shear failure at an early stage, the interaction between the frame and the masonry infill cannot be expected. Therefore, in this study, the beam and columns of the specimens were designed to be sufficiently ductile to allow interaction with the masonry infill. In addition, to prevent anchorage failure at the beam–column joint region, transverse reinforcements with tight spacing were placed inside the panel zone, and stubs (protrusions of 400 and 300 mm on the column and beam, respectively) were installed to prevent failure at the beam–column joint region, as shown in Figure 2.
2.2. Material Properties
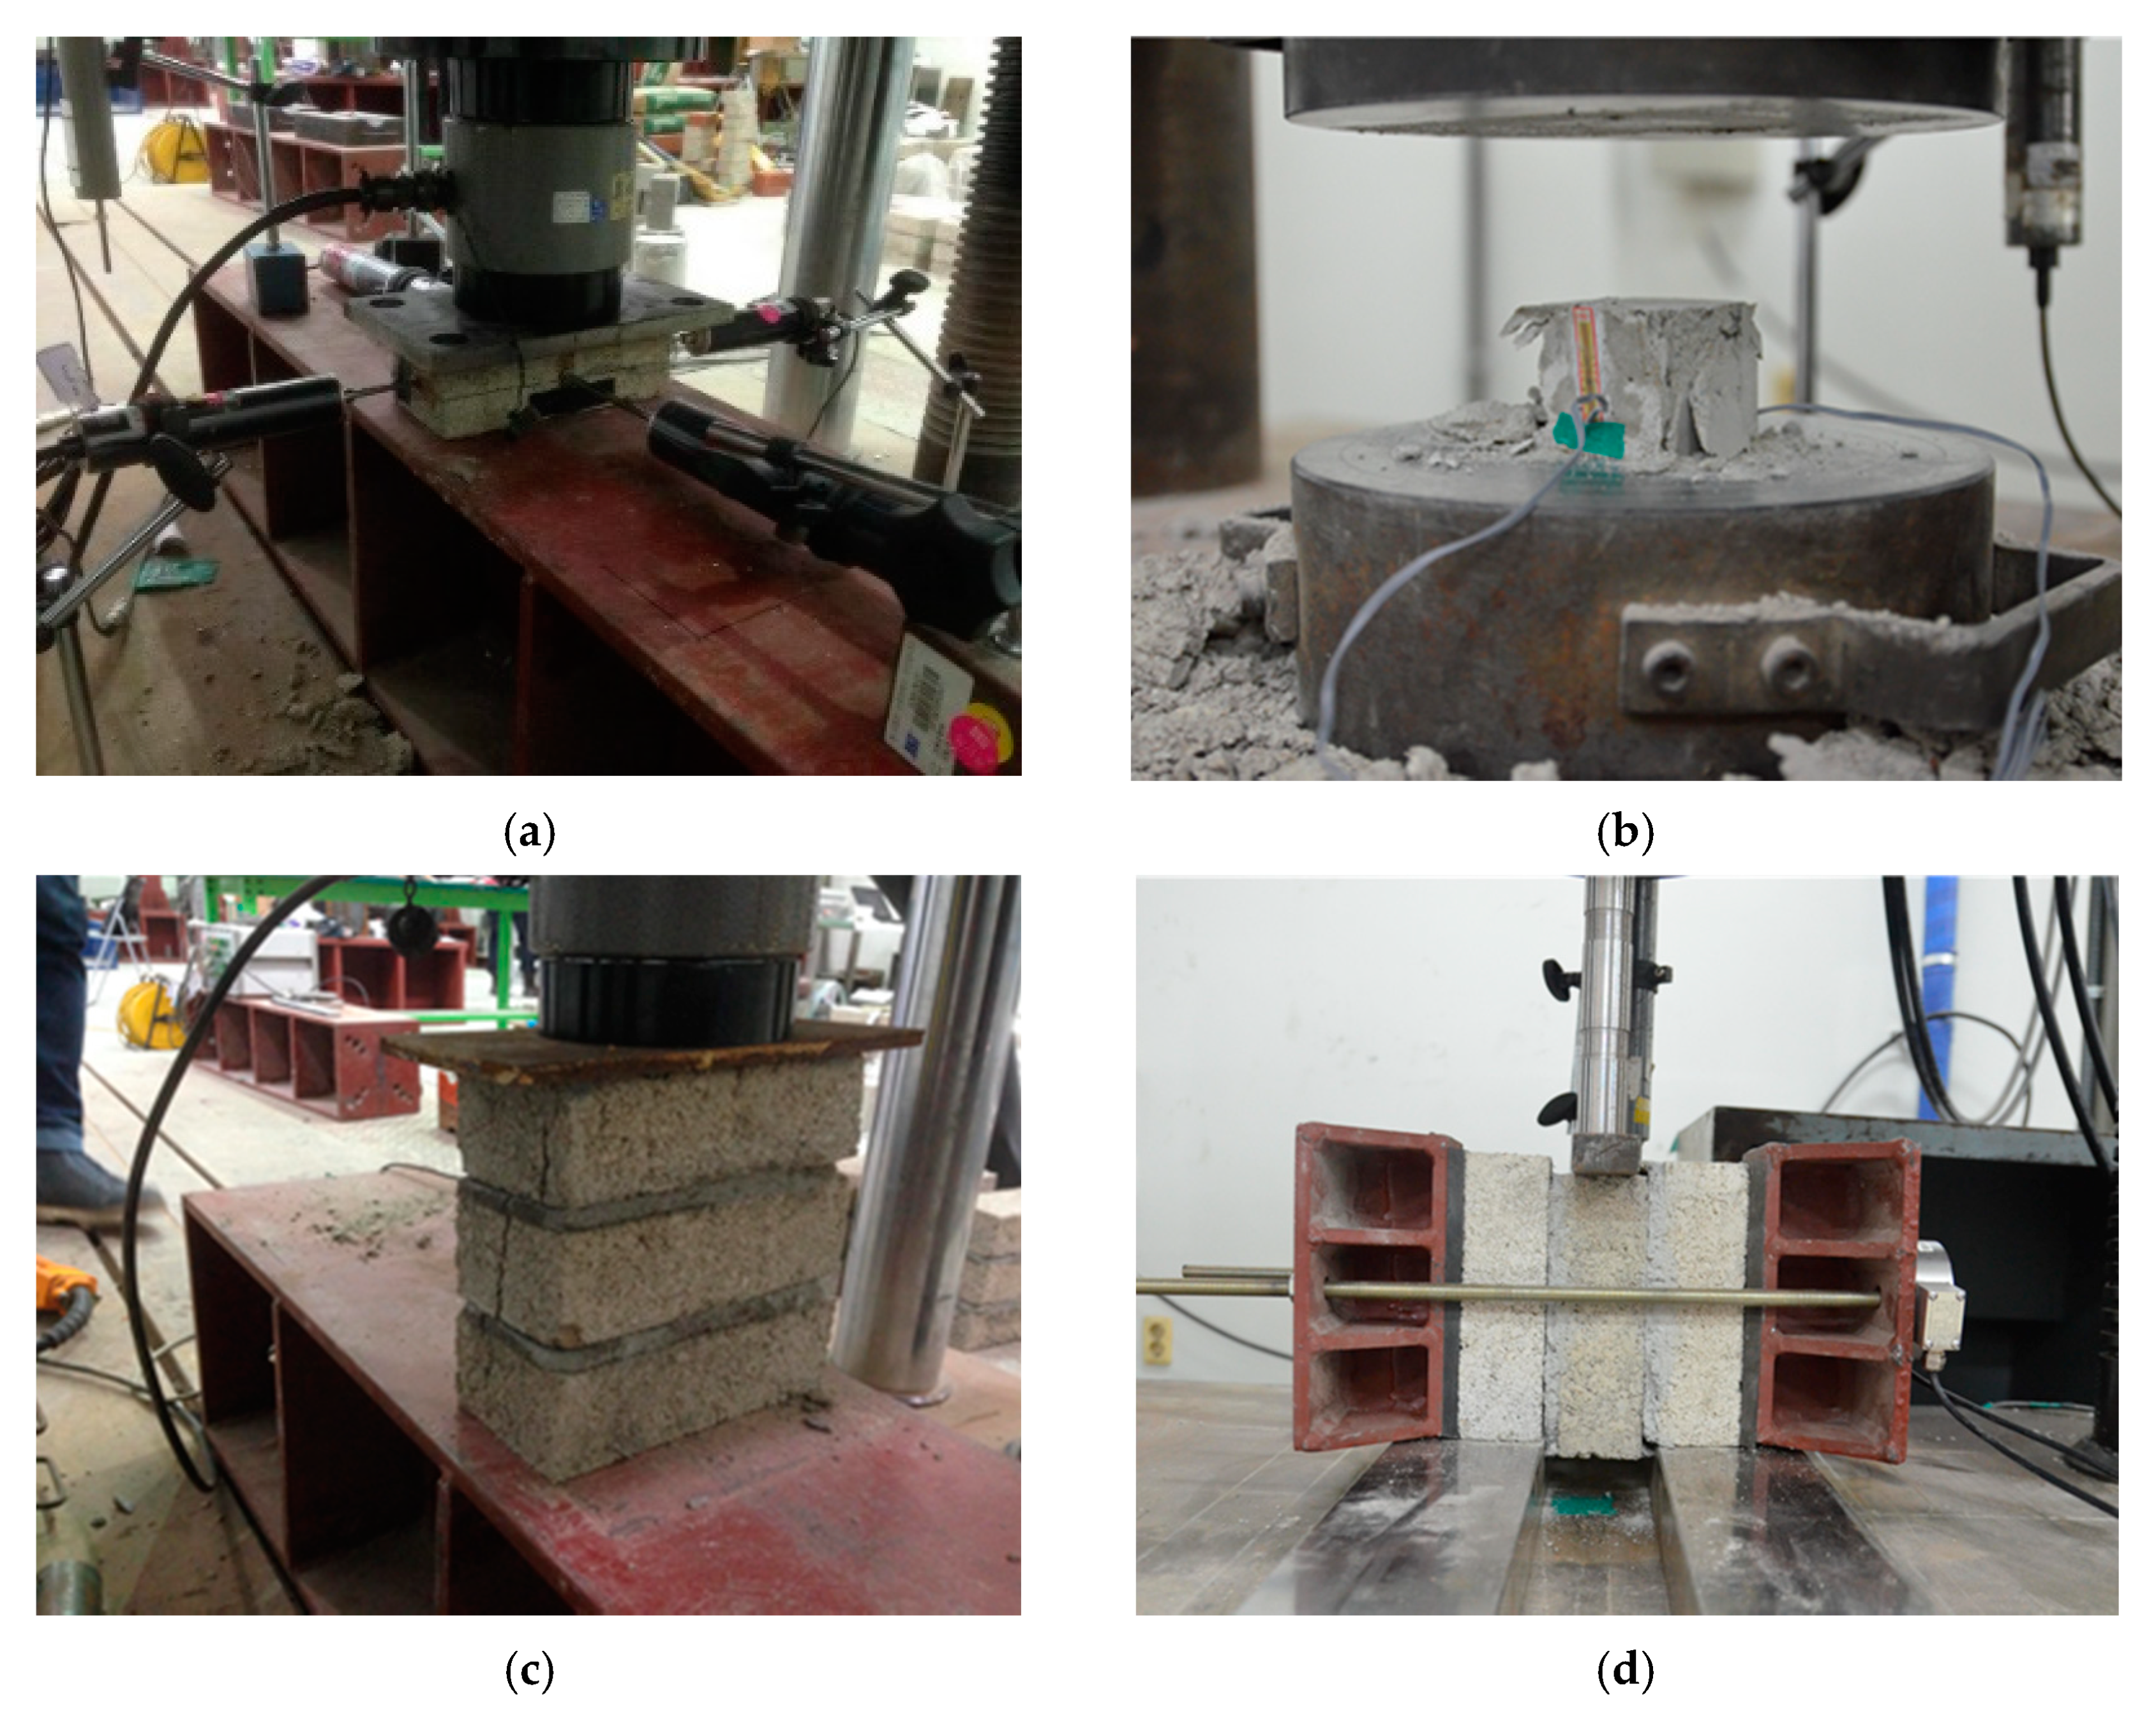
Various material tests were performed to identify the mechanical properties of concrete, reinforcing bars, and masonry. Figure 3 shows types of material tests for masonry. The compressive strength tests were performed on the masonry units (concrete bricks) and mortars, and the compressive strength and bond strength were tested on the masonry prism.
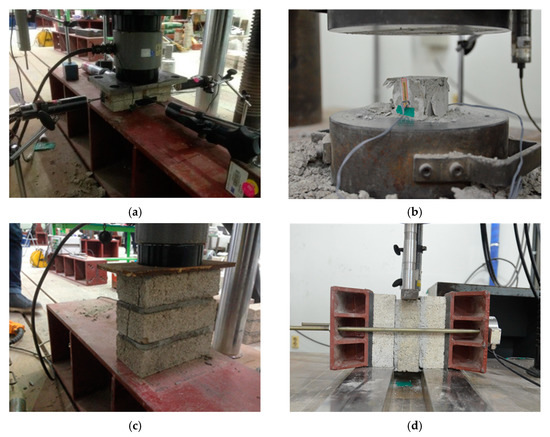
Figure 3.
Material tests for masonry. (a) Masonry unit compression test. (b) Mortar compression test. (c) Masonry prism compression test. (d) Initial shear strength test.
Table 2 summarizes the results of material tests and applied test standards. Originally, it was planned to use a D16 rebar of SD300 (with a nominal yield strength of 300 MPa) as the longitudinal rebar in all specimens. However, during the construction of the BF specimen, a D16 rebar of SD400 was used by mistake. Table 2 includes the yield strength of the rebars of both grades. For masonry, various material tests were performed. Figure 3a–c depicts the compressive strength test for the masonry unit, mortar, and masonry prism, respectively. The masonry unit is a commonly used solid concrete brick with dimensions of 190 × 90 × 56 mm. The mortar specimens are cubes with a volume of 50 mm3 according to ASTM C109 [26]. Figure 3d shows the bond strength test to determine the shear strength of masonry [27]. In this test, the loads that cause bond failure with the prestress of 0.1, 0.3, and 0.5 MPa, respectively, were obtained, and the bond stress and the friction coefficient were derived from the regression formula, as shown in Figure 4. The bond strength and friction coefficient were 0.462 and 1.564, respectively.
Table 2.
Material properties.
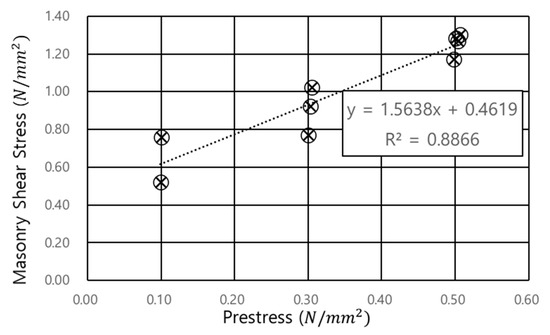
Figure 4.
Determination of bond strength and friction coefficient.
2.3. Test Setup
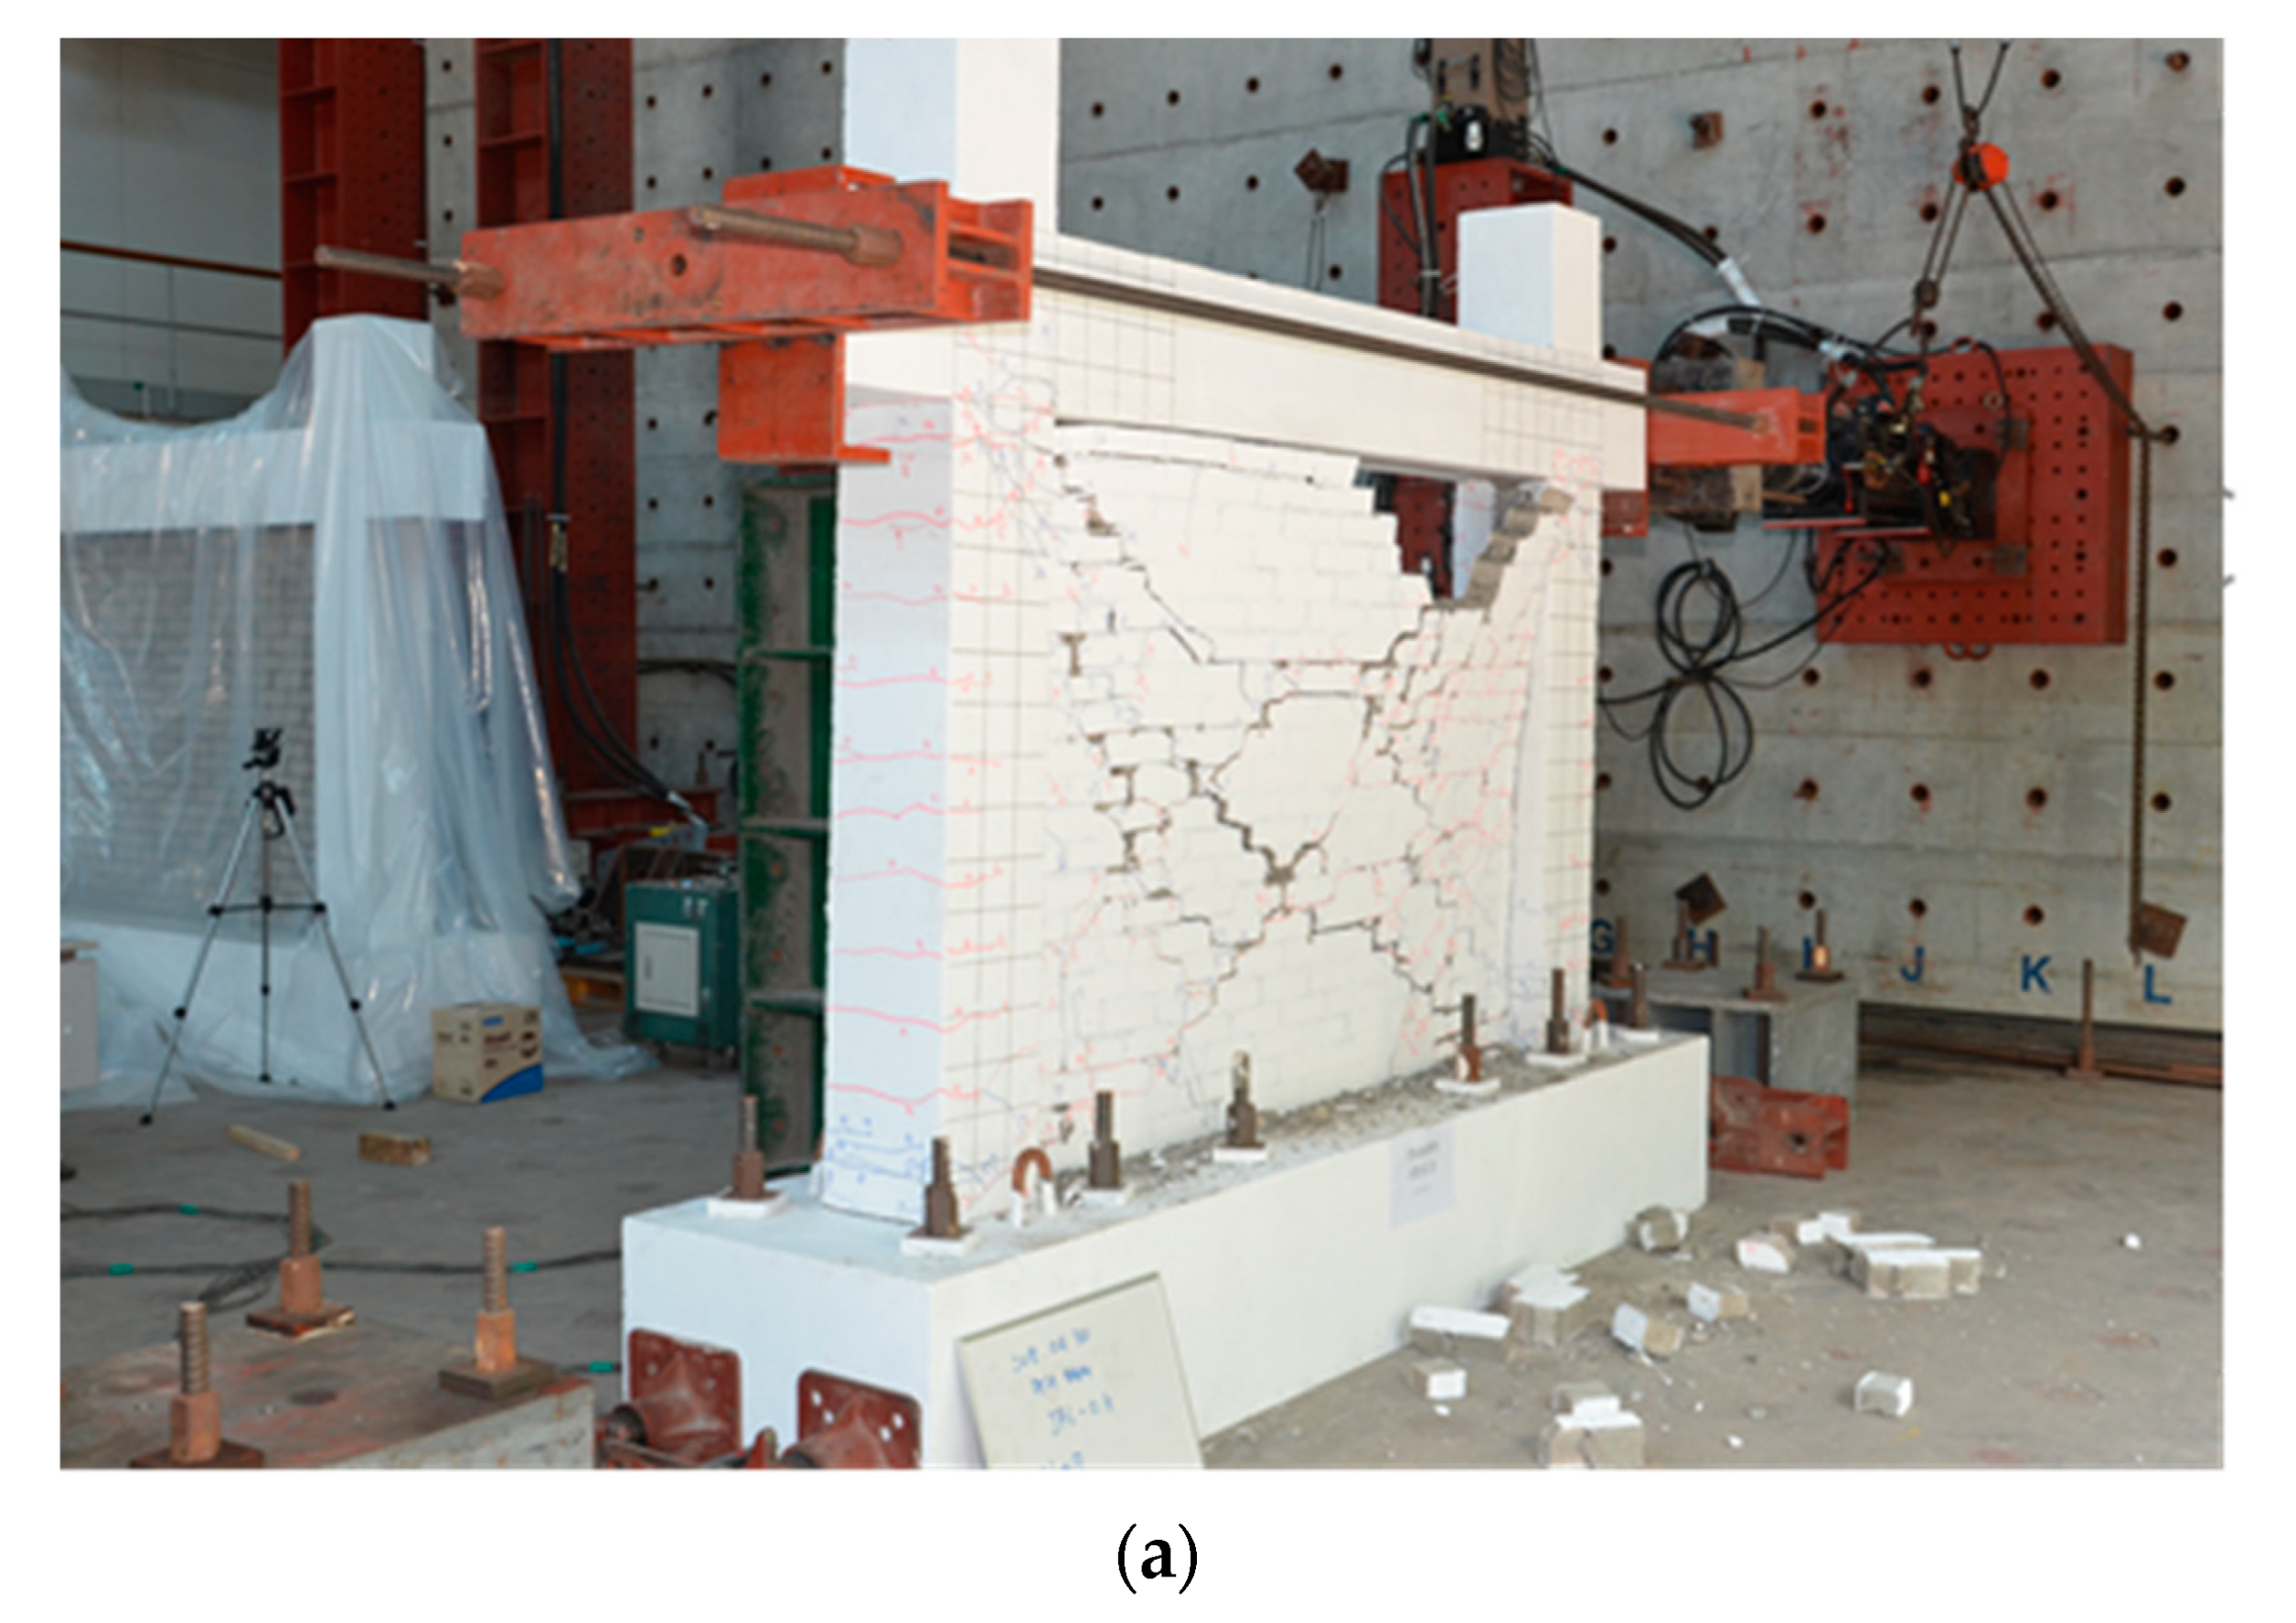
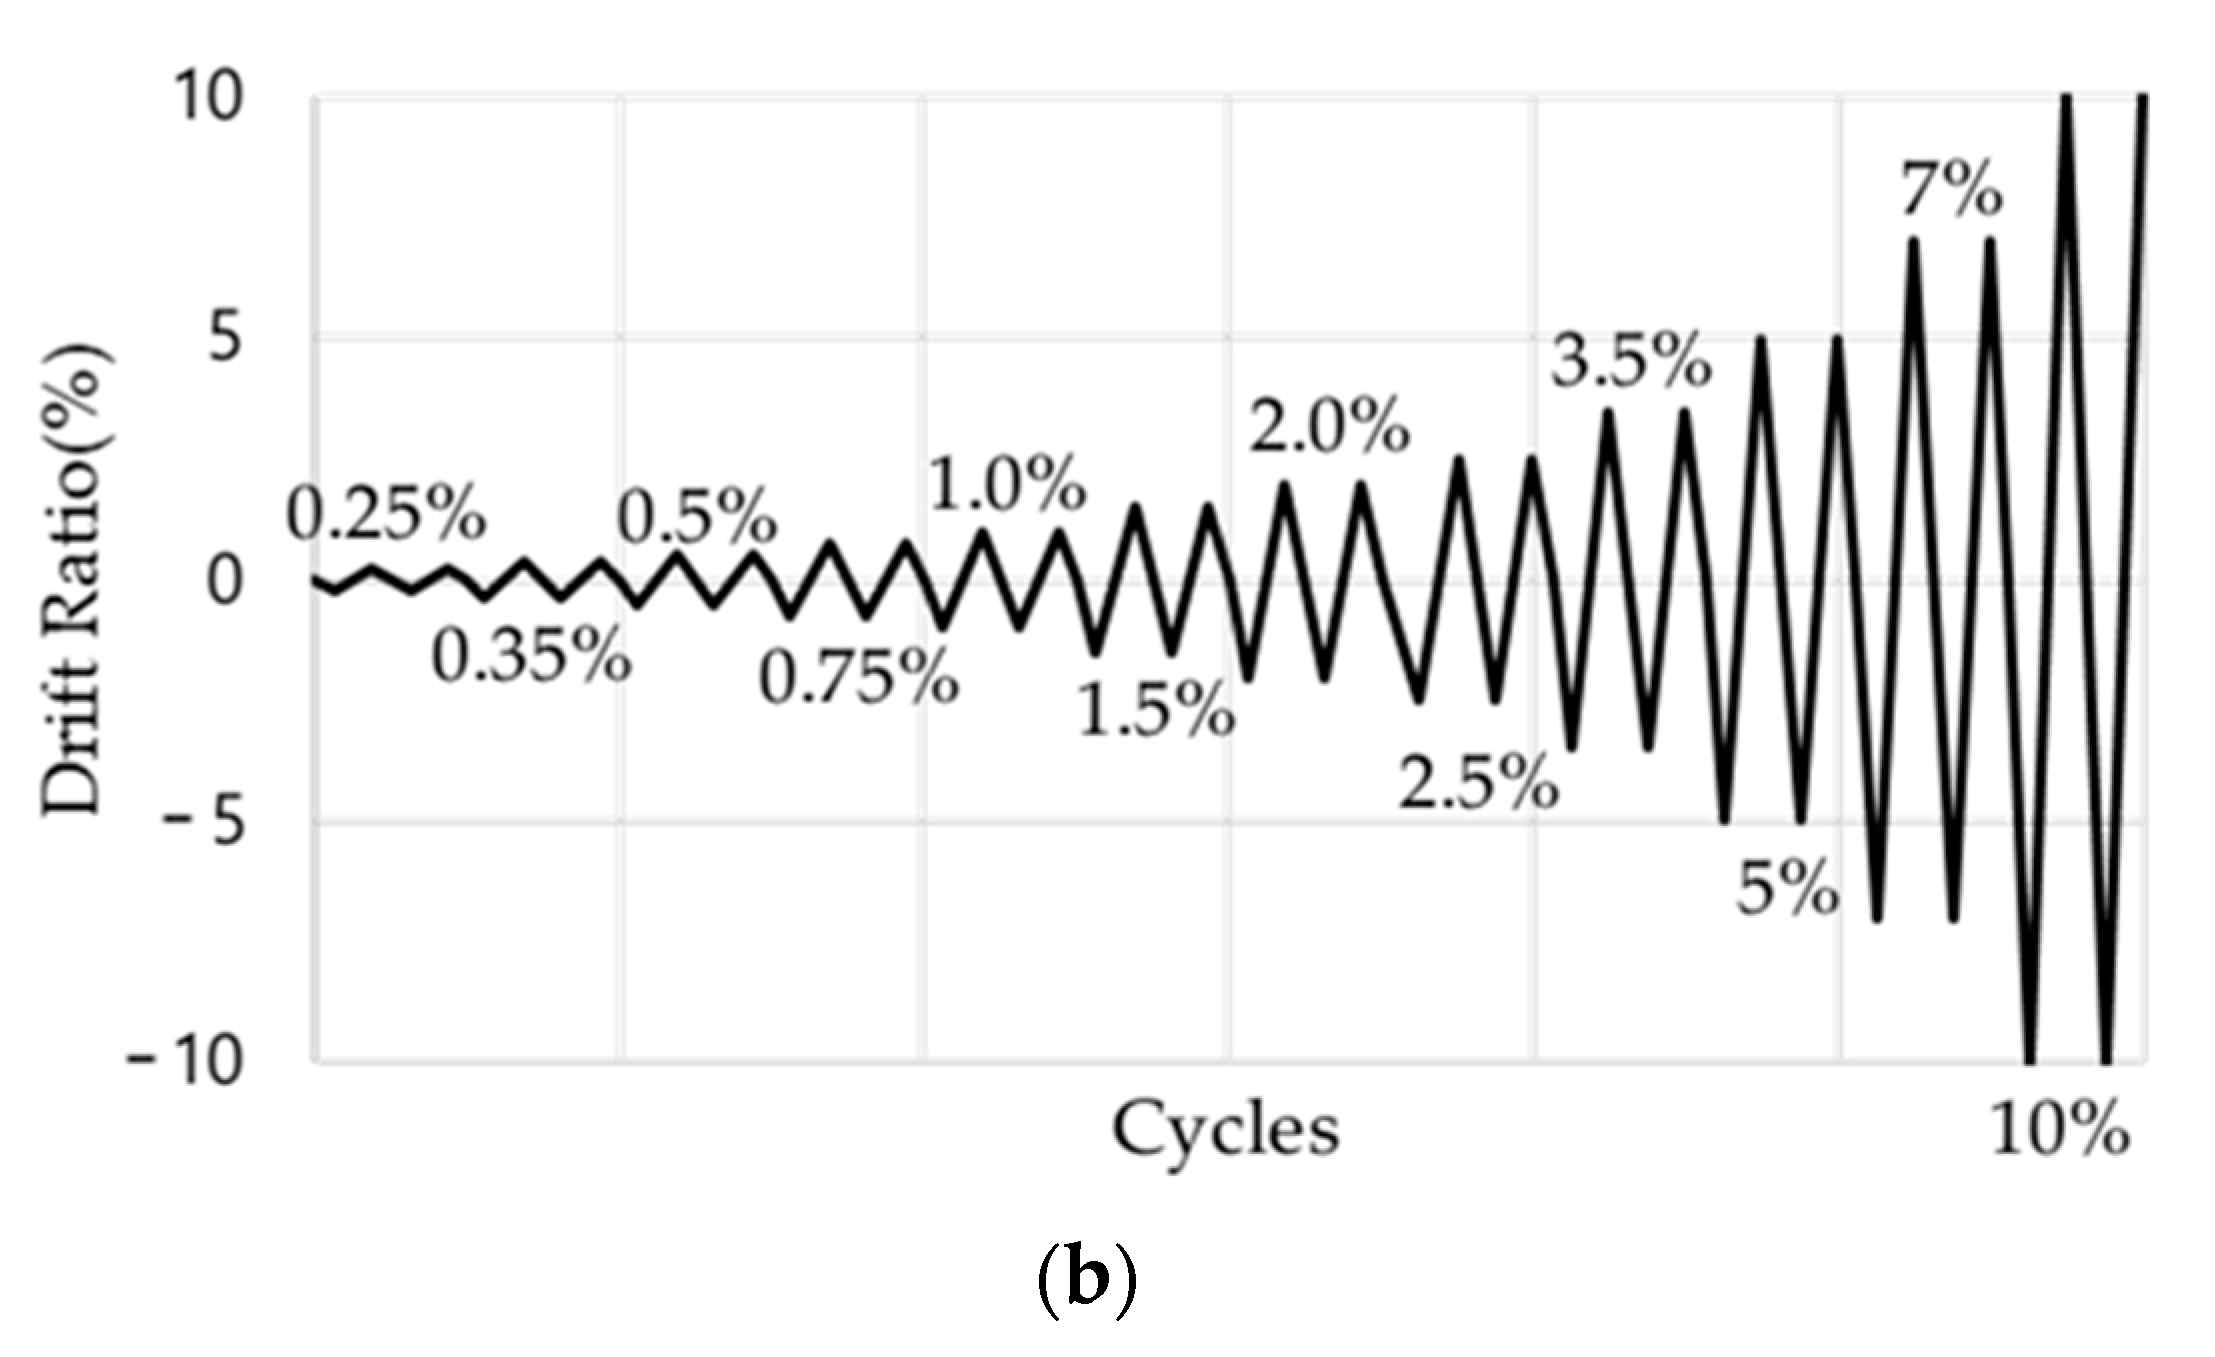
Figure 5a shows the setup for the test. A hydraulic actuator of 550 kN was used. In order to monitor the movement and deformation of the specimen, Linear Variable Differential Transformers (LVDTs) were installed at several locations on the specimen, including the center point of the upper beam and the side of the basement. Steel sections and bars were attached between the specimen top and the actuator head to enable reverse cyclic loading. The test was conducted using a loading protocol that repeats two cycles for each drift ratio, as shown in Figure 5b.


Figure 5.
Test setup and loading protocol. (a) Test setup. (b) Loading protocol.
3. Results of Cyclic Loading Tests
3.1. Crack Pattern and Failure Mode
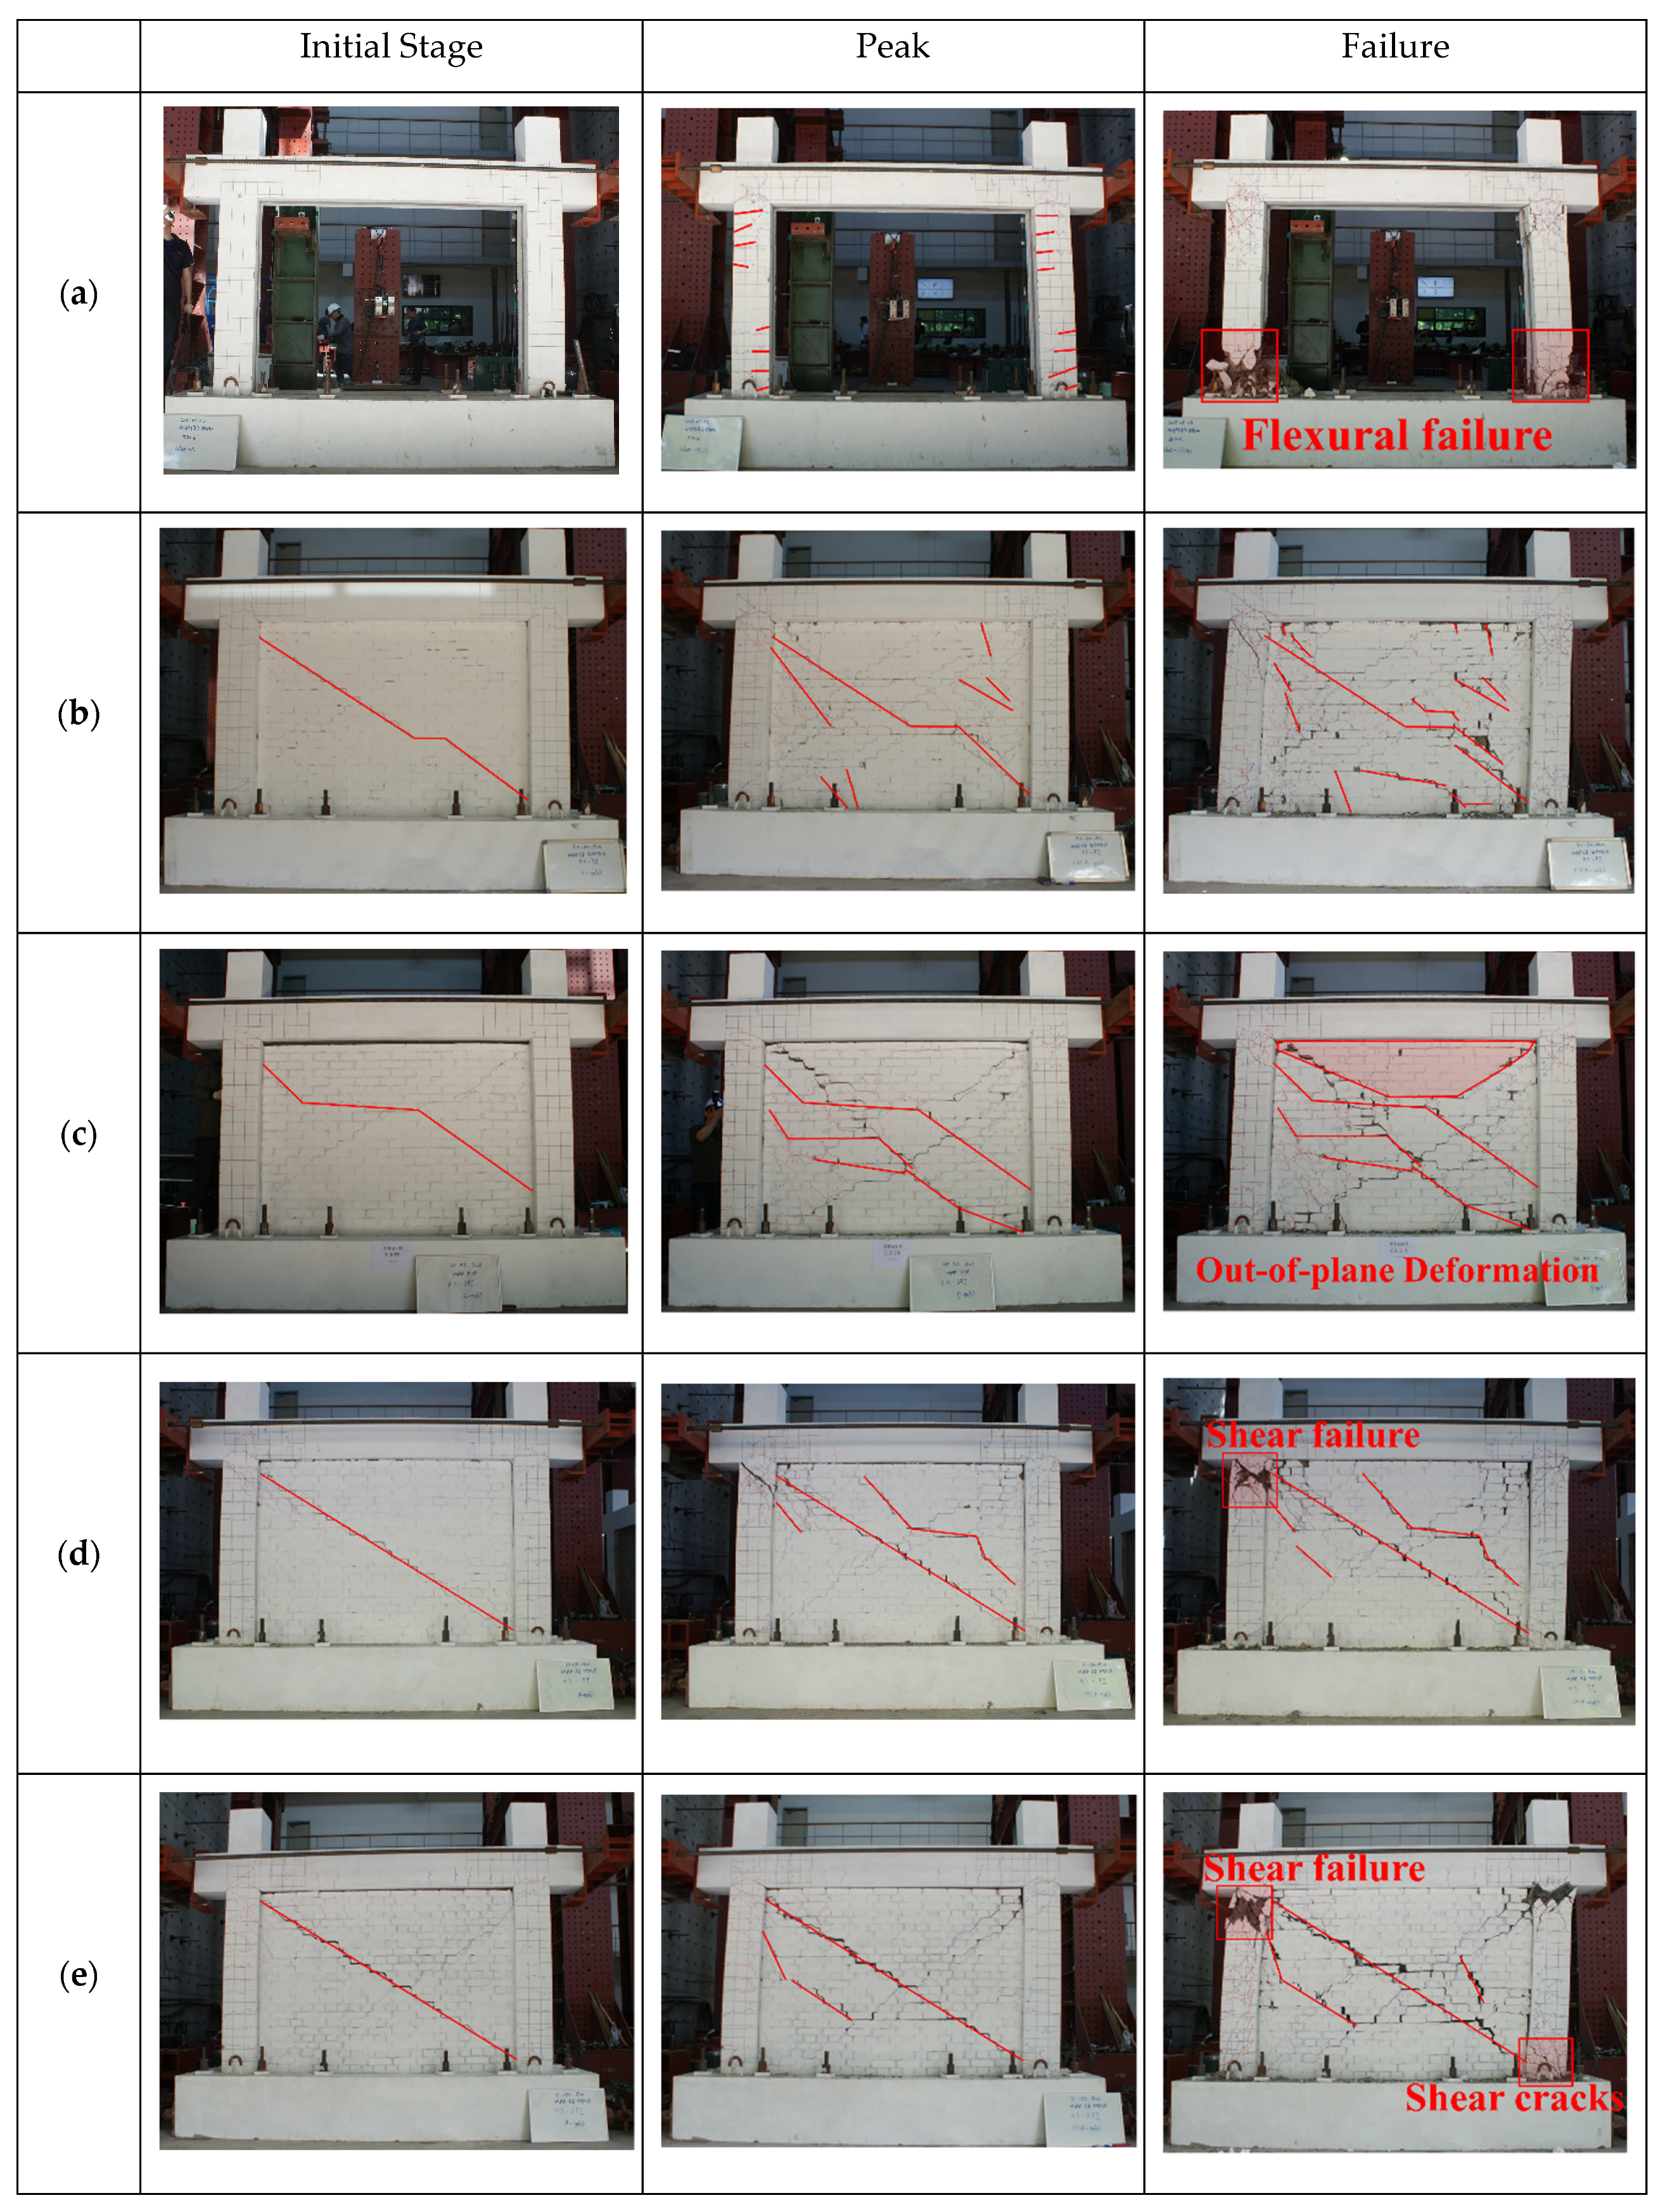
Figure 6 shows the crack patterns and failure modes of specimens. In specimens with masonry infills, the initial cracks occurred in the diagonal direction at the corners of the infill wall. In specimens with thin walls (IF-0.5 and IFS-0.5), the diagonal tensile cracks were combined with horizontal bed joint sliding cracks, while in specimens with thick walls (IF-1.0 and IFS-1.0), almost all cracks occurred only in the diagonal direction. In specimens without a gap (IF-0.5 and IF-1.0), after the occurrence of the main diagonal crack, a number of short cracks in the parallel direction appeared above and below the main diagonal crack. On the other hand, in specimens with a gap (IFS-0.5 and IFS-1.0), a short diagonal crack occurred only below the main diagonal crack. Additionally, in the case of IF-0.5 and IF-1.0, a number of cracks with various angles occurred at the corner of the infill wall, showing a more similar pattern of corner crushing failure compared to that of the specimen with a gap. In general, specimens without a gap have widespread but small cracks, whereas a small number of large cracks was observed in specimens with a gap.
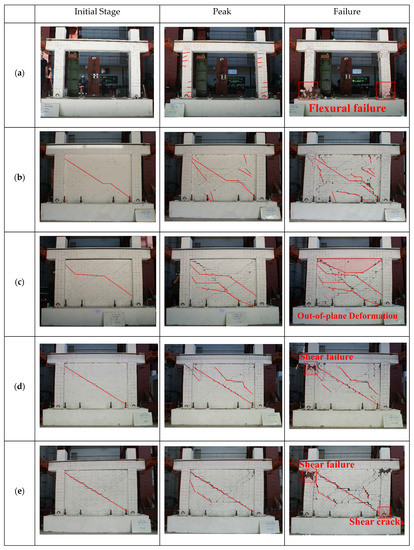
Figure 6.
Crack patterns and failure modes. (a) BF. (b) IF-0.5. (c) IFS-0.5. (d) IF-1.0. (e) IFS-1.0.
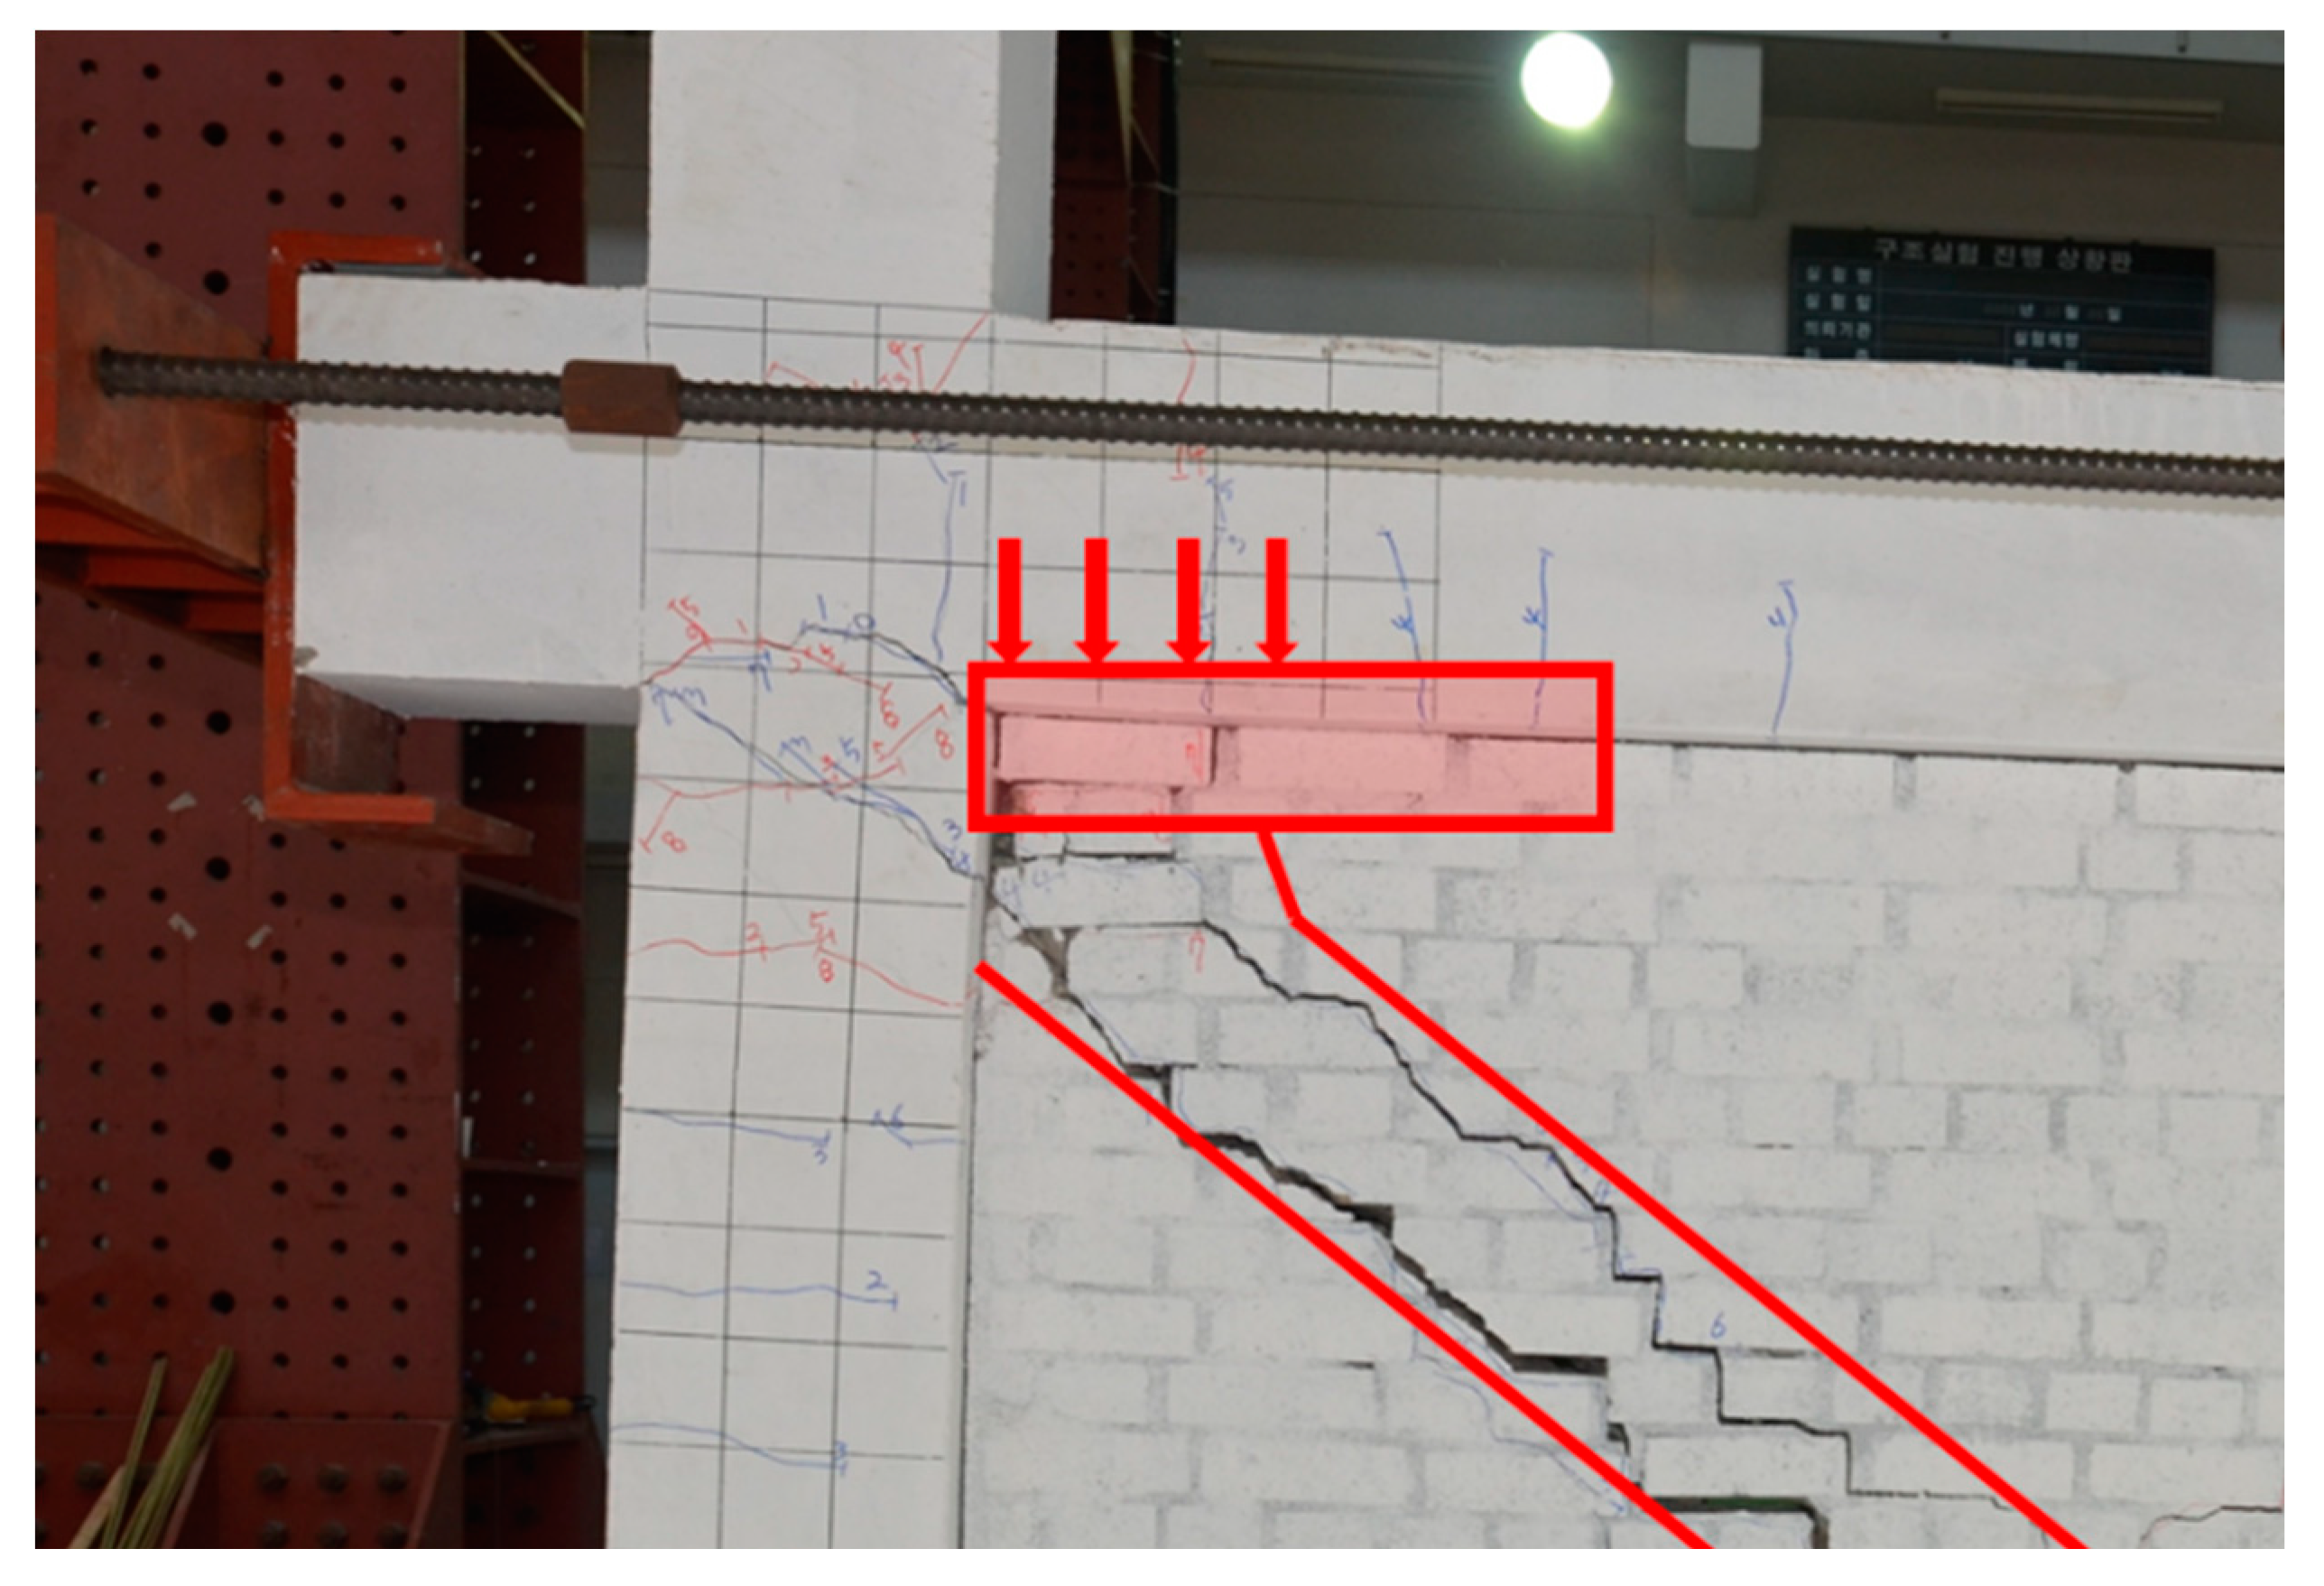
In all the specimens, the crack pattern in masonry walls indicates diagonal tensile failure combined with bed joint sliding cracks. In IF-0.5 and IFS-0.5, the tendency of bed joint sliding was high, whereas in IF-1.0 and IFS-1.0, the tendency of diagonal tensile crack was high. In IFS-0.5, at a drift angle of around 5%, lateral buckling occurred at the top of the masonry wall, resulting in a drop-off in the out-of-plane direction. This is seemingly because the top boundary of the masonry wall was not constrained properly. The length-to-thickness ratio, , of the masonry wall in IFS-0.5 was 24.4 (2200/90). In IFS-1.0 with of 2200/190 = 11.6, out-of-plane buckling was not observed. Additionally, in IFS-1.0, the gap between the bottom of the beam and the top of the masonry started to decrease as the drift ratio increased and eventually closed, probably due to the curvature shortening of columns. Figure 7 shows the gap closure due to lateral displacement.

Figure 7.
Gap closure due to lateral displacement (IFS-1.0).
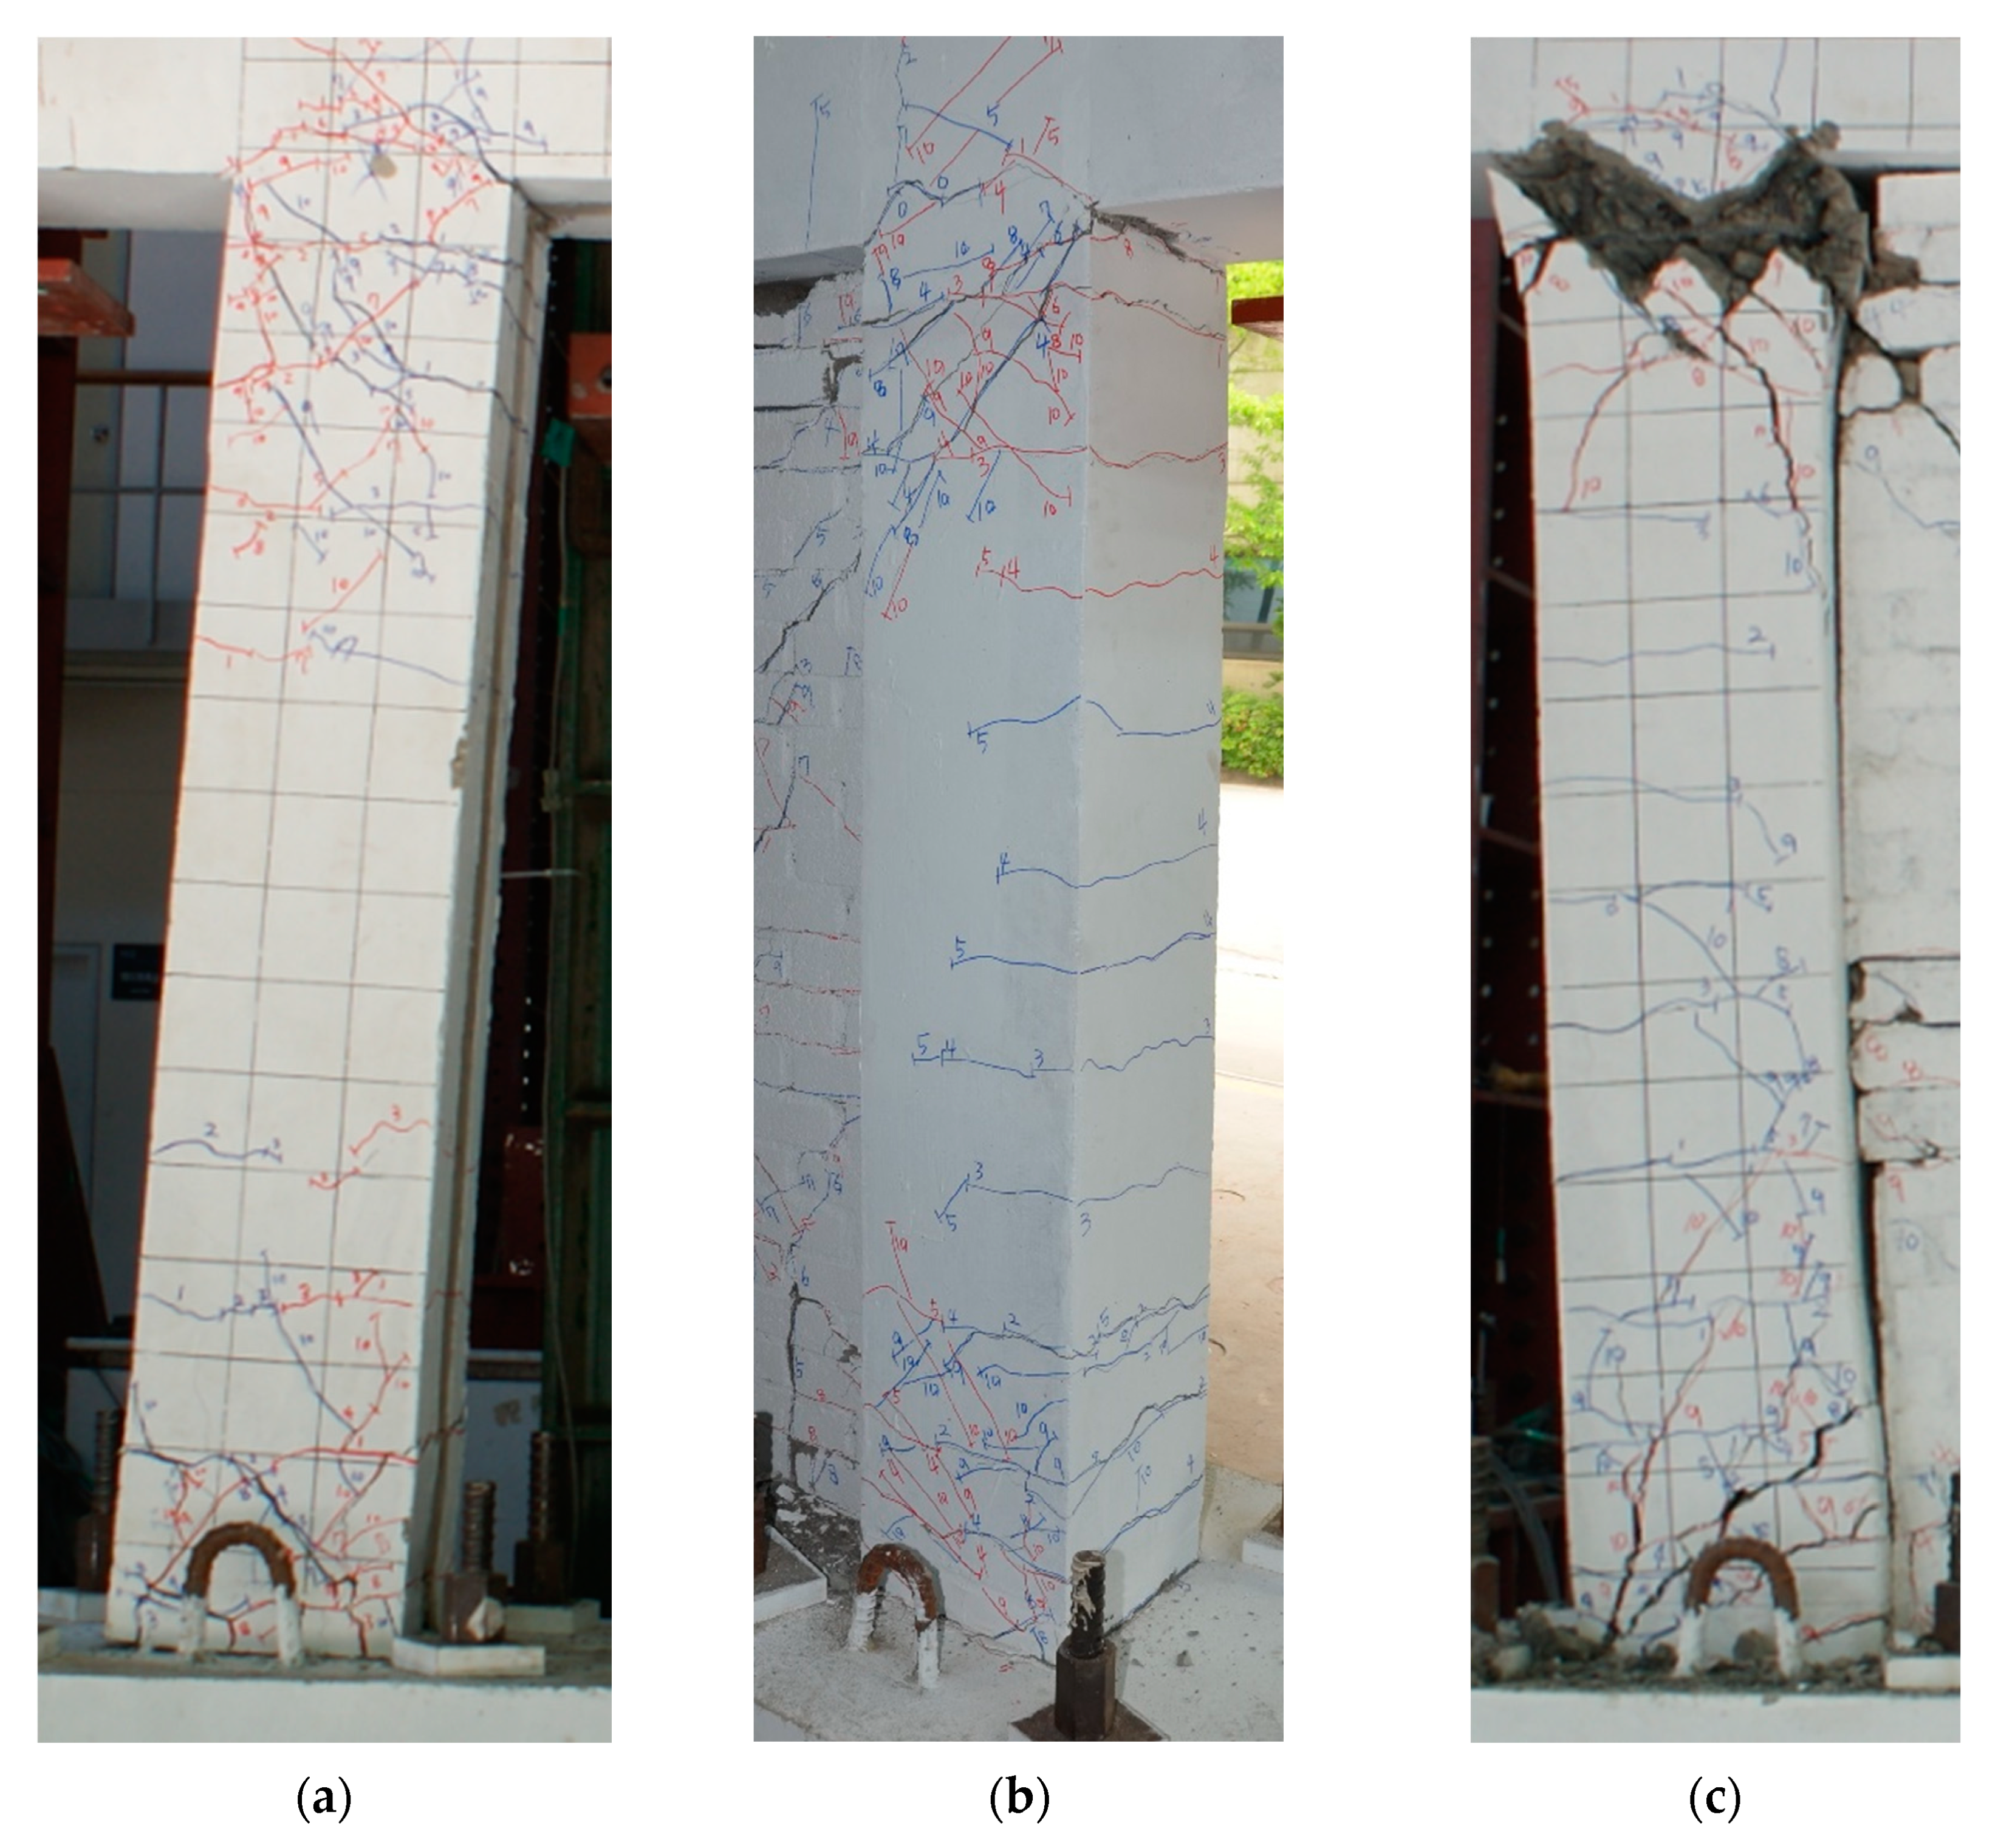
In the IF-0.5 specimen, the final failure of the frame was presumed to be ‘shear failure after flexural yielding’, in which yielding in flexure precedes shear failure. In the IF-1.0 and IFS-1.0 specimens, a large diagonal crack developed at the end of the column. In all specimens, the test was terminated due to the spalling of cover concrete and detachment of transverse reinforcements, followed by the buckling of longitudinal rebars. Figure 8 shows the failure of columns.

Figure 8.
Failure of columns. (a) BF, (b) IF-0.5, (c) IF-1.0.
3.2. Load–Displacement Relationship
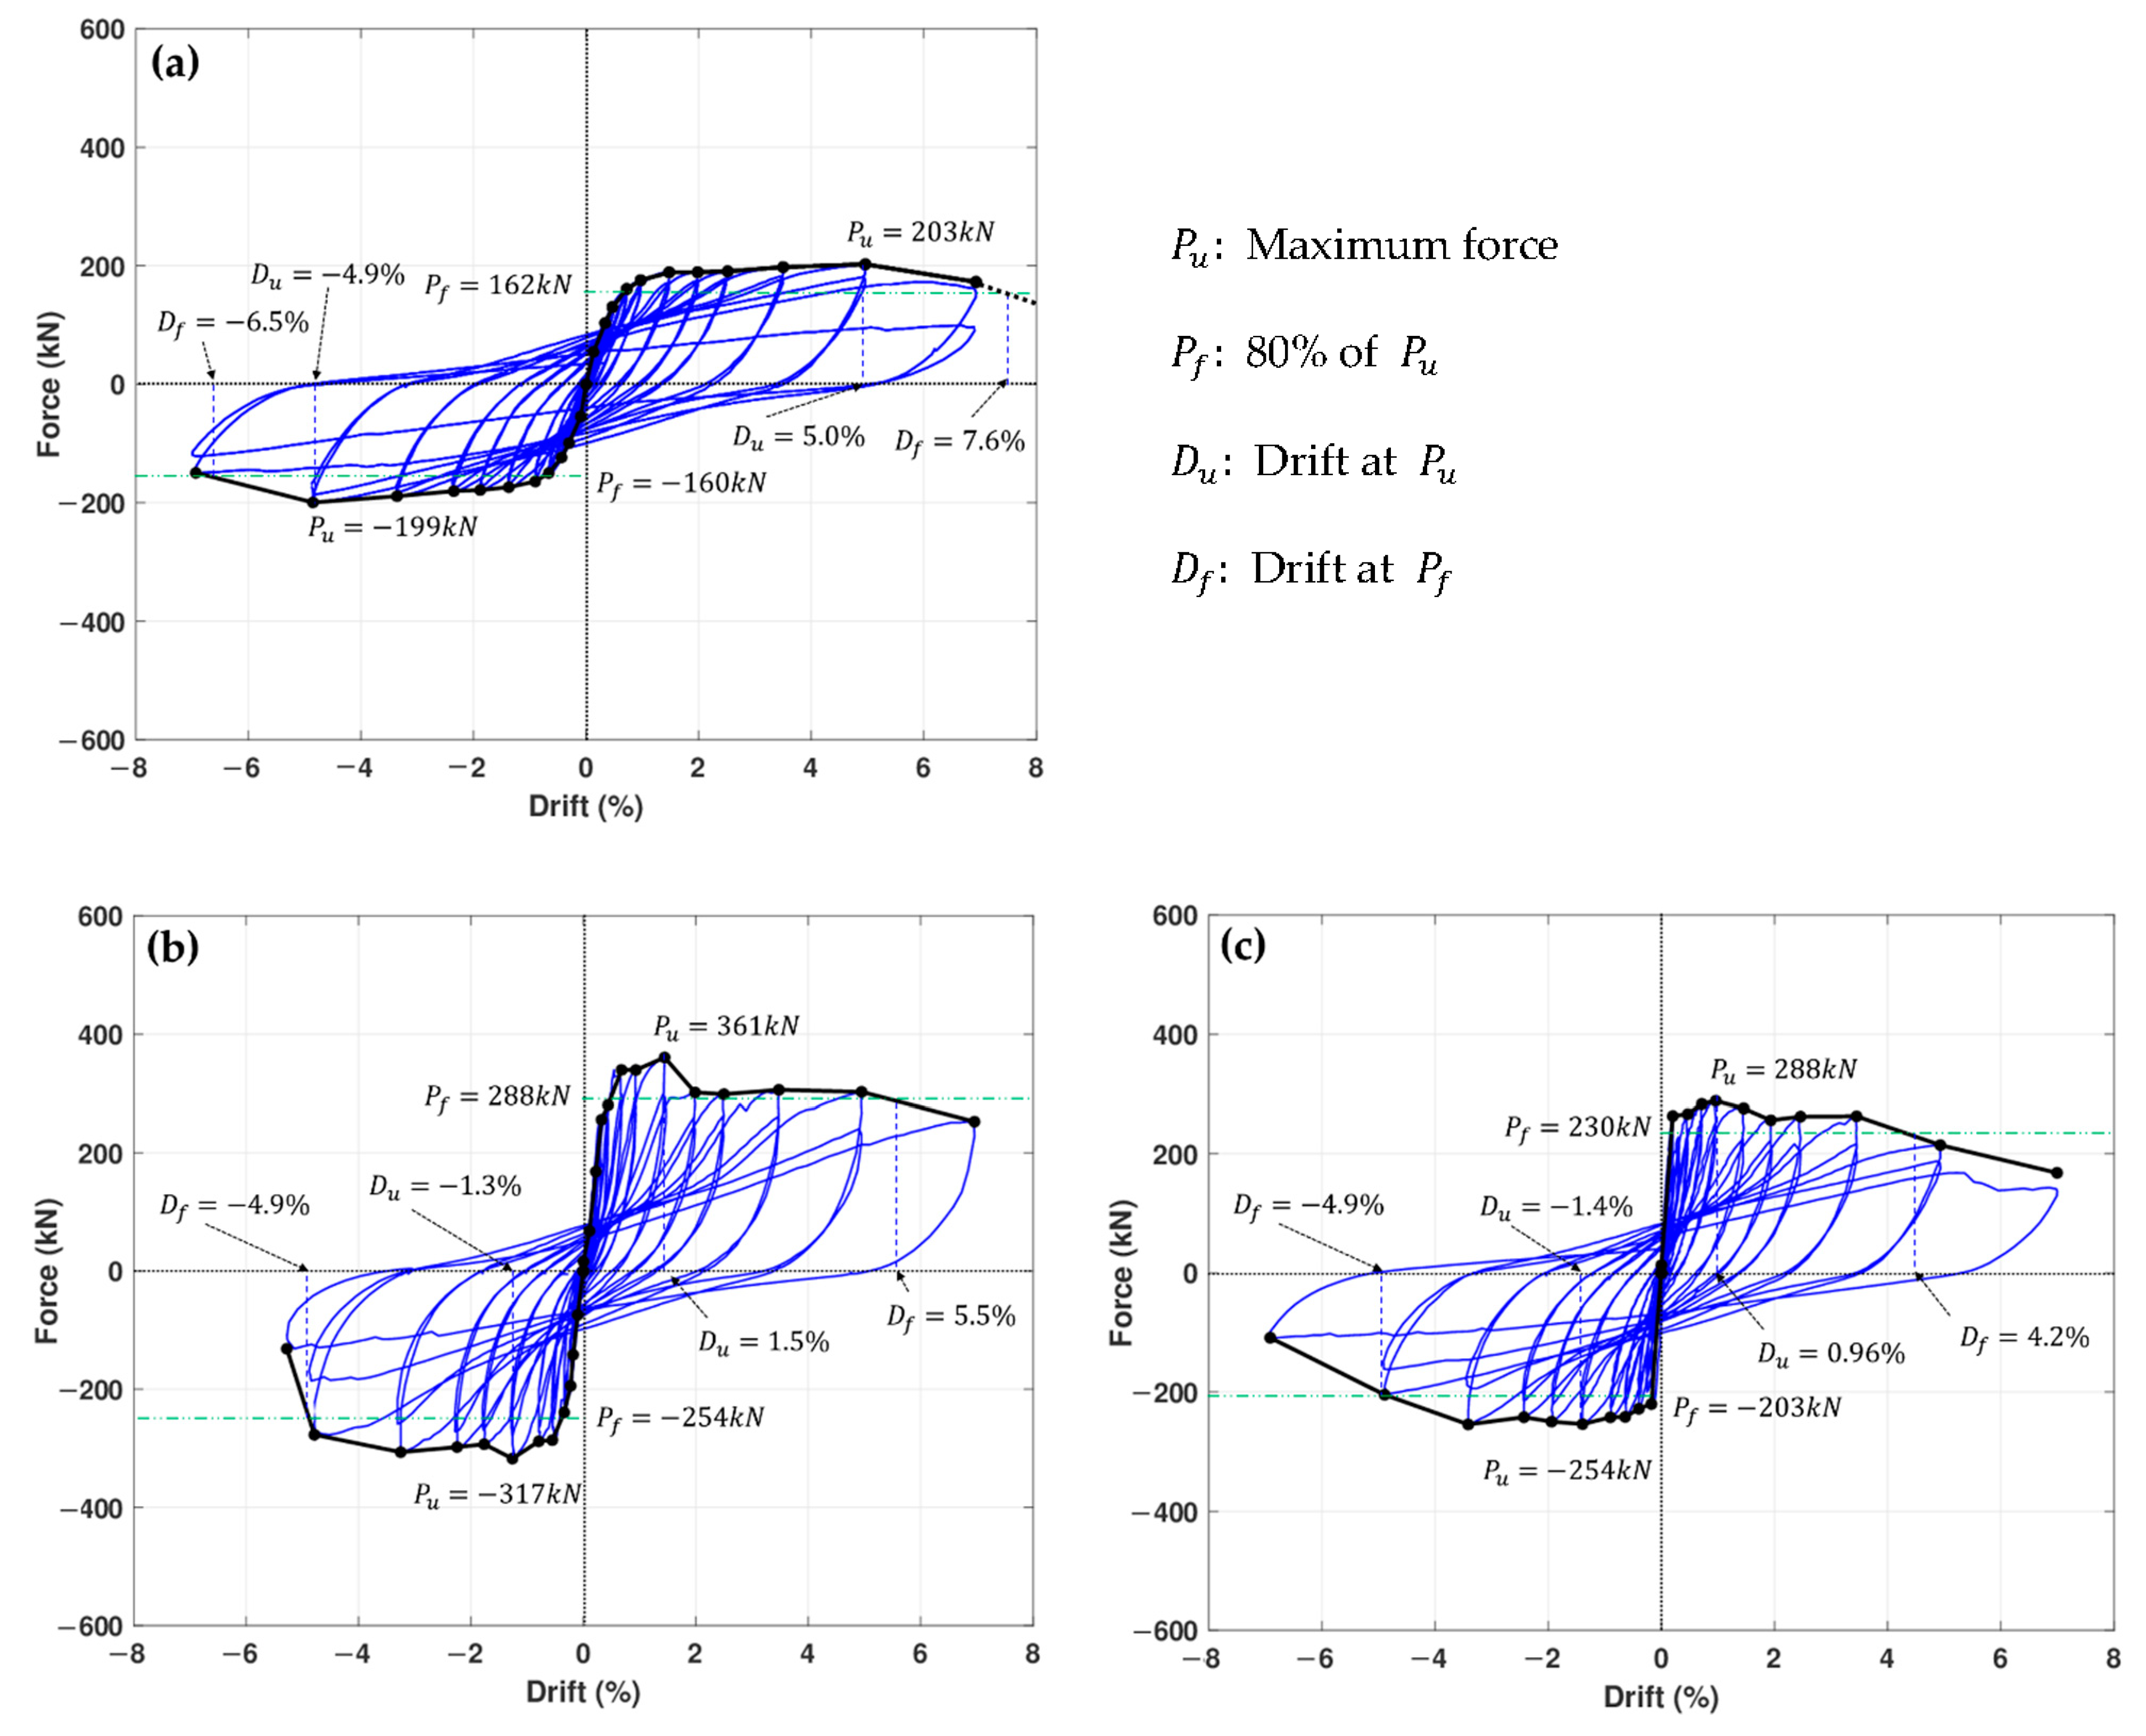
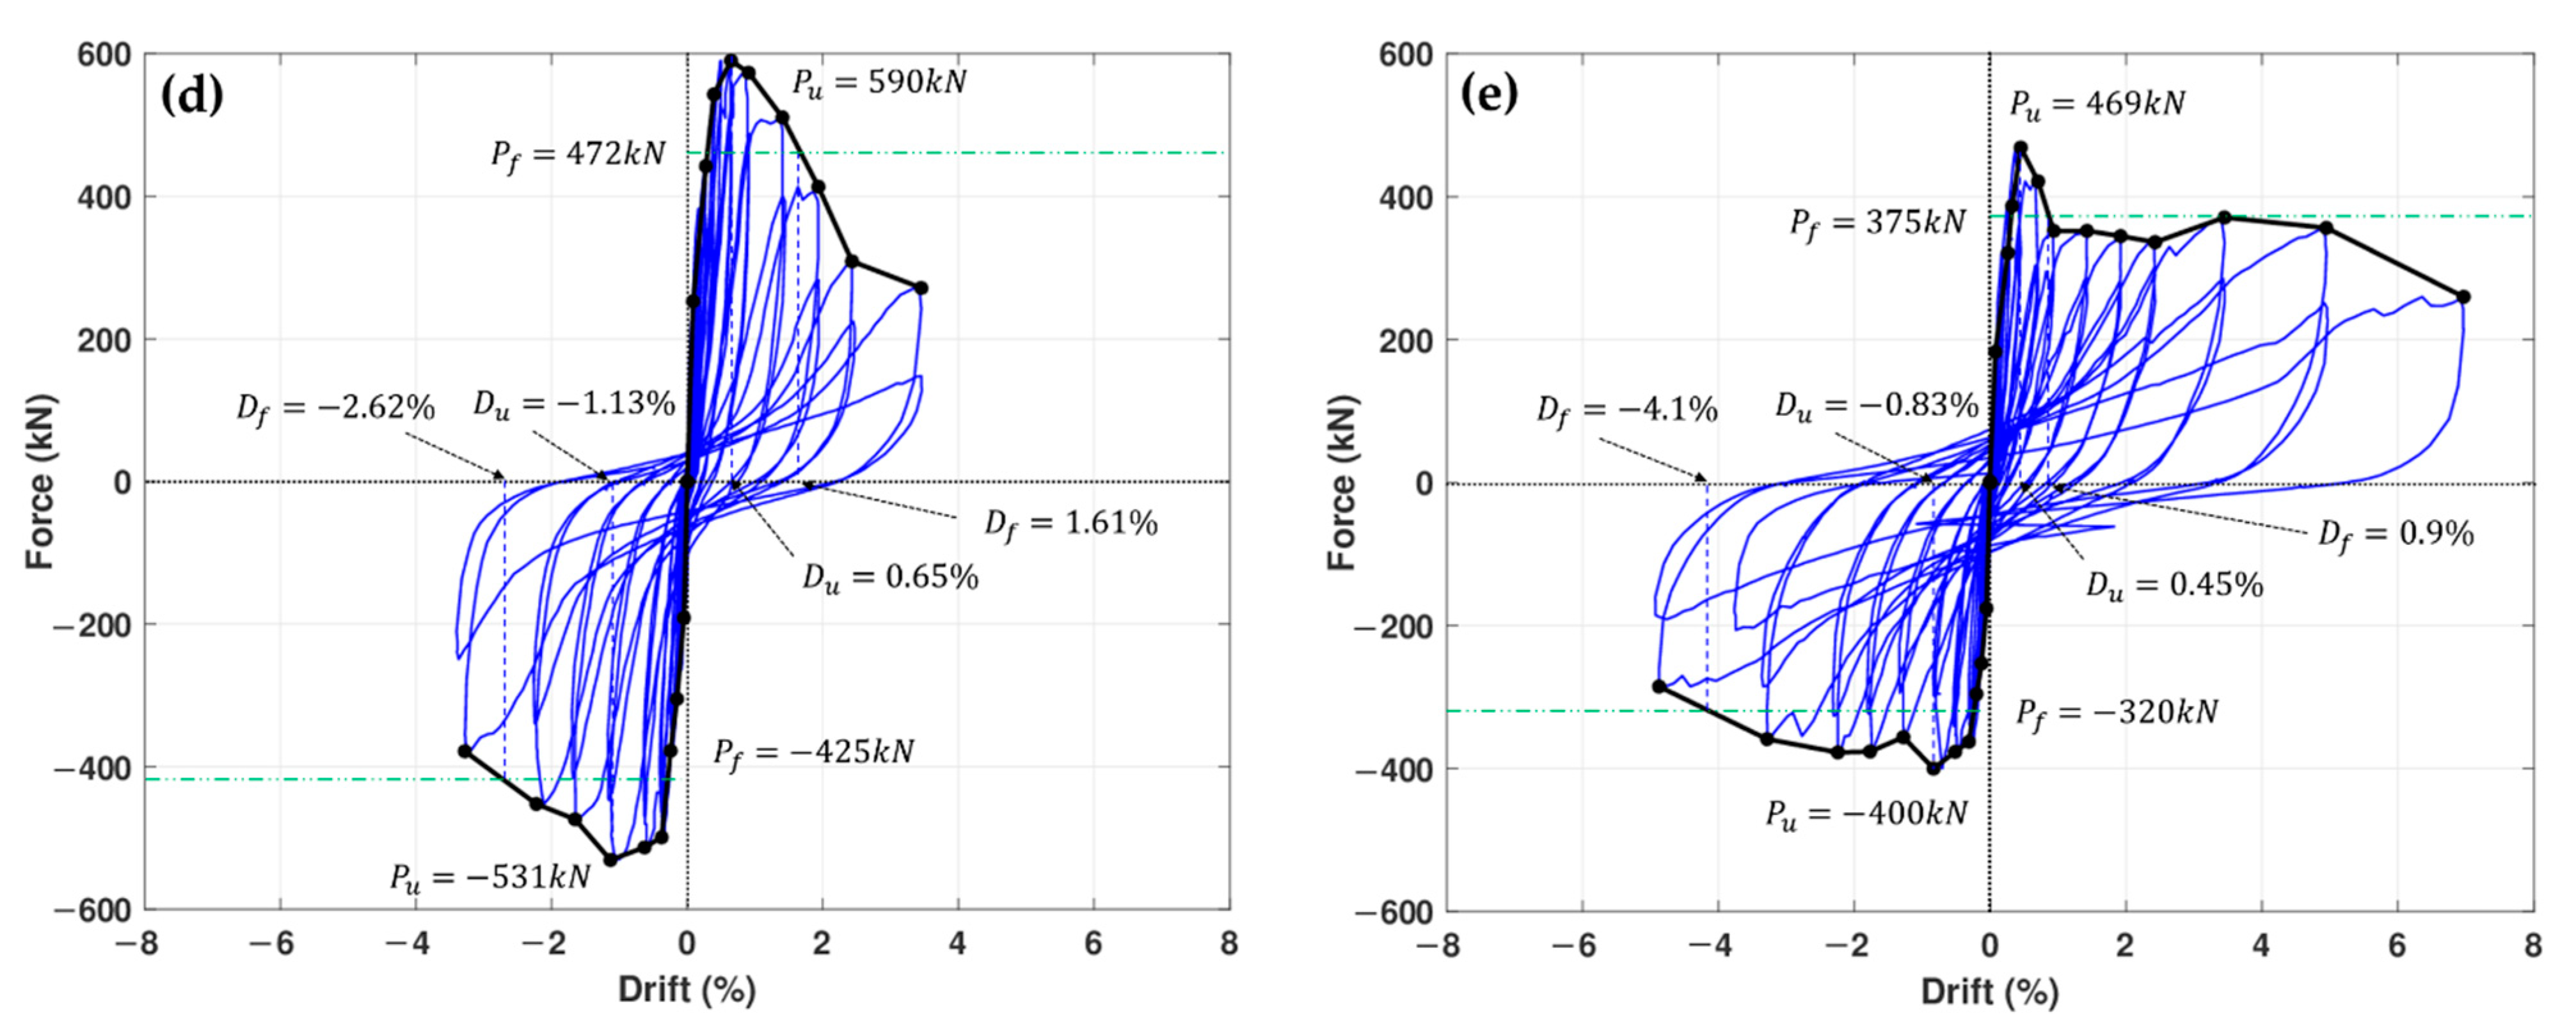
Figure 9 shows the graphs of the load–displacement relationship of each specimen. In BF, flexure failure occurred. The maximum force in the positive and negative directions was 203 and −199 kN, respectively, which are similar to each other. Additionally, the maximum drifts, defined as the drift when the force decreased to 80% of the maximum force, were 5% and 4.9% in the positive and the negative directions, respectively.

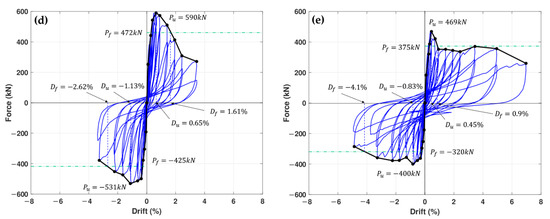
Figure 9.
Force vs. drift curves. (a) BF. (b) IF-0.5. (c) IFS-0.5. (d) IF-1.0. (e) IFS-1.0.
The maximum strength was very close to the analytical prediction made by Equation (1). The obtained using the actual yield strength of SD400 rebar (430.2 MPa) was 102.6 kN, which is lower than the shear strength of the column section (175.3 kN). Thus, we could expect that flexural failure would occur. The lateral strength of the frame was expected as 102.6 2 = 205.2 kN, which is very close to the actual maximum strength.
where represents the lateral strength of the frame at failure due to plastic hinge formulation at both ends of the columns, is the plastic moment capacity of the section, and is the column height.
Compared to BF, the maximum forces of masonry-infilled frames were increased, but the deformation capacity was decreased. As expected, the maximum force was highest in IF-1.0 and lowest in IFS-0.5. Table 3 shows the maximum force and maximum displacement of each specimen and the strength ratio between the specimens with and without a gap. Specimens with gaps had a strength of 75% to 80% of specimens without gaps. In addition, the difference between the maximum force in the positive and negative directions was large compared with BF. This is likely due to residual strain in the masonry infills accumulated from low drift ratios.
Table 3.
Maximum force and corresponding drift.
The specimens with double wythe masonry walls had lower deformation capacity than those of single wythe specimens. In other words, the higher the strength ratio of masonry compared to the frame, the lower the deformation capacity. This is consistent with the suggestion of ASCE 41 [25] for lower deformation capacity for the nonlinear modeling parameter of compression strut at a low value of , the strength ratio between the frame and the masonry infill (/). The specimen with a gap exhibited a lower deformation capacity than the specimen without a gap. This is thought to be due to the fact that the masonry in a specimen with a gap was not constrained, and thus fracture strain would be low.
Effective stiffness can represent the load–displacement relationship of the specimen and is calculated using Equation (2). Table 4 shows the effective stiffness of all specimens calculated for each drift ratio.
where is the effective stiffness; and indicate the peak force and displacement, respectively, for the considered drift ratio; and superscript () and () indicate the positive and negative directions, respectively.
Table 4.
Effective stiffness estimated from the test results.
Table 3 and Table 4 show that, compared to specimens without a gap, the specimens with a gap had 75% to 80% lower maximum strength and 55% to 70% lower effective stiffness. These results are comparable with those of a previous study by Dawe and Seah [15], in which the initial stiffness decreased by 60% and the maximum yield strength decreased by 62%. The effective stiffness of IF-0.5 at a 0.1% drift ratio is very low compared with the stiffness of other specimens. This is most likely due to the slippage at the beginning of loading.
4. Maximum Strength of Masonry-Infilled Frames
4.1. Strength of Masonry Infills
In ASCE 41 [25], which is a representative standard used for the seismic performance evaluation of buildings, the shear strength of masonry was defined as the sum of cohesion and friction.
where is the friction coefficient, is the horizontal cross-sectional area of an infill, and is cohesion of the brick–mortar interface, which is equal to the shear strength when no axial stress is applied. is the axial load supported by the infill caused by gravity distributed between the infill and the columns based on their relative axial stiffnesses assuming full contact between the infill and the beams.
In the case of the specimen in this paper, was ignored as the masonry wall was constructed after the frame was completed so that no vertical load was applied. Therefore, the strength of the masonry wall is determined by the cohesion only. The strength of the specimen calculated using only the adhesive strength obtained through material testing is 270.3 kN for single wythe and 371.9 kN for double wythe. Table 5 shows a comparison between the calculated strength and the strength from the tests. It can be seen that the prediction for IFS-0.5, which has a single wythe wall with a gap, was accurate, but predictions for the rest of the specimens were underestimated. This result implies that frictional force should be considered.
Table 5.
Prediction of maximum force by ASCE 41.
In FEMA 306 [24], the masonry shear strength is described as the sum of the bond strength between the masonry unit and the mortar, and the frictional force, which is the product of the friction coefficient and normal stress applied to the masonry, as shown in Equation (4). Here, the normal stress can be calculated from the curvature shortening associated with lateral displacement of the frame, as shown in Equation (5).
where is the friction coefficient, is the modulus of elasticity of the masonry, and is the rotation angle of the column in radians.
Therefore, the shear force carried by the masonry infill wall can be estimated by multiplying the shear strength by the area of the masonry, as shown in Equation (6). However, if there is a gap, no normal force can be developed by curvature shortening, and the shear strength of the masonry depends on bonding strength only.
As shown in Figure 4, the shear strength of masonry of 0.462 MPa and the friction coefficient of 1.564 were obtained from the material test. To obtain the frictional force, the normal stress was calculated via Equation (5) using the rotation angle when the specimen exhibits the maximum lateral force ( in Figure 9). However, in the case of IF-0.5, the difference between the maximum strength of the first cycle and that of the second cycle at 1.5% drift was very large, as shown in Figure 9b. It was observed that the maximum strength was reached before the 1.5% drift; thus, a drift angle of 1.0% was used for the estimation of the normal force.
Table 6 shows the predicted strength for each specimen. The values of are the sum of the predicted strength masonry infill () and expected lateral strength of the frame when flexural failure occurs at both columns (2) using an actual yield strength of a SD300 rebar (367.6 MPa; see Table 2). A lateral load of 89.4 kN for a column was obtained from the calculation using Equation (1).
Table 6.
Prediction of maximum force based on masonry shear force and flexural yielding of the frame.
In IF-0.5 and IFS-0.5, in which single wythe masonry walls were used, the predicted values in Table 6 are very close to the test results. However, for IF1.0 and IFS-1.0, in which the double wythe masonry wall was used, the predictions underestimate the test results by 79% to 93%.
4.2. Frame Strength Accounting for Interaction with the Masonry Infill Wall
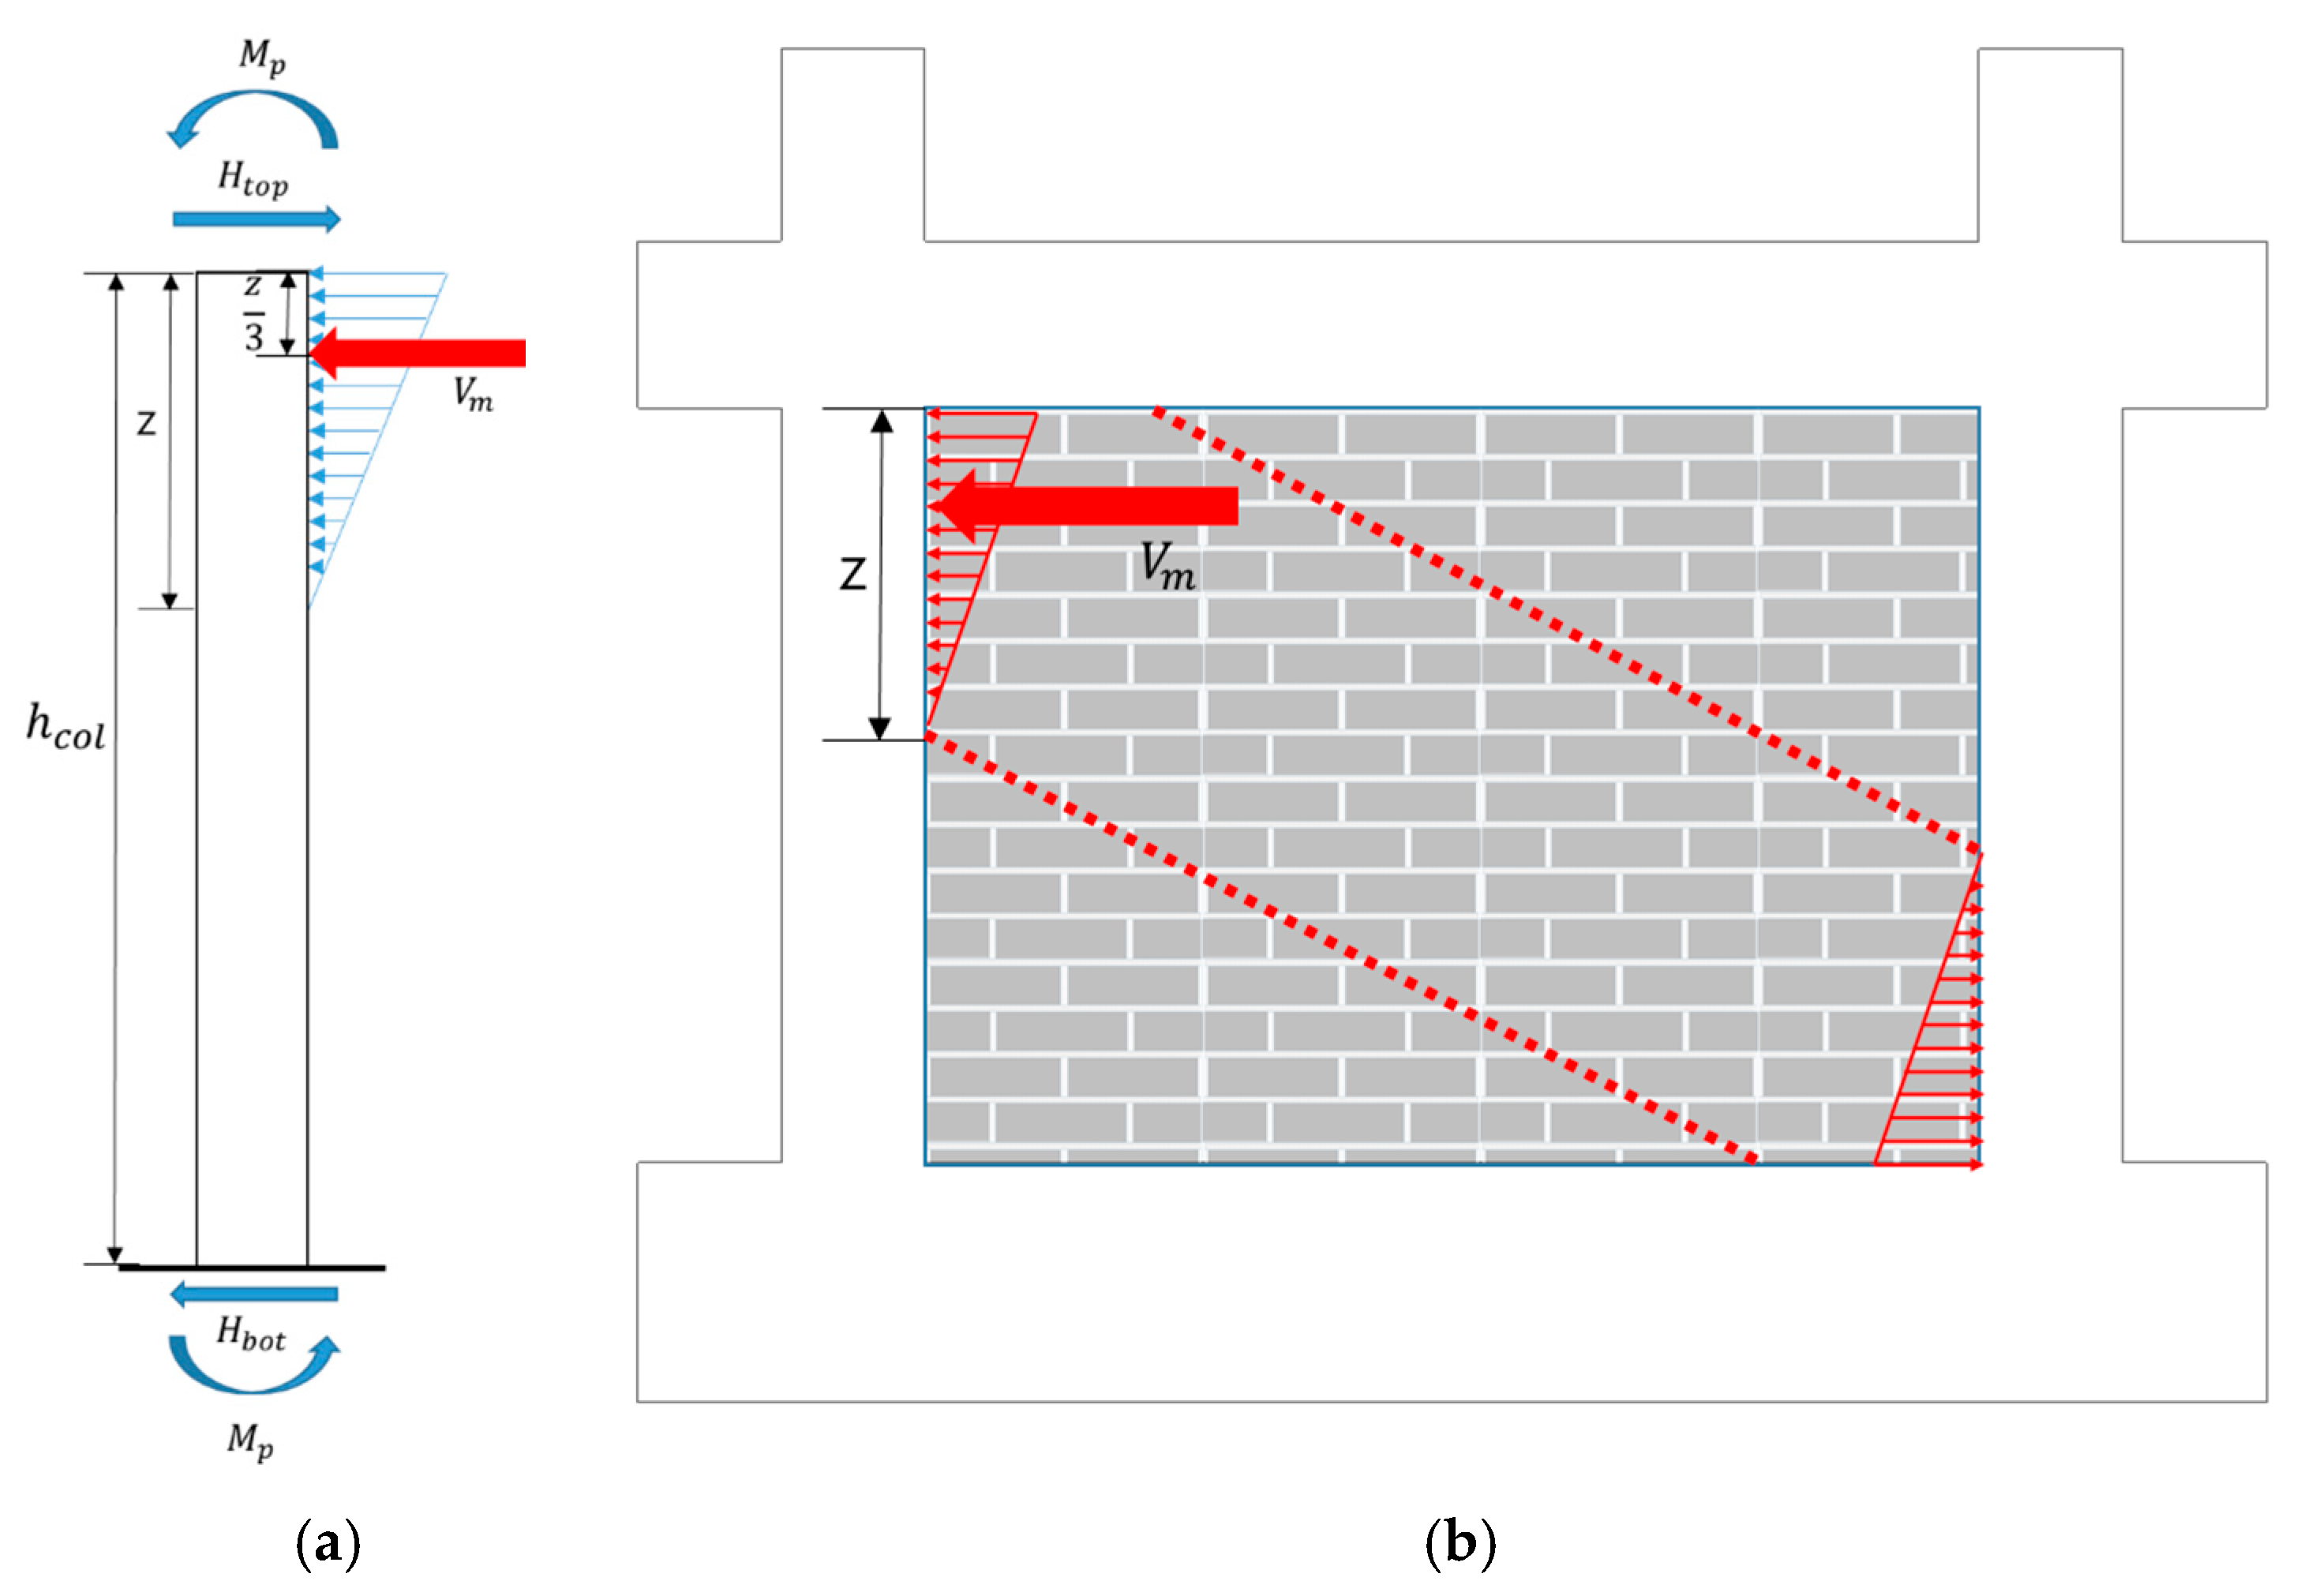
The strength prediction in Table 6 underestimates the strength of specimens with double wythe (IF-1.0 and IFS-1.0). It should be noted that strength prediction was made based on the flexural failure strength of the columns, although the actual failure mode of the two specimens was the shear failure of columns rather than flexural failure. The reason for such change in failure mode is presumably the existence of an interaction between the masonry infills and the surrounding frame. It is generally assumed that, in a masonry-infilled frame, the infill walls and frame resist lateral loads by formulating a diagonal compression strut, as shown in Figure 10b. The horizontal component of this strut force will be applied to the upper part of the windward column and the lower part of the leeward column. Figure 10a is the free body diagram of the windward column when it was assumed that both ends of the column yield by flexure.
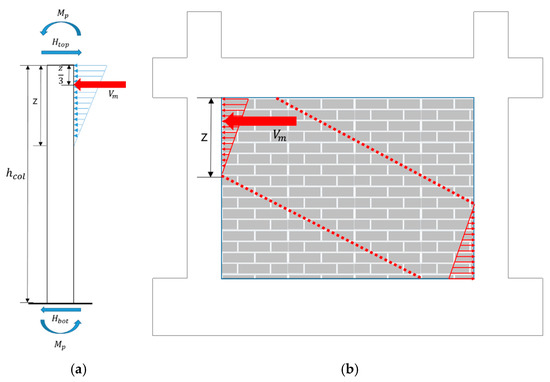
Figure 10.
Free body diagram of the windward column subjected to reaction from masonry infill. (a) Free body diagram. (b) Horizontal component of strut force.
Figure 11 shows the shear force diagram and bending moment diagram for the free body diagram in Figure 10a. It was assumed that plastic hinges were formulated at both ends, and the reactive force from the masonry wall acts as a triangular distributed load at the top of the column. If , which represents the shear force at the top of the column, is lower than the shear strength of the column section , flexural yielding will occur as assumed. However, as shown in the figure, if exceeds the shear strength of column , shear failure will occur before flexural yielding at both ends of the column.
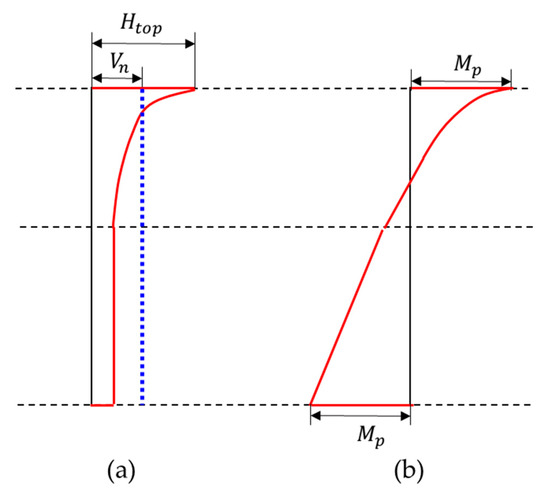
Figure 11.
Shear force and bending moment diagrams of the windward column subjected to reaction from masonry infill. (a) Shear force diagram. (b) Bending moment diagram.
In the IF-1.0 and IFS-1.0 specimens, in which the double wythe masonry wall was used, shear failure occurred. Therefore, the contribution of the lateral-load capacity of a frame part was adjusted considering the difference in the failure mode as follows.
First, as shown in Figure 10a, when flexural yielding occurs at both ends, the equilibrium moment equation centered on the lower part of the column can be established as shown in Equation (7).
where is the clear height of the column, is the plastic moment capacity of a column section, and is the contact length between the masonry infill and the frame. In this study, was estimated according to ASCE 41 [25] as , with being the equivalent strut width.
Solving for in Equation (7) yields Equation (8), which shows that is the increase in nodal force at the top of the column due to reaction from the masonry infill wall, considering that is the shear strength when flexural yielding occurs at both ends of a column in a bare frame.
For the IF-1.0 specimen, the strength of the masonry infill wall, including the frictional force, was 306.3 kN. , calculated using Equation (8), was 384.7 kN, and the shear strength of column was 175.3 kN. Since exceeds , it is expected that the column will fail due to shear failure, and the maximum load that can be applied to a windward column will be 175.3 kN, which is the nodal load at the top of the column member when any of the column sections reaches shear failure. Strictly speaking, if yielding does not occur at the end of the column, the magnitude at both ends and concentrated load at the top of the column should be determined from the solution of an indeterminate structure. However, simple proportionality was assumed for brevity to obtain . A similar procedure can be applied to the leeward column to obtain the applied load at the top of the column. Total horizontal force is determined by summing the load carried by the windward column, leeward column, and masonry infill. Strength predictions for IF1.0 and IFS-1.0 by the procedure above are summarized and compared with test results in Table 7. Predictions became closer to the test results, ranging from 95% to 106% in the case of IF-1.0 and from 96% to 113% in the case of IFS-1.0.
Table 7.
Prediction of maximum force for IF-1.0 and IFS-1.0.
Compared with the average values of the peak force in the positive and negative directions, the predictions showed an almost perfect match. However, the predictions in this study were made based on observations of test specimens, especially observed failure mode and the drift angle at the maximum load. In order for the proposed method to be used practically, the failure mode and the deformation angle at the maximum load must be theoretically determined. In addition, a method for discriminating the various destruction modes of masonry is required. Additionally, it is necessary to check whether the proposed method is effective in other failure modes of masonry walls.
5. Conclusions
In this study, to analyze the effect of construction precision, masonry-infilled frame specimens with and without gaps between the bottom of the beam and top of the masonry infills were tested, and their results were compared. In addition, to examine the effect of the relative strength of masonry infills on the frame, specimens with single wythe and double wythe masonry walls, respectively, were tested and compared. The dimensions and strength of the RC frame were the same in all specimens.
Specimens with a gap showed 75% to 80% decreased strength and 55% to 70% decreased stiffness compared to those of the specimen without a gap. In specimens with single wythe masonry walls, final failure occurred due to flexural failure of columns, as in the specimen without an infill wall. On the other hand, specimens with double wythe masonry walls failed due to shear failure in columns.
The maximum strength of the specimens with a single wythe masonry wall and a gap (IFS-0.5) was very close to the sum of the shear strength of the masonry considering cohesion of mortar only and strength corresponding to the flexural failure strength of columns, which is identical to the strength predicted by ASCE 41 [25]. However, ASCE 41 underestimates the strength of the rest of the specimens. To match the test results, frictional forces need to be considered for the specimens without a gap. The normal force to calculate the frictional force was determined from the measured drift angle at peak force. In the case of specimens with thick masonry walls, it was observed that the failure mode was changed to shear failure of the columns. A theoretical model to explain the change in failure mode was proposed, and maximum force was calculated using the proposed model, which showed good agreement with the test results.
In order to practically apply the proposed method to predict the strength of masonry infilled frames, various studies, such as analytical determination of failure mode and the drift ratio at the peak strength, are required.
Author Contributions
Conceptualization, M.K. and E.Y.; methodology, M.K. and E.Y.; formal analysis, M.K.; investigation, E.Y.; data curation, M.K.; writing—original draft preparation, M.K.; writing—review and editing, E.Y.; visualization, M.K.; supervision, E.Y.; project administration, E.Y. All authors have read and agreed to the published version of the manuscript.
Funding
This research was supported by a grant(13AUDP-B066083-01) from Architecture & Urban Development Research Program funded by Ministry of Land, Infrastructure and Transport of Korean government.
Institutional Review Board Statement
Not applicable.
Informed Consent Statement
Not applicable.
Data Availability Statement
Data sharing not applicable.
Conflicts of Interest
The authors declare no conflict of interest.
References
- Smith, B.S.; Carter, C. A method of analysis for infilled frames. Proc. Inst. Civ. Eng. 1969, 44, 31–48. [Google Scholar]
- Mehrabi, A.B.; Benson Shing, P.; Schuller, M.P.; Noland, J.L. Experimental evaluation of masonry-infilled RC frames. J. Struct. Eng. 1996, 122, 228–237. [Google Scholar] [CrossRef]
- Turgay, T.; Durmus, M.C.; Binici, B.; Ozcebe, G. Evaluation of the predictive models for stiffness, strength, and deformation capacity of RC frames with masonry infill walls. J. Struct. Eng. 2014, 140, 06014003. [Google Scholar] [CrossRef]
- Alwashali, H.; Torihata, Y.; Jin, K.; Maeda, M. Experimental observations on the in-plane behaviour of masonry wall infilled RC frames; focusing on deformation limits and backbone curve. Bull. Earthq. Eng. 2018, 16, 1373–1397. [Google Scholar] [CrossRef]
- Smith, B.S. Behavior of square infilled frames. J. Struct. Div. 1966, 92, 381–404. [Google Scholar] [CrossRef]
- Paulay, T.; Priestley, M.N. Seismic Design of Reinforced Concrete and Masonry Buildings; John Wiley & Sons: Hoboken, NJ, USA, 1992. [Google Scholar]
- Saneinejad, A.; Hobbs, B. Inelastic design of infilled frames. J. Struct. Eng. 1995, 121, 634–650. [Google Scholar] [CrossRef] [Green Version]
- Decanini, L.; Mollaioli, F.; Mura, A.; Saragoni, R. Seismic performance of masonry infilled R/C frames. In Proceedings of the 13th World Conference on Earthquake Engineering (No. 165), Vancouver, BC, Canada, 1–6 August 2004. [Google Scholar]
- Liauw, T.C.; Kwan, K.H. Plastic design of infilled frames. Proc. Inst. Civ. Eng. 1984, 77, 367–377. [Google Scholar] [CrossRef]
- Stylianidis, K.C. Experimental investigation of masonry infilled R/C frames. Open Constr. Build. Technol. J. 2012, 6, 194–212. [Google Scholar] [CrossRef] [Green Version]
- Zovkic, J.; Sigmund, V.; Guljas, I. Cyclic testing of a single bay reinforced concrete frames with various types of masonry infill. Earthq. Eng. Struct. Dyn. 2013, 42, 1131–1149. [Google Scholar] [CrossRef]
- Sanada, Y. R/C frame–infill interaction model and its application to Indonesian buildings. Earthq. Eng. Struct. Dyn. 2017, 46, 221–241. [Google Scholar]
- Jiang, H.; Liu, X.; Mao, J. Full-scale experimental study on masonry infilled RC moment-resisting frames under cyclic loads. Eng. Struct. 2015, 91, 70–84. [Google Scholar] [CrossRef]
- Brodsky, A.; Rabinovitch, O.; Yankelevsky, D. Investigation of the Non-Linear Interaction Between a masonry infill Wall and a Surrounding Frame. In Proceedings of the 10th International Masonry Conference, Milan, Italy, 9–11 July 2018. [Google Scholar]
- Dautaj, A.D.; Kadiri, Q.; Kabashi, N. Experimental study on the contribution of masonry infill in the behavior of RC frame under seismic loading. Eng. Struct. 2018, 165, 27–37. [Google Scholar] [CrossRef]
- Basha, S.H.; Kaushik, H.B. Investigation on improving the shear behavior of columns in masonry infilled RC frames under lateral loads. Bull. Earthq. Eng. 2019, 17, 3995–4026. [Google Scholar] [CrossRef]
- Aiello, M.A.; Cascardi, A.; Ombres, L.; Verre, S. Confinement of Masonry Columns with the FRCM-System: Theoretical and Experimental Investigation. Infrastructures 2020, 5, 101. [Google Scholar] [CrossRef]
- Šipoš, T.K.; Strukar, K. Prediction of the seismic response of multi-storey multi-bay masonry infilled frames using artificial neural networks and a bilinear approximation. Buildings 2019, 9, 121. [Google Scholar] [CrossRef] [Green Version]
- Chandel, V.S.; Sreevalli, I.Y. Numerical study on influence of masonry infill in an RC frame. Asian J. Civ. Eng. 2019, 20, 1–8. [Google Scholar] [CrossRef]
- Maidiawati, M.; Tanjung, J.; Nugroho, F.; Hayati, Y. Seismic performance analysis of multi-span masonry infilled RC frame based on analytical strut model. IOP Conf. Ser. Mater. Sci. Eng. 2020, 933, 012042. [Google Scholar] [CrossRef]
- Xavier, F.B.; Macorini, L.; Izzuddin, B.A.; Chisari, C.; Gattesco, N.; Noe, S.; Amadio, C. Pushdown tests on masonry infilled frames for assessment of building robustness. J. Struct. Eng. 2017, 143, 04017088. [Google Scholar] [CrossRef]
- Dawe, J.L.; Seah, C.K. Behaviour of masonry infilled steel frames. Can. J. Civ. Eng. 1989, 16, 865–876. [Google Scholar] [CrossRef]
- Crisafulli, F.J. Seismic Behaviour of Reinforced Concrete Structures with Masonry Infills. Ph.D. Thesis, Univ. of Canterbury, Christchurch, New Zealand, 1997. [Google Scholar]
- Federal Emergency Management Agency (FEMA). FEMA 306: Evaluation of Earthquake Damaged Concrete and Masonry Wall Buildings; CreateSpace Independent Publishing Platform: Scotts Valley, CL, USA, 1998. [Google Scholar]
- ASCE/SEI Seismic Rehabilitation Standards Committee. Seismic Rehabilitation of Existing Buildings (ASCE/SEI 41-17); American Society of Civil Engineers: Reston, VA, USA, 2017. [Google Scholar]
- ASTM C109/C109M-21. Standard Test Method for Compressive Strength of Hydraulic Cement Mortars (Using 2-in. or [50 mm] Cube Specimens); ASTM International: West Conshohocken, PA, USA, 2021. [Google Scholar]
- BS EN 1052-3. Methods of Test for Masonry-Part 3: Determination of Initial Shear Strength; British Standards Institution: London, UK, 2002. [Google Scholar]
- ASTM C39/C39M-21. Standard Test Method for Compressive Strength of Cylindrical Concrete Specimens; ASTM International: West Conshohocken, PA, USA, 2021. [Google Scholar]
- ASTM E8/E8M-21. Standard Test Methods for Tension Testing of Metallic Materials; ASTM International: West Conshohocken, PA, USA, 2021. [Google Scholar]
- ASTM C140/C140M-21. Standard Test Methods for Sampling and Testing Concrete Masonry Units and Related Units; ASTM International: West Conshohocken, PA, USA, 2021. [Google Scholar]
- ASTM C67/C67M-21. Standard Test Methods for Sampling and Testing Brick and Structural Clay Tile; ASTM International: West Conshohocken, PA, USA, 2021. [Google Scholar]
- ASTM C1314-21. Standard Test Method for Compressive Strength of Masonry Prisms; ASTM International: West Conshohocken, PA, USA, 2021. [Google Scholar]


Publisher’s Note: MDPI stays neutral with regard to jurisdictional claims in published maps and institutional affiliations. |
© 2021 by the authors. Licensee MDPI, Basel, Switzerland. This article is an open access article distributed under the terms and conditions of the Creative Commons Attribution (CC BY) license (https://creativecommons.org/licenses/by/4.0/).