Abstract
This study aims to introduce a new compressed sensing averaging (CSA) technique for the reduction of blurring and/or ringing artifacts, depending on the k-space sampling ratio. A full k-space dataset and three randomly undersampled datasets were obtained for CSA images in a brain phantom and a healthy subject. An additional simulation was performed to assess the effect of the undersampling ratio on the images and the signal-to-noise ratios (SNRs). The image sharpness, spatial resolution, and contrast between tissues were analyzed and compared with other CSA techniques. Compared to CSA with multiple acquisition (CSAM) at 25%, 35%, and 45% undersampling, the reduction rates of the k-space lines of CSA with keyhole (CSAK) were 10%, 15%, and 22%, respectively, and the acquisition time was reduced by 16%, 23%, and 32%, respectively. In the simulation performed with a full sampling k-space dataset, the SNR decreased to 10.41, 9.80, and 8.86 in the white matter and 9.69, 9.35, and 8.46 in the gray matter, respectively. In addition, the ringing artifacts became substantially more predominant as the number of sampling lines decreased. The 50% modulation transfer functions were 0.38, 0.43, and 0.54 line pairs per millimeter for CSAM, CSAK with high-frequency sharing (CSAKS), and CSAK with high-frequency copying (CSAKC), respectively. In this study, we demonstrated that the smaller the sampling line, the more severe the ringing artifact, and that the CSAKC technique proposed to overcome the artifacts that occur when using CSA techniques did not generate artifacts, while it increased spatiotemporal resolution.
1. Introduction
Magnetic resonance imaging (MRI) has the advantage of being able to depict detailed brain structures non-invasively using a magnetic field; therefore, it is widely used clinically. The sensitivity of MRI has increased over time, from 1.5T systems to 3T or 7T systems, allowing high-resolution images to be obtained. The acquisition of high-resolution images from the same MRI system can increase the contrast-to-noise ratio (CNR), resulting in better tissue-to-tissue contrast. However, the signal-to-noise ratio (SNR) confirming the quality of the image is decreased, because of the reduced voxel size, making it difficult to clearly identify subtle brain structures [1,2,3,4]. In addition, in order to increase the resolution of an image using MRI, more k-space phase-encoding lines need to be acquired, which not only increases the image acquisition time but also tends to lead to more motion artifacts [5,6,7]. Therefore, new image acquisition and reconstruction techniques for acquiring high-resolution images with high temporal resolution are being developed [8,9,10,11,12,13,14,15].
Various technologies are being developed to reduce acquisition time and motion artifacts in high-resolution imaging, including image averaging and compressed sensing (CS) techniques [16,17,18,19]. Image averaging is a technique that reduces noise when different images are averaged [16,17]. A high-resolution image has a relatively low SNR because of the high levels of noise; however, averaging several high-resolution images produces a high SNR due to the signal reduction resulting from averaging the random noises. However, to average several images, it is necessary to obtain a large number of high-resolution images in advance, and this further increases the acquisition time. The CS technique acquires randomly and reconstructs only some of the k-space phase-encoding lines, and even if undersampled, the obtained data can be reconstructed into an image of similar quality to the full k-space sampled image [18,19]. While these CS techniques can reduce image acquisition time [20,21], they have limitations in that the low SNR problem, which is a natural consequence of obtaining high-resolution images using 3T MRI, still needs to be addressed further.
Recently, to overcome this limitation, the CS technique and the image averaging technique were combined to reduce image acquisition time and enable image acquisition with a high SNR value [22,23]. In the phantom simulation, the CS averaging with keyhole acquisition (CSAK) method was proposed, which was an improvement on the existing multiple acquisition CSA (CSAM) method. The CSAM technique creates an image by averaging multiple images, undersampled using the CS technique. In contrast, the CSAK technique obtains all the undersampled high-frequency k-space dataset in the first subset, and the rest of the subsets contain only k-space center lines, which are low-frequency components that contain most of the image information. These keyhole-like techniques were used to increase temporal resolution. The incoherent high-frequency components of the first subset are shared pseudo-randomly with the rest of the subsets obtained using keyhole techniques and then reconstructed, and individual reconstructed images are averaged to increase the SNR. Using in vivo human experiments, CSAK based on the high-frequency sharing (i.e., CSAKS) technique was found to have higher temporal and spatial resolutions than those of CSAM; however, the limitations of ringing and/or blurring artifacts still remain to be solved for both techniques.
To solve this problem, we propose a CSAK with high-frequency copying (CSAKC) technique that copies all high-frequency components of the undersampled first subset to the remaining subsets obtained only with keyhole data, and then performs the CS reconstruction procedure. In addition, we investigate the existing limitations by comparing it with other CSA techniques.
2. Materials and Methods
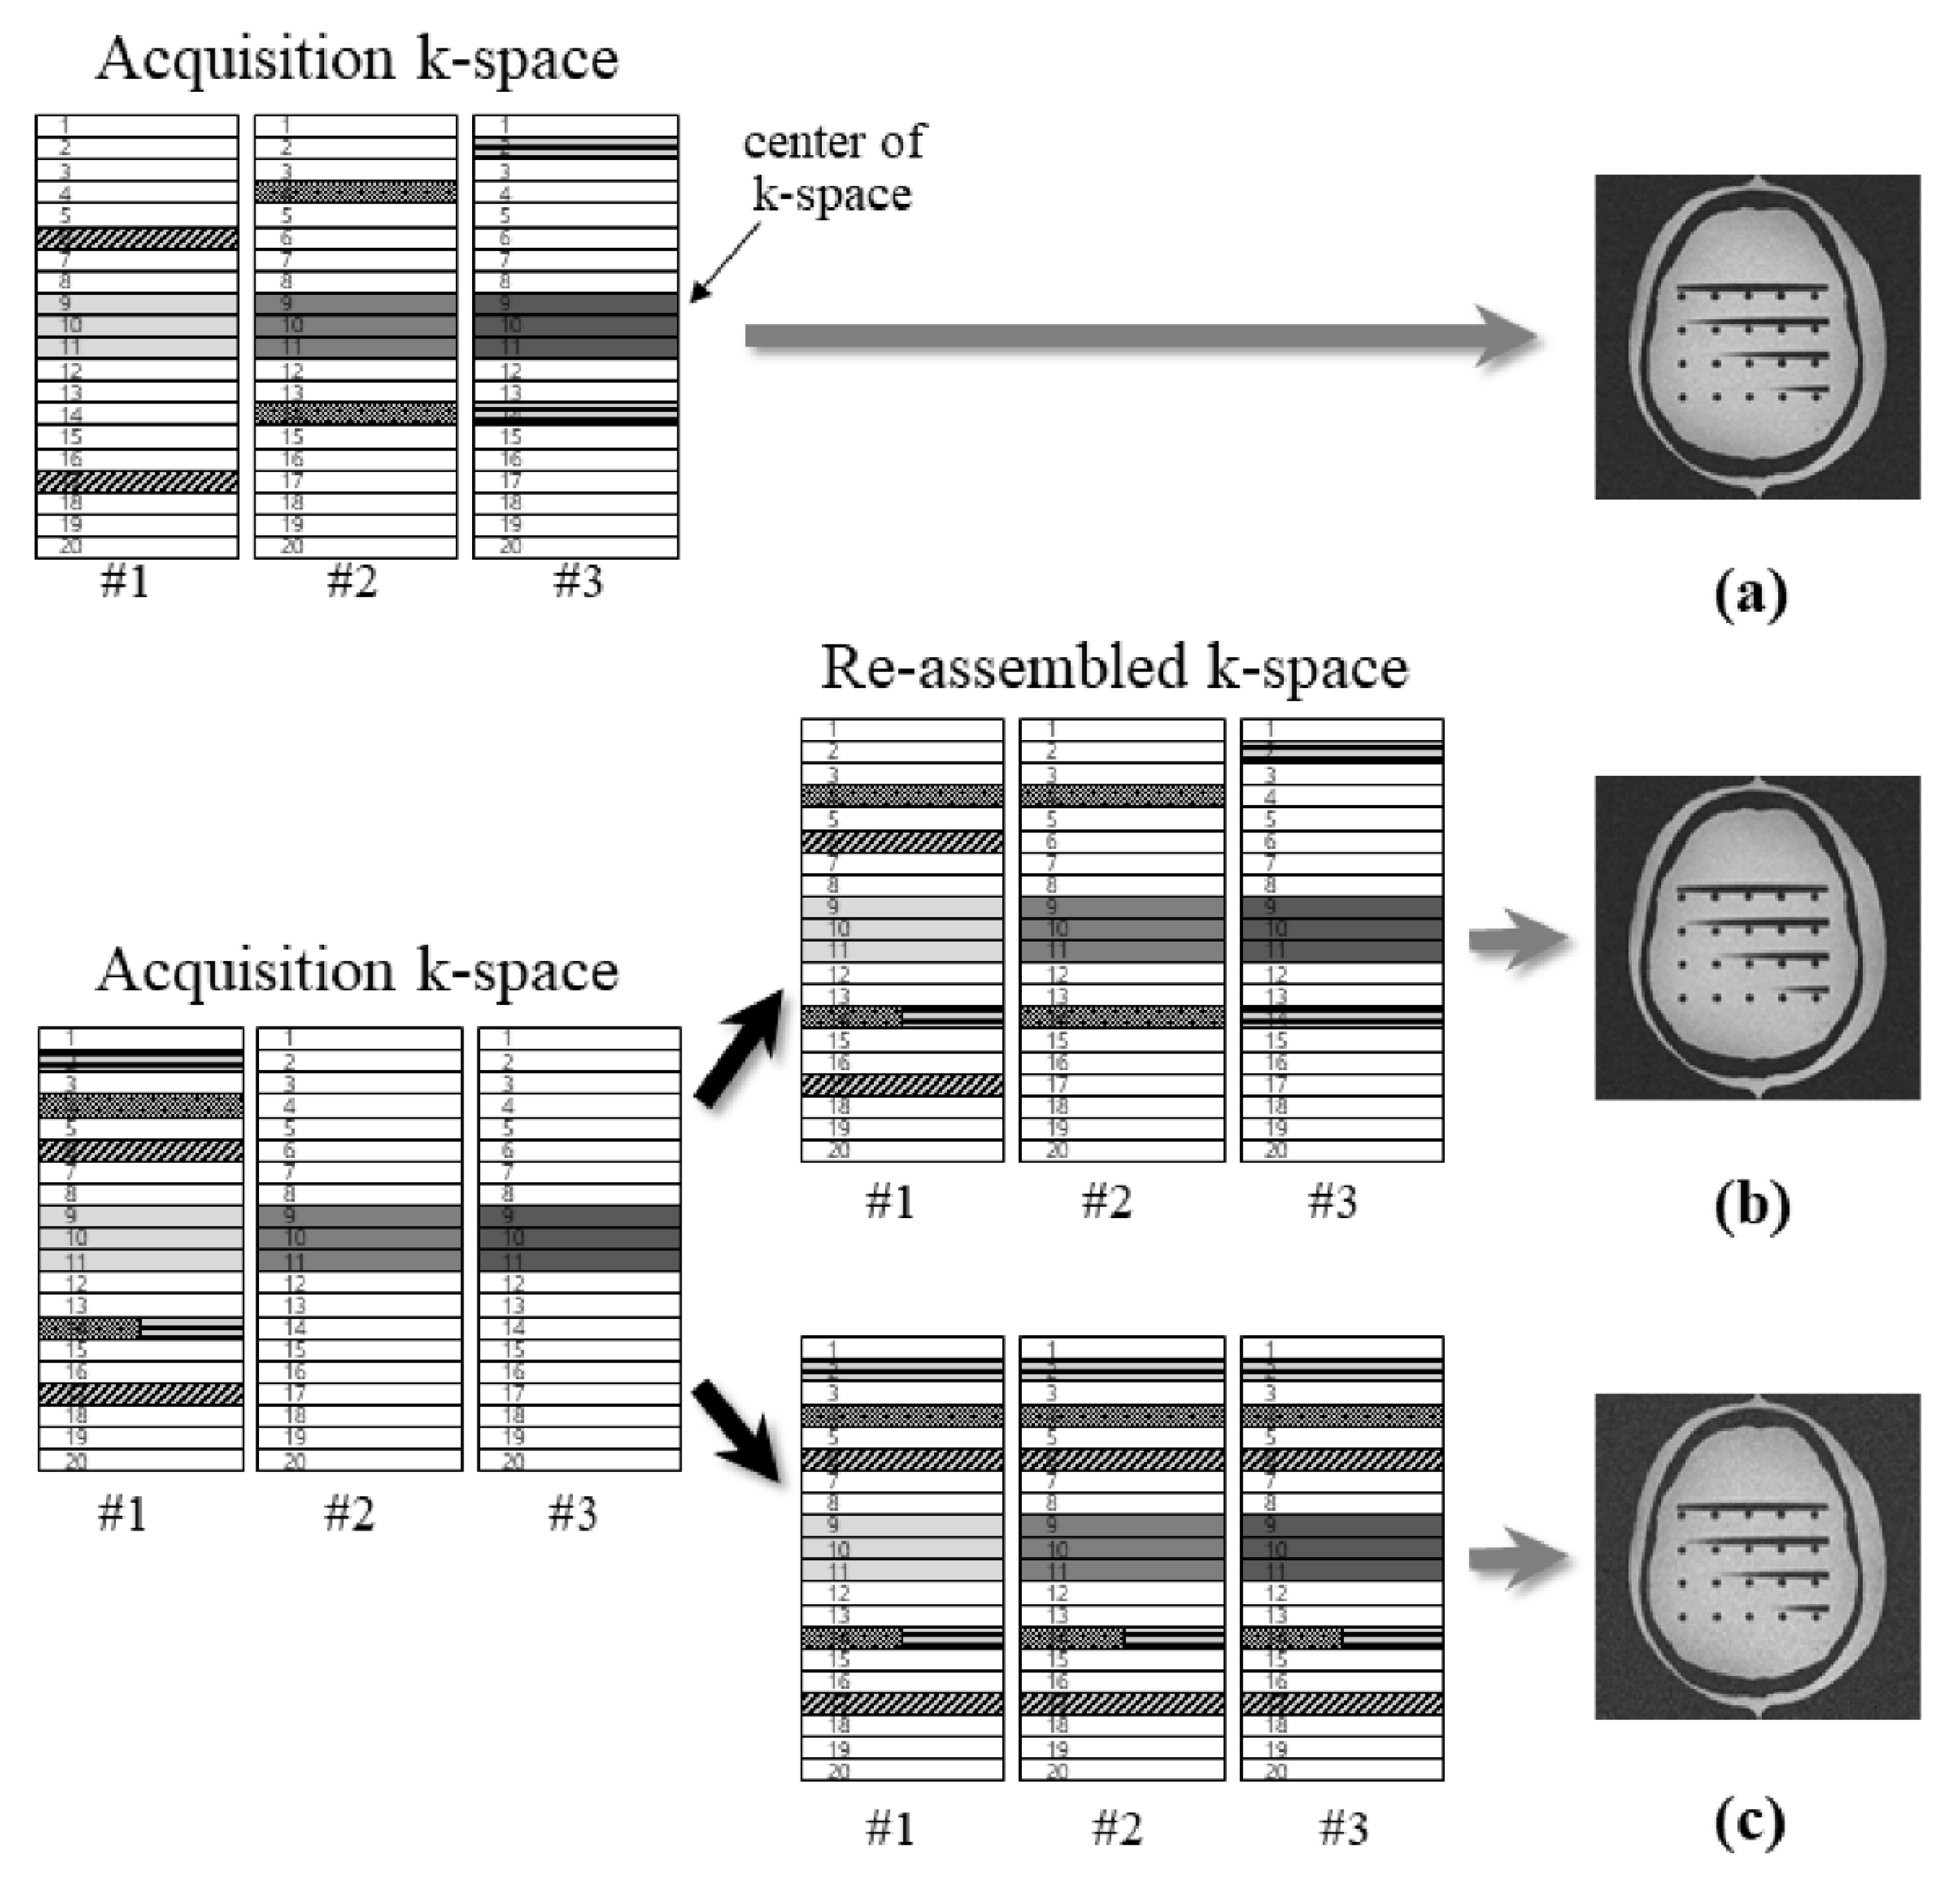
2.1. K-Space Acquisition and Reconstruction of CSA Methods
The procedures for k-space acquisition and reconstruction depend on the CSA method. CSAM uses the same k-space lines for acquisition and reconstruction, but CSAKS shares the k-space lines obtained from subset 1 with subsets 2 and 3, according to the undersampling ratio. Thus, the k-space phase-encoding lines of all subsets are reassembled to fit the undersampling ratio (i.e., 25% of full k-space phase-encoding lines).
While CSAKS shares the high-frequency information of subset 1 with subsets 2 and 3, CSAKC copies that of subset 1 to subsets 2 and 3, so that all subsets have the same k-space dataset as the acquired k-space lines of subset 1 (Figure 1).
Figure 1.
Conceptual schemes of CSA techniques. (a) CSAM which has pseudo-randomly sampled high-frequency k-space lines during acquisition; (b) CSAK based on k-space sharing (CSAKS); (c) CSAK based on k-space copying (CSAKC). The numbers, #1, #2, and #3, indicate the independently acquired subsets. Different gray levels at each k-space center (i.e., 9, 10, and 11) represent different acquisitions. Boxes with different background shapes belong to the pre-allocated lines in subset 1. Gray arrows indicate the CS reconstruction process for generating the image.
2.2. Random Sampling
Each dataset was acquired three times in order to use the averaging method. To maintain a suitable image quality, 15% of k-space center lines (116 lines out of 512 for full k-space lines) were selected, and k-space periphery lines were randomly obtained to provide the final 25%, 35%, and 45% lines. In the CSAM method, the three subsets had the same number and location of k-space phase-encoding lines (193 for 25%; 268 for 35%; 346 for 45%), in which the high-frequency lines (77 for 25%; 152 for 35%; 230 for 45%) were randomly sampled, excluding the predefined center lines of 116.
In contrast, the high-frequency k-space lines that should be randomly sampled in subsets 2 and 3 according to the undersampling ratio, were obtained in subset 1 in the CSAK method. Therefore, in subset 1, the sampling lines varied according to the undersampling ratio (291 for 25%; 448 for 35%; 579 for 45%), but in subsets 2 and 3, the same number of phase-encoding lines (i.e., 116) in the k-space center was selected (Table 1). The lines in the high-frequency region overlapped by less than 50% in each subset to maintain the averaging effect.
Table 1.
Number of k-space lines for MRI data acquisition and reconstruction in CSA techniques.
2.3. MR Parameters for Data Acquisition
The experiments were conducted with a brain phantom (anthropomorphic skull brain, model 603, CIRS) and a healthy young subject after obtaining written consent for participation in this study. The study was performed using a 3T MRI (Magnetom Verio, Siemens, Erlangen, Germany) with a 12-channel phase-array coil. For the human brain imaging, a pillow was placed under the subject’s head to allow a comfortable posture, and a foam cushion was used to minimize head movement. A spin-echo (SE) pulse sequence was used, and data collection from the human participant was performed using the following parameters: field of view (FOV) = 256 × 256 mm2; matrix size = 768 × 768, 10 slices; in-plane resolution = 0.33 × 0.33 mm2; slice thickness = 1.5 mm; repetition time (TR) = 460 ms; echo time (TE) = 12 ms; bandwidth = 296 Hz/pixel; flip angle (FA) = 90°.
In addition, the parameters used for phantom imaging were as follows: FOV = 192 × 192 mm2; matrix size = 768 × 768, 10 slices; in-plane resolution = 0.25 × 0.25 mm2; slice thickness = 1.0 mm; TR = 462 ms; TE = 12 ms; bandwidth = 233 Hz/pixel; FA = 90°.
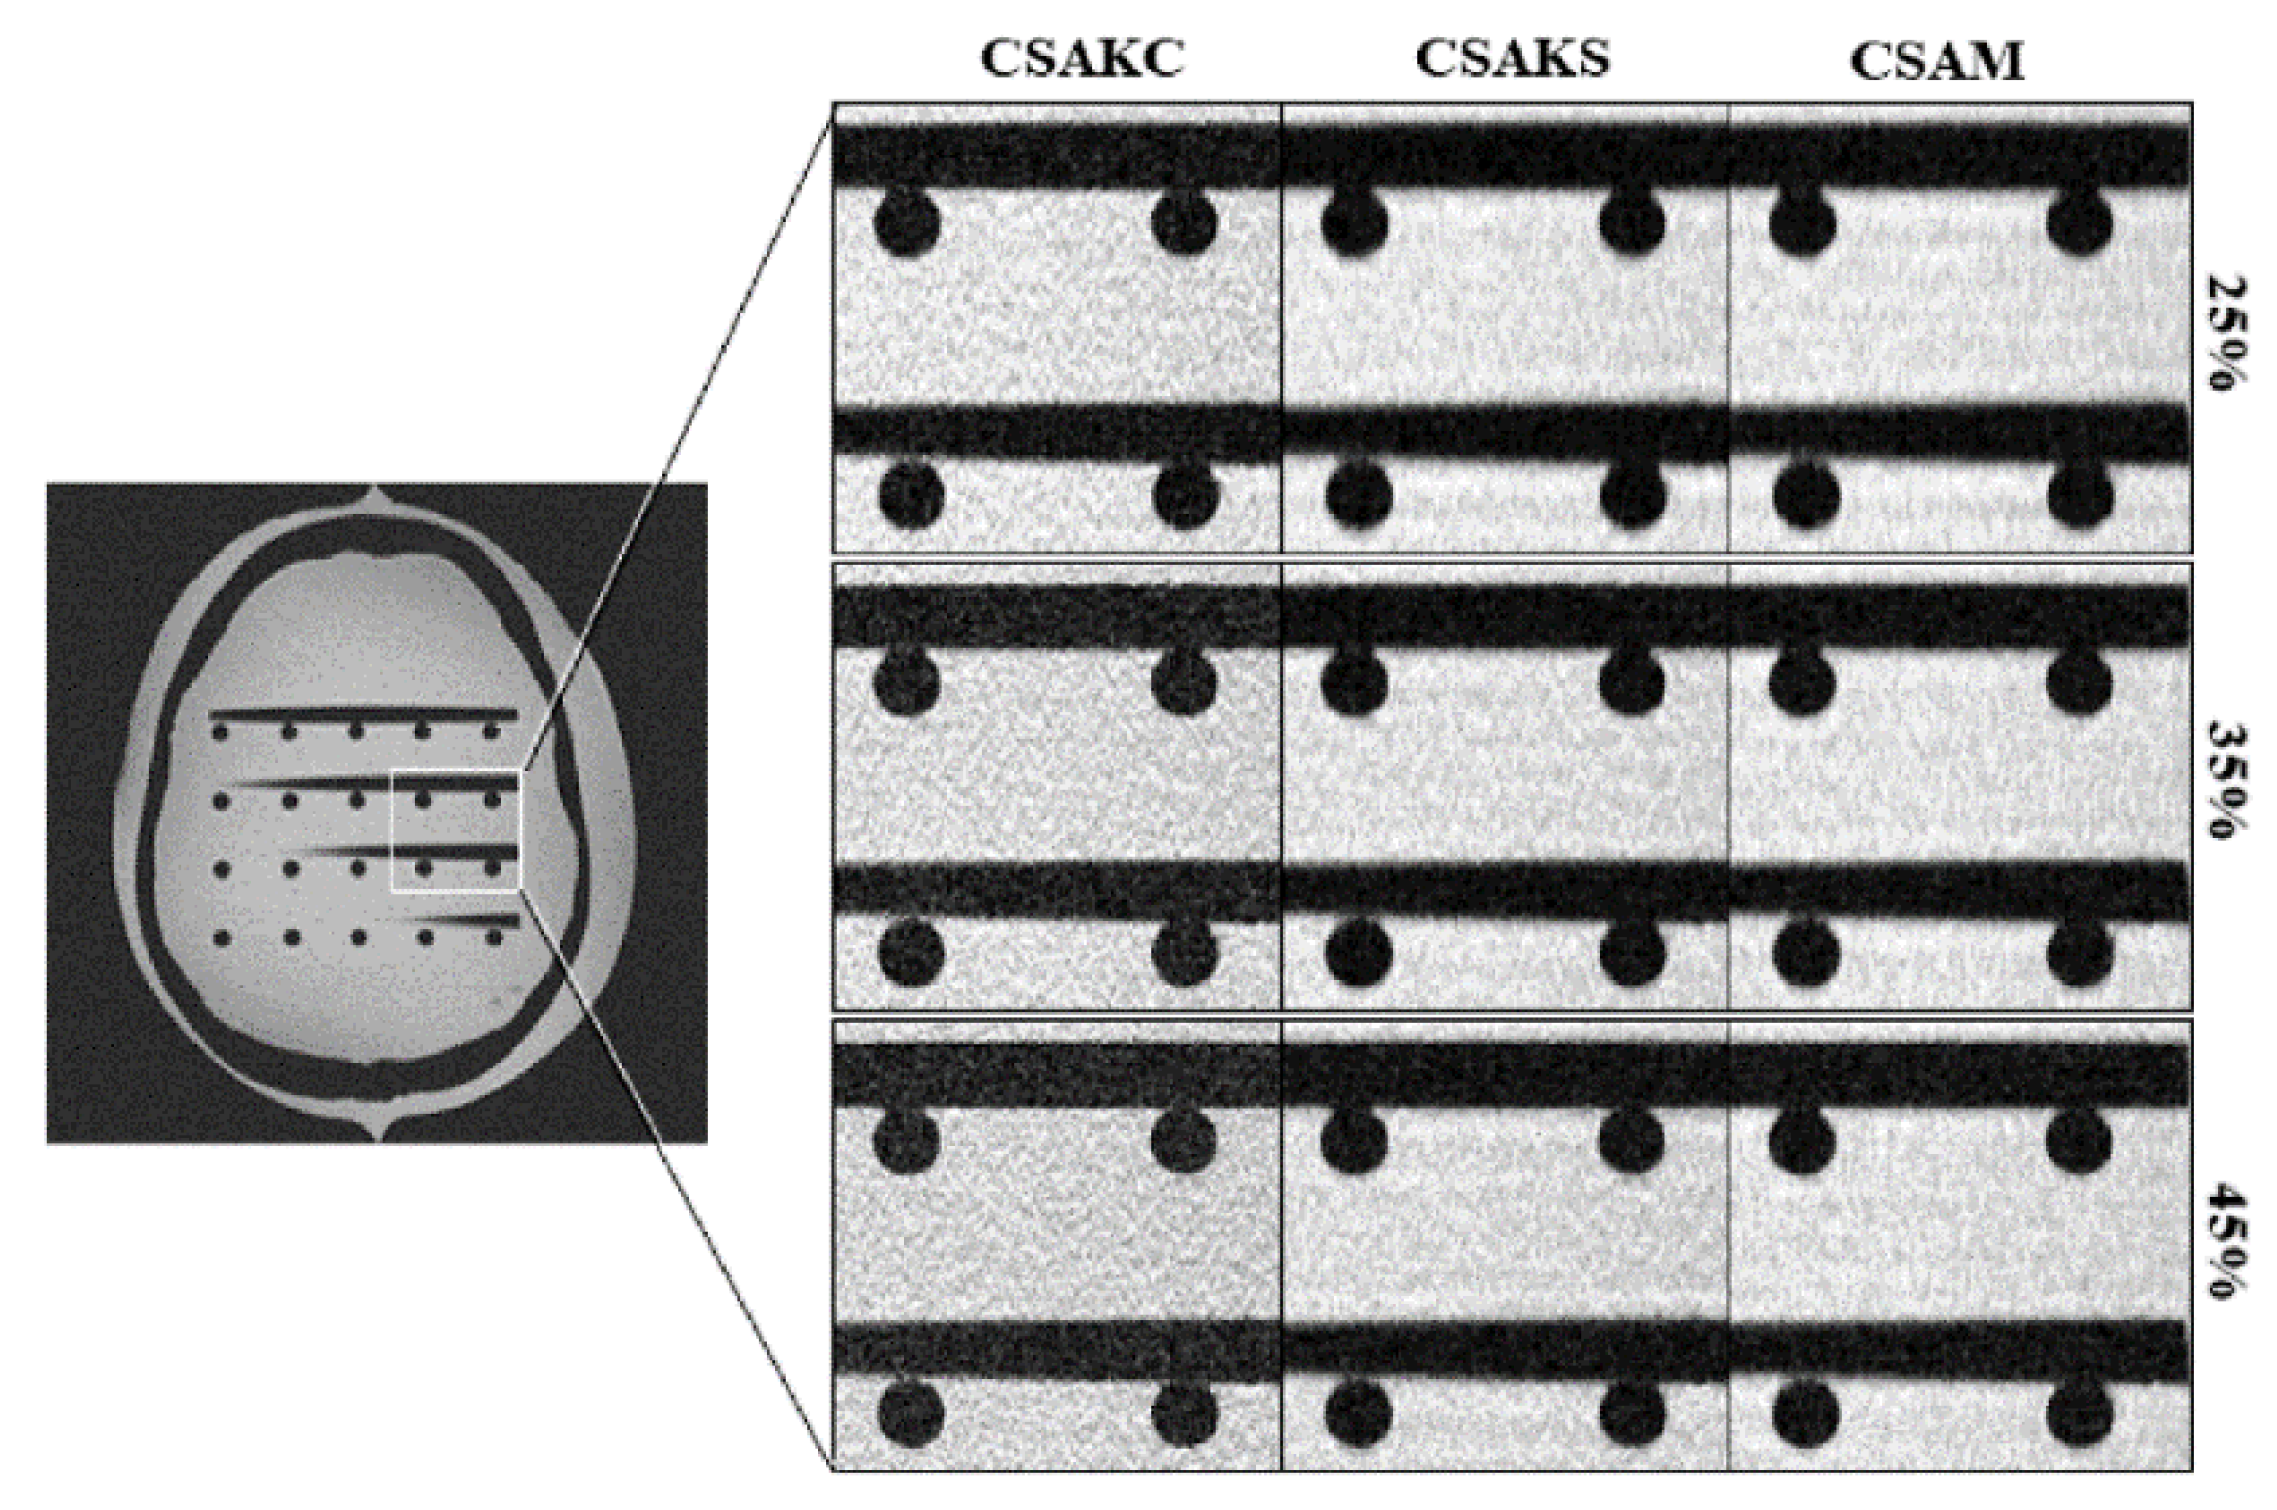
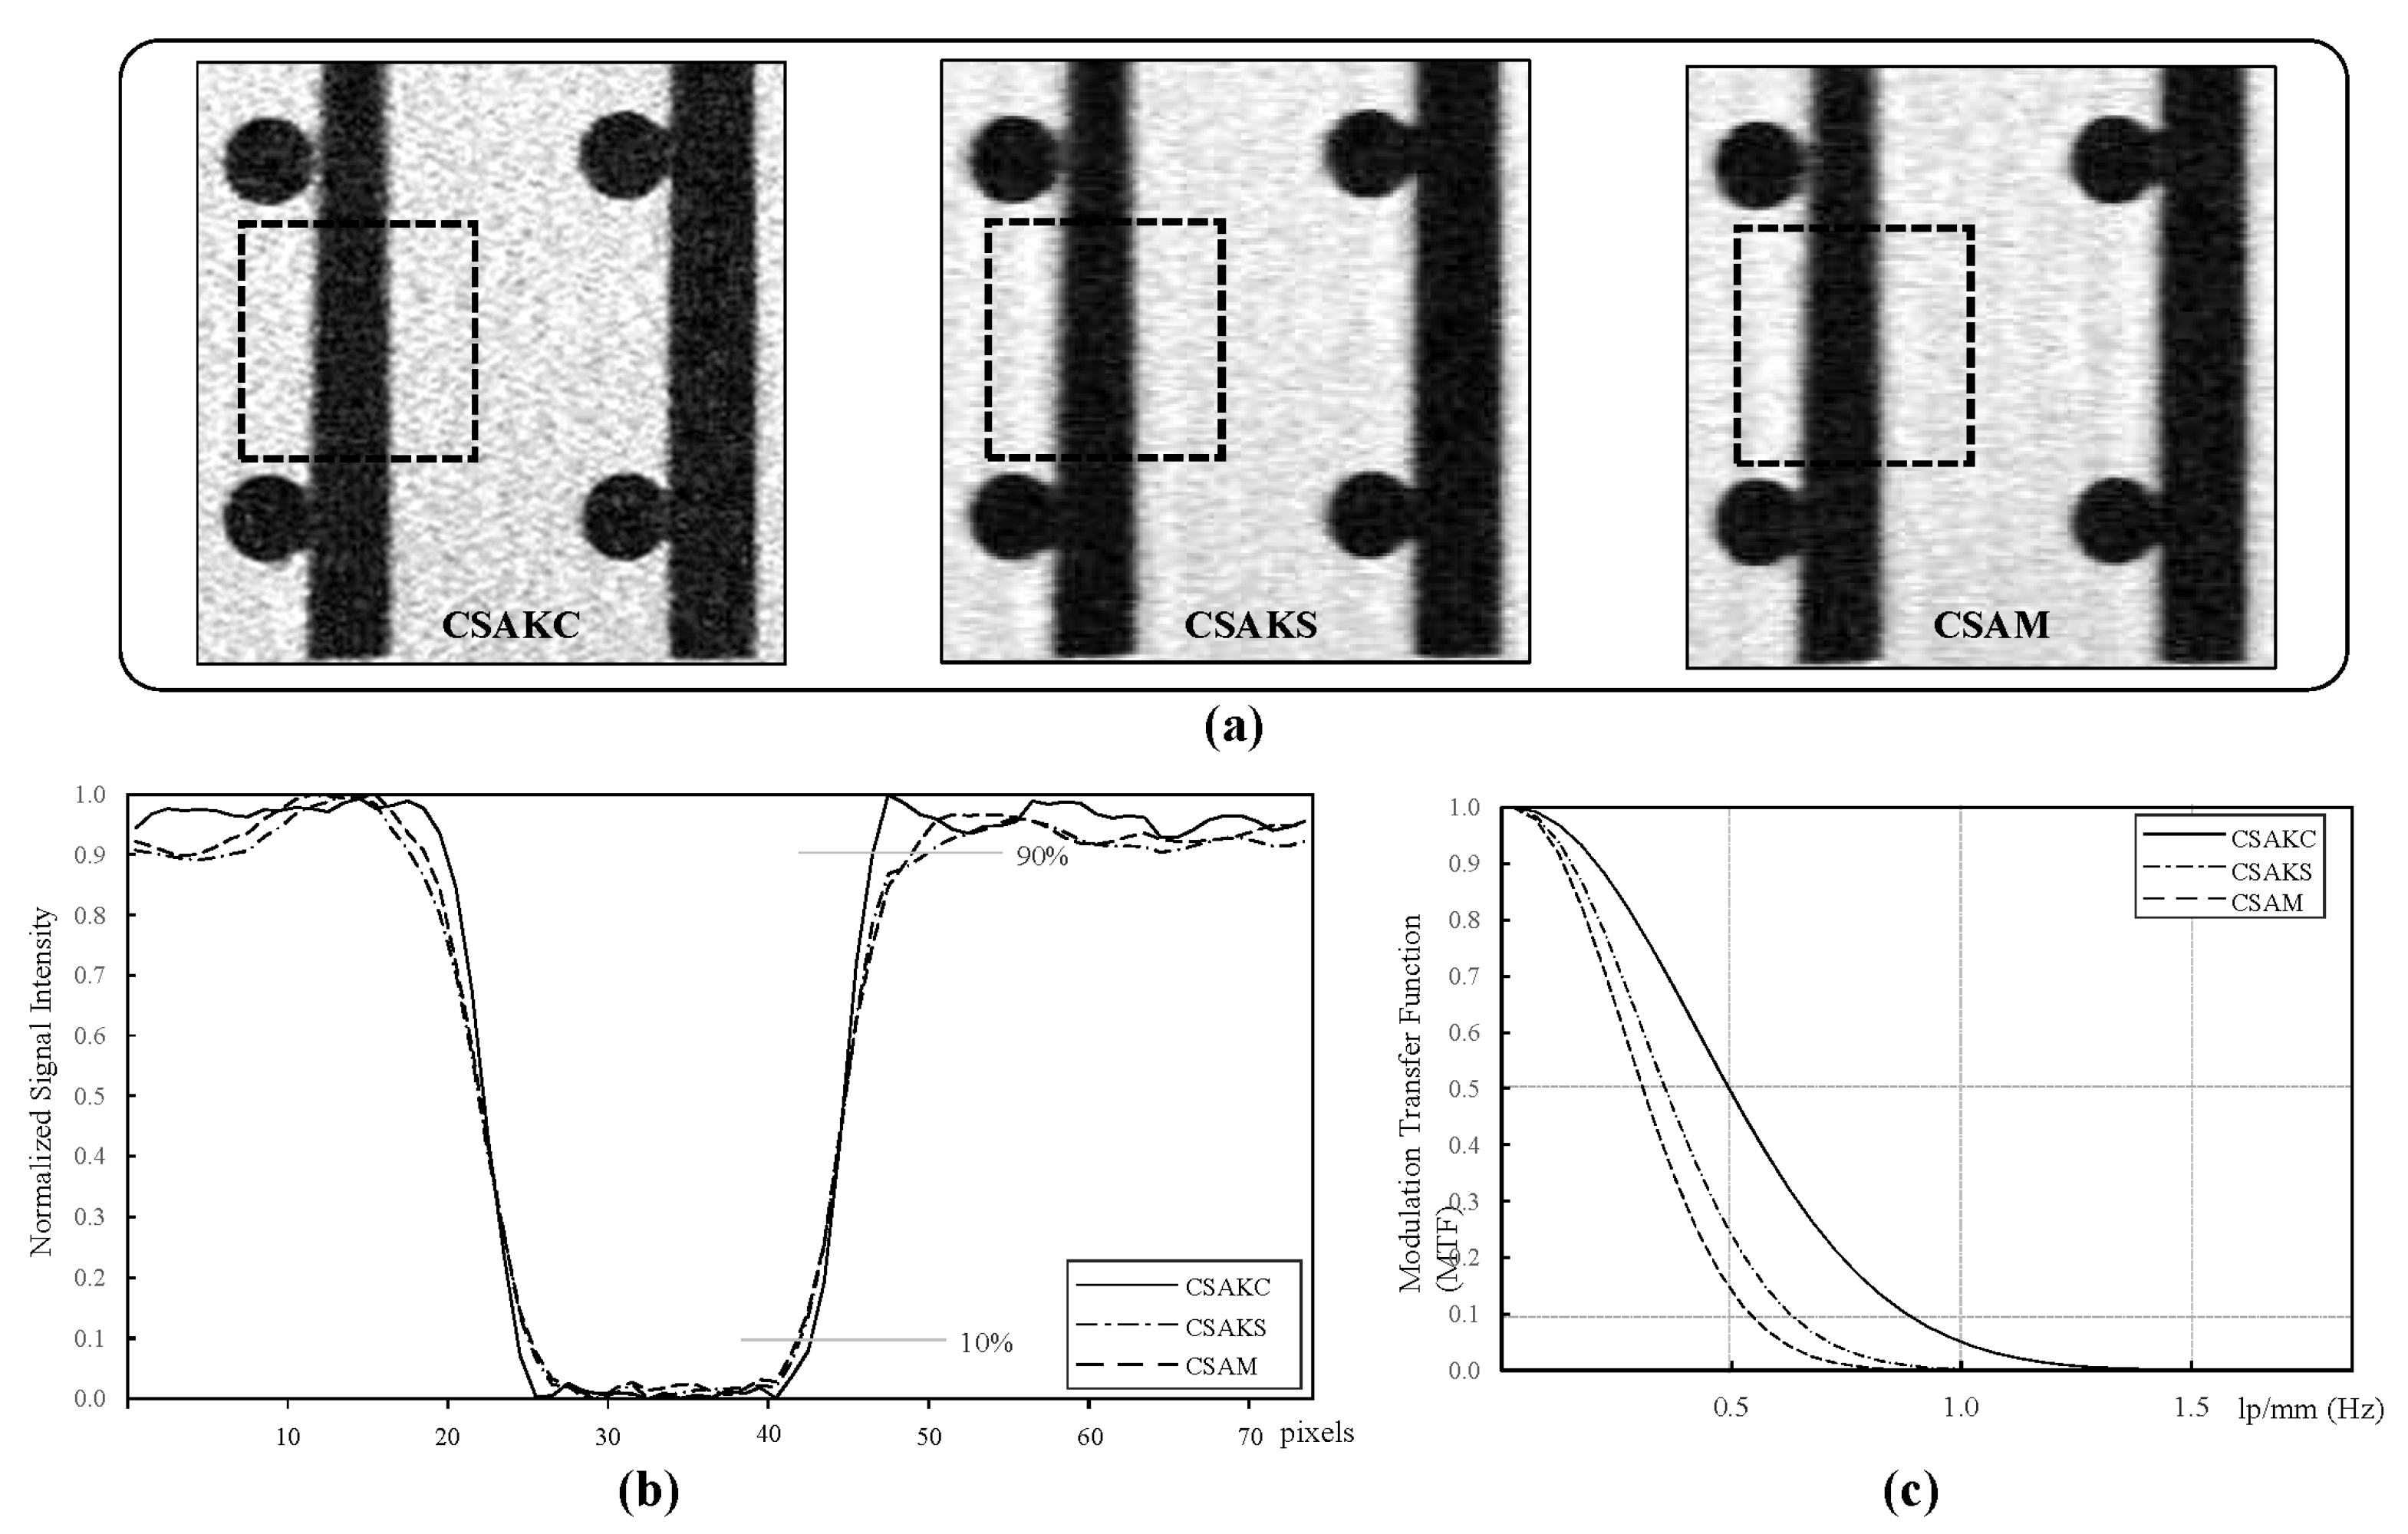
2.4. Evaluation of Ringing and Blurring Artifacts
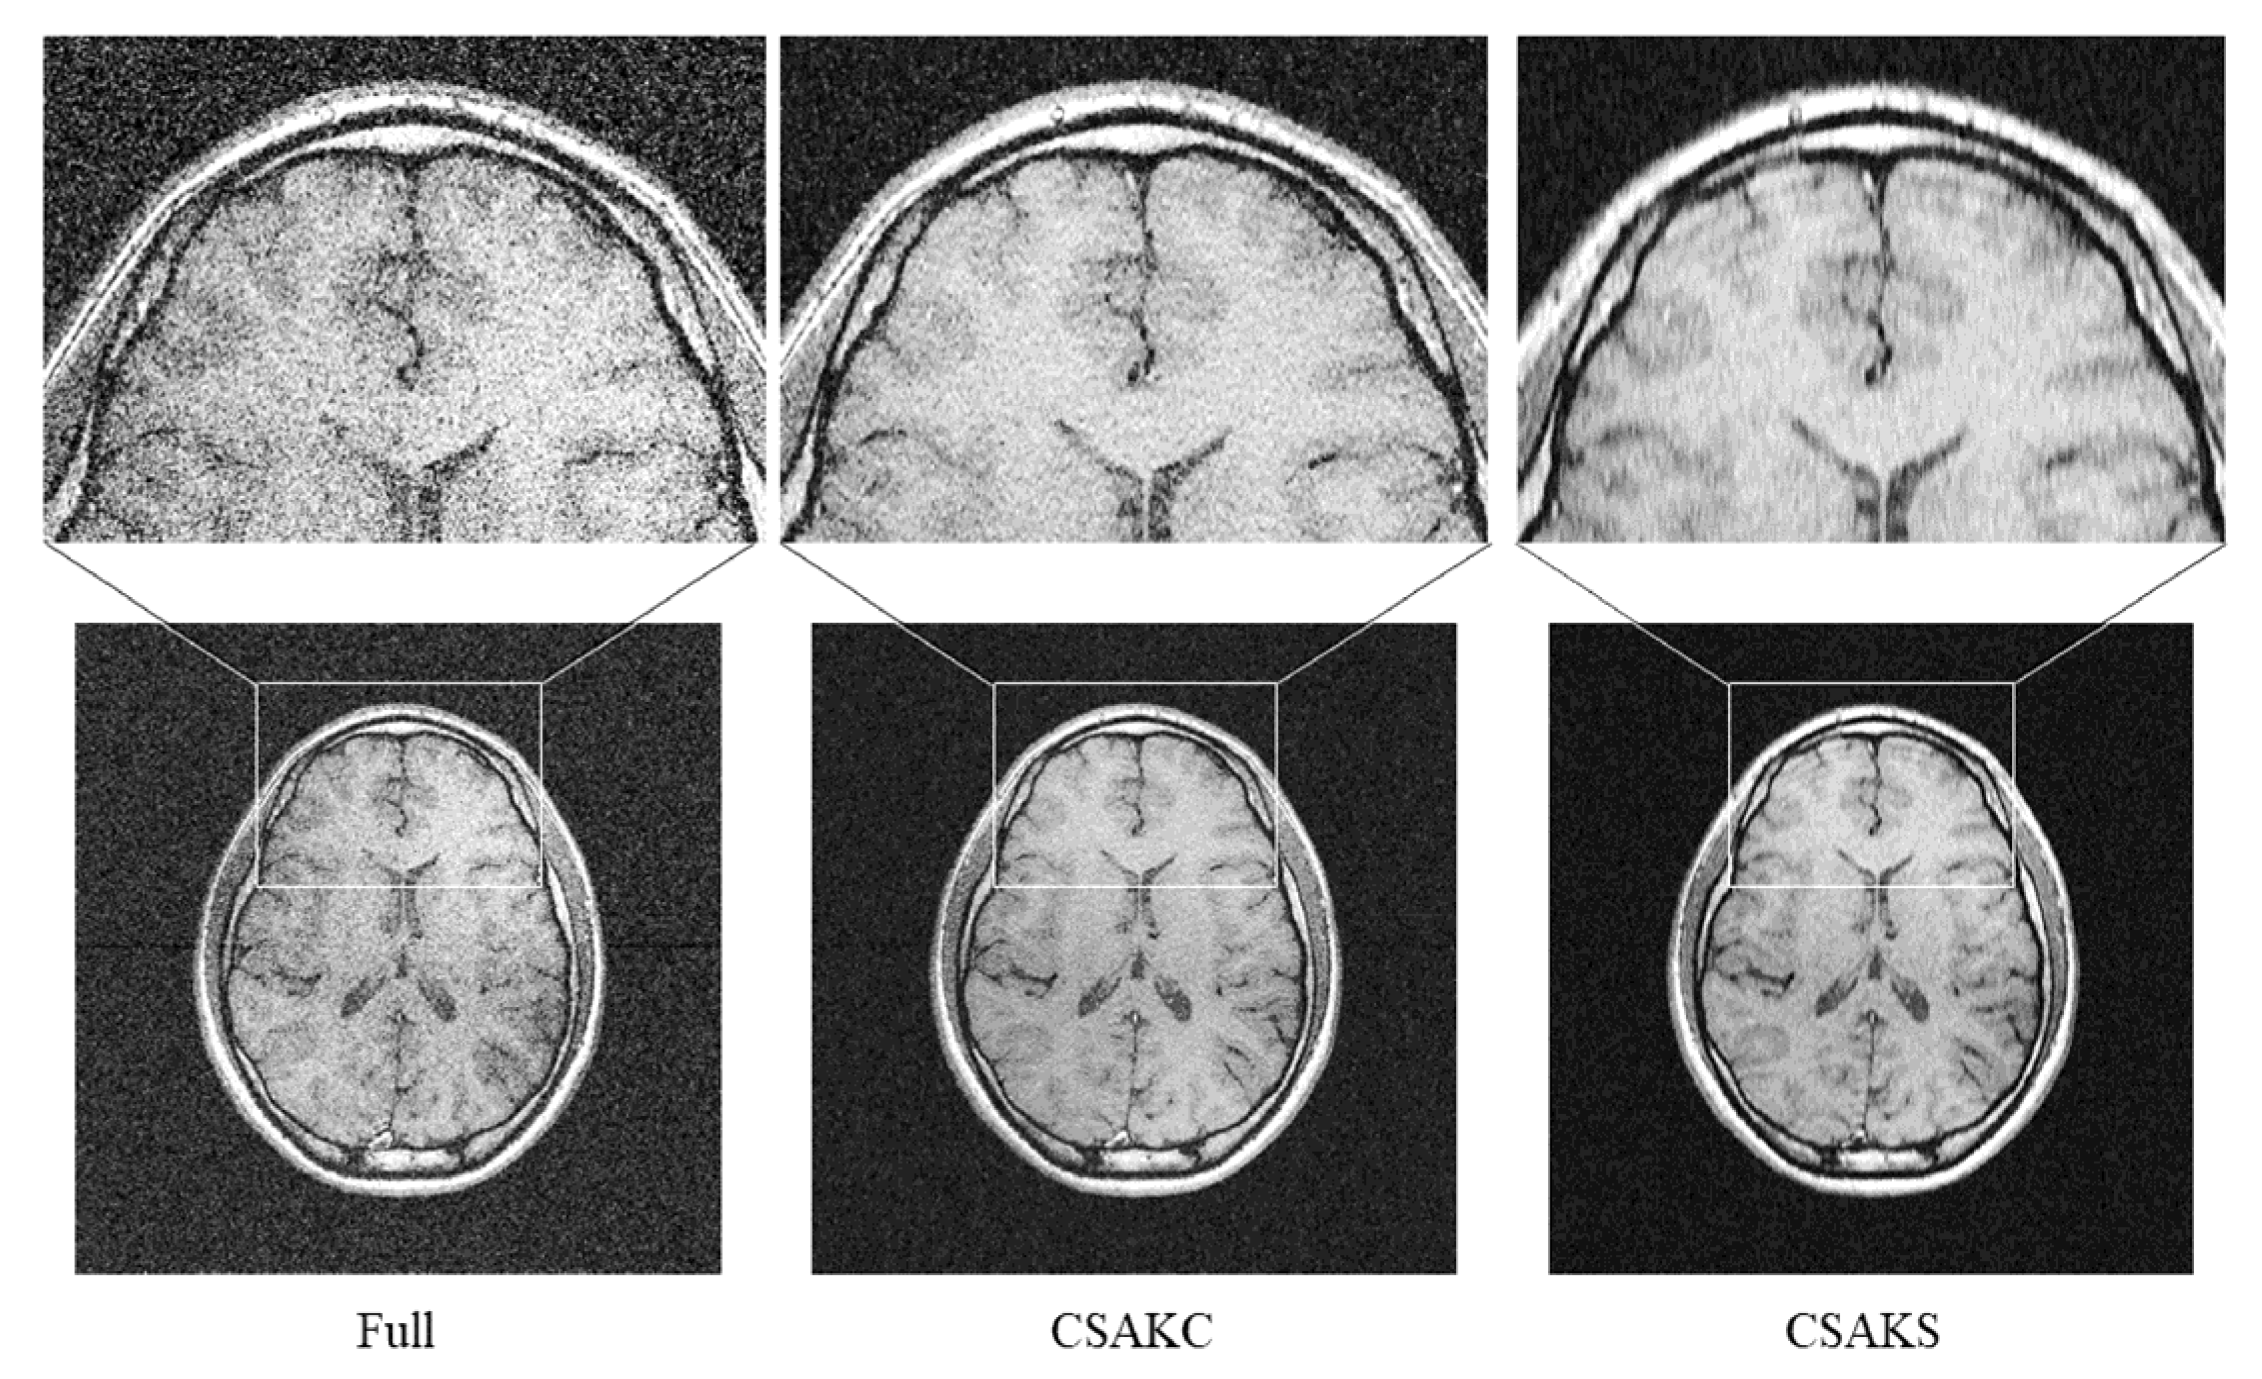
To evaluate the artifacts on the images according to the undersampling ratio (25%, 35%, and 45%), the information from the undersampled k-space lines used for CSAM was used as a mask, and it was applied to the k-space full sampling dataset for the human subject (Figure 2). For the 25%, 35%, and 45% undersampling ratios, SNRs were obtained by setting the region of interest (ROI) in the gray and white matter regions using ImageJ software (1.53e, National Institutes of Health, Bethesda, MD, USA).
Figure 2.
Simulation for k-space undersampling effects. (a) A full sampling image; (b) image reconstructed from the 25% undersampling mask applied to the full sampling dataset; (c) image reconstructed from the 35% undersampling mask applied to the full sampling image; (d) image reconstructed from the 45% undersampling mask applied to the full sampling image.
The k-space data for CSAM, CSAKS, and CSAKC in the brain phantom were reconstructed using the wavelet reconstruction algorithm [18,19], setting the total variation (TV) to 0.001 and the L1 penalty to 0.001. The final CSA image was then obtained by averaging the three reconstructed subset images. Furthermore, averaged profiles and modulation transfer functions (MTFs) were obtained from the predefined ROIs in the CSAM, CSAKS, and CSAKC images, to evaluate their sharpness and spatial resolution characteristics [24,25,26].
3. Results
In comparison with CSAM, the required phase-encoding lines and image acquisition times (TA) in the CSAK method for the undersampling ratios of 25%, 35%, and 45% were reduced by approximately 10%, 15%, and 22%, and 16%, 23%, and 32%, respectively, as shown in Table 2.
Table 2.
Acquisition times for CSA techniques used in brain phantom imaging together with the numbers of phase-encoding lines in parentheses.
The results of the simulation performed using the full k-space sampling dataset obtained from the human participant showed that the CSA images became noisy as the undersampling ratio increased, and the SNR also decreased as the number of sampling lines increased. The SNRs in the white and gray matter regions were 10.41, 9.80, 8.86, and 5.57, and 9.69, 9.35, 8.46, and 5.59, at 25%, 35%, 45%, and 100% (i.e., full k-space sampling), respectively (Table 3). Note that the SNRs in the white and gray matter were 5.57 and 5.59, respectively, for the full k-space. In addition, it was visually confirmed that a circular ringing artifact occurred at the top of the CSAM image, which was most severe at the 25% undersampling ratio (Figure 2). Ringing and blurring artifacts were also found in the CSAM and CSAKS images, although there were some differences depending on the undersampling ratio. However, they were not found in the CSAKC image (Figure 3).
Table 3.
SNR depending on the undersampling ratio in gray and white matter regions.
Figure 3.
CSAM, CSAKS, and CSAKC images at different undersampling ratios in the brain phantom. Unlike CSAKC, linear and blurring artifacts can be seen with CSAM and CSAKS. Artifacts are most severe in the CSAM image.
Figure 4 shows the CSAM, CSAKS, and CSAKC images, line profiles, and MTFs at the 25% undersampling ratio. Ringing and blurring artifacts were clearly seen in the CSAM images (Figure 4a). The slope of the line profile was steepest in the CSAK image, and the edge rise distances for a pixel level between 10% and 90% were 6, 7, and 3 pixels for CSAM, CSAKS, and CSAKC, respectively (Figure 4b). The 50% MTFs were 0.38 line pairs per millimeter (lp/mm), 0.43 lp/mm, and 0.54 lp/mm for CSAM, CSAKS, and CSAKC, respectively, which is 42.86% higher for CSAKC than for CSAM. The 10% MTFs were 0.59 lp/mm, 0.70 lp/mm mm, and 0.97 lp/mm, respectively, showing that CSAKC had 63.64% better inter-tissue contrast than CSAM (Figure 4c). Furthermore, despite using the same CSAK method, no artifacts were found when using CSAKC.
Figure 4.
Mean line profiles and modulation transfer function (MTF) curves of CSA images with 25% undersampling ratio in the brain phantom. (a) CSAM, CSAKS, and CSAKC images and ROIs selected for further analysis; (b) the mean line profiles of each CSA image within the ROI; (c) MTF curves of each CSA image. The line pairs per millimeter (lp/mm) were lowest for CSAM, followed by CSAKS and CSAKC for the same relative MTF value, suggesting that CSAKC showed the best contrast between tissues.
To confirm whether a similar result also occurs in the undersampling ratio acquired from the in vivo human brain, CS reconstruction (TV weight = 0.01, L1 penalty = 0.0001) was performed, and each image was analyzed for comparison. Ringing and blurring artifacts appeared most prominently in the upper part of the CSAKS image with an undersampling ratio of 25%, as in the brain phantom (Figure 5).
Figure 5.
Visual comparison of a full k-space image and CSAK images in a human subject. Although CSAK images were acquired with the same undersampling ratio, the ringing artifacts only occurred when using CSAKS. Note that the acquisition times of the full k-space and CSAK images were 5 m 56 s and 5 m 5 s, respectively.
4. Discussion
In this study, the CSAKC technique was proposed to reduce ringing and/or blurring artifacts caused by the undersampling pattern in CSA techniques. A previous study found that aliasing artifacts could occur when using the CSAKS technique to obtain high temporal and spatial resolution [23]. Therefore, the CSAKC technique was developed to reduce artifacts while maintaining the acquisition time and was evaluated using in vivo human imaging, simulation, and phantom experiments. The results showed reduced ringing and image blurring artifacts.
Through the simulation results, we found a decreased SNR as the number of sampling lines increased during high-resolution imaging. According to Equation (1), when the pixel size of the k-space (∆k) increases, the field of view (FOV) can decrease in the image domain, but when the FOV is fixed, the SNR increases because of the reduction in phase-encoding lines (Ny), which can eventually increase the pixel size (∆y) in the image space through k-space undersampling (Equation (2)).
There were no artifacts in the full k-space sampling for in vivo human imaging, but undersampling simulation images generated from the full k-space dataset demonstrated ringing and blurring (Figure 2). Furthermore, this study also used the brain phantom to investigate whether aliasing in CSA images was an artifact caused by motion or by a lack of sampling lines. The results showed that the smaller the number of sampled lines (i.e., 25%), the greater the number of artifacts. As a result of the analysis, we found that no artifacts occurred in images with full k-space sampling, but that aliasing occurred according to the undersampling ratio even in a motionless brain phantom. This can be interpreted as the result of insufficient k-space sampling numbers, not motion. Furthermore, although CSAKC required a shorter acquisition time, it had no image blurring and a high signal intensity compared with a full k-space image (Figure 5).
Based on these results, it is expected that the proposed technique can be utilized as a method that does not generate artifacts while increasing temporal and spatial resolution. In future studies, it will be necessary to develop a method to reduce the noise generated in the CSAKC method, since the SNR for high-resolution imaging was still insufficient. In addition, it is necessary to compare and analyze the efficacy of the CSAKC method with changes in the SNR according to the magnetic field, by obtaining an image to which this technique is applied at an ultra-high magnetic field strength of 7T. More importantly, it is necessary to further compare the reconstructed images with the acquired real image, since there is a possibility that the acquired phases may be different due to environmental factors such as temperature. In addition, the proposed method should be further evaluated with more subjects, and further quantitative evaluations and technical improvements should be sought, including radially randomly undersampled CSA techniques and temporally rather than spatially randomized CSA techniques. These advanced techniques would be suitable for applications that improve the SNR and examine brain function at high temporal resolution while maintaining spatial resolution. Furthermore, the evaluation of dynamic change in contrast agents is also important for clinical applications.
5. Conclusions
In conclusion, CSAKC was developed for high-resolution imaging, as a method of increasing the number of images while maintaining the acquisition time, and no aliasing artifacts were found in the CSAKC image. Furthermore, the sharpness of the CSAKC image was much greater than that of the other CSA images, with a reduction in blurring artifacts. Therefore, this technique can be used to acquire artifact-free, high-resolution images using a rather low-sensitivity MR system in a short time. This is also expected to be useful when acquiring high-resolution images in patients with claustrophobia and tremor [27].
Author Contributions
Conceptualization, J.-M.S., Y.-B.K. and C.-K.K.; methodology, J.-M.S.; software, J.-M.S.; validation, C.-K.K. and J.-M.S.; formal analysis, J.-M.S.; investigation, Y.-B.K. and C.-K.K.; resources, C.-K.K.; data curation, J.-M.S.; writing—original draft preparation, C.-K.K. and J.-M.S.; writing—review and editing, J.-M.S., Y.-B.K. and C.-K.K.; visualization, C.-K.K. and J.-M.S.; supervision, C.-K.K. and J.-M.S.; project administration, J.-M.S., Y.-B.K. and C.-K.K.; funding acquisition, J.-M.S., Y.-B.K. and C.-K.K. All authors have read and agreed to the published version of the manuscript.
Funding
This work was supported by the National Research Foundation of Korea (NRF) grant funded by the Korean government (MSIT) (2020R1A2C1004355) and the Bio & Medical Technology Development Program of the National Research Foundation (NRF) grant funded by the Korean government (MSIT) (2020M3A9E4104384).
Institutional Review Board Statement
The study was conducted in accordance with the guidelines of the Declaration of Helsinki and approved by the Institutional Review Board (or Ethics Committee) of Gachon University Gil Medical Center (GU-GMC) (protocol code: GDIRB2016-208 and date of approval: 19 July 2016).
Informed Consent Statement
Informed consent was obtained from the subject involved in the study.
Data Availability Statement
The data presented in this study are available on request from the corresponding author.
Acknowledgments
This research was carried out in the Neuroscience Research Institute at Gachon University.
Conflicts of Interest
The authors declare no conflict of interest.
References
- Duyn, J.H.; van Gelderen, P.; Li, T.-Q.; de Zwart, J.A.; Koretsky, A.P.; Fukunaga, M. High-Field MRI of Brain Cortical Substructure Based on Signal Phase. Proc. Natl. Acad. Sci. USA 2007, 104, 11796–11801. [Google Scholar] [CrossRef] [Green Version]
- Maubon, A.J.; Ferru, J.-M.; Berger, V.; Soulage, M.C.; DeGraef, M.; Aubas, P.; Coupeau, P.; Dumont, E.; Rouanet, J.-P. Effect of Field Strength on MR Images: Comparison of the Same Subject at 0.5, 1.0, and 1.5 T. RadioGraphics 1999, 19, 1057–1067. [Google Scholar] [CrossRef]
- Krüger, G.; Kastrup, A.; Glover, G.H. Neuroimaging at 1.5 T and 3.0 T: Comparison of Oxygenation-Sensitive Magnetic Resonance Imaging: Neuroimaging at 1.5 T and 3.0 T. Magn. Reson. Med. 2001, 45, 595–604. [Google Scholar] [CrossRef]
- Springer, E.; Dymerska, B.; Cardoso, P.L.; Robinson, S.D.; Weisstanner, C.; Wiest, R.; Schmitt, B.; Trattnig, S. Comparison of Routine Brain Imaging at 3 T and 7 T. Investig. Radiol. 2016, 51, 469–482. [Google Scholar] [CrossRef] [Green Version]
- Sharma, S.D.; Fong, C.L.; Tzung, B.S.; Law, M.; Nayak, K.S. Clinical Image Quality Assessment of Accelerated Magnetic Resonance Neuroimaging Using Compressed Sensing. Investig. Radiol. 2013, 48, 638–645. [Google Scholar] [CrossRef]
- Gallagher, T.A.; Nemeth, A.J.; Hacein-Bey, L. An Introduction to the Fourier Transform: Relationship to MRI. Am. J. Roentgenol. 2008, 190, 1396–1405. [Google Scholar] [CrossRef] [Green Version]
- Havsteen, I.; Ohlhues, A.; Madsen, K.H.; Nybing, J.D.; Christensen, H.; Christensen, A. Are Movement Artifacts in Magnetic Resonance Imaging a Real Problem?—A Narrative Review. Front. Neurol. 2017, 8, 232. [Google Scholar] [CrossRef]
- Moore, J.; Drangova, M.; Wierzbicki, M.; Barron, J.; Peters, T. A High Resolution Dynamic Heart Model Based on Averaged MRI Data. In Medical Image Computing and Computer-Assisted Intervention—MICCAI 2003; Ellis, R.E., Peters, T.M., Eds.; Springer: Berlin/Heidelberg, Germany, 2003; Volume 2878, pp. 549–555. ISBN 978-3-540-20462-6. [Google Scholar]
- Plenge, E.; Poot, D.H.J.; Bernsen, M.; Kotek, G.; Houston, G.; Wielopolski, P.; van der Weerd, L.; Niessen, W.J.; Meijering, E. Super-Resolution Methods in MRI: Can They Improve the Trade-off between Resolution, Signal-to-Noise Ratio, and Acquisition Time? Magn. Reson. Med. 2012, 68, 1983–1993. [Google Scholar] [CrossRef]
- Pruessmann, K.P.; Weiger, M.; Scheidegger, M.B.; Boesiger, P. SENSE: Sensitivity Encoding for Fast MRI. Magn. Reson. Med. 1999, 42, 952–962. [Google Scholar] [CrossRef]
- Sui, Y.; Afacan, O.; Gholipour, A.; Warfield, S.K. Fast and High-Resolution Neonatal Brain MRI through Super-Resolution Reconstruction from Acquisitions with Variable Slice Selection Direction. Front. Neurosci. 2021, 15, 636268. [Google Scholar] [CrossRef]
- Lohmann, G.; Bohn, S.; Müller, K.; Trampel, R.; Turner, R. Image Restoration and Spatial Resolution in 7-Tesla Magnetic Resonance Imaging. Magn. Reson. Med. 2010, 64, 15–22. [Google Scholar] [CrossRef]
- Suh, C.H.; Jung, S.C.; Lee, H.B.; Cho, S.J. High-Resolution Magnetic Resonance Imaging Using Compressed Sensing for Intracranial and Extracranial Arteries: Comparison with Conventional Parallel Imaging. Korean J. Radiol. 2019, 20, 487. [Google Scholar] [CrossRef]
- Hernandez, D.; Kim, K.-N. A Review on the RF Coil Designs and Trends for Ultra High Field Magnetic Resonance Imaging. Investig. Magn. Reson. Imaging 2020, 24, 95. [Google Scholar] [CrossRef]
- Park, C.-R.; Kang, S.-H.; Lee, Y.-J. Feasibility of Total Variation Noise Reduction Algorithm According to Various MR-Based PET Images in a Simultaneous PET/MR System: A Phantom Study. Diagnostics 2021, 11, 319. [Google Scholar] [CrossRef]
- Holmes, C.J.; Hoge, R.; Collins, L.; Woods, R.; Toga, A.W.; Evans, A.C. Enhancement of MR Images Using Registration for Signal Averaging. J. Comput. Assist. Tomogr. 1998, 22, 324–333. [Google Scholar] [CrossRef]
- Eichner, C.; Cauley, S.F.; Cohen-Adad, J.; Möller, H.E.; Turner, R.; Setsompop, K.; Wald, L.L. Real Diffusion-Weighted MRI Enabling True Signal Averaging and Increased Diffusion Contrast. NeuroImage 2015, 122, 373–384. [Google Scholar] [CrossRef] [Green Version]
- Lustig, M.; Donoho, D.L.; Santos, J.M.; Pauly, J.M. Compressed Sensing MRI. IEEE Signal Process. Mag. 2008, 25, 72–82. [Google Scholar] [CrossRef]
- Lustig, M.; Donoho, D.; Pauly, J.M. Sparse MRI: The Application of Compressed Sensing for Rapid MR Imaging. Magn. Reson. Med. 2007, 58, 1182–1195. [Google Scholar] [CrossRef]
- Jung, H.; Sung, K.; Nayak, K.S.; Kim, E.Y.; Ye, J.C. K-t FOCUSS: A General Compressed Sensing Framework for High Resolution Dynamic MRI. Magn. Reson. Med. 2009, 61, 103–116. [Google Scholar] [CrossRef]
- Gamper, U.; Boesiger, P.; Kozerke, S. Compressed Sensing in Dynamic MRI. Magn. Reson. Med. 2008, 59, 365–373. [Google Scholar] [CrossRef]
- Kang, C.-K.; Kim, H.-K. Compressed-Sensing Technique Combined with Key-Hole Acquisitions for SNR Enhancement. Appl. Magn. Reson. 2016, 47, 823–834. [Google Scholar] [CrossRef]
- Lee, K.-J.; Park, C.-A.; Kang, D.; Son, Y.-D.; Kim, H.-K.; Lee, Y.-B.; Kang, C.-K. High-Resolution Imaging Using Keyhole-Based Compressed Sensing Averaging (CSAK) Technique. JMAG 2020, 25, 164–171. [Google Scholar] [CrossRef]
- Smith, S. Digital Signal Processing: A Practical Guide for Engineers and Scientists; Elsevier: Amsterdam, The Netherlands, 2013; ISBN 978-0-08-047732-9. [Google Scholar]
- Fellner, C.; Müller, W.; Georgi, J.; Taubenreuther, U.; Fellner, F.A.; Kalender, W.A. A High-Resolution Phantom for MRI. Magn. Reson. Imaging 2001, 19, 899–904. [Google Scholar] [CrossRef]
- Mohapatra, S.M.; Turley, J.D.; Prince, J.R.; Blechinger, J.C.; Wilson, D.A. Transfer Function Measurement and Analysis for a Magnetic Resonance Imager: Technical Note: Transfer Function Measurement and Analysis. Med. Phys. 1991, 18, 1141–1144. [Google Scholar] [CrossRef]
- Wahid, A.; Shah, J.A.; Khan, A.U.; Ahmed, M.; Razali, H. Multi-Layer Basis Pursuit for Compressed Sensing MR Image Reconstruction. IEEE Access 2020, 8, 186222–186232. [Google Scholar] [CrossRef]
Publisher’s Note: MDPI stays neutral with regard to jurisdictional claims in published maps and institutional affiliations. |
© 2021 by the authors. Licensee MDPI, Basel, Switzerland. This article is an open access article distributed under the terms and conditions of the Creative Commons Attribution (CC BY) license (https://creativecommons.org/licenses/by/4.0/).