Abstract
A Magnetotelluric profile stretching northward from the Wulungu Depression (on the northern margin of the Junggar Basin) to the Dulate arc (crossing the Zhaheba–Aermantai ophiolite belt) was carried out in an attempt to probe the crustal structure and properties of the East Junggar, NW China. Along the profile, the inversion model was used to determine the electrical structure of the crust and uppermost mantle. The results revealed that the crust of the eastern Junggar Basin is composed of the shallow low resistivity layer and underlying high resistivity bodies. There is a crustal detachment in the basement: the upper layer is a Hercynian folded basement and the lower is a Precambrian basement. The Zhaheba complex is characterized by relatively high resistivity, with a thickness of ~5 km, the bottom controlled by the Zhaheba–Aermantai fault. The crust of the Yemaquan arc is composed of the residual continental crust, characterized by stable resistance. The exposed intrusive rocks are characterized by irregular resistors. The crust of the Dulate arc is characterized by relatively low resistivity. The shallow low resistivity layers represent the Zhaheba depression composed of the Devonian-Permian volcanic and sedimentary rocks. The crustal conductive anomalies are related to the magmatism and mechanism of metal deposits in the post-collision period.
1. Introduction
The Central Asian Orogenic Belt (CAOB) is one of the largest accretionary orogens structurally located between the Siberian and Europe cratons to the north and the Tarim and North China cratons to the south (Figure 1a). The East Junggar is a key constituent of the CAOB, which located in the northeast of the Junggar block. It is characterized by Paleozoic island arcs, ophiolitic mélanges, granites, and sedimentary units [1,2], which comprises Paleozoic accretionary complexes that formed during northward subduction and accretion/collision related to the Paleo-Asian Ocean [3,4,5]. In recent decades, the U–Pb ages of the Cambrian to Carboniferous ophiolite belts show that the southern Karamaili ophiolite, the middle Zhaheba ophiolite, and the northern Kuerti ophiolite have a wide range of ages from 417 to 330 Ma, 503 to 406 Ma, and 389 to 332 Ma, respectively [6,7,8]. The Yemaquan arc and Dulate arc are clamped between the Karamaili ophiolite and the northern Kuerti ophiolite, which are separated by the Zhaheba ophiolite. Some studies inferred a continental island arc setting for the Yemaquan arc [2,9]. On the other hand, others suggested that the compositions of volcanic and plutonic rocks from the Yemaquan arc are consistent with an intra-oceanic island arc setting during the early Paleozoic [10,11]. The Dulate magmatic arc was thought to be formed as a result of the southward subduction of the Ocean plate, whereas the formation time remains controversial [12,13]. The Carboniferous sedimentary rocks were interpreted to form in back-arc setting, which was related to the rollback of the Ocean subduction zone [14,15].
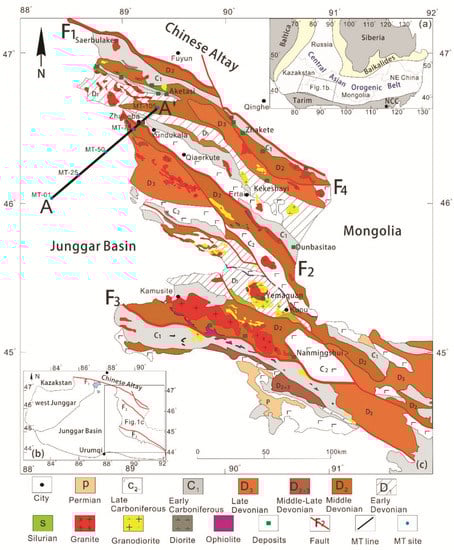
Figure 1.
(a) Location of the Junggar terrains in the Central Asian Orogenic Belt. (b) Distribution of the West Junggar, Junggar Basin, and East Junggar. (c) Geological map of the East Junggar showing MT line locations. F1: the Erqis Fault, F2: the Zhaheba-Armantai Fault, F3: the Kelameili Fault, F4: Fuyun Fault (modified from [23]).
Moreover, the basement nature of the Junggar terrane was highly controversial for a long time, which hampered us from the tectonic evolution of the East Junggar area. Some authors suggested that the crust of the Junggar block is composed of the Precambrian basement [16,17,18,19]. In contrast, others maintained that its formation is related to multiple Paleozoic subduction–accretion systems [20,21,22,23]. The gravity and magnetic study revealed that the southwestern Chinese Altai and the northeastern Junggar Basin seem to contain the mafic basement [24]. Additionally, the comprehensive geophysical research showed that the ultramafic rocks may have squeezed into the crust, which are characterized by high seismic velocity, high density, and high magnetic intensity [25]. Zhao reported that the basement of the East Junggar has two layers, i.e., an upper layer comprising a Hercynian folded basement, and a lower layer composed of a paleocrystalline basement [26]. The elastic wave velocities of the granitoids from Eastern Junggar show that the upper crust of the Eastern Junggar is composed of the alkali feldspar granite, alkali granite, and monzogranite, while the middle crust is composed of quartz diorite [27]. Due to the lack of high-resolution geophysical data, the understanding of the basement has not been unified. In addition, the Magnetotelluric research in the study area is still rare, which is commonly used to analyze the deep structure of the crust [28].
This paper studied the electrical structure of the East Junggar crust by setting up a magnetotelluric profile with a length of 105 km. We estimated geoelectric strike directions by the tensor decomposition method to analyze the structural orientation in the study area. The result of MT inversion was interpreted to reveal the crustal structure and basement of the East Junggar. In addition, we discussed the relationship between high conductivity in crust and mineralization.
2. Regional Setting
2.1. Regional Geology of the East Junggar
The East Junggar is located at the northeastern margin of the Junggar Basin (Figure 1a) and between the Early Paleozoic Chinese Altai arc and the Late Paleozoic Harlik arc, which are separated by the Kuerti ophiolite to the north and the Karamaili ophiolite belt to the south [15,29]. The East Junggar comprises the Dulate arc in the north and southern Yemaquan island arc unit in the south formed during subduction–accretion processes of the southern Paleo-Asian Ocean [30,31,32], which are separated by Zhaheba–Aermantai ophiolite belt. The Zhaheba complex is located in Eastern Junggar in Xinjiang Province, China (Figure 1b), which is a significant the southwest segment of the Central Asian Orogenic Belt (CAOB). It is tectonically bounded by the Dulate arc in the north and the Yemaquan island arc in the south. The Dulate arc comprises mainly Devonian–Carboniferous volcanic and sedimentary rocks, including Nb–rich and potassic basalt [1] and associated Cu–Zn ore deposits [33]. The Yemaquan arc consists mainly of Devonian–Carboniferous coastal shallow marine clastic rocks and volcanic rocks, granitoids, and adakitic rocks [34,35].
The Zhaheba–Armantai ophiolites passed through the Armantai mountain to the Beita mountain from east to west, in the NWW-trending belt of about 150 km long and 3–5 km wide, mingled in the Lower Devonian Tuoranggeku Formation and the upper Devonian Cassiweng formation (Figure 1c), in the faulted contact with surrounding rocks. The Zhaheba complex represents the northwestern section of the Zhaheba–Almantai ophiolite belt (Figure 1c), which consists mainly of serpentinized peridotite, dunite, gabbro, pillow basalt, plagioclase granite, carbonate, and layered siliceous rock. Ultramafic rocks, the most widely distributed lithology in the study area, comprise harzburgite, dunite, and minor pyroxenite. The gabbro mainly comprises plagioclase and clinopyroxene. The gabbro and diorite form large bodies, respectively. Basalts are common and show pillow structure. Diabase dikes and the diorite porphyry intrude ultramafic rocks. Volcaniclastic rocks comprise tuffs, tuffaceous sedimentary rocks, and breccia.
The strata in the area are fully exposed, most of which are Paleozoic strata. Devonian and Carboniferous strata are most widely distributed. Additionally, Silurian and Permian strata are distributed in the middle and southeast of the study area. Cenozoic strata are widely distributed in the east and southwest of the study area. The Silurian strata consists of siliceous siltstone, slate, and phyllite. The Devonian–Carboniferous strata are divided, from bottom to top, into the lower Devonian Tuoranggekuduke Formation (D1t), the Middle Devonian Beitashan Formation (D2t), the Upper Devonian Kaxiweng Formation (D3k), the Lower Carboniferous Batamayineishan Formation (C1bt), Heishantou Formation (C1h) and Jiangbasitao (C1j), the Upper Carboniferous Batamayineishan Formation (C2bt). The Tuoranggekuduke Formation is composed of tuff and sandstone. The overlying Beitashan Formation is composed of tuffaceous clastic rocks and medium basic crystalline clastic tuff. The Kaxiweng Formation is composed of fine clastic rocks and andesite porphyrite and tuff. The Heishantou Formation is composed of calcareous pyroclastic rocks and continental clastic rocks. The Jiangbasitao Formation is composed of conglomerate and sandy conglomerate. The Batamayineishan Formation is composed of volcanic lava, tuff, and tuff breccia. Permian strata are rarely exposed and mainly consist of A-type granites and felsic volcanic rocks.
The fold structures in the study area are composed of a series of northeast trending tight linear folds. The ophiolite is exposed at the core of complex anticline, which is distributed in NW–SE direction, with an extension length of 11 km and a width of about 3 km. The main faults include Erqisi fault, Zhahaba-Aermantai fault, Kalamaili fault, and Fuyun fault. Each major fault has a strong thrust nappe property. The secondary thrust faults converge to the boundary fault of thrust nappe in the deep, and the shear strike slip activity is superimposed in the later stage, which has the characteristics of multi-stage evolution.
2.2. Resistivity Characteristics
Physical properties of rocks are the basis for geophysical inversion and interpretation, as well as the link between geophysics and geology. Most of drilling wells in Wulungu depression encounter Cretaceous, Jurassic, Triassic, and Carboniferous, and the Carboniferous is not drilled through. The Neogene is rarely encountered, with a resistivity of 4.7 Ω·m, and the Cretaceous is generally low, with a resistivity of 5.3 Ω·m. The resistivity of Jurassic is 14.5 Ω·m and the resistivity of Triassic is 13.65 Ω·m. The resistivity of Carboniferous is 341 Ω·m. Well Fucan 1 is located in the Zhaheba depression. The Quaternary thickness is 26.00 m on the surface, and overlying strata is the Carboniferous Batamayineishan Formation with a depth of 1780.00 m. The resistivity range of Quaternary stratum is 5.4–33.7 Ω·m, and the resistivity range of Carboniferous Batamayineishan formation is 30–1760 Ω·m. Table 1 lists the electrical parameters of the main rocks in the study area. The resistivity of sedimentary rocks from Cenozoic to Permian is low, and the resistivity of Carboniferous sedimentary rocks is low and medium. The resistivity of Carboniferous Pyroclastic rocks is medium and high. The resistivity of metamorphic rocks from Devonian to Ordovician is high and the resistance of magmatic rocks is highest. In general, the resistivity of sedimentary rocks is low, and the resistivity of metamorphic rocks is medium and high, and the resistivity of magmatic rocks is highest.

Table 1.
Rock physical property parameters in study area.
3. Data Acquisition and Analysis
3.1. Data Acquisition
With the support of the China Geological Survey project, one magnetotelluric sounding profile was set up in the study area. The location of survey line is shown in Figure 1b. The magnetotelluric sounding profile started from the Wulungu depression in the south and reached the northwest of the Dulate arc in the north, with a total length of 105 km. There were 100 magnetotelluric sounding points, with an average distance of 1 km. The measuring instrument was an MTU-5A. We measured three mutually orthogonal magnetic field components (Hx, Hy, and Hz) and two mutually orthogonal electric field components (Ex and Ey). The subscripts x and y indicate the north–south direction and the east–west direction, respectively. The acquisition frequency band of the instrument was 0.003 s–3000 s. To reduce the influence of random noise on data quality, the observation time was more than 14 h.
3.2. Data Processing
Magnetotellurics (MT) is a geoelectrical sounding method used for estimating the Earth’s electrical conductivity structure on the basis of electromagnetic induction [36]. The impedance tensor, Z, relates the horizontal electric and magnetic fields recorded at a specific location, at the Earth’s surface. Additionally, we examine the impedance of the Earth:
where and are the electric and magnetic field variations, respectively. The apparent resistivity ρ can be given:
where is the angular frequency, is the magnetic permeability of free space. The phase ϕ is given by
The recorded time series at MT-Stations were transformed from the time domain to the frequency domain by Fourier transform. The robust algorithm was used to compute the magnetotelluric response functions [37]. The robust processing scheme results in a period band ranging from 0.001 to 1000 s are shown in Figure 2. The apparent resistivity and phase curves of MT points in the study area show the different electrical characteristics in different tectonic units. The apparent resistivity and phase curves of MT-01 represent the electrical structure of the Wunlungu Depression, which has low resistivity with typical basin resistivity characteristics. The apparent resistivity and phase curves of MT-40 reveal the electrical structure of the Yemaquan island arc, which has low resistivity in the shallow part and high resistivity in the deep part of the crust. The apparent resistivity and phase curves of MT-80 reveal the electrical structure of the Zhaheba complex, which has the high resistivity in general. The apparent resistivity and phase curves of MT-102 show the electrical structure of the Dulate arc, which has the low-high-medium resistivity.
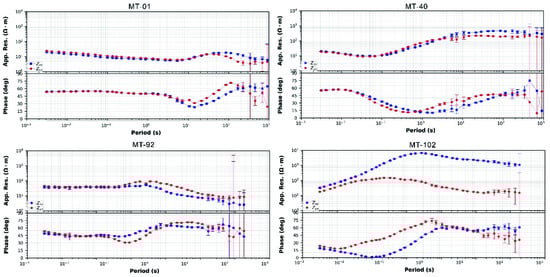
Figure 2.
The apparent resistivity-phase curves of MT stations from different parts of the study area.
3.3. Dimensionality and Strike Analysis
In complex geological conditions, the impedance tensor is often affected by galvanic distortions, which are caused by localized, near-surface heterogeneities near the measurement location [38]. Galvanic distortions may result in subsurface artifacts during inversion. The distortion analysis can eliminate the influence of the near-surface heterogeneities from the measured MT impedance tensor. The distortion analysis methods used for distortion removal are deriving a solution for the regional (undistorted) impedance tensor. These methods also determine the impedance tensor that represents the regional structure alone and analyzes the dimensionality of the regional structure [39,40].
The dimensionality and directionality analysis provides an important basis to determine if 2D or 3D modeling methods could be proper for the MT data. In 2D modeling methods, MT data can be decomposed into the transverse electric (TE) mode data and transverse magnetic (TM) mode data, along two orthogonal directions that are perpendicular and parallel to the strike direction. Then these two groups of data can be inverted respectively or jointly. Thus, a regional strike direction along the profile must be determined in advance. We applied a tensor decomposition to estimate geoelectric strike directions [41], which are shown in Figure 3 by the format of the statistic rose diagram. The rose diagrams show that the electrical strike directions are relatively complex, the regional geological strike direction is NW–SE in general. Figure 3 shows the strike directions in the intervals of 0.001–0.01, 0.01–0.1, 0.1–1, 1–10, 10–100, 100–1000, 1000–10,000 s, which shows that the electrical strike directions are ~N37.5°E. The principal axis describes the regional strike direction, which has an uncertainty of 90°. Therefore, the direction of electrical strike was determined to be S127.5°E, considering the geological structure direction of the faults and structures.
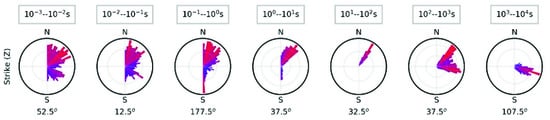
Figure 3.
Geoelectric strike direction for different period bands: 10−5–10−4 s; 10−4–10−3 s; 10−3–10−2 s; 10−2–101 s; 100–101 s; 101–102 s; 102–103 s; 103–104 s; strike directions are shown as rose diagrams with a range of 0–180 degrees, where 0 is North and 90 is East. Rose diagram in each subfigure shows the statistical result of regional strike direction in the corresponding period band for all stations along the profile. Long bars on each site indicate the preferred principal axis which presents possible strike directions.
Phase tensors in Figure 4 were calculated to reveal the dimensionality of the subsurface structure [41], which has the advantage of avoiding near-surface conductivity heterogeneity effects. We found most of the stations are of relatively small skew angles (<5°) over different period bands. The shallow part of the study area indicates the smallest skew, while the ellipses of some of the stations approach circles, which represent a 1D character that may be related to surface cover. Larger skew angles for some stations are distributed beneath the Wulungunan fault zone and the shapes of phase tensor ellipses are strong ellipticity, which suggests that the crust is unstable and complex. For the stations beneath the Wulungu Depression, the shapes of phase tensor ellipses are close to round circles, which suggest that the uniform crust in this region is generally of 1D character. The stations beneath the East Junggar Orogenic Belt in longer periods (in 100–1000 s, skew angles >5°) indicate complex subsurface structures in this region. In general, we conclude the dimensionality of the profile is 2D, and 2D inversion procedures are applicable to our dataset.
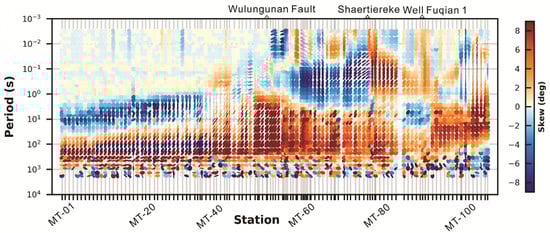
Figure 4.
The phase tensor ellipses of each MT station at different period bands. Phase tensor ellipses are shaded according to skew value. The small value of the skew angle indicates that one of the principal axes of the phase tensor is oriented close to the regional strike direction in 2D and 3D cases.
3.4. MT Inversion
The MT data were decomposed into two independent modes and the TM mode is defined as Transverse Magnetic mode. The TM mode is more sensitive to resistive structures and is more stable under the 3D effects caused by conductors [42]. There are many algorithms in use for regularized 2D inversion of magnetotelluric data. Constable et al. (1987) find nonlinear least-squares solutions subject to a smoothness constraint (OCCAM method) [43]. Siripunvaraporn (2000) present a new and much more efficient variant on the OCCAM scheme, called as REBOCC [44]. Rapid relaxation inversion (RRI) has been developed which can be very fast, but in practice often fails to converge without significant expert user intervention [45]. Rodi (2001) employs a nonlinear conjugate gradients (NLCG) scheme to minimize an objective function that penalizes data residuals and second spatial derivatives of resistivity [46]. Therefore, we inverted the MT data with 2D nonlinear conjugate gradients algorithm. Constable believes that the inversion model should be as simple and smooth as possible, and the roughness should be as small as possible under the condition that the fitting difference meets the requirements, so as to suppress the redundant structure from non-real data [43]. We plotted the RMS curve to determine the roughness regularization parameter (τ), which balances the model roughness with root-mean-square misfits (Figure 5). The RMS curve shows that the best roughness regularization parameter is 10. Then, we invert the TM data with the error floor, for TM apparent resistivity and phase are set to be 10% and 1°. All inversions are started from a 100 Ωm uniform half space. The number of inversion iterations was 200 and the RMS misfit for the final model is 2.16103 in general. The comparison of observed data and response data is shown in Figure 6. It can be seen that data are generally well fit along the profile. Most stations have RMS <3. However, some stations, such as stations 14, 44, 55, and 105 have larger RMS, indicating poor fitting. The RMS values for individual stations (Figure 7) indicate that the highest misfits occur at the Wulungunan fault zone. The RMS misfit value is low and pseudo sections of observed and calculated data are similar. These results indicate a proper fitting and prove the final model is reliable.
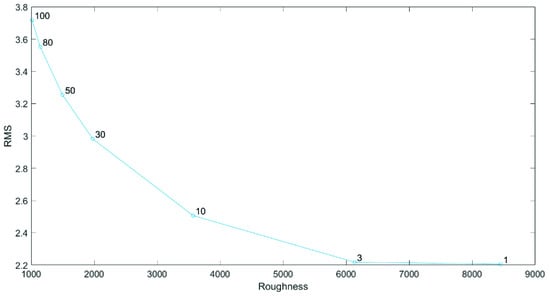
Figure 5.
Model roughness and RMS curve (L-curve) obtained by inversion of different regularization.
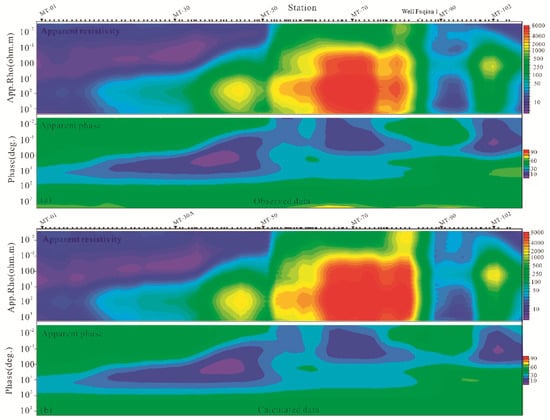
Figure 6.
(a) Observed apparent resistivity and phase in pseudo section format for the profile. (b) Response of the 2D model. The similarities between pseudo sections of observed and calculated data prove the final model is reliable.
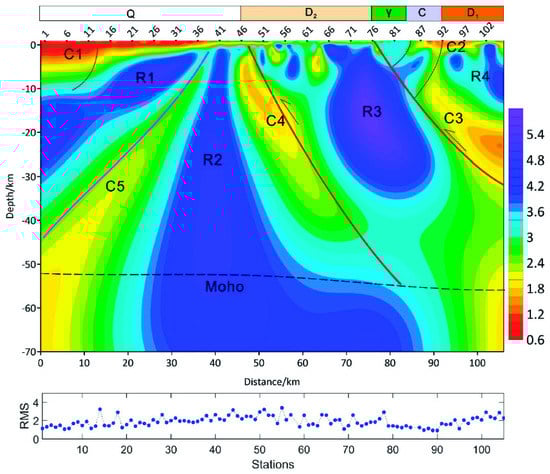
Figure 7.
Two-dimensional resistivity model and the RMS of every MT point.
4. Results of the 2D Inversion
The most distinct feature of the 2D inversion model is the widely distributed conductive channels along the MT profile (Figure 7), which divided the electrical model into several resistive blocks. We marked them as conductors C1-C5 and some resistive regions are marked as resistive blocks R1–R4. The 2D inversion model has significant differences between Junggar Basin and the Dulate-Yemaquan island arc.
Sedimentary rocks in the Junggar Basin are characterized by a horizontal zone (C1 in Figure 7) of low resistivity (10 Ωm–100 Ωm), with a wedge thickness of about 100 m–4 km. The upper crust is imaged as >10,000 Ωm zone (R1, R2) with a thickness of ~20 km beneath the Junggar Basin, dipping to south. There is a strip zone (C5) between R1 and R2, characterized by resistivity values (>100 Ωm), decreasing from the low crust to the upper crust. It reveals that the Junggar Basin is probably characterized by double basement structure. R1 may represent the Paleozoic basement and R2 is mainly composed of the crystalline basement. C5 is the detachment between the Paleozoic basement and the crystalline basement of the upper crust. A north-dipping low-resistivity belt (C4) characterized by resistivity values (50 Ωm–200 Ωm), is interpreted as the Wunlungunan fault, which controls the sedimentary boundary of Wulungu depression. The resistive upper crust (R3) under the Yemaquan island arc with a thickness of about 30 km, is characterized by resistivity values of ~10,000 Ωm, which probably represents residual Precambrian continental crust. There are some conductors and resistors in the shallow part of the Yemaquan island arc, which reveals complex faults and folds in Lower Paleozoic. The Zhaheba complexes are imaged as a block resistor with resistivity values (~1000 Ωm). A horizontal zone (C2) of low resistivity (<100 Ωm) in the shallow part of the Dulate arc, is interpreted as Lower Paleozoic volcanic sedimentary rocks with a thickness of about 100 m–3 km. Irregular resistors of resistivity (~3000 Ωm) in the upper crust under the Dulate represent the Lower Carboniferous granite and granodiorite, considering the outcrops. The north-dipping channel of low resistivity (~50 Ωm) is interpreted as the Zhahaba-Aermantai fault, being probably a pipeline for hot material flow.
5. Discussion
5.1. Crustal Structure Beneath Junggar Basin
The seismic and well data in Wulungu Depression reveal the folded basement in late Paleozoic [47], which is characterized by medium resistivity. The shallow electrical characteristics in the MT model show that a large-scale regional unconformity exists between Paleozoic and Mesozoic strata, which is related to Hercynian movements. Paleozoic strata are widely distributed in the study area, which are composed of volcanic and sedimentary rocks. The results of the 2D inversion model reveal that the upper crust of the northern Junggar Basin is characterized by double basement structure, which is corresponding to the results of gravity and seismic profile [26]. The upper layer is Hercynian folded basement and the lower layer is characterized by high resistivity, which is interpreted as the crystalline Precambrian basement. The lower crust of the northeastern Junggar Basin is mainly characterized by high resistivity, which suggests the crust is relatively stable. However, there is a relatively low-resistivity zone in the crust, indicating the crustal detachment between young crust and old crust. The heterogeneity of crustal material indicates that the composite basement formed by splicing in different periods. The crust beneath the Junggar Basin dips to south, indicating the Yemaquan arc converged to the south.
5.2. Crustal Structure Beneath Yemaquan and Dulate Arc
The shallow part of crust beneath the Yemaquan arc is characterized by complex electrical structure and block high resistance bodies are separated by high conductors. These block high resistance bodies are interpreted as the granite bodies which are widely distributed in the Yemaquan arc. The local low-resistivity zones represent the faults produced by the thrust nappe structure function in the subduction–collision–accretion process. The upper crustal structure beneath Yemaquan arc is characterized by uniform and stable resistance, which indicates it does not belong to the Paleozoic crust basement. Middle Ordovician metamorphic rocks were found in the Kalamaili Mountain [48] and a large number of Precambrian detrital zircons were obtained from Devonian sandstones [49], which indicates the basement can potentially be identified as a Precambrian continental block. In addition, Ordovician–Silurian granites in the Taheir exhibit some distinct evidence of Andean-type arc continental arcs and igneous rocks are mixtures of the juvenile material and old crust, which is not likely the oldest oceanic crust in East Junggar [2]. In a geophysical point of view, the mafic lower-crustal composition was interpreted in the seismic section [50]. The crustal basement is characterized by deep-seated and highly magnetic and density anomalies and high velocity [24,25], which can be interpreted as mafic rocks. Some researchers reported that the felsic rocks are related to the mafic magmas and the petrogenetic models are still controversial [34,51,52,53]. The partial melting of crustal rocks model conflict with the high resistivity and velocity of the crustal basement. In addition, mafic magma underplating and intraplating cannot cause thick and homogeneous upper crust. The resistive crust is probably formed before the Cambrian, as the residual continental crust. The north-dipping resistive crust indicates the northward subduction of the Zhaheba–Almantai ocean. A low-resistivity zone in the crust between the Junggar Basin and the Yemaquan arc is interpreted as the splicing zone between residual continental margin arc and island arc.
The shallow part of crust beneath the Dulate arc is characterized by low resistivity, which represents the Zhaheba depression composed of the Devonian-Permian volcanic and sedimentary rocks according to the study from surface exposures and Well Fuqian-1 [52] and Xinfudi-1 [53]. Underlying high resistivity bodies are interpreted as the granite bodies which are widely distributed in the Dulate arc. The crust beneath the Dulate arc is characterized by low resistivity in general, which is significantly different from that of the Yemaquan arc. Several mechanisms were proposed to explain the conductive anomalies in the crust. Partial melting is probably an appropriate candidate for the East Junggar tectonic belt. However, the range of crustal geothermal values in the Junggar basin are 18.8–26 mW/m2 and the range of mantel geothermal values are 16.5–23.7 mW/m2, which is also lower than the average value of terrestrial heat flow in mainland China [54]. Therefore, the cold crust and mantle in the East Junggar do not support the partial melting. Sulfides and the interconnected graphitic thin films are also the candidates to cause low resistivity. The Cu–Ni sulfide deposit [55], Cu–Zn deposit [33], Au deposits [56], and graphite deposit [57] in the study area are developed and have been studied for decades. The metallogenic mechanisms of metal and graphite deposit are related to the magmatism of the plate subduction collision. Therefore, the low resistivity belt is probably the metal ore-bearing magma channel.
5.3. The Zhaheba Complex and Fault
The Zhaheba complex is characterized by relatively high resistivity, with a thickness of ~5 km. Considering that the width of the exposed complex ranges from 1 to 3 km, the greatest thickness of the Zhaheba complex is inferred as 5 km. The folded resistors indicate the complexity of lithology and structure of the Zhaheba complex. The folds are controlled by a series of thrusts. There is significant unconformity in the contact surface between the Zhaheba complex and the crystalline crust, which is interpreted as the Zhaheba-Almantai fault. The resistive crust beneath the Zhaheba complex is uniform and stable, which indicates the Precambrian basement. During the late Cambrian to the early Ordovician period, the older basement of the Zhaheba–Aermantai ophiolite was formed by the subduction of the Palaeo-Asian Ocean to the Altai arc, which is represented by the gabbro and ultramafic rocks [58].
There are electrical gradient zones between the Yemaquan and Dulate arc, cutting into the upper mantle, which is interpreted as the Zhaheba-Almantai fault. On the south of the Zhaheba fault, the crust is characterized by the high resistance, while the crust on the north of the Zhaheba fault is characterized by the relatively high conductor. The southeast trending Zhaheba fault was tending to north according to the electrical profile. During the Early Paleozoic period, the Zhaheba complex accreted along the Zhaheba fault. During the late Paleozoic period, Magma upwelled along the Zhaheba fault as the magma channel, produced by the post-collisional event.
5.4. Tectonic Significance and Metal Deposits
From the Late Cambrian to the Early Ordovician, the Zhaheba–Almantai Ocean subducted northwards beneath the Chinese Altai arc and the Zhaheba–Almantai ophiolite accreted to the accretionary wedge. The substance exchanged between the mantle and lower crust in the subduction zone which led to enrichment and formation of the chromite in the Zhaheba area. During the Late Ordovician to the Devonian, the Zhaheba–Almantai Ocean converged and spliced to the Chinese Altai arc and the Dulate arc formed to the north of the Zhaheba–Aermantai ophiolite belt and was subducted by the Kuerti-Erqis Ocean. Under the subduction island arc tectonic background, the depleted mantle in the subduction zone melted to form medium basic magma, and a set of marine clastic rocks and medium basic volcanic rocks formation developed, which is rich in Cu-Au elements. During the Early Carboniferous, the Paleo-Asian Ocean had been completely closed and the syn-collision turned to the post-collision. Thrust faults and ductile deformation zone are formed in the collision zone, which control the metallogenic structure. During the Late Carboniferous to the Early Permian, the post-collision and continental stretching event happened in the East Junggar. The asthenospheric upwelling and lithospheric thinning brought magmatic underplating and intrusion and formed the Cu-Mo-Au deposits. Alkaline granite intruded into Devonian Carboniferous carbonaceous clastic rocks, transforming organic carbon into graphite and forming the graphite deposit in the East Junggar. The Early Permian Magmatism provides a material source and heat source for gold mineralization. The ductile brittle shear zone provides a good structural channel for the rise and migration of deep metallogenic hydrothermal solution. Therefore, the magmatism and shear fault zone in the post collision period controlled the mineralization of gold deposits in the East Junggar.
6. Conclusions
Based on geological and geochemical interpretations and new geophysical data presented in this study, we draw the following conclusions. The eastern Junggar Basin has a double basement. The upper layer is a Hercynian basement, and the lower one a Precambrian basement. There is a crustal detachment between young crust and old crust. The greatest thickness of the Zhaheba complex is inferred as 5 km, which is characterized by relatively high resistivity. The Zhaheba-Almantai fault is the tectonic boundary between the Yemaquan and Dulate arc, cutting into the upper mantle. The conductive anomalies in the crust are related to the magma channel controlling the metallogenic mechanism of metal deposits.
Author Contributions
Conceptualization and methodology, C.Y.; data curation and software, P.Z. and X.Z.; writing—original draft preparation, P.Z.; writing—review and editing, C.Y.; project administration and supervision, C.Y. All authors have read and agreed to the published version of the manuscript.
Funding
Mobility Programme of the Sino-German Center [grant No. 41761134096], Key Special Project for Introduced Talents Team of Southern Marine Science and Engineering Guangdong Laboratory (Guangzhou) [grant number GML2019ZD0201], National Key R&D Program of China [grant No. 2016YFC060110602].
Institutional Review Board Statement
Not applicable.
Informed Consent Statement
Not applicable.
Data Availability Statement
The data of this study can not be uploaded to the publicly archived datasets by the clause of the China Geological Survey.
Acknowledgments
This work was financially supported by Oil and Gas Survey, China Geological Survey. We appreciate Zhou Xingui at the Oil and Gas Survey for constructive discussions of the paper.
Conflicts of Interest
The authors declare that they have no conflict of interest.
References
- Zhang, Z.; Mao, J.; Cai, J.; Kusky, T.M.; Zhou, G.; Yan, S.; Zhao, L. Geochemistry of picrites and associated lavas of a Devonian island arc in the northern Junggar terrane, Xinjiang (NW China): Implications for petrogenesis, arc mantle sources and tectonic setting. Lithos 2008, 105, 379–395. [Google Scholar] [CrossRef]
- Xu, X.W.; Jiang, N.; Li, X.H.; Qu, X.; Yang, Y.H.; Mao, Q.; Wu, Q.; Zhang, Y.; Dong, L.H. Tectonic evolution of the East Junggar terrane: Evidence from the Taheir tectonic window, Xinjiang, China. Gondwana Res. 2013, 24, 578–600. [Google Scholar] [CrossRef]
- Windley, B.F.; Kröner, A.; Guo, J.; Qu, G.; Li, Y.; Zhang, C. Neoproterozoic to Paleozoic geology of the Altai Orogen, NW China: New zircon age data and tectonic evolution. J. Geol. 2002, 110, 719–737. [Google Scholar] [CrossRef]
- Xiao, Y.; Zhang, H.F.; Shi, J.A.; Su, B.X.; Sakyi, P.A.; Lu, X.C.; Hu, Y.; Zhang, Z. Late Paleozoic magmatic record of East Junggar, NW China and its significance: Implication fromzirconU–Pb dating andHfisotope. Gondwana Res. 2011, 20, 532–542. [Google Scholar] [CrossRef]
- Li, P.; Sun, M.; Rosenbaum, G.; Jiang, Y.; Cai, K. Structural evolution of zonal metamorphic sequences in the southern Chinese Altai and relationships to Permian transpressional tectonics in the Central Asian Orogenic Belt. Tectonophysics 2016, 693, 277–289. [Google Scholar] [CrossRef]
- Zhang, H.X.; Niu, H.C.; Terada, K.; Yu, X.Y.; Sato, H.; Ito, J. Zircon SHRIMP U–Pb dating on plagiogranite from Kuerti ophiolite in Altay, North Xinjiang. Chin. Sci. Bull. 2003, 48, 2231–2235. [Google Scholar] [CrossRef]
- Xiao, W.J.; Windley, B.F.; Yan, Q.R.; Qin, K.Z.; Chen, H.L.; Yuan, C.; Sun, M.; Li, J.L.; Sun, S. SHRIMP zircon age of the Aermantai ophiolite in the north Xinjiang area, China and its tectonic implications. Acta Geol. Sin. 2006, 80, 32–37. [Google Scholar]
- Han, Y.G.; Zhao, G.C. Final amalgamation of the Tianshan and Junggar orogenic collage in the southwestern Central Asian Orogenic Belt: Constraints on the closure of the Paleo-Asian Ocean. Earth Sci. Rev. 2018, 186, 129–152. [Google Scholar] [CrossRef]
- Bailey, J.C. Geochemical criteria for a refined tectonic discrimination of orogenic andesites. Chem. Geol. 1981, 32, 139–154. [Google Scholar] [CrossRef]
- Li, J.Y.; Xiao, X.C. Brief reviews on some issues of framework and tectonic evolution of Xinjiang crust, NW China. Sci. Geol. Sin. 1999, 34, 405–419. [Google Scholar]
- Rui, A.; Zhao, G.C.; Liu, Q.; Han, Y.G. Early Palaeozoic subduction-accretion in East Junggar (NW China): Insights from age, geochemical, and Sr-Nd-Hf isotopic data of andesitic rocks in the northern Yemaquan Arc. Lithos 2021, 380, 105892. [Google Scholar] [CrossRef]
- Zhang, H.X.; Shen, X.M.; Ma, L.; Niu, H.C.; Xu, X.Y. Geochronology of the Fuyun adakite, north Xinjiang and its constraint to the initiation of the Paleo-Asian Ocean subduction. Acta Petrol. Sin. 2008, 24, 1054–1058. [Google Scholar]
- Zhang, Z.C.; Zhou, G.; Kusky, T.M.; Yan, S.G.; Chen, B.L.; Zhao, L. Late Paleozoic volcanic record of the Eastern Junggar terrane, Xinjiang, Northwestern China: Major and trace element characteristics, Sr–Nd isotopic systematics and implications for tectonic evolution. Gondwana Res. 2009, 16, 201–215. [Google Scholar] [CrossRef]
- Xiao, W.J.; Windley, B.F.; Huang, B.C.; Han, C.M.; Yuan, C.; Chen, H.L.; Sun, M.; Sun, S.; Li, J.L. End-Permian to mid-Triassic termination of the accretionary processes of the southern Altaids: Implications for the geodynamic evolution, Phanerozoic continental growth, and metallogeny of Central Asia. Int. J. Earth Sci. 2009, 98, 1189–1217. [Google Scholar] [CrossRef]
- Long, X.; Yuan, C.; Sun, M.; Safonova, I.; Xiao, W.; Wang, Y. Geochemistry and U-Pb detrital zircon dating of Paleozoic graywackes in East Junggar, NW China: Insights into subduction–accretion processes in the southern Central Asian Orogenic Belt. Gondwana Res. 2012, 21, 637–653. [Google Scholar] [CrossRef]
- He, G.Q.; Han, B.F.; Yue, Y.J.; Wang, J.H. Tectonic division and crustal evolution of Altay orogenic belt in China. Xinjiang Geol. 1990, 2, 9–20. (In Chinese) [Google Scholar]
- Hu, A.Q.; Jahn, G.X.; Zhang, G.X.; Chen, Y.B.; Zhang, Q.F. Crustal evolution and Phanerozoic crustal growth in northern Xinjiang: Nd isotopic evidence: Part1. Isotopic characterization of basement rocks. Tectonophysics 2000, 328, 15–51. [Google Scholar] [CrossRef]
- Chen, B.; Jahn, B.M. Genesis of post-collisional granitoids and basement nature of the Junggar Terrane, NW China: Nd-Sr isotope and trace element evidence. J. Asian Earth Sci. 2004, 23, 691–703. [Google Scholar] [CrossRef]
- Zheng, J.; Sun, M.; Zhao, G.C.; Robinson, P.T.; Wang, F.Z. Elemental and Sr -Nd-Pb isotopic geochemistry of Late Paleozoic volcanic rocks beneath the Junggar basin, NW China: Implications for the formation and evolution of the basin basement. J. Asian Earth Sci. 2007, 29, 778–794. [Google Scholar] [CrossRef]
- Carroll, A.R.; Liang, Y.H.; Graham, S.A.; Xiao, X.; Hendrix, M.S.; Chu, J.; McKnight, C.L. Junggar basin, northwest China: Trapped Late Paleozoic ocean. Tectonophysics 1990, 181, 1–14. [Google Scholar] [CrossRef]
- Xiao, W.J.; Han, C.M.; Yuan, C.; Sun, M.; Lin, S.F.; Chen, H.L.; Li, Z.L.; Li, J.L.; Sun, S. Middle Cambrian to Permian subduction-related accretionary orogenesis of North Xinjiang, NW China: Implications for the tectonic evolution of Central Asia. J. Asian Earth Sci. 2008, 32, 102–117. [Google Scholar] [CrossRef]
- Yang, G.X.; Li, Y.J.; Santosh, M.; Gu, P.Y.; Yang, B.K.; Zhang, B.; Wang, H.B.; Zhang, X.; Tong, L.L. A Neoproterozoic seamount in the Paleoasian Ocean: Evidence from zircon U–Pb geochronology and geochemistry of the Mayile ophiolitic mélange in West Junggar, NW China. Lithos 2012, 140, 53–65. [Google Scholar] [CrossRef]
- Li, D.; He, D.F.; Santosh, M.; Ma, D.L.; Tang, J.Y. Tectonic framework of the northern Junggar Basin Part I: The eastern Luliang Uplift and its link with the East Junggar terrane. Gondwana Res. 2015, 27, 1089–1109. [Google Scholar] [CrossRef]
- Guy, A.; Schulmann, K.; Soejono, I.; Xiao, W.J. Revision of the Chinese Altai-East Junggar Terrane Accretion Model Based on Geophysical and Geological Constraints. Tectonics 2019, 39, e2019TC006026. [Google Scholar] [CrossRef]
- Zhao, J.M.; Chen, S.Z.; Zhang, H.; Liu, H.B.; Shao, X.Z.; Chen, X.F.; Xu, J.; Ma, Z.J. Lithospheric structure beneath the eastern Junggar Basin (NW China), inferred from velocity, gravity and geomagnetism. J. Asian Earth Sci. 2019, 177, 295–306. [Google Scholar] [CrossRef]
- Zhao, J.M.; Huang, Y.; Ma, Z.J.; Shao, X.Z.; Chen, H.G.; Wang, W.; Xu, Q. Discussion on the basement structure and property of northern Junggar basin. Chin. J. Geophys. 2008, 51, 1767–1775. (In Chinese) [Google Scholar]
- Zang, C.J.; Wang, M.L.; Liu, Y.G.; Tang, H.F. The elastic wave velocities of the granitoids from Eastern Junggar of Xinjiang at high temperature and high pressure and their geological constraints on the crustal structure. Chin. J. Geophys. 2014, 57, 2099–2112. (In Chinese) [Google Scholar] [CrossRef]
- Yang, W.C.; Jin, S.; Zhang, L.L.; Qu, C.; Hu, X.Y.; Wei, W.B.; Yu, C.Q.; Yu, P. The Three-dimensional resistivity structures of the lithosphere beneath the Qinghai-Tibet Plateau. Chin. J. Geophys. 2020, 63, 817–827. (In Chinese) [Google Scholar] [CrossRef]
- Xiao, W.; Windley, B.F.; Badarch, G.; Sun, S.; Li, J.; Qin, K.; Wang, Z. Palaeozoic accretionary and convergent tectonics of the southern Altaids: Implications for the growth of Central Asia. J. Geol. Soc. 2004, 161, 339–342. [Google Scholar] [CrossRef]
- Coleman, R.G. Plate tectonic emplacement of upper mantle peridotites along continental edges. J. Geophys. Res. 1971, 76, 1212–1222. [Google Scholar] [CrossRef]
- Feng, Y.; Coleman, R.G.; Tilton, G.; Xiao, X. Tectonic evolution of the West Junggar Region, Xinjiang, China. Tectonics 1989, 8, 729–752. [Google Scholar] [CrossRef]
- Xiao, W.; Han, C.; Liu, W.; Wan, B.; Zhang, J.E.; Ao, S.; Zhang, Z.; Song, D.; Tian, Z.; Luo, J. How many sutures in the southern Central Asian Orogenic Belt: Insights from East Xinjiang–West Gansu (NW China). Geosci. Front. 2014, 5, 525–536. [Google Scholar] [CrossRef]
- Wan, B.; Xiao, W.; Zhang, L.; Windley, B.F.; Han, C.; Quinn, C.D. Contrasting styles of mineralization in the Chinese Altai and East Junggar, NW China: Implications for the accretionary history of the southern Altaids. J. Geol. Soc. 2011, 168, 1311–1321. [Google Scholar] [CrossRef]
- Liu, W.; Liu, X.J.; Liu, L.J. Underplating generated A- and I-type granitoids of the East Junggar from the lower and the upper oceanic crust with mixing of mafic magma: Insights from integrated zircon U–Pb ages, petrography, geochemistry and Nd–Sr–Hf isotopes. Lithos 2013, 179, 293–319. [Google Scholar] [CrossRef]
- Cai, K.; Sun, M.; Xiao, W.; Yuan, C.; Zhao, G.; Long, X.; Tumurkhuu, D.; Zhou, K. Petrogenesis of late Paleozoic tholeiitic, Nb-enriched, calc-alkaline and adakitic rocks in southwestern Mongolia: Implications for intra-oceanic arc evolution. Lithos 2014, 202, 413–428. [Google Scholar] [CrossRef]
- Cagniard, L. Basic theory of the magnetotelluric method of geophysical prospecting. Geophysics 1953, 18, 605–645. [Google Scholar] [CrossRef]
- Egbert, G.D.; Booker, J.R. Robust estimation of geomagnetic transfer functions. Geophys. J. Int. 1986, 87, 173–194. [Google Scholar] [CrossRef]
- Jiracek, G.R. Near-surface and topographic distortions in electromagnetic induction. Surv. Geophys. 1990, 11, 163–203. [Google Scholar] [CrossRef]
- Groom, R.W.; Bailey, R.C. Analytical investigations of the effects of near surface three-dimensional galvanic scatterers on MT tensor de- composition. Geophysics 1991, 56, 496–518. [Google Scholar] [CrossRef][Green Version]
- Zhang, K.W.; Shao, J.A. The Geochemical characteristics and the geological significance of Green-schists in Yuejinshan Group, Eastern Heilongjiang Province. Acta Petrol. Sin. 1997, 13, 168–172. [Google Scholar]
- Caldwell, T.G.; Bibby, H.M.; Brown, C. The magnetotelluric phase tensor. Geophys. J. Int. 2005, 158, 457–469. [Google Scholar] [CrossRef]
- Berdichevsky, M.N. Marginal notes on magnetotellurics. Surv. Geophys. 1999, 20, 341–375. [Google Scholar] [CrossRef]
- Constable, C.S.; Parker, R.L.; Constable, C.G. Occam’s inversion: A practical algorithm for generating smooth models from electromagnetic sounding data. Geophysics 1987, 52, 289–300. [Google Scholar] [CrossRef]
- Siripunvaraporn, W.; Edgbert, G. An efficient data-subspace inversion method for 2-D magnetotelluric data. Geophysics 2000, 65, 791–803. [Google Scholar] [CrossRef]
- Smith, J.T.; Booker, J.R. Rapid inversion of two- and three-dimensional magnetotelluric data. J. Geophys. Res. 1991, 96, 3905–3922. [Google Scholar] [CrossRef]
- Rodi, W.; Mackie, R.L. Nonlinear conjugate gradients algorithm for 2D magnetotelluric inversion. Geophysics 2001, 66, 174–187. [Google Scholar] [CrossRef]
- Tang, J.Y.; He, D.F.; Li, D.; Ma, D.L. Large-scale thrusting at the northern Junggar Basin since Cretaceous and its implications for the rejuvenation of the Central Asian Orogenic Belt. Geosci. Front. 2015, 2, 227–246. [Google Scholar] [CrossRef]
- Li, J.Y.; Xiao, X.C.; Chen, W. Late Ordovician continental basement of the eastern Junggar Basin in Xinjiang, NW China: Evidence from the Laojunmiao metamorphic complex on the northeast basin margin. Xinjiang Geol. 2000, 19, 297–302. [Google Scholar]
- Li, Y.P.; Li, J.Y.; Sun, G.H.; Zhu, Z.X.; Yang, Z.Q. Basement of Junggar basin: Evidence from detrital zircons in sandstone of previous Devonian Kalamaili formation. Acta Petrol. Sin. 2007, 23, 1577–1590. [Google Scholar] [CrossRef]
- Wang, Y.; Mooney, W.D.; Yuan, X.; Coleman, R.G. The crustal structure from the Altai Mountains to the Altyn Tagh fault, northwest China. J. Geophys. Res. 2003, 108, 1–16. [Google Scholar] [CrossRef]
- Li, D.; He, D.F.; Santosh, M.; Tang, J.Y. Petrogenesis of Late Paleozoic volcanics from the Zhaheba depression, East Junggar: Insights into collisional event in an accretionary orogen of Central Asia. Lithos 2014, 184, 167–193. [Google Scholar] [CrossRef]
- Wang, J.; Su, Y.P.; Zheng, J.P.; Belousova, E.A.; Chen, M.; Dai, H.K.; Zhou, X. Petrogenesis of early Carboniferous bimodal-type volcanic rocks from the Junggar Basin (NW China) with implications for Phanerozoic crustal growth in Central Asian Orogenic Belt. Gondwana Res. 2021, 89, 220–237. [Google Scholar] [CrossRef]
- Wen, L.; Sun, X.C.; Zhou, X.G.; Yi, L.; Li, Q.Y.; Gao, Y.J.; Gong, X.X.; Guo, K. Sedimentary environment of Upper Permian in Zhaheba Depression of Northern Xinjiang. Geol. Surv. China 2019, 6, 17–23. [Google Scholar] [CrossRef]
- Rao, S.; Hu, S.B.; Zhu, C.Q.; Tang, X.Y.; Li, W.W.; Wang, J.X. The characteristics of heat flow and lithospheric thermal structure in Junggar Basin, northwest China. Chin. J. Geophys. 2013, 56, 2760–2770. [Google Scholar] [CrossRef]
- Han, C.; Xiao, W.; Zhao, G.; Qu, W.; Du, A. Re–Os dating of the Kalatongke Cu–Ni deposit, Altay Shan, NW China, and resulting geodynamic implications. Ore Geol. Rev. 2007, 32, 452–468. [Google Scholar] [CrossRef]
- Zheng, H.P.; Zhu, L.X.; Ma, S.M.; Jiang, Y.Q. Characteristics and regularities of mass transfer in the Kubusu gold deposits of clastic-altered type, in Qinghe county. Xinjiang Geol. Explor. 2015, 51, 0332–0344. [Google Scholar] [CrossRef]
- Bai, J.K.; Chen, J.L.; Peng, S.X. Characteristics and Metallogeny Regulation of Graphite Resources in Xinjiang. Acta Geol. Sin. 2017, 91, 2828–2840. [Google Scholar]
- Ye, X.T.; Zhang, C.L.; Zou, H.B.; Yao, C.Y.; Dong, Y.G. Age and geochemistry of the Zhaheba ophiolite complex in eastern Junggar of the Central Asian Orogenic Belt (CAOB): Implications for the accretion process of the Junggar terrane. Geol. Mag. 2016, 154, 419–440. [Google Scholar] [CrossRef]


Publisher’s Note: MDPI stays neutral with regard to jurisdictional claims in published maps and institutional affiliations. |
© 2021 by the authors. Licensee MDPI, Basel, Switzerland. This article is an open access article distributed under the terms and conditions of the Creative Commons Attribution (CC BY) license (https://creativecommons.org/licenses/by/4.0/).