1. Introduction
Floor systems made by floor plates consist of reinforced or prestressed precast concrete plates that will be used as permanent formwork for cast-in-situ concrete (topping), which, when hardened, forms a composite slab [
1]. Such slabs should behave monolithically after hardening of the topping, and a significant part of mechanical resistance is not taken by the precast element. In the opposite case, other product standards and prescriptions are valid [
2,
3], which will not be discussed in this article. Major properties of the precast floor plate are a minimum thickness (
hp) of about 50 mm, an upper surface that should be at least smooth (according to the definition in clause 6.2.5 from [
4]), and the presence of lattice girders. The latter are used for handling in the factory and/or on-site; they determine the distance in between the temporary props in the formwork phase, and as connecting reinforcement in the final stage between floor plate and topping. Sometimes they can also be used as shear or even punching reinforcement; however, this application is also outside the scope of the present article. The direction of the lattice girders mostly shows the main or span direction of the floor plates; it is supporting the most important bending moment. Perpendicular to this direction, indicated by the length
L, the width
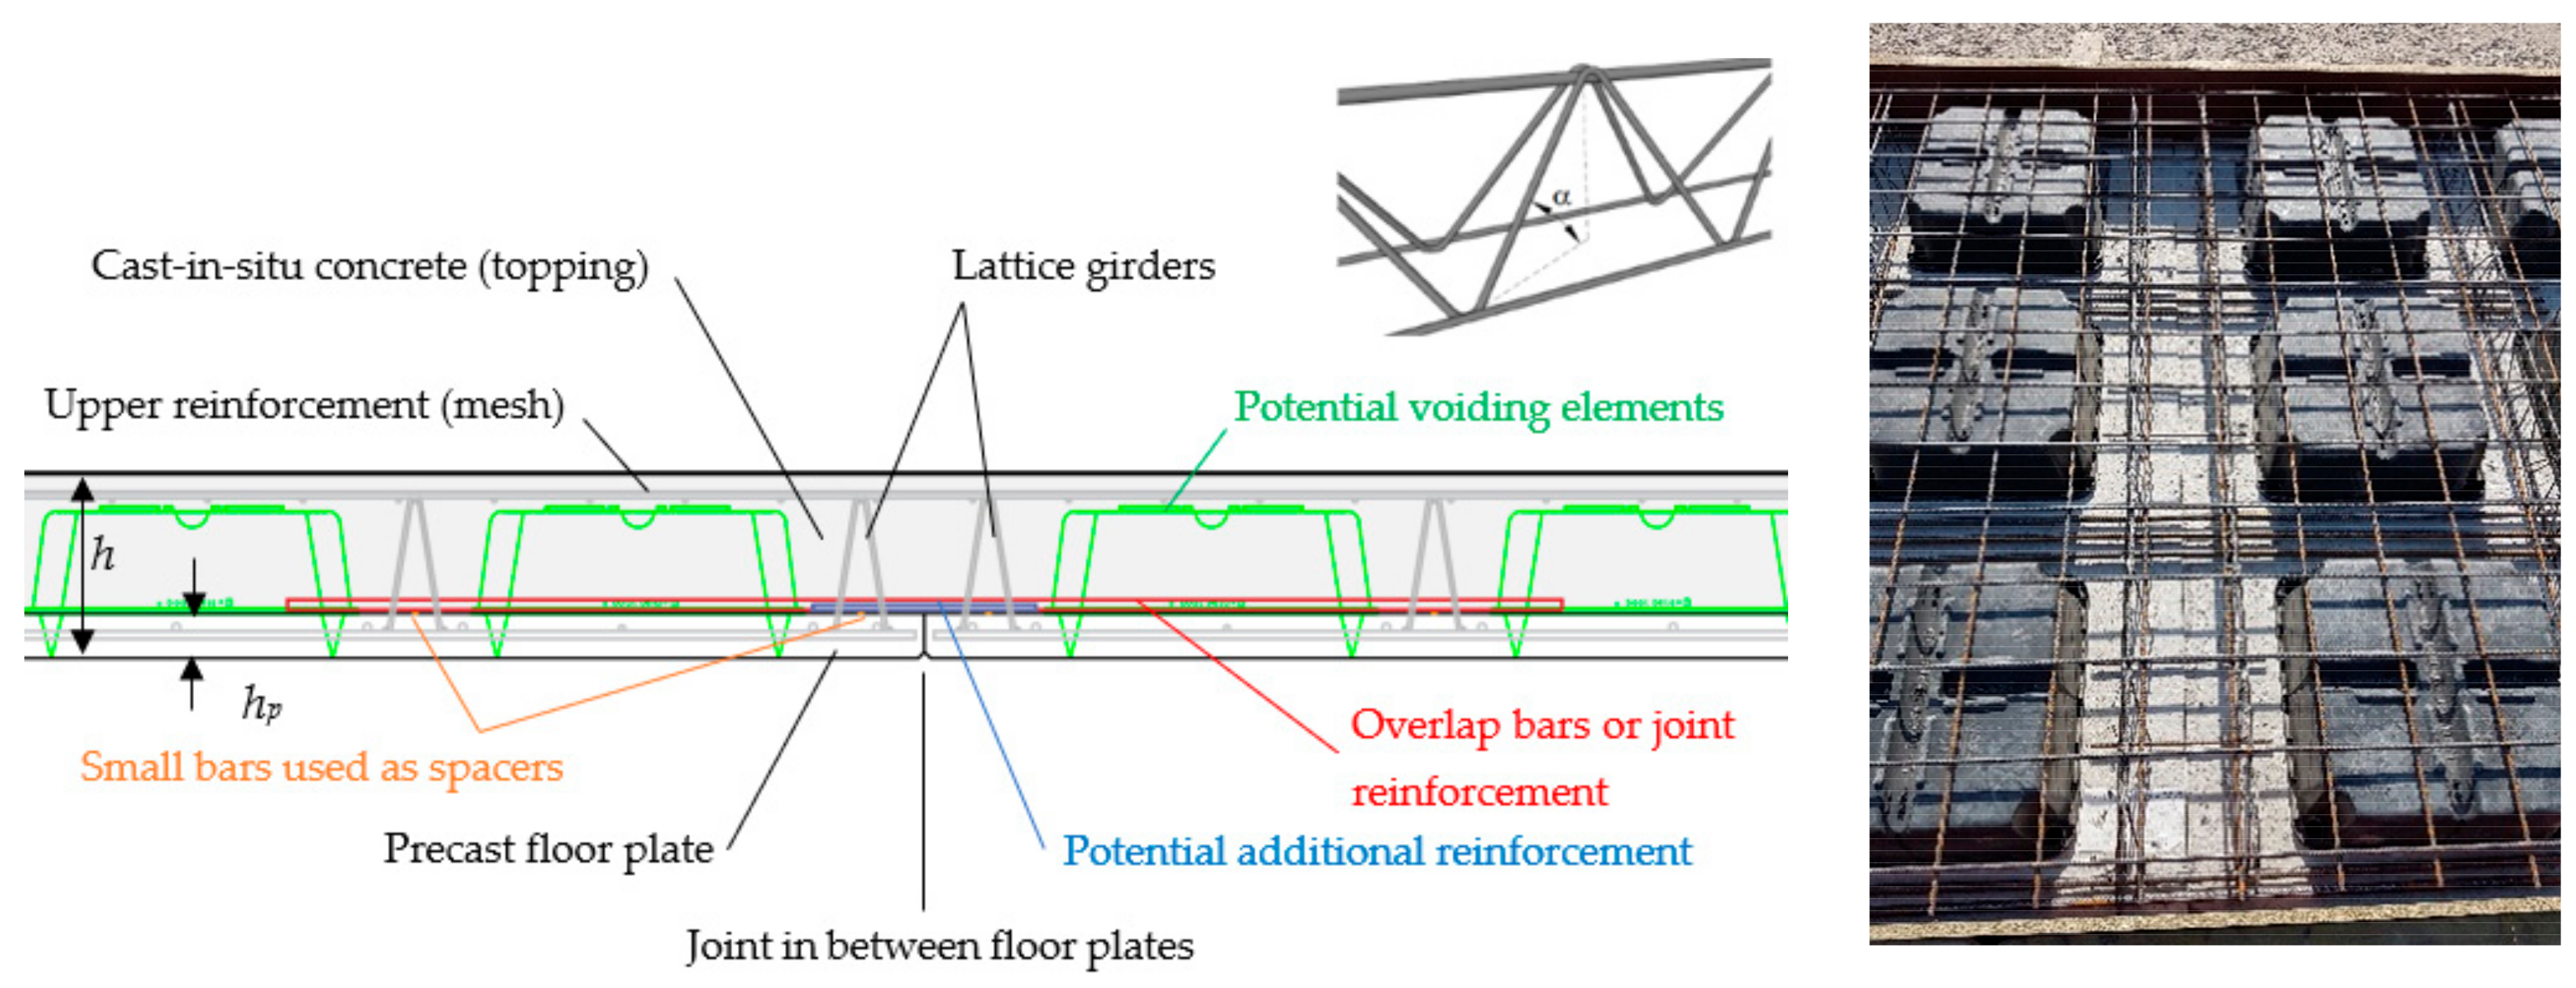
b is used, which is typically limited to about 2.4 or 3.0 m. Subsequently, due to the limited width of the floor plates, longitudinal joints are presented with details, as shown in
Figure 1. Out of ecological aspects and to reduce the weight of the system, sometimes void formers are used; these slabs are so-called hollow composite slabs. The void formers are glued, connected, or partially incorporated in the floor plate. They are available in any shape and can be optimized [
5], but should by preference comply with clause 5.3.1 (6) from [
4] and annex C of [
1].
Floor slabs made with precast floor plates should be analyzed as massive floor slabs. This can be easily derived from the mechanical behavior of a simple beam element with a locally reduced section, i.e., the joint in between the floor plates. Indeed, the deflection is nothing more than the double integration of the curvature diagram, where the curvature is equal to
M/
EI with
M the moment,
E the Young modulus, and
I the second moment of area. Even with a strong local reduction of
I (due to the reduction of
h by
hp, see
Figure 1), the influence will be neglectable as long as the width of the joint is limited. Thus, the assumption of a one-way bearing system is not appropriate when there are no two free edges or outside the central region of a slab with width/span ratio > two [
4]. Consequently, outside the one-way bearing regions, joints will transfer bending moments and research about the mechanics and the contribution of the different components in such a joint is rare. Only some preliminary guidance can be found in the literature [
6,
7,
8].
In addition, currently, flat slabs are also designed and constructed using a combination of precast floor plates and voiding elements. This makes the design of the joints even more challenging and there is a clear need to understand the behavior and mechanisms that govern the load transfer in such floor systems. Only a few national guidelines exist; for example, in [
8] about the transfer of forces through such a joint and insight is missing; in addition, some limitations to the diameter of the overlap bars (≤Ø 14 mm) and the amount of reinforcement (≤1000 mm²/m) exist. For this reason, a large set of experimental results (20 large-scale tests in total) is presented and analyzed in this paper. With this information (i) the misuse of existing rules for verifications where they are not developed can and will be avoided, (ii) understanding of the physical phenomena should be improved, and (iii) design recommendations can be developed.
Previous and recent research studies of these types of slabs containing voiding elements concentrate mainly on global flexural [
9,
10] and the shear and punching behavior [
11,
12,
13] of slabs, neglecting the “simple” transfer of forces by the joints. A relatively recent disaster in The Netherlands with a total collapse of a parking building showed the importance of the joints in global system behavior [
14,
15]. Until now, several studies were elaborated, resulting in a number of (national) approved details, which are intended to cover the missing knowledge [
8,
16,
17]. This way of working, with generally accepted “deemed to satisfy details”, facilitate a fast and safe design process. However, for the assessment and reassessment of existing situations this methodology cannot be applied.
This study is limited to the static design, and therefore extension to the dynamic and fatigue behavior should be made in the future, as this are also points to interest mostly in civil engineering applications [
18]. In addition, the reaction of this composite floor system subjected to extreme loads where the membrane effect becomes of importance and is activated, such as earthquakes [
19] and fires [
20], is not treated in this article. Findings in this article can be of importance to assess such design situations. Nevertheless, a broad range of applications will already be covered by the quasi-static and static design situation.
2. Materials and Methods
Described in more detail in
Section 2.1 are the materials used in this study: floor plates, lattice girders, reinforcement, and concrete topping, as commonly used on construction sites in Belgium. In
Section 2.2, the test setup is given. Most of the floors are tested in four-point bending to obtain pure bending at the location of the joint in between the floor plates at midspan. Due to the width of the floor plates, it can be avoided that important shear forces must be transmitted over the joint; this can and should be seen as a rule of good understanding the behavior.
2.1. Materials
Properties are tested in the laboratory at x days, at time of the test, or when coming from the manufacturer. Corresponding abbreviations “x days”, “test”, and “manu” are used. Nominal or code specified values are used only if the design load is presented.
2.1.1. Floor Plate
Floor plates were made with concrete containing broken calcareous aggregate (size 6/14) according to EN12620:2002 + A1(2008), sand, and Portland cement (CEM I 52,5R LA). Eight to 12 h after casting, the plates were heated to a temperature of 40 to 45 °C at a relative humidity of at least 65% before demolding. Concrete cubes (150 mm) to determine the compressive strength were produced from the same mixture and follow the whole production process. Tests each time were on three cubes and mostly executed on the date of the full-scale element tests (
Table 1). For series name, see
Section 2.2.
Two types of finishing were investigated, without treatment after vibrations (U), which is called smooth, and roughened up with a rake with a surface according to Figure 6.9 from [
4], which is called indented (I) in the following description. The amount of reinforcement in the floorplates was equal to 1707, 429, 782, and 904 mm²/m for the A-, B-, C-, and D-series, respectively.
2.1.2. Lattice Girder
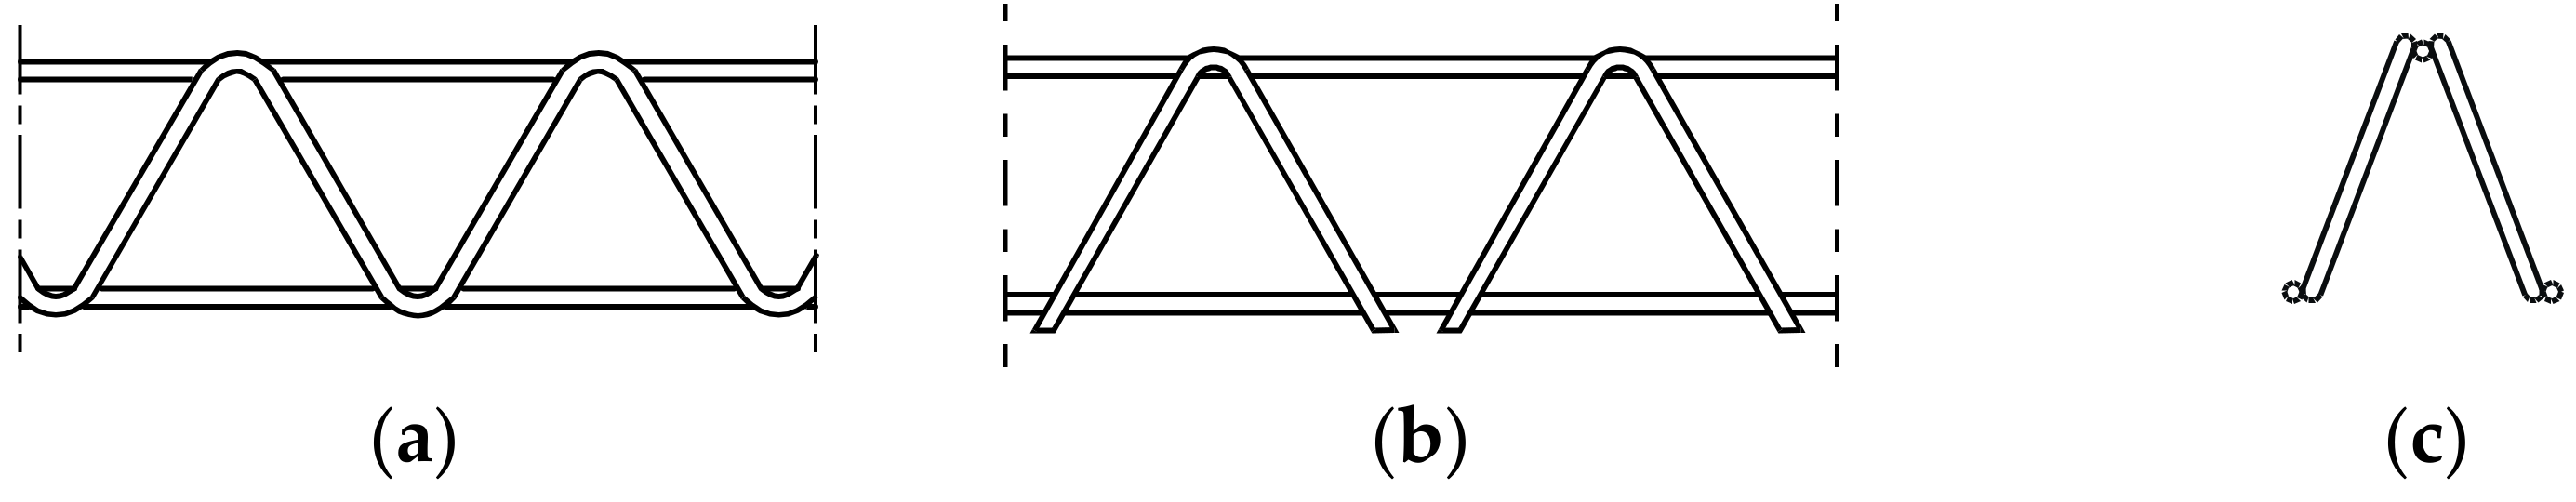
Two types of lattice girders were used depending on the production site of the floor plates: continuously welded (CW) and discontinuous welded (DW) diagonals (
Figure 2, see also
Figure 1). Depending on the strength of the weld, a different classification can be found; the continuous ones are mostly the so-called type 4 (the highest one [
23]), and the discontinuous ones are generally from class 2. However, during the tests, no difference in behavior was noticed.
Reinforcement steel used was BE500A-DE500BS (see Belgian national annex to [
4]) for the upper chord (ribbed), the diagonals (nonribbed) and again the lower chords (also ribbed). The spacing between the nodes was a constant value of 200 mm, the width 70 mm, and the height depends on the dimensions of the test specimens. This makes the angle α shown in
Figure 1 a variable depending on the height. Tests performed on both types of lattice girders specified a yield strength of approximately 610 and 590 MPa for the upper cords (5 or 6 mm) and the lower cords (8 mm), respectively, and ultimate tensile strength of approximately 640 MPa. For the diagonal (5 mm) the yield strength was at least 530 MPa and the ultimate tensile strength was about 630 MPa.
Pull-out tests of the lattice girders were carried out under isostatic conditions [
24] with CW-girders or in a cantilever situation [
21,
25] with DW-girders. The latter also investigated the scale effect in defining what a representative number of nodes must be used in a full-scale test specimen. It came out that two is the minimum and the failure load was about 20 kN per node. This is discussed more in depth in
Section 4.3.3, explaining the failure mode in the case of severe execution errors.
2.1.3. Joint Reinforcement
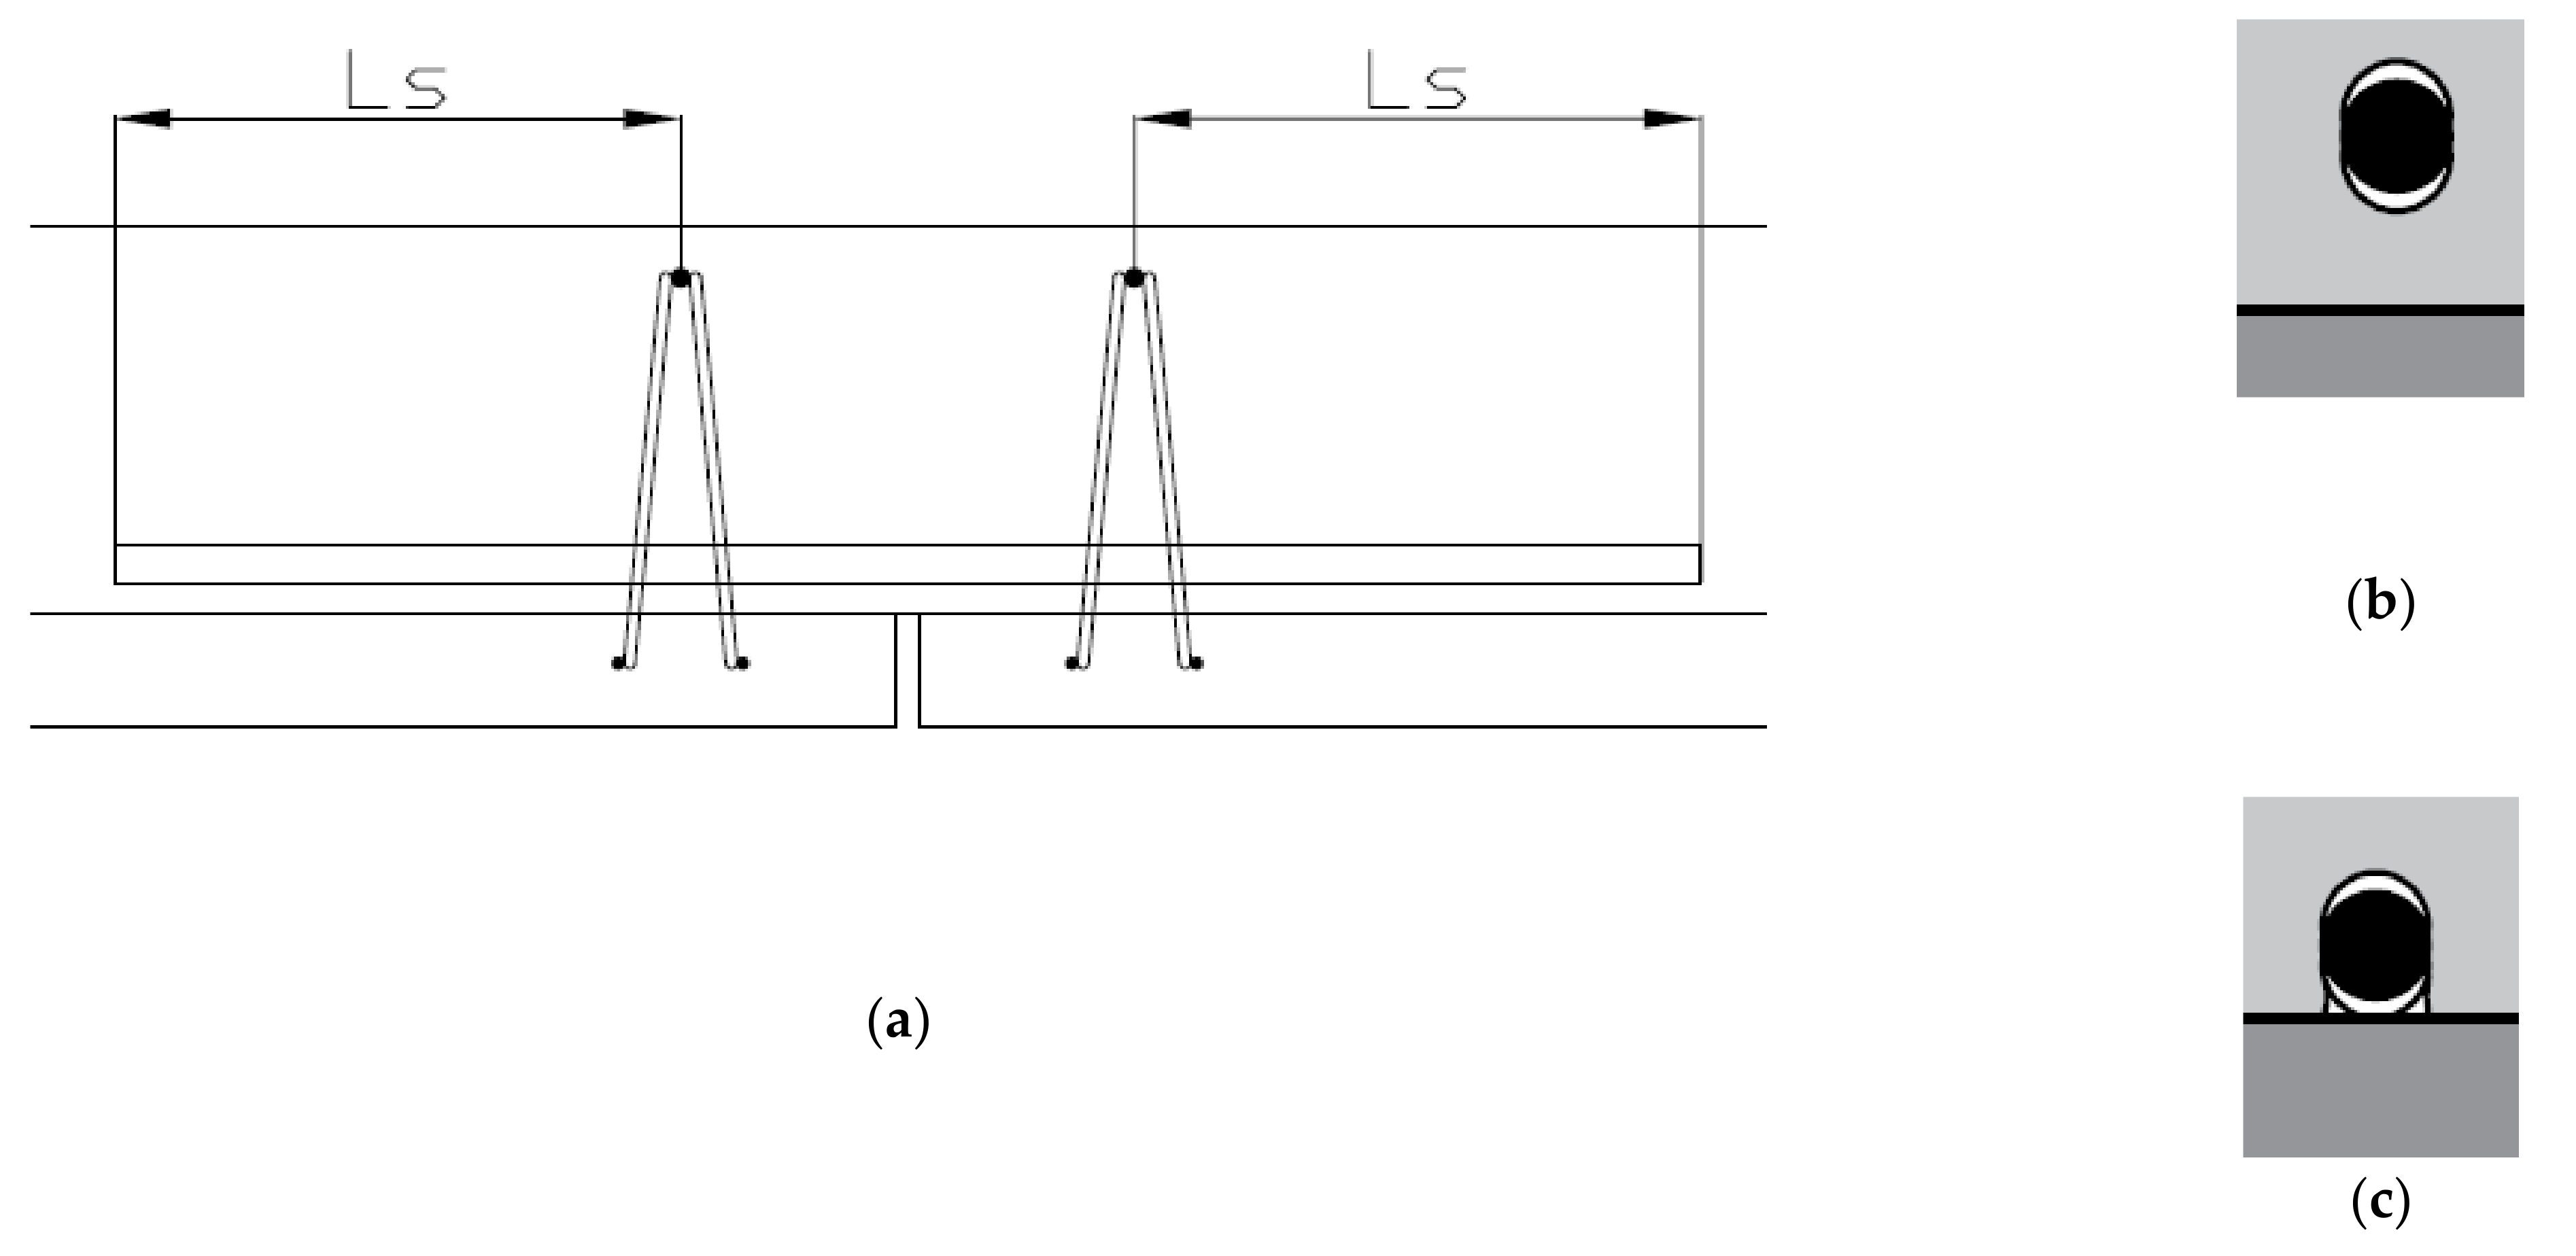
Specification of the overlap rebars was cold worked ribbed BE500 reinforcement. At the location of a longitudinal joint (series A, C, D) a diameter of 16 mm was used. The diameter of the overlap rebars at the transversal joint (series B) was 8 mm. The overlap length of the rebars was optimized to be in correspondence with the reinforcement of the floor plates for the A- and B-series. This resulted in total lengths of 1500, 1200, 1840, and 2000 mm for the A-, B-, C-, and D-series, and reinforcement amounts of 1340, 333, 893, and 861 mm²/m, respectively. The ultimate limit state situation was used for the design and an increment to compensate for the loss of lever arm. The other two sets of test specimens were designed to facilitate a failure in the overlap bars.
The overlap rebars (shown in
Figure 1) were placed on the upper face of the floor plate (O) or by the use of a spacer (C). Out of durability considerations, the idea (and practice) of placing the rebar without spacer is disputable.
2.1.4. Concrete Topping
The in situ concrete topping was a ready-mix concrete with siliceous aggregate (size 6/14) and Portland cement (CEMIII/B 42,5N LH LA), and for all specimens ordered in a concrete class C30/37 and slump class S3. After casting, the plates were stored either in outside (A-, B-, and D-series) or inside conditions (C-series). The compressive strength was determined on cubes (150 mm),
Table 2, produced from the same mixture and stored in a climate room or with the test specimens.
2.2. Test Setup
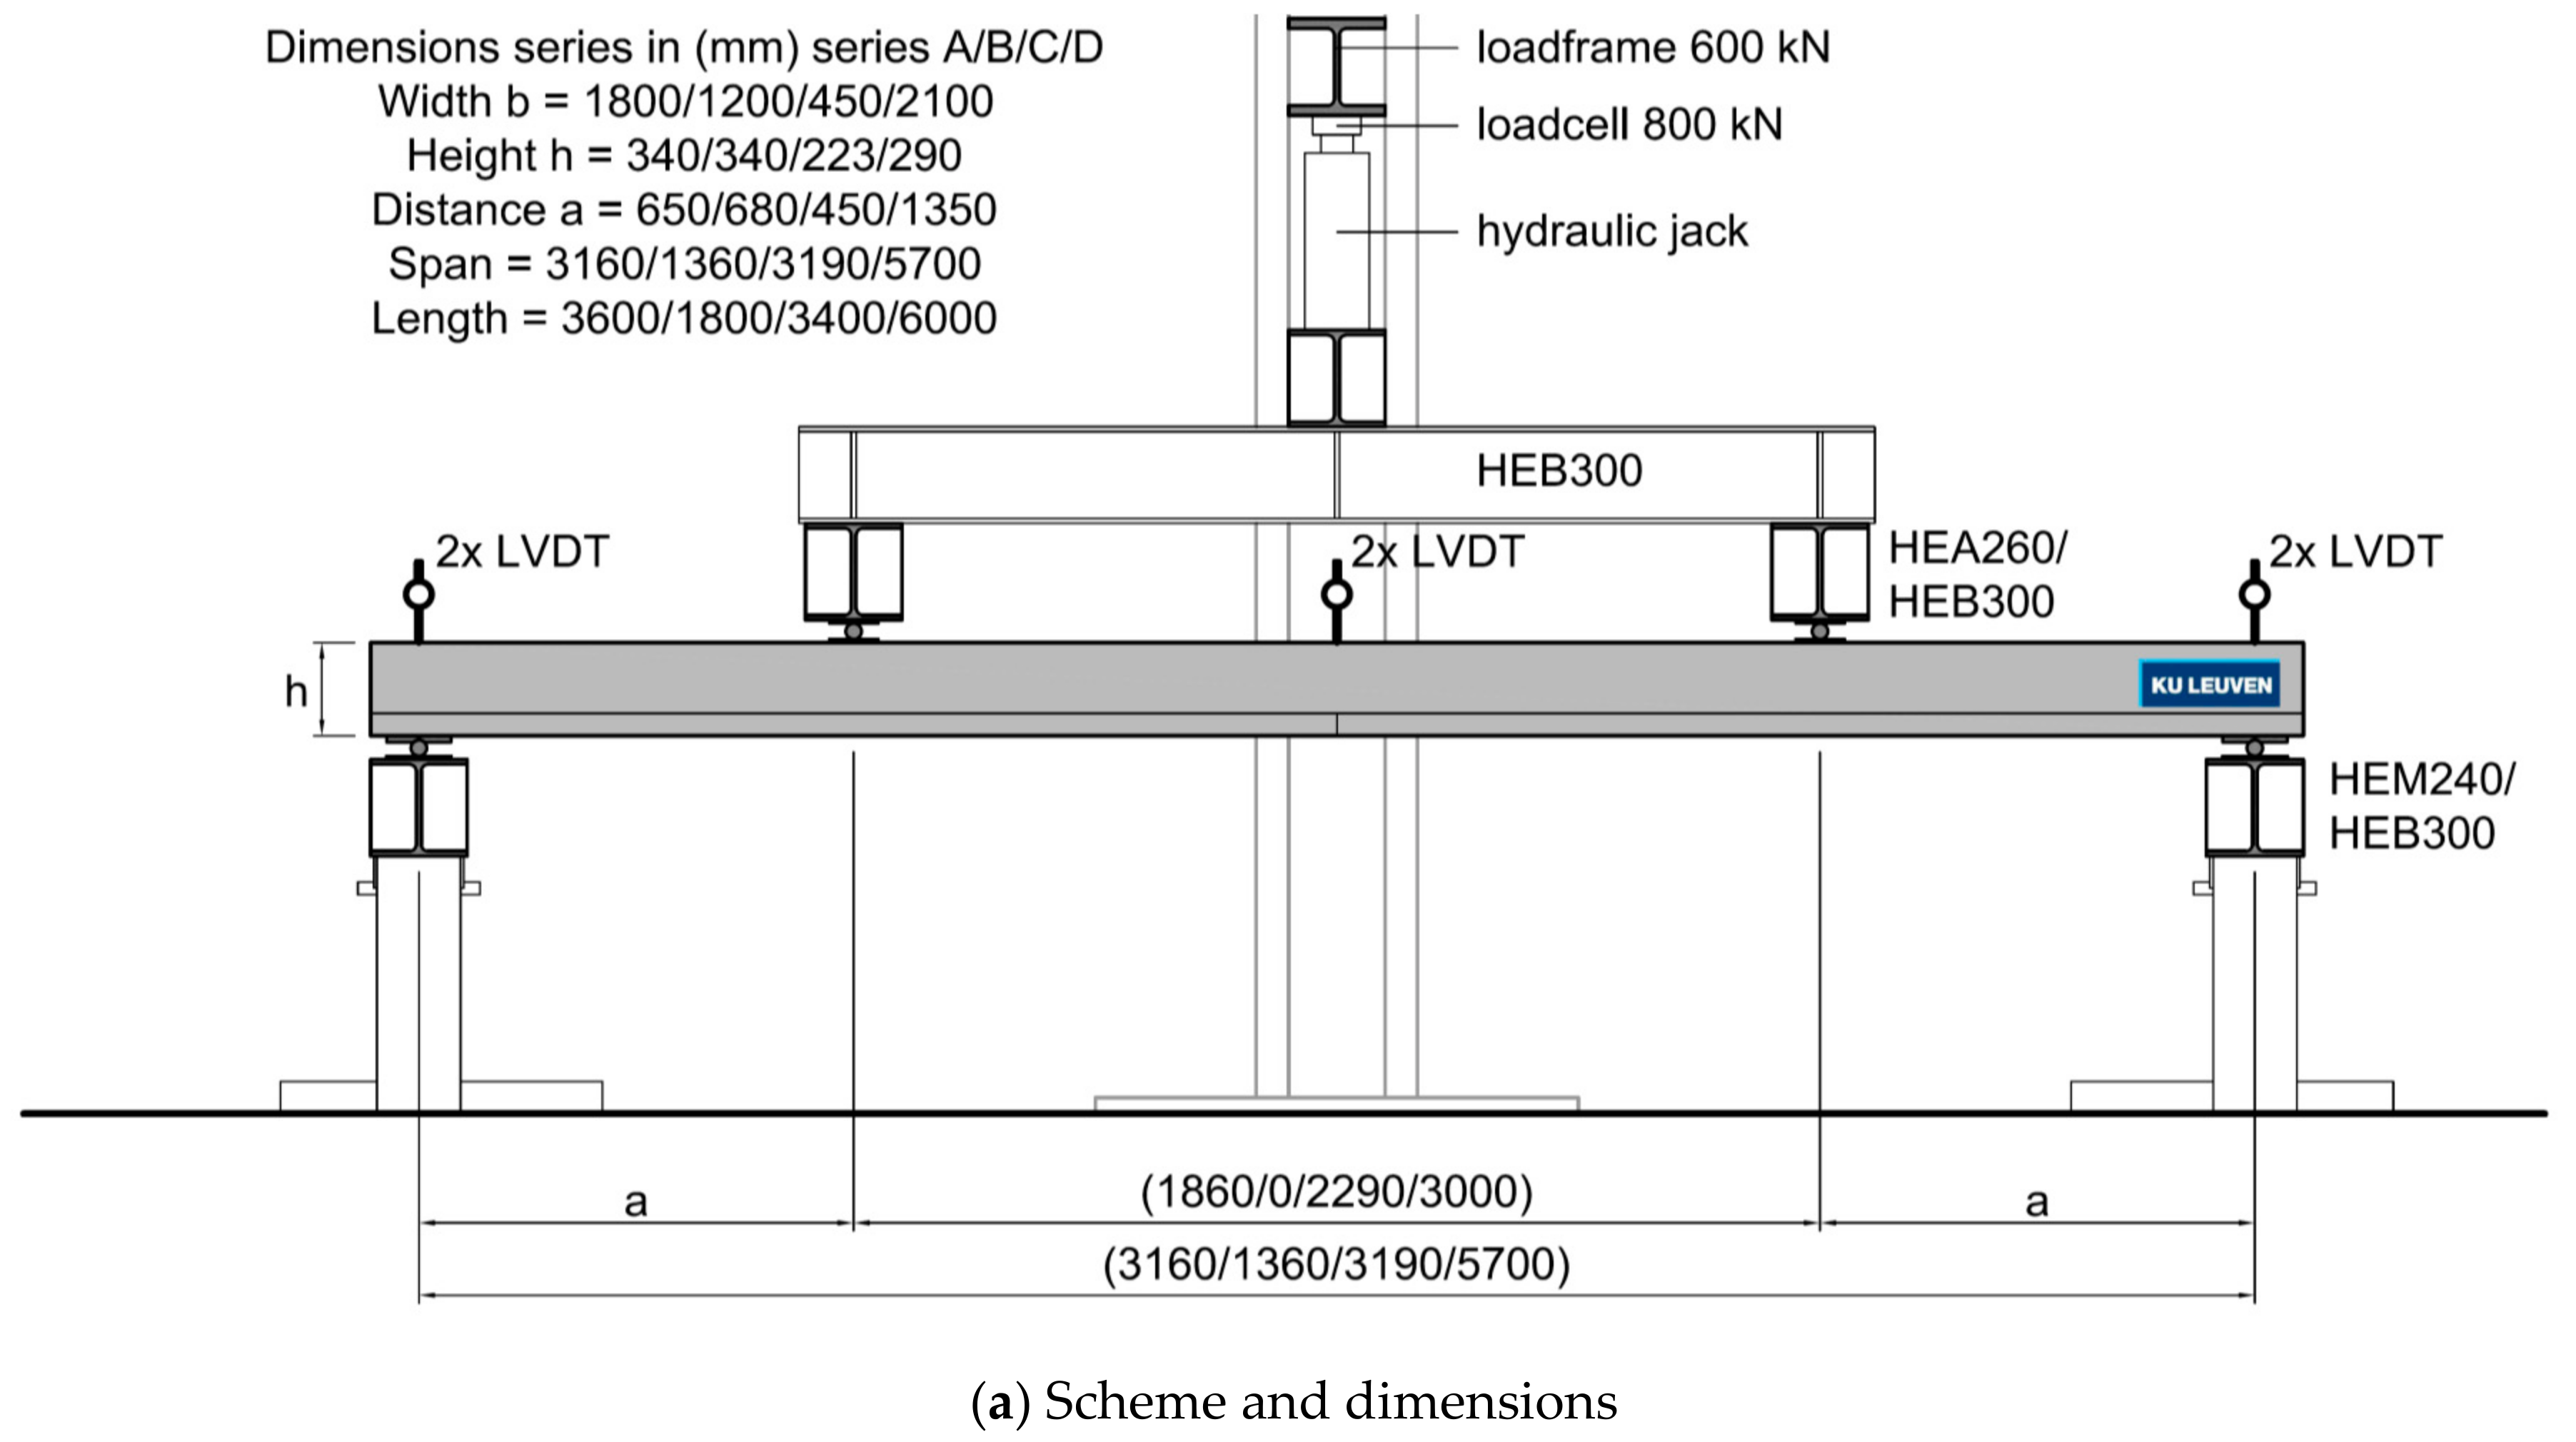
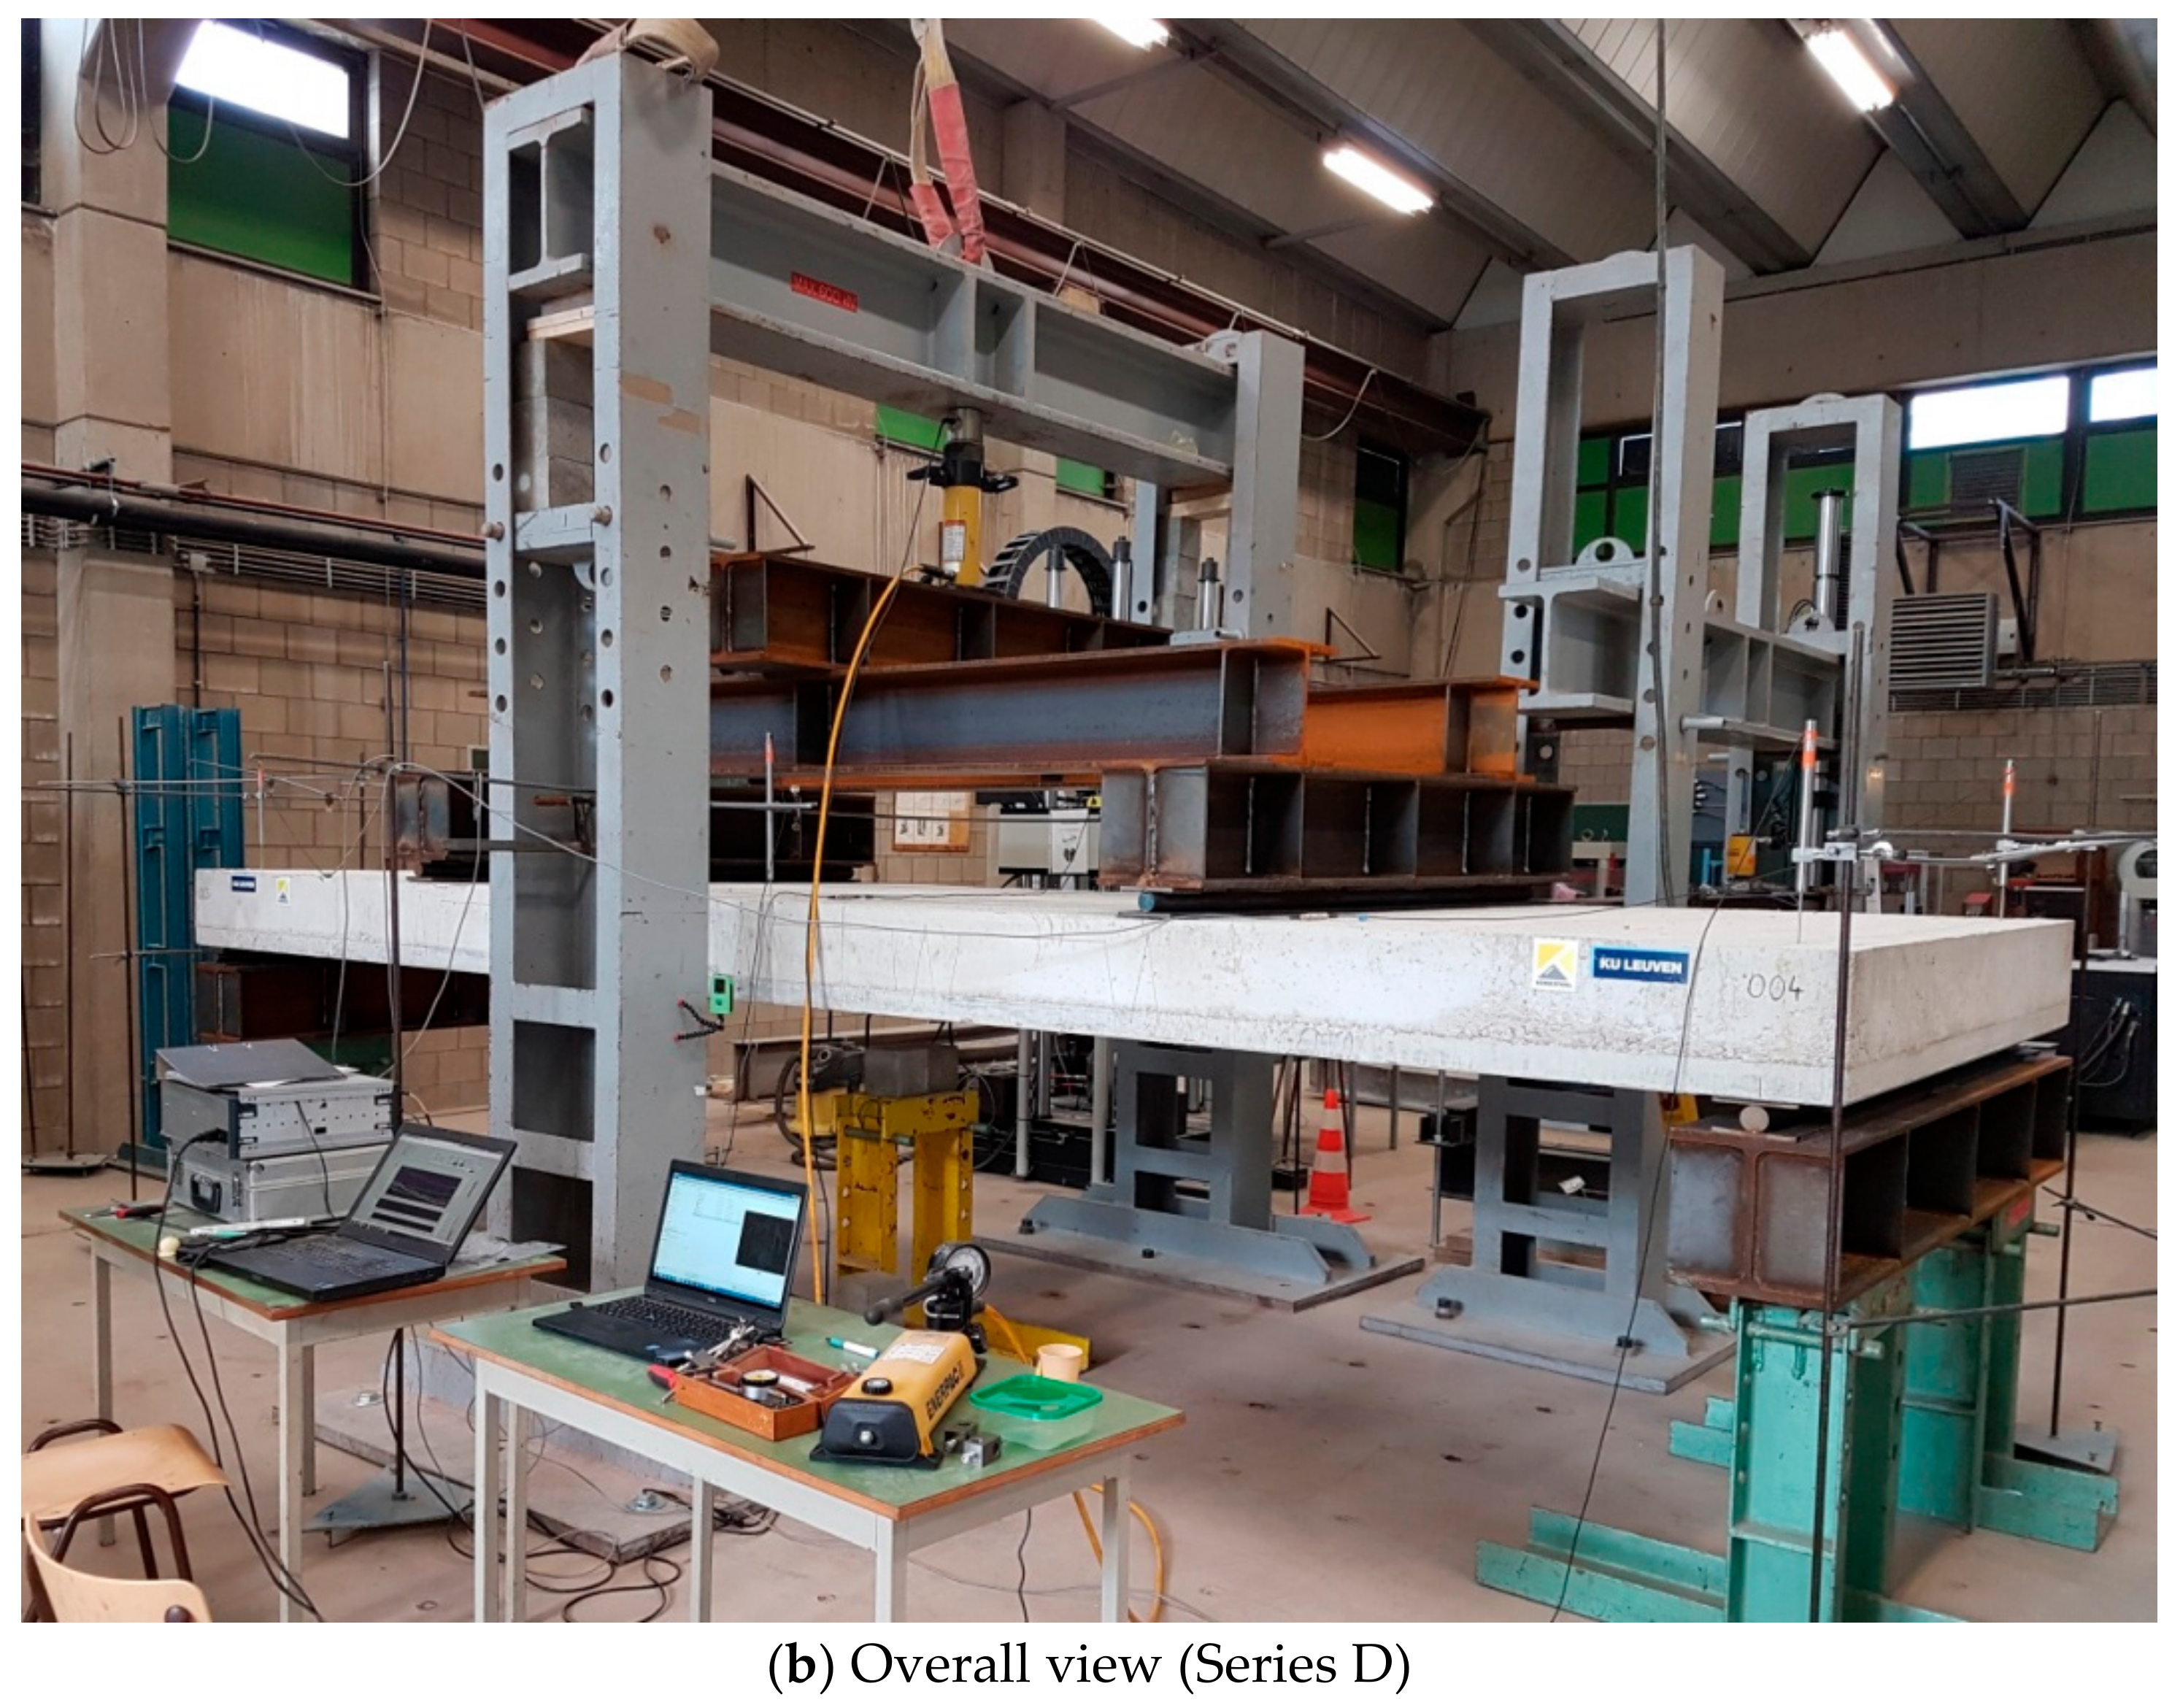
The test setup was a four-point or three-point bending test, as shown in
Figure 3. Dimensions are modified depending on the size of the voiding elements; the width (or span direction) must be a multiple of the grid. The solid reference test specimens were made with the same dimensions as the ones with voiding elements. The distance a/d was kept above 2. The three-point bending test setup was used to test the load transfer mechanism of transversal joints for two reasons: limitation of the available floor plate dimensions and, in most cases, this type of joint also does have to transfer shear forces (but more limited bending moments).
In total, 20 tests were performed, which are listed below. Each test series was dedicated to a specific topic. Reference solid and hollow composite slabs were made in series A and B. For series C this was limited to solid and for D to hollow composite slabs. Most important properties of all tests can be found in
Table 3.
- a.
First series of seven tests was performed with solid and Airdeck® voiding elements (roughly boxes of 19 × 19 cm² in a grid of 30 × 30 cm²), investigating mainly the presence of voiding elements, length, and the position of the overlap bars, and roughness for a longitudinal joint.
- b.
The second series of five tests were performed again with solid and Airdeck voiding elements, regarding the same aspects for transversal joints (indicated with the ⌐ symbol in
Table 3). These specimens were tested in three-point-bending, as mentioned above. Transverse rebar of 10 mm was used as a spacer on the floor plate.
- c.
The third series of six tests with solid elements focused on the position of the lattice girders (distance to the joint), where two of them were executed with a debonding poly methyl methacrylate (PMMA) sheet (Plexiglass) of 5 mm in between the floor plate and the topping, indicated as “Plexi”.
- d.
The fourth series consisted of two real-scale tests with U-Boot ® voiding elements (roughly boxes of 52 × 52 cm² in a grid of 70 × 70 cm²) and different roughness of the interface.
Symbols used in
Table 3 are already explained in the text.
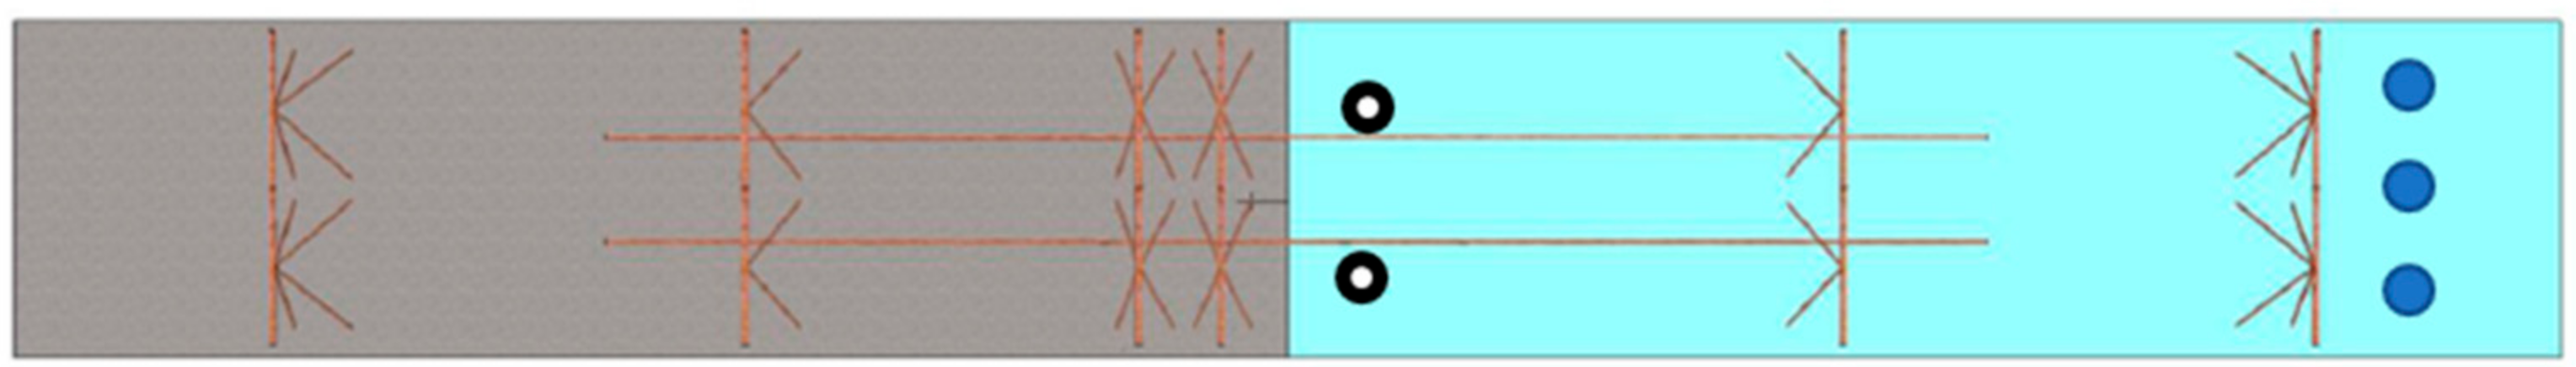
Test specimens C05 and CO6 were to be considered as elements with an initiated failed interface by the incorporation of a Plexiglas plate, see
Figure 4 (with the joint in the middle). Due to this plate, there is no adhesion, no mechanical interlock, and almost no friction available at the interface. To assure the transfer of shear forces coming from the vertical transverse shear force, 3M16 chemical anchors were set next to the support. Anchor rods M12 were inserted in an opening of Ø 16 mm through the concrete topping for C05 in combination with an opening of Ø 50 mm in the floorplate. Anchor rods were free to move according to the available clearance. For specimen C06, the anchor rod M16 fit precisely in the opening of the concrete topping and the opening in the floorplate was grouted; no movement of the anchor rods was allowed this time. By doing so, the contribution of an “equivalent lattice girder” or the effectiveness of a repair method can be verified.
2.3. Test Procedure
The load was applied by a hydraulic jack force controlled by means of a hydraulic pump and recorded with a load cell. Simultaneously, the midspan deflection was measured using linear variable differential transformers (located at midspan and on the supports). In test series C (except C01 and C03), two additional Linear Variable Differential Transformers (LVDT) were placed halfway between the supports and midspan, to provide a more realistic measurement of the deflection curve of the specimen. At midspan on both sides of the specimen, the horizontal strains were measured with a DEMEC mechanical strain gauge (gauge length of 200 mm, accuracy of 0.0015 mm) at five locations: (i) position of the lower chord in the floorplate, (ii) position of the overlap rebar, (iii) center height of the specimen, and (iv) approximately 30 mm and (v) 10 mm from the top. In test series C, at a position of 30 mm, 95 mm, and 400 mm near the joint, vertical strains were measured with a DEMEC mechanical strain gauge (gauge length of 150 mm, accuracy of 0.0015 mm) in order to detect delamination of the floor plate.
Additionally, in test C05 and C06 the horizontal displacement between floor plate and topping at the support (“Plexi” side) was measured with a LVDT. During the tests in which the lattice girder near the joint was replaced by two rods, the force in these rods was measured with a hollow core loadcell. Crack formation was monitored on both sides of the slab.
3. Results
One of the main observations that can be made during the experiments are the load-deflection curves. For some experiments, intermediate points are also measured (some of the C-series of experiments) to better understand the flexural behavior. Yield and failure loads are listed together with the calculated ultimate loads; some aspects of these calculated loads will be discussed in
Section 4. As described before, horizontal strains at several levels and even vertical strains were also measured. At the end of this chapter, some visual and related nonvisual observations are treated.
3.1. Load-Deflection Curves
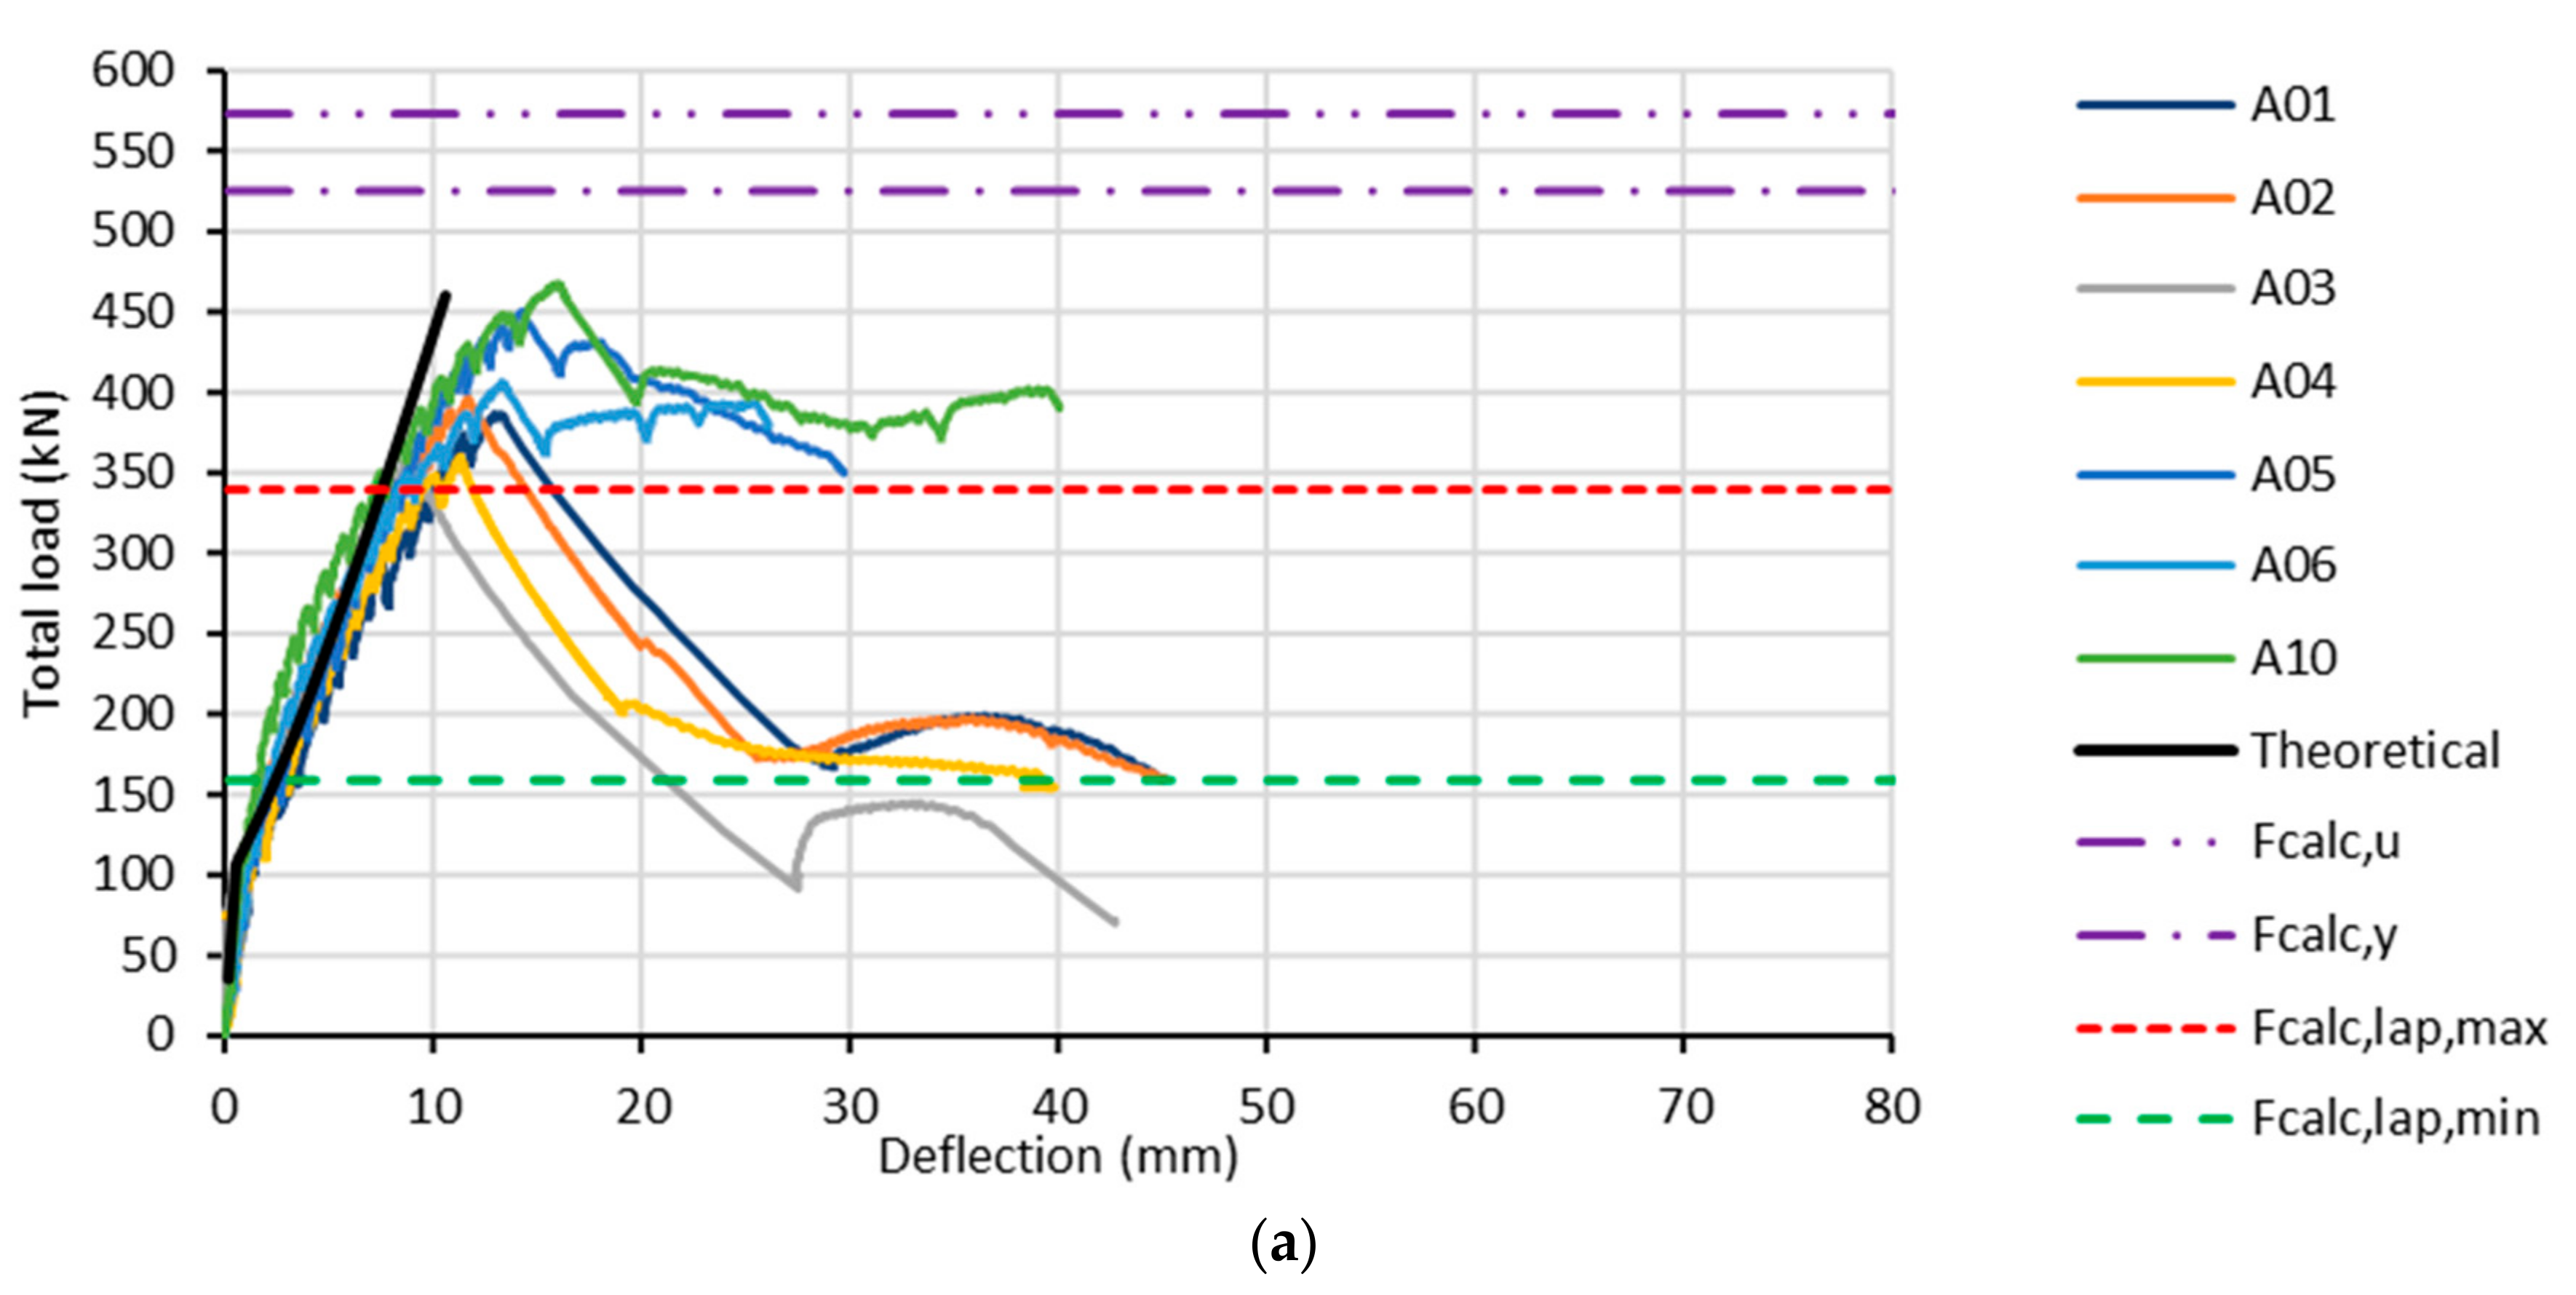
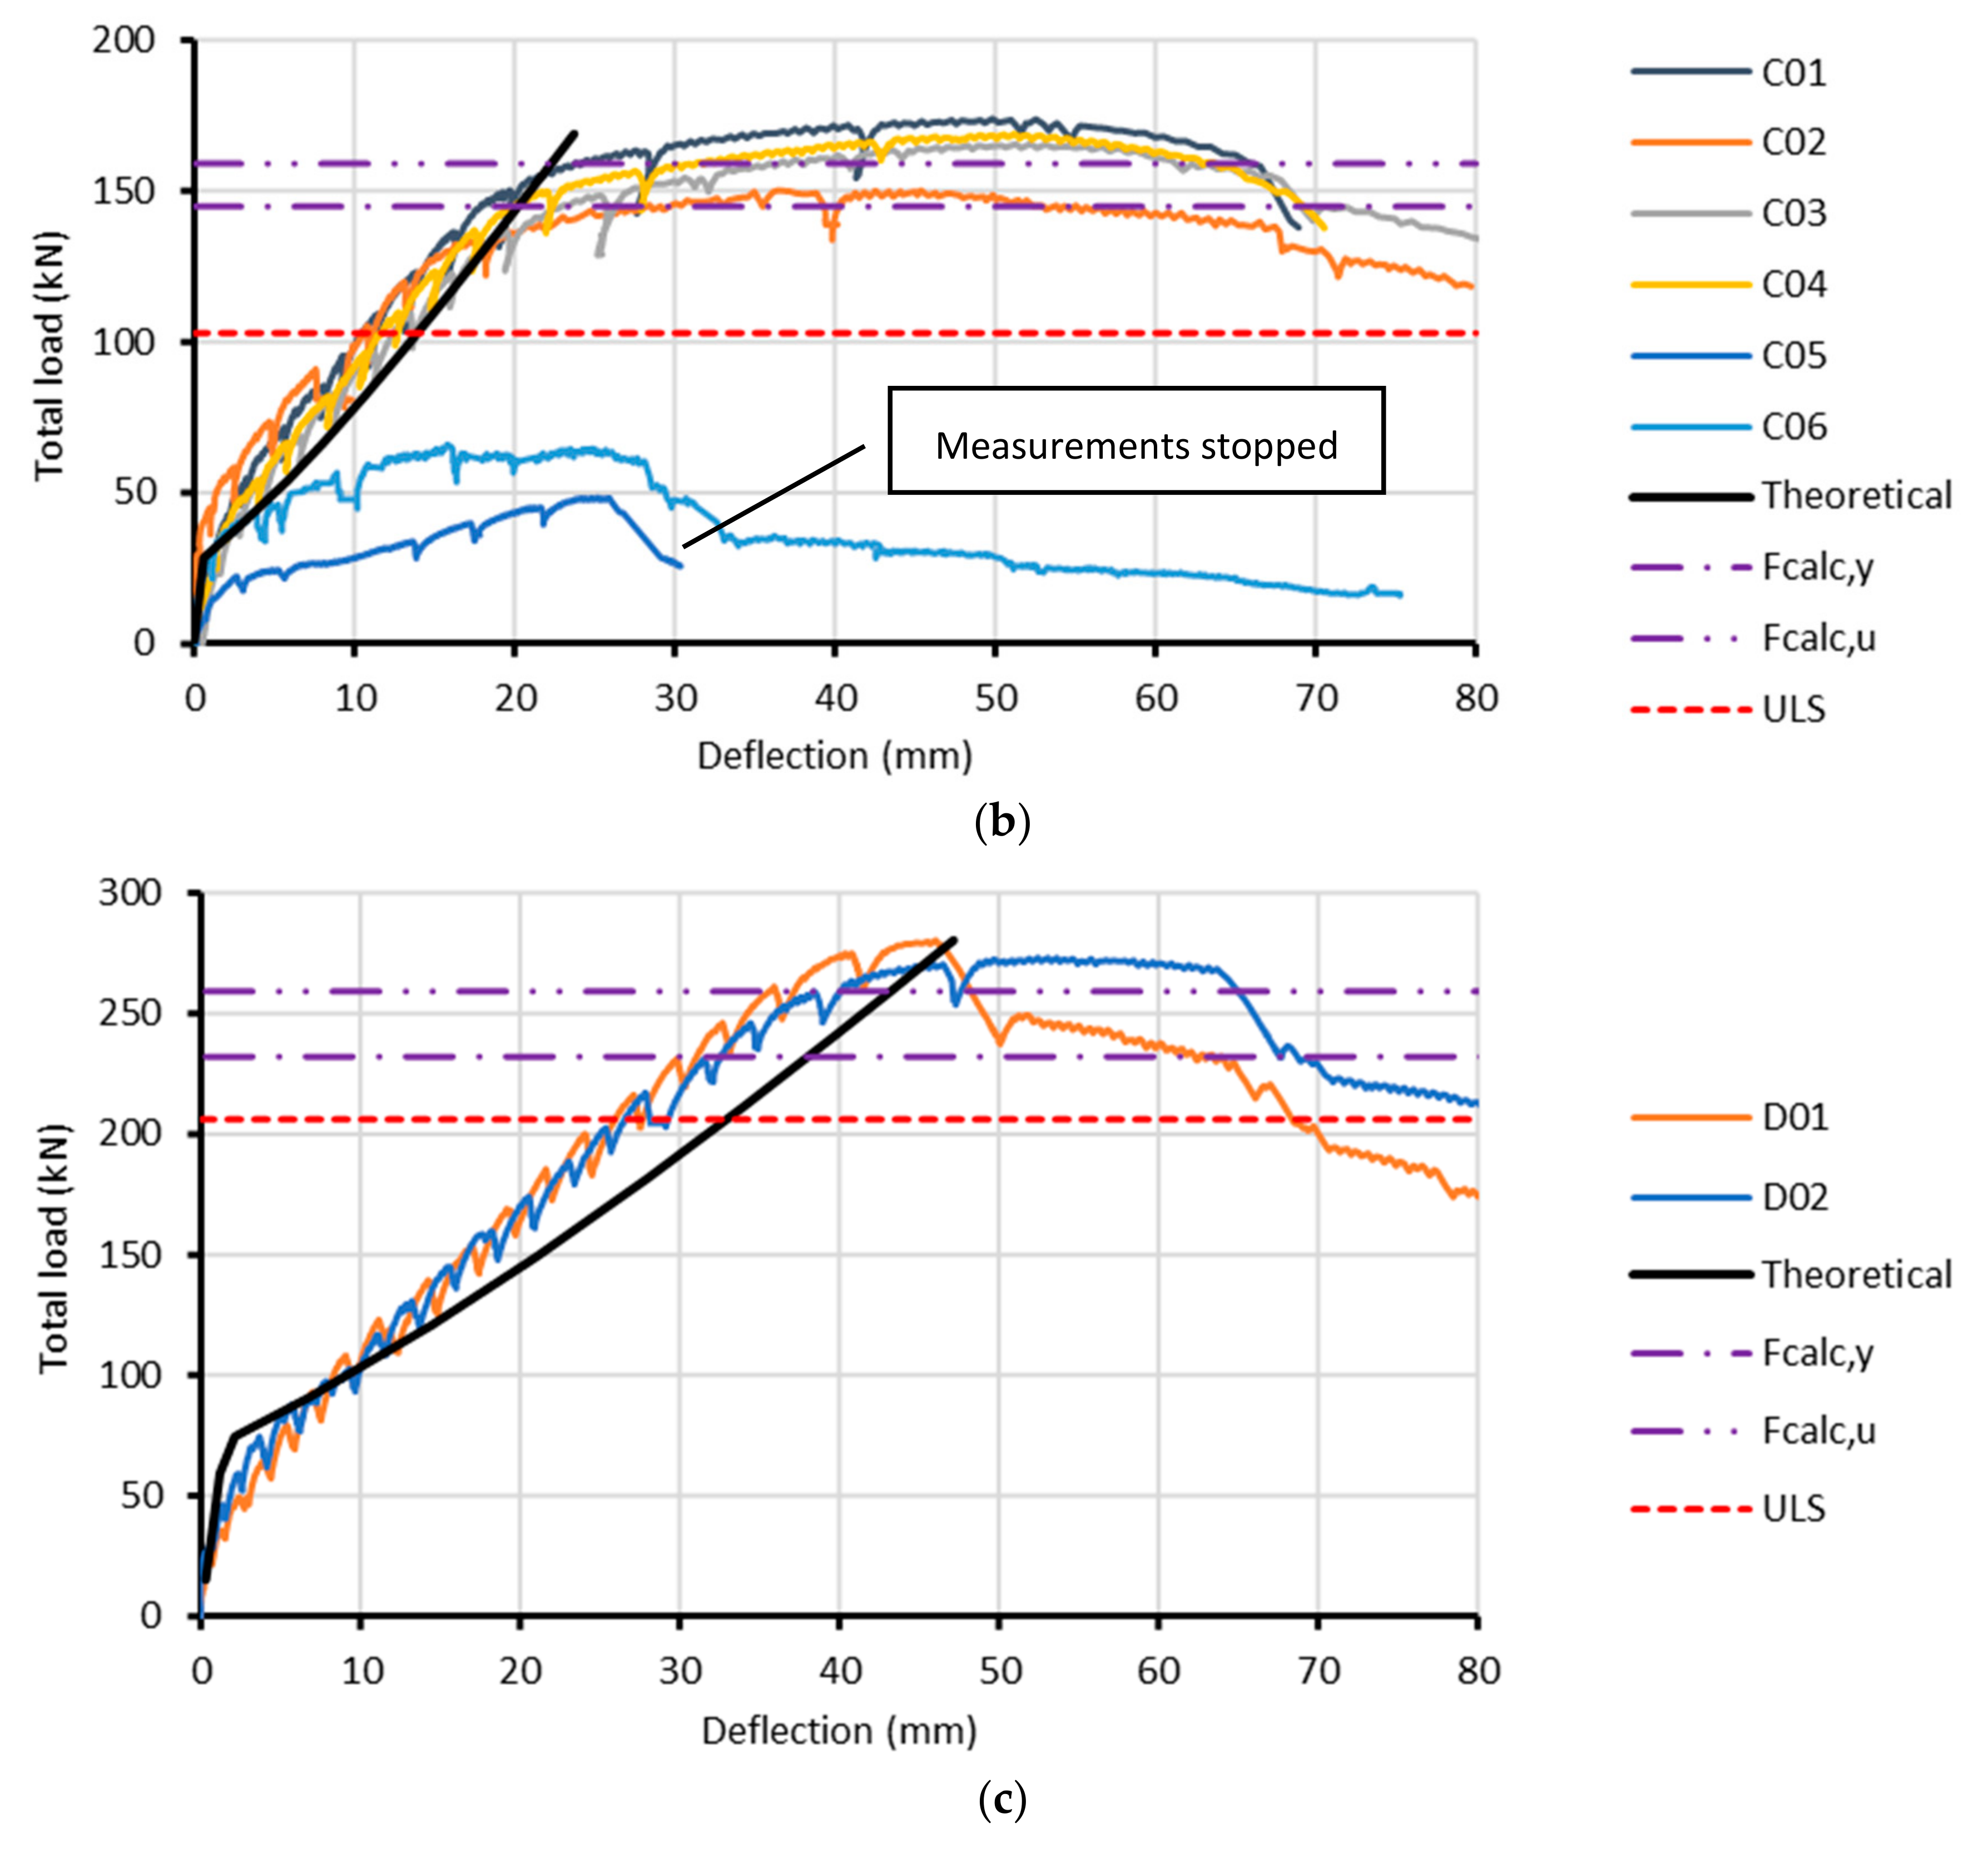
For all longitudinal joints tested (A-, C-, and D-series), the load-deflections are given in
Figure 5; different parameters can be found in the
Table 2;
Table 3,
Section 2.1.1 and
Section 2.1.2. The transversal joints (B-series) are not represented as these diagrams are not valuable. The reinforcement ratio leads to almost the same resistance moment as the one of the uncracked concrete; in addition, these tests are also three-point bending tests. Nevertheless, other observations are discussed. The theoretical behavior of the slabs is simulated by the aid of mean values for the mechanical properties and the production formula from [
4], based on the distribution coefficient ζ, depending on the ratio of the moment at the first crack (
Mcr) and the one applied (
M), see Equations (1) and (2).
where:
δtot = total vertical deflection = theoretical value indicated in
Figure 5 (solid black lines);
δc = vertical deflection based on a cracked second moment of area of the section;
δnc = vertical deflection based on a noncracked second moment of area of the section;
β = coefficient that takes into account the load duration or of repeated loading = 1 (short duration);
σs,r = stress level of the rebars under the loading causing a first crack, belonging to Mcr;
σs,c = stress level of the rebars for a cracked section in the appropriate limit state, belonging to M.
Further on, an approximation is made for the load–deflection curves based on an equivalent uniform load that causes a deviation of about 10% (underestimation of the stiffness), which is still acceptable for deformation estimations. To account for the presence of voiding elements, the weight was reduced to only 20 kN/m³ instead of 25 kN/m³ for solid slabs and the second moment of area, and the section modulus was adopted. The latter decreases the cracking moment Mcr for slabs containing voiding elements.
From these figures, it is seen that the A-series do not reach the full capacity of the joint due to shorter overlap reinforcement and a shift of the starting point of the overlap. This was previously discussed in [
28], and can be attributed to the location of the first lattice girder at 300 mm from the joint. Nevertheless, the slabs seem to react relatively close to the expected curve (abbreviated as Theoretical), only the solid slab reacts stiffer, which should be expected. The ratio between the measured to the calculated value (
Ftest/
Fcalc,u) and explanation of observed differences is postponed to
Section 4. The retained value after a first peak seems to correspond reasonably well with the strength of the joint, based on the reduced overlap length. Results of the solid slab (A10) correspond to the one with bended up reinforcement (A06) and the one with anchor rods (A05). Overlap rebars were broken by none of the tests, which might be expected as the expected yielding
Fcalc,y and failure load
Fcalc,u were not reached.
The C-series of solid slab tests perform all very well and react as can be expected, based on the theoretical model from [
4]. The deviation of the slope of the load–deflection curve can be explained by the unfavorable approximation (uniform versus 4-point) made where the stiffness is underestimated. The C05 and C06 tests need some extra attention, which will be given later. Besides these tests, the failure mode was governed by the tensile strength of the overlap reinforcement, which was also the case in the B-series.
It seems that the D-series reacts much stiffer as a solid slab. In these tests, the first lattice girder is situated at 95 mm from the joint, which makes that no delamination could be observed, see
Section 3.3.1. While a reduction is made for the presence of the joints, the stiffening effect of the transverse ribs was neglected. This effect, together with the unfavorable approximation, which is more critical due to the lower dead load, explains the more substantial deviation observed in these tests. Again, rupture of the overlap reinforcement was the cause of failure as for the C-tests. While the untreated floor plate upper face results in a higher capacity (benefit in lever arm), it must be admitted that there is some influence on the post-peak value.
It is seen that all curves of similar tests do show the same shape of the load–deflection curve, the same yield, and ultimate load. Influence of a spacer can only be found in a slight increase of the lever arm (which means that out of mechanical resistance, a spacer is not needed); compare A01-A02 with A03-A04. In addition, the roughness of the interface has a barely noticeable difference; compare A01-A03-D01 with A02-A04-D02. Contrarily, major differences can be found in:
The position of the lattice girder or anchoring rods and the post-peak value in the A-series of tests. Looking at the C- and D-series of test lattice girders at 95 mm distance of the joint seems to guarantee a solid behavior of the slab with voiding elements. Without voiding elements, the behavior seems to be not influenced until a 400 mm distance is reached (A10 = 300 mm and C04 = 400 mm).
The effective length of the overlap bars determines the bending capacity, ratios of tested values, and calculated ones based on the available overlap length are discussed in Chapter 4. More information can also be found in [
28].
Without good bond conditions for the Plexi-plate tests C05 and C06, the development of forces is entirely different and will not even reach the cracking moment of the section under the most unfavorable circumstances (C05).
3.2. Deflection Shape of the Slabs
Whereas
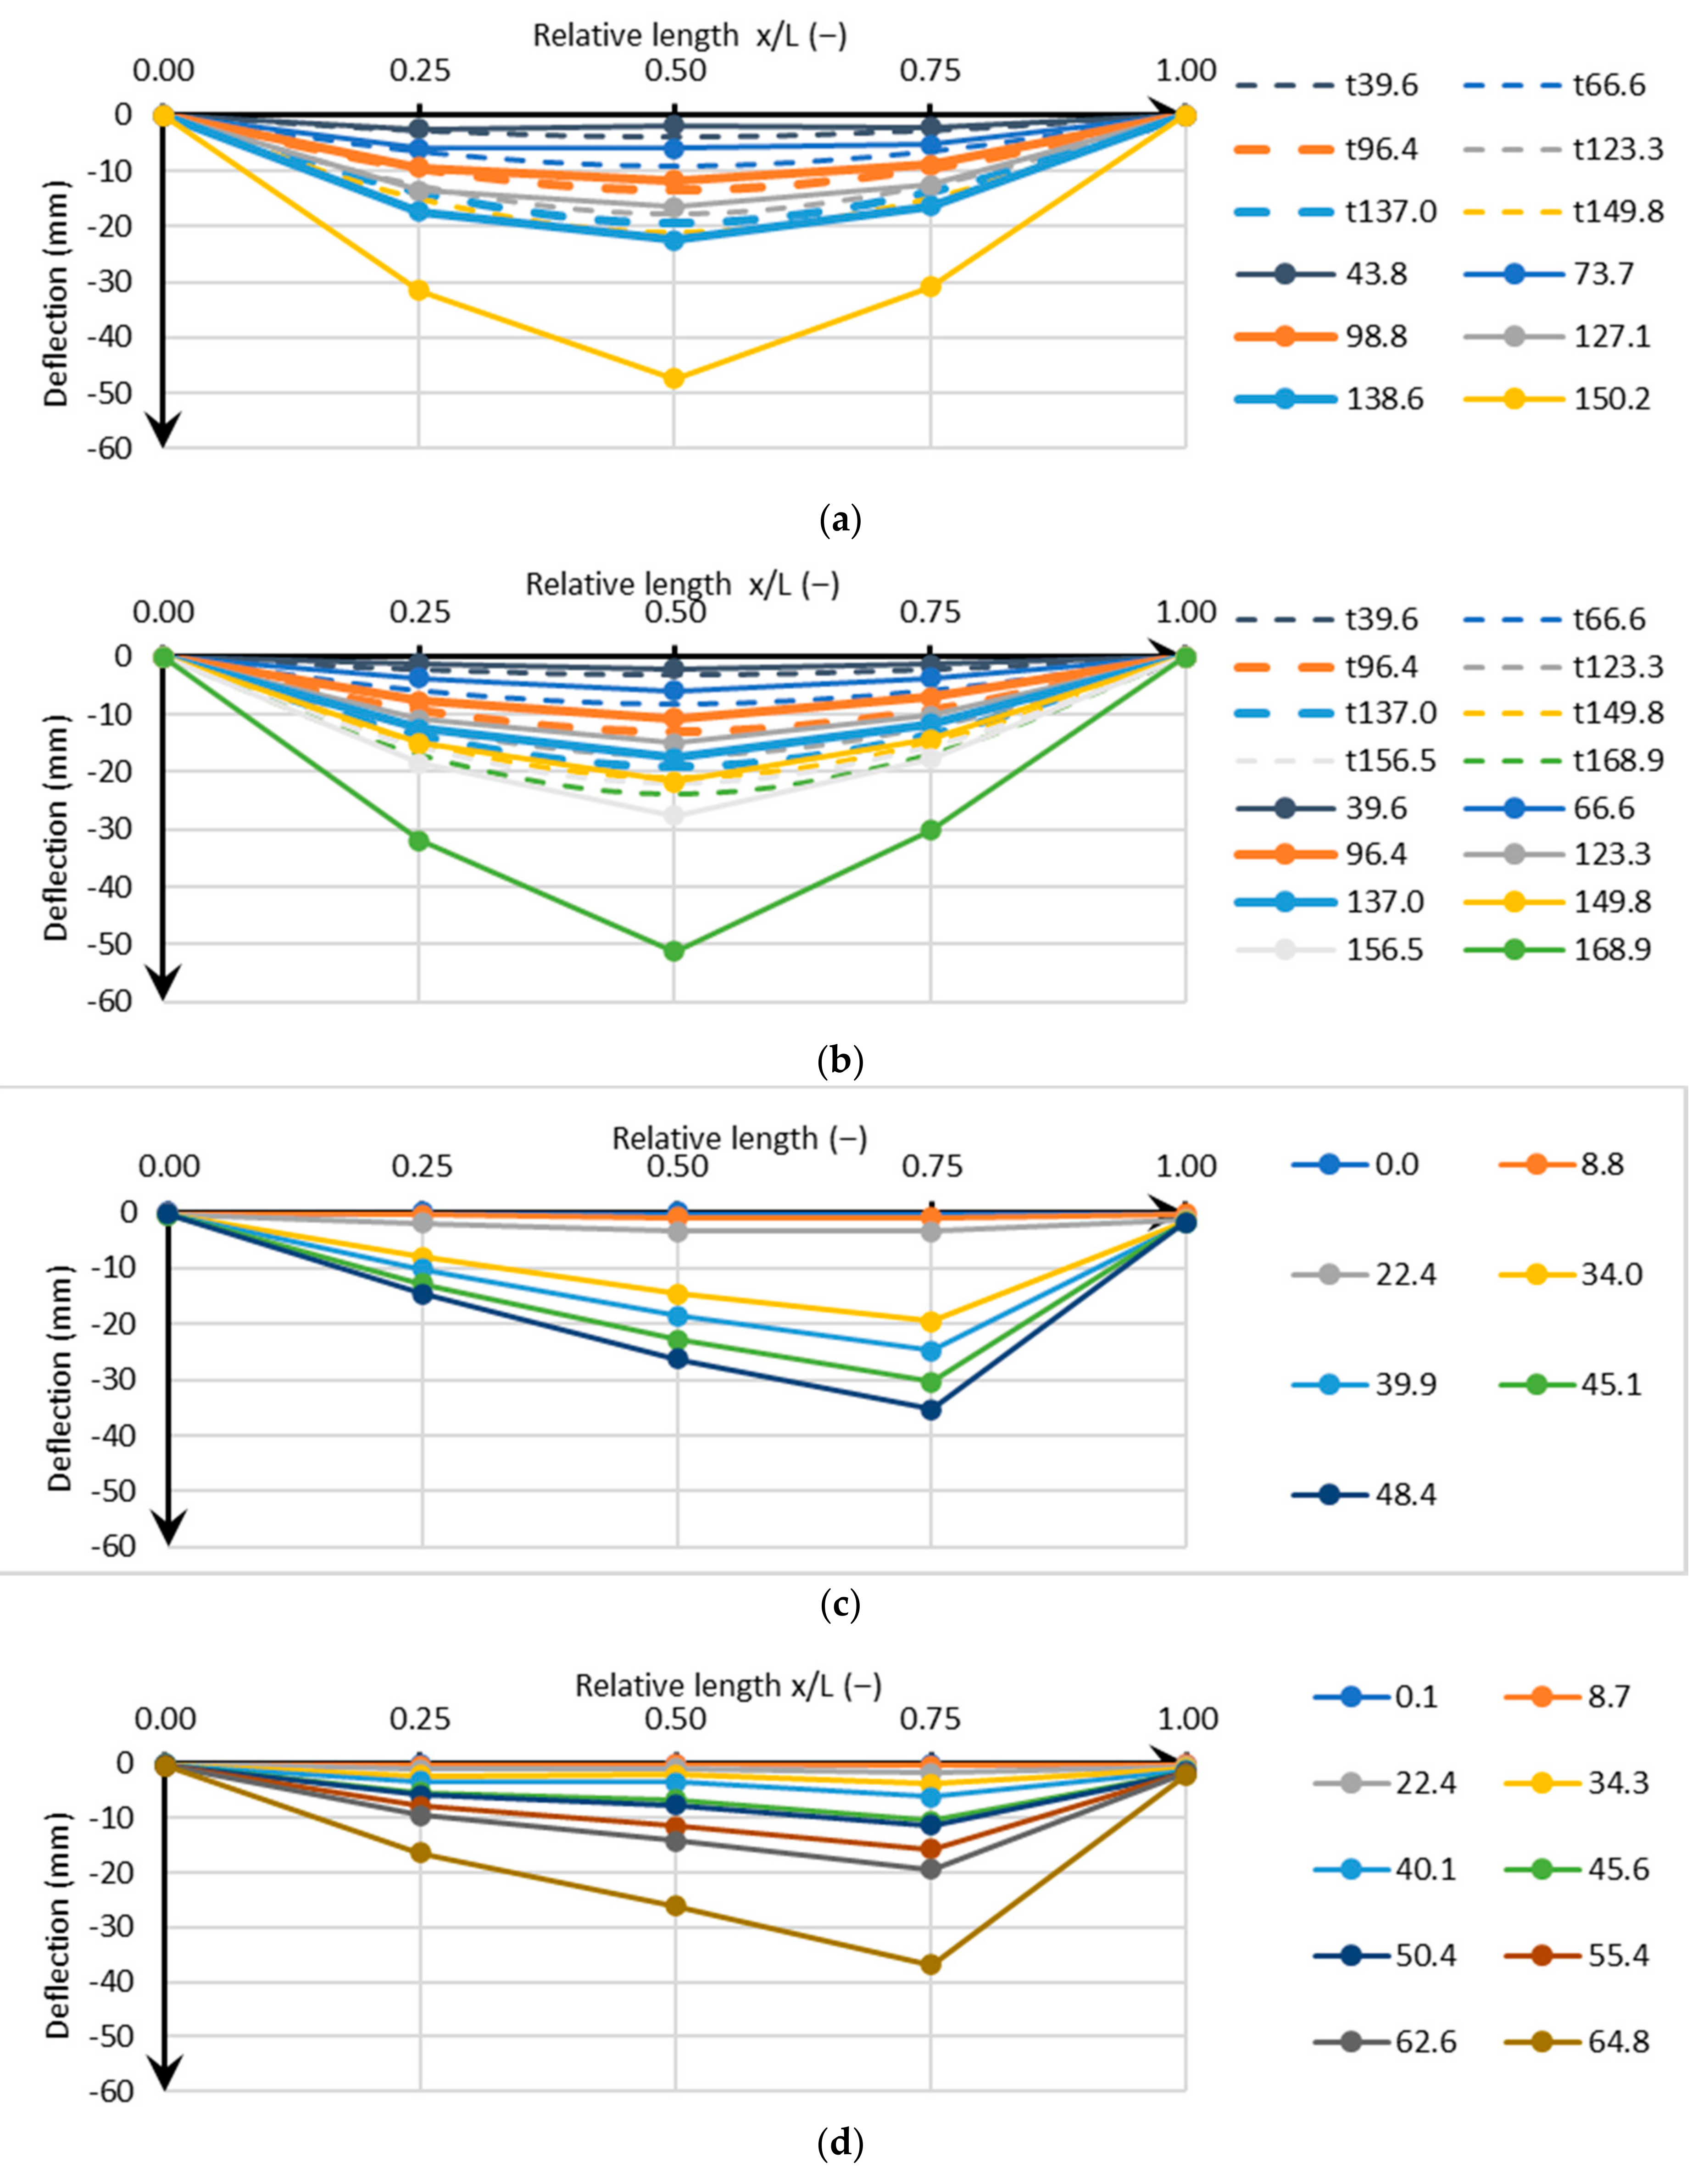
Figure 5 shows the maximum deformations at midspan, measured, and calculated, questions arise if the behavior of the beam can also reasonably be predicted along the longitudinal axis. From Euler–Bernoulli beam theory, the influence of a small reduction of the second moment of area, at the joint location, should be limited as far as the beam reacts elastically. Four experiments were executed with additional devices along the longitudinal axis to obtain an idea about the deformation shape and if this can be reasonably calculated based on classic beam theory. Results are shown in
Figure 6; the solid lines with the dots are the connected linear measurements while the dashed lines are those following the theory (only given for C02 and C04).
It can be seen that in for the C04 test, an initial crack appears at the beginning with almost straight lines to the point of a maximum deflection, after which the whole section becomes cracked; measurements and theory therefore coincidence. It deviates again in the final stage where a plastic hinge is formed in the middle.
It might not be a surprise that for the test specimens C05 and C06, with complete delamination of the interface, the deformation shape becomes asymmetric and completely different. The location of maximum deflection moves towards the plastic hinge at the end of the overlap bars.
3.3. Strains
3.3.1. Horizontal Strains
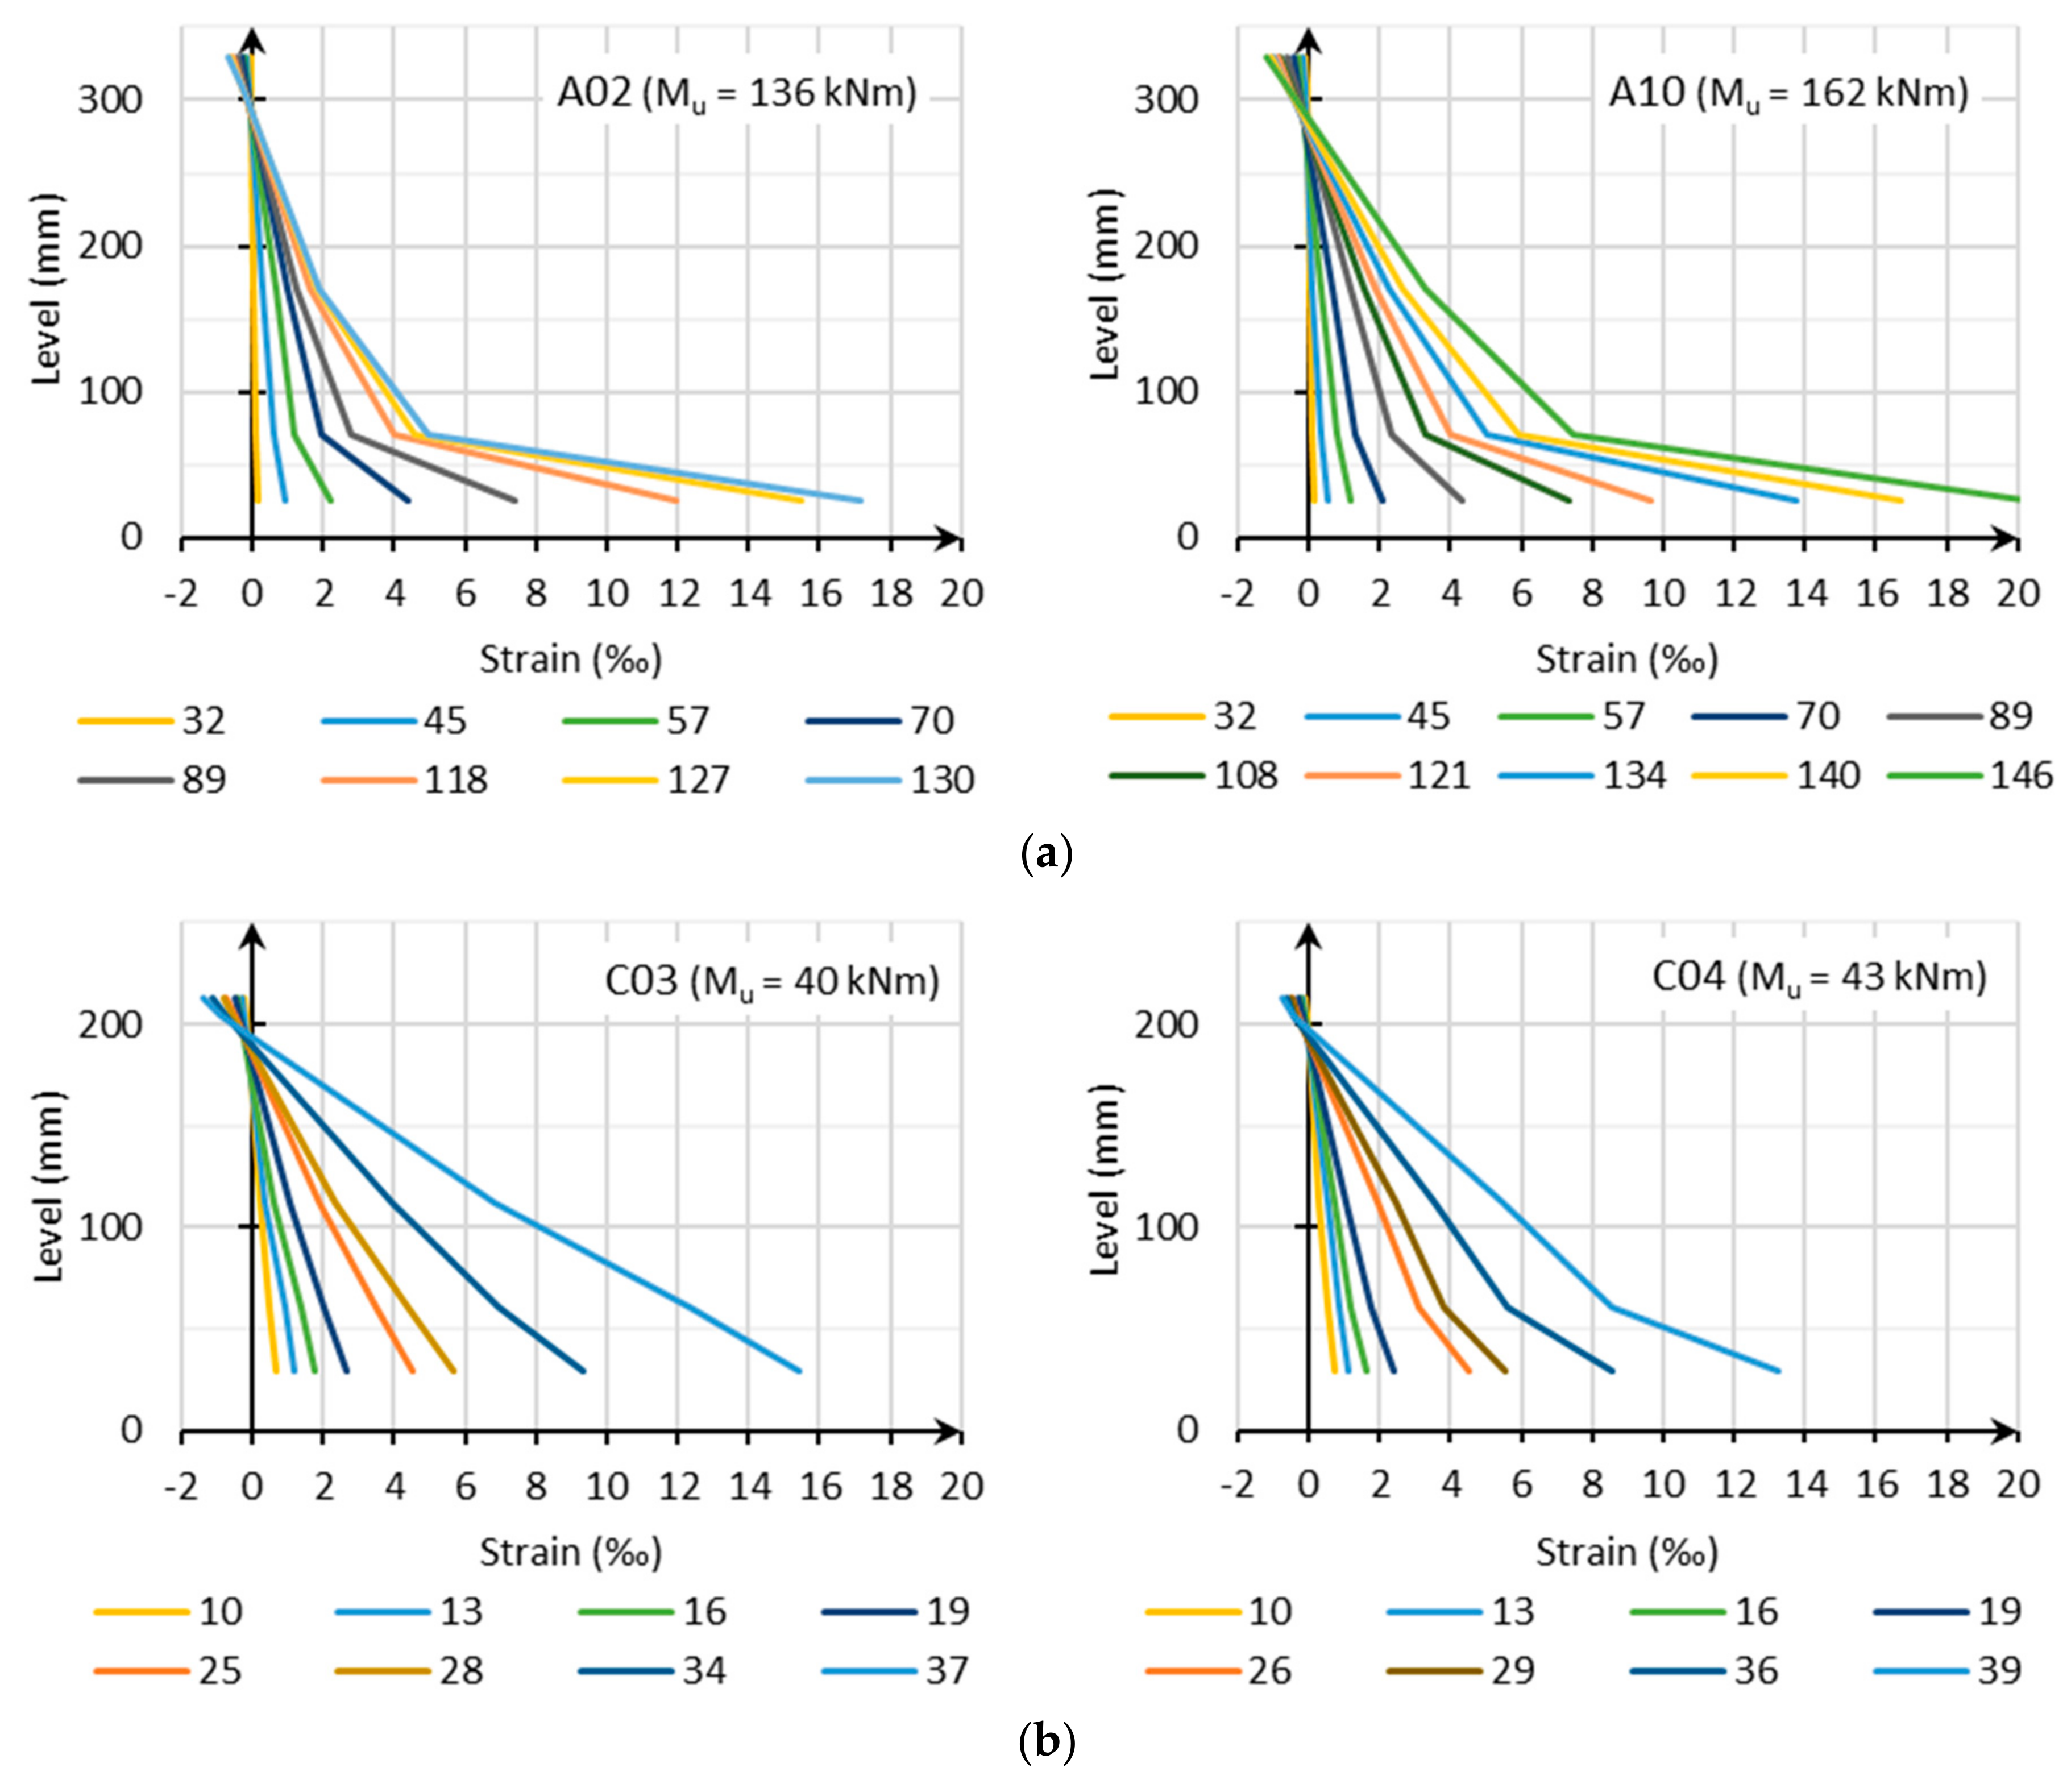
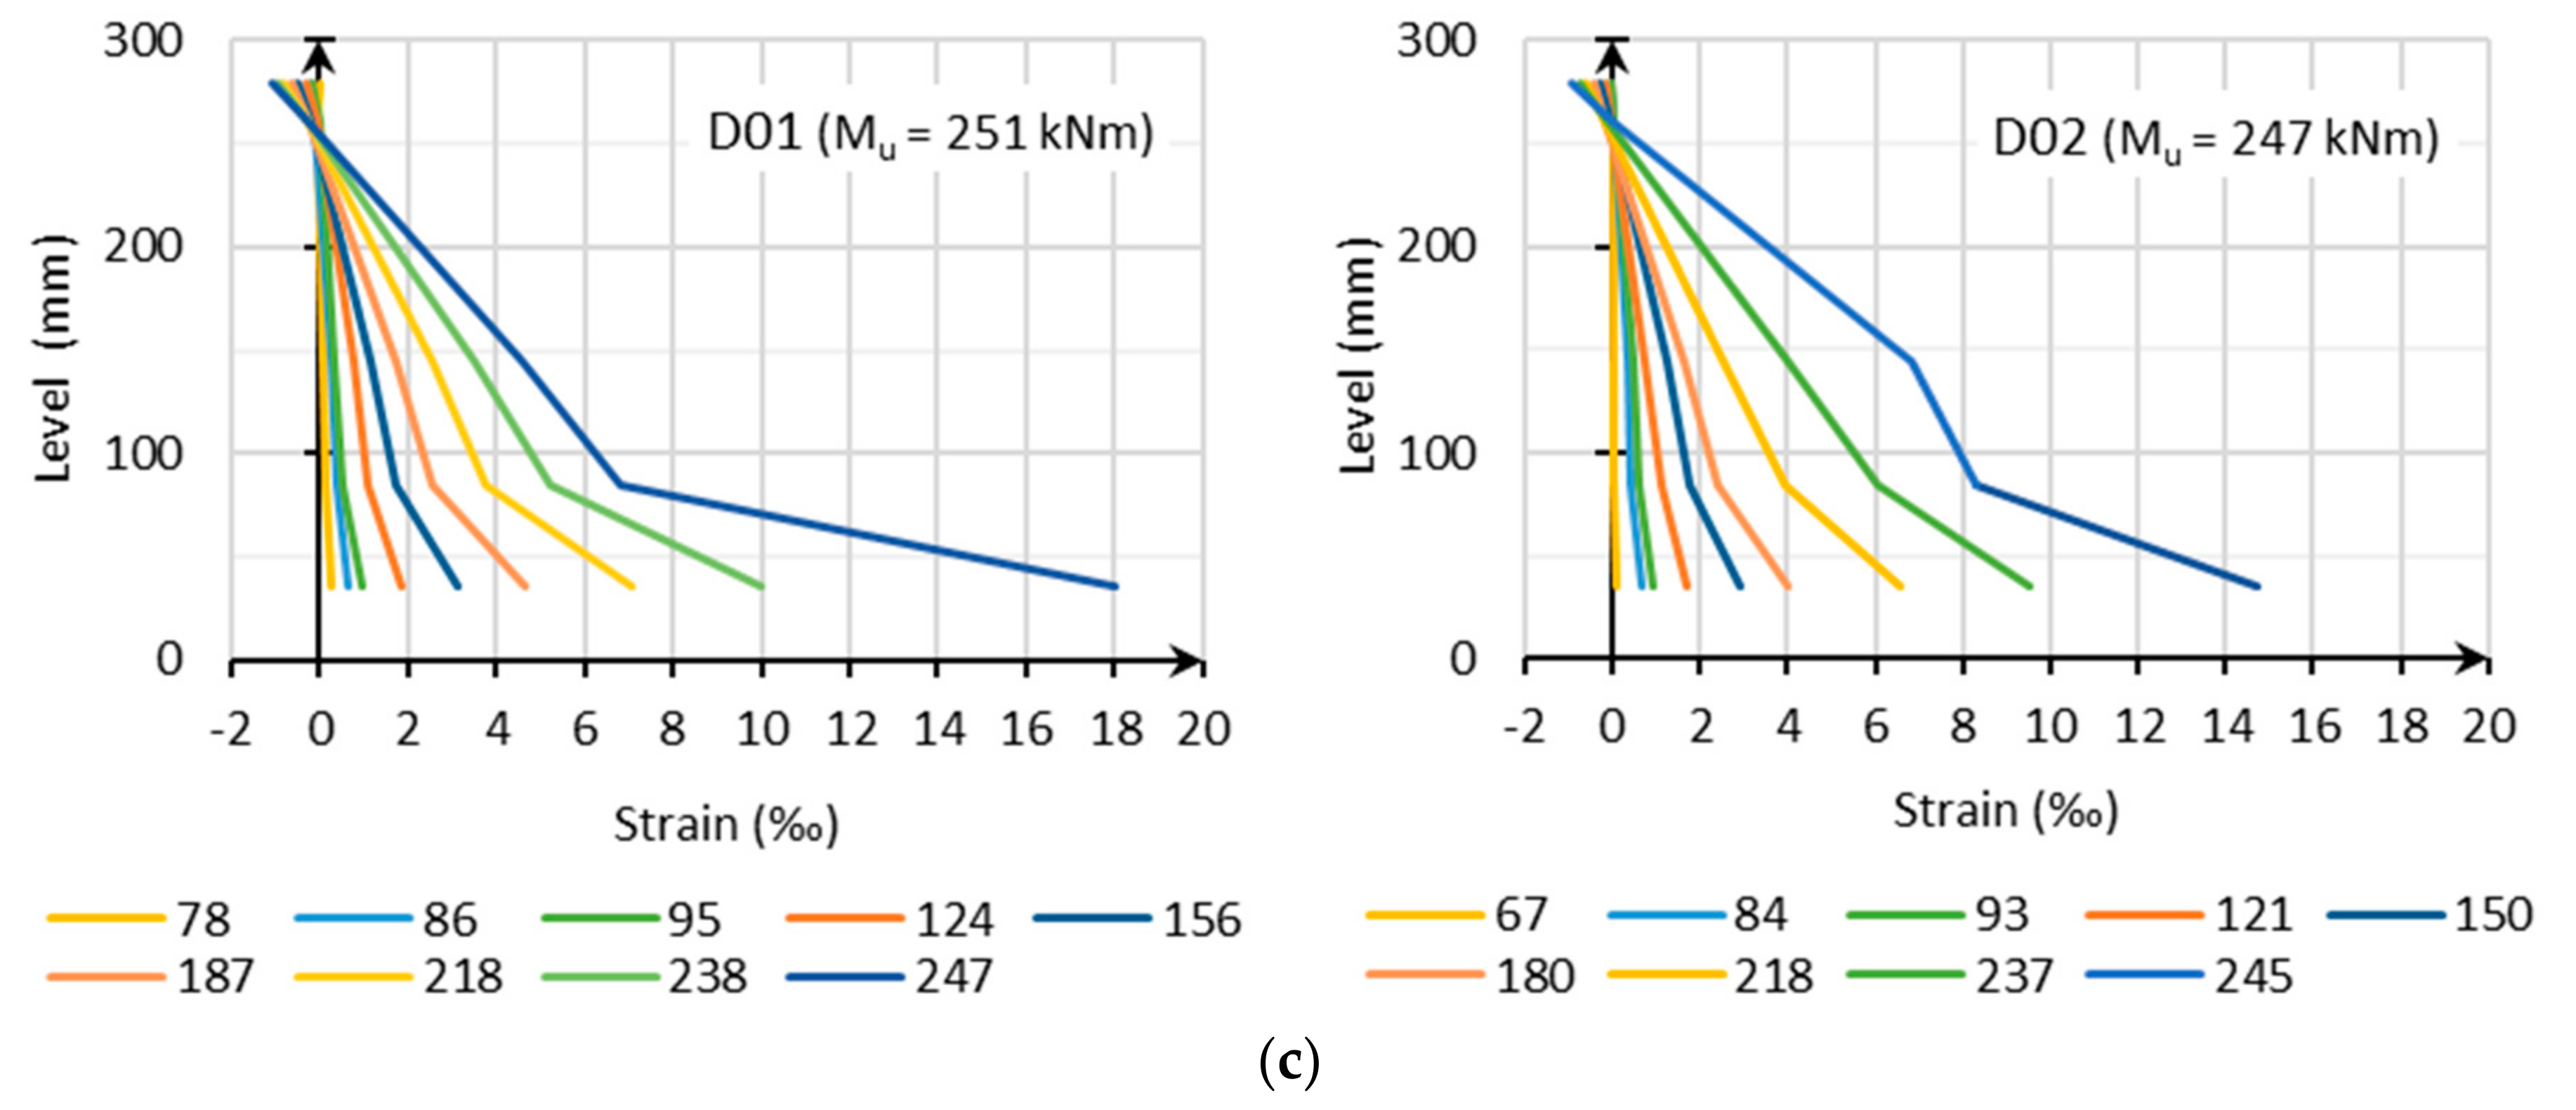
The main values of the horizontal strains measured on both sides of the specimen at five levels (see
Section 2.3) are used to evaluate the deformation of the cross-section at midspan. The diagrams in
Figure 7 show that for some specimens the evolution of this deformation is a function of the applied moment (including the dead load—see Equation (4), further on) and are used to evaluate following parameters: (a) presence of voiding elements, (b) the position of the lattice girder, and (c) type of finishing of the floor plate.
Comparing the results of A02 (Airdeck®) and A10 (solid) gives insight into the effect of the voiding elements. In A10 the strains at the lower level are smaller than in slab A02, for the same load level. However, the strains in the topping are larger, indicating a more monolithic behavior of the solid composite floor. The position of the lattice girder to the joint has a clear influence on the deformations of the slabs as a whole. In slab C03, the lattice girder is positioned 95 mm from the joint, resulting in a permanent monolithic behavior of the floor plate and the topping, and validity of Bernoulli’s hypothesis over the entire slab depth. In C04 the lattice girder is placed 400 mm and a clear shift in strain in the floor plate and the topping is observed. However, it can be seen that the strain at the lower level in the cross-section is very similar in both slabs. In series D, two types of finishing of the floor plate were tested: a smooth (D01) and an intended surface (D02). Only a small difference in behavior (slightly larger strains in D01) can be observed between the two slabs.
A supplementary vertical crack passed the measurement basis at the highest load level of the D02-test (245 kNm), which causes an extra deviation of the observed strains.
3.3.2. Vertical Strains
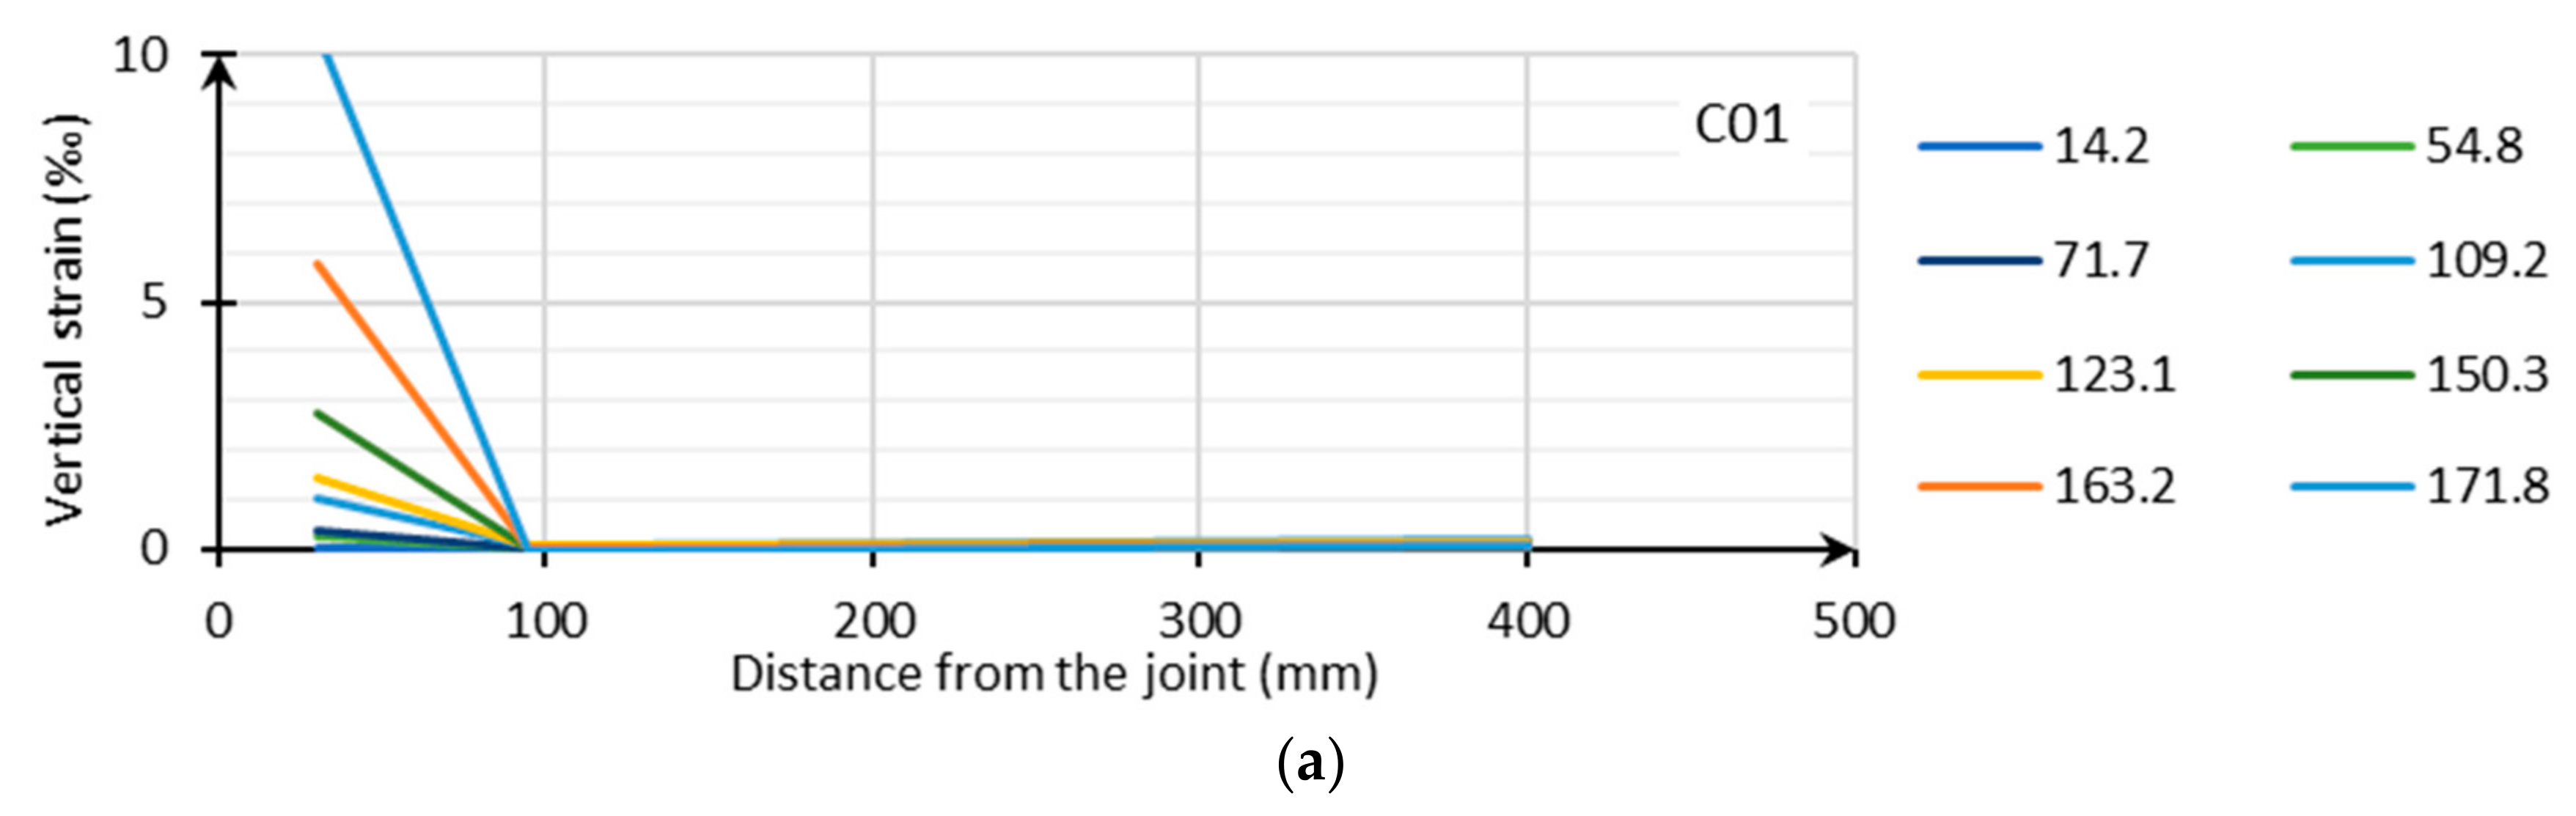
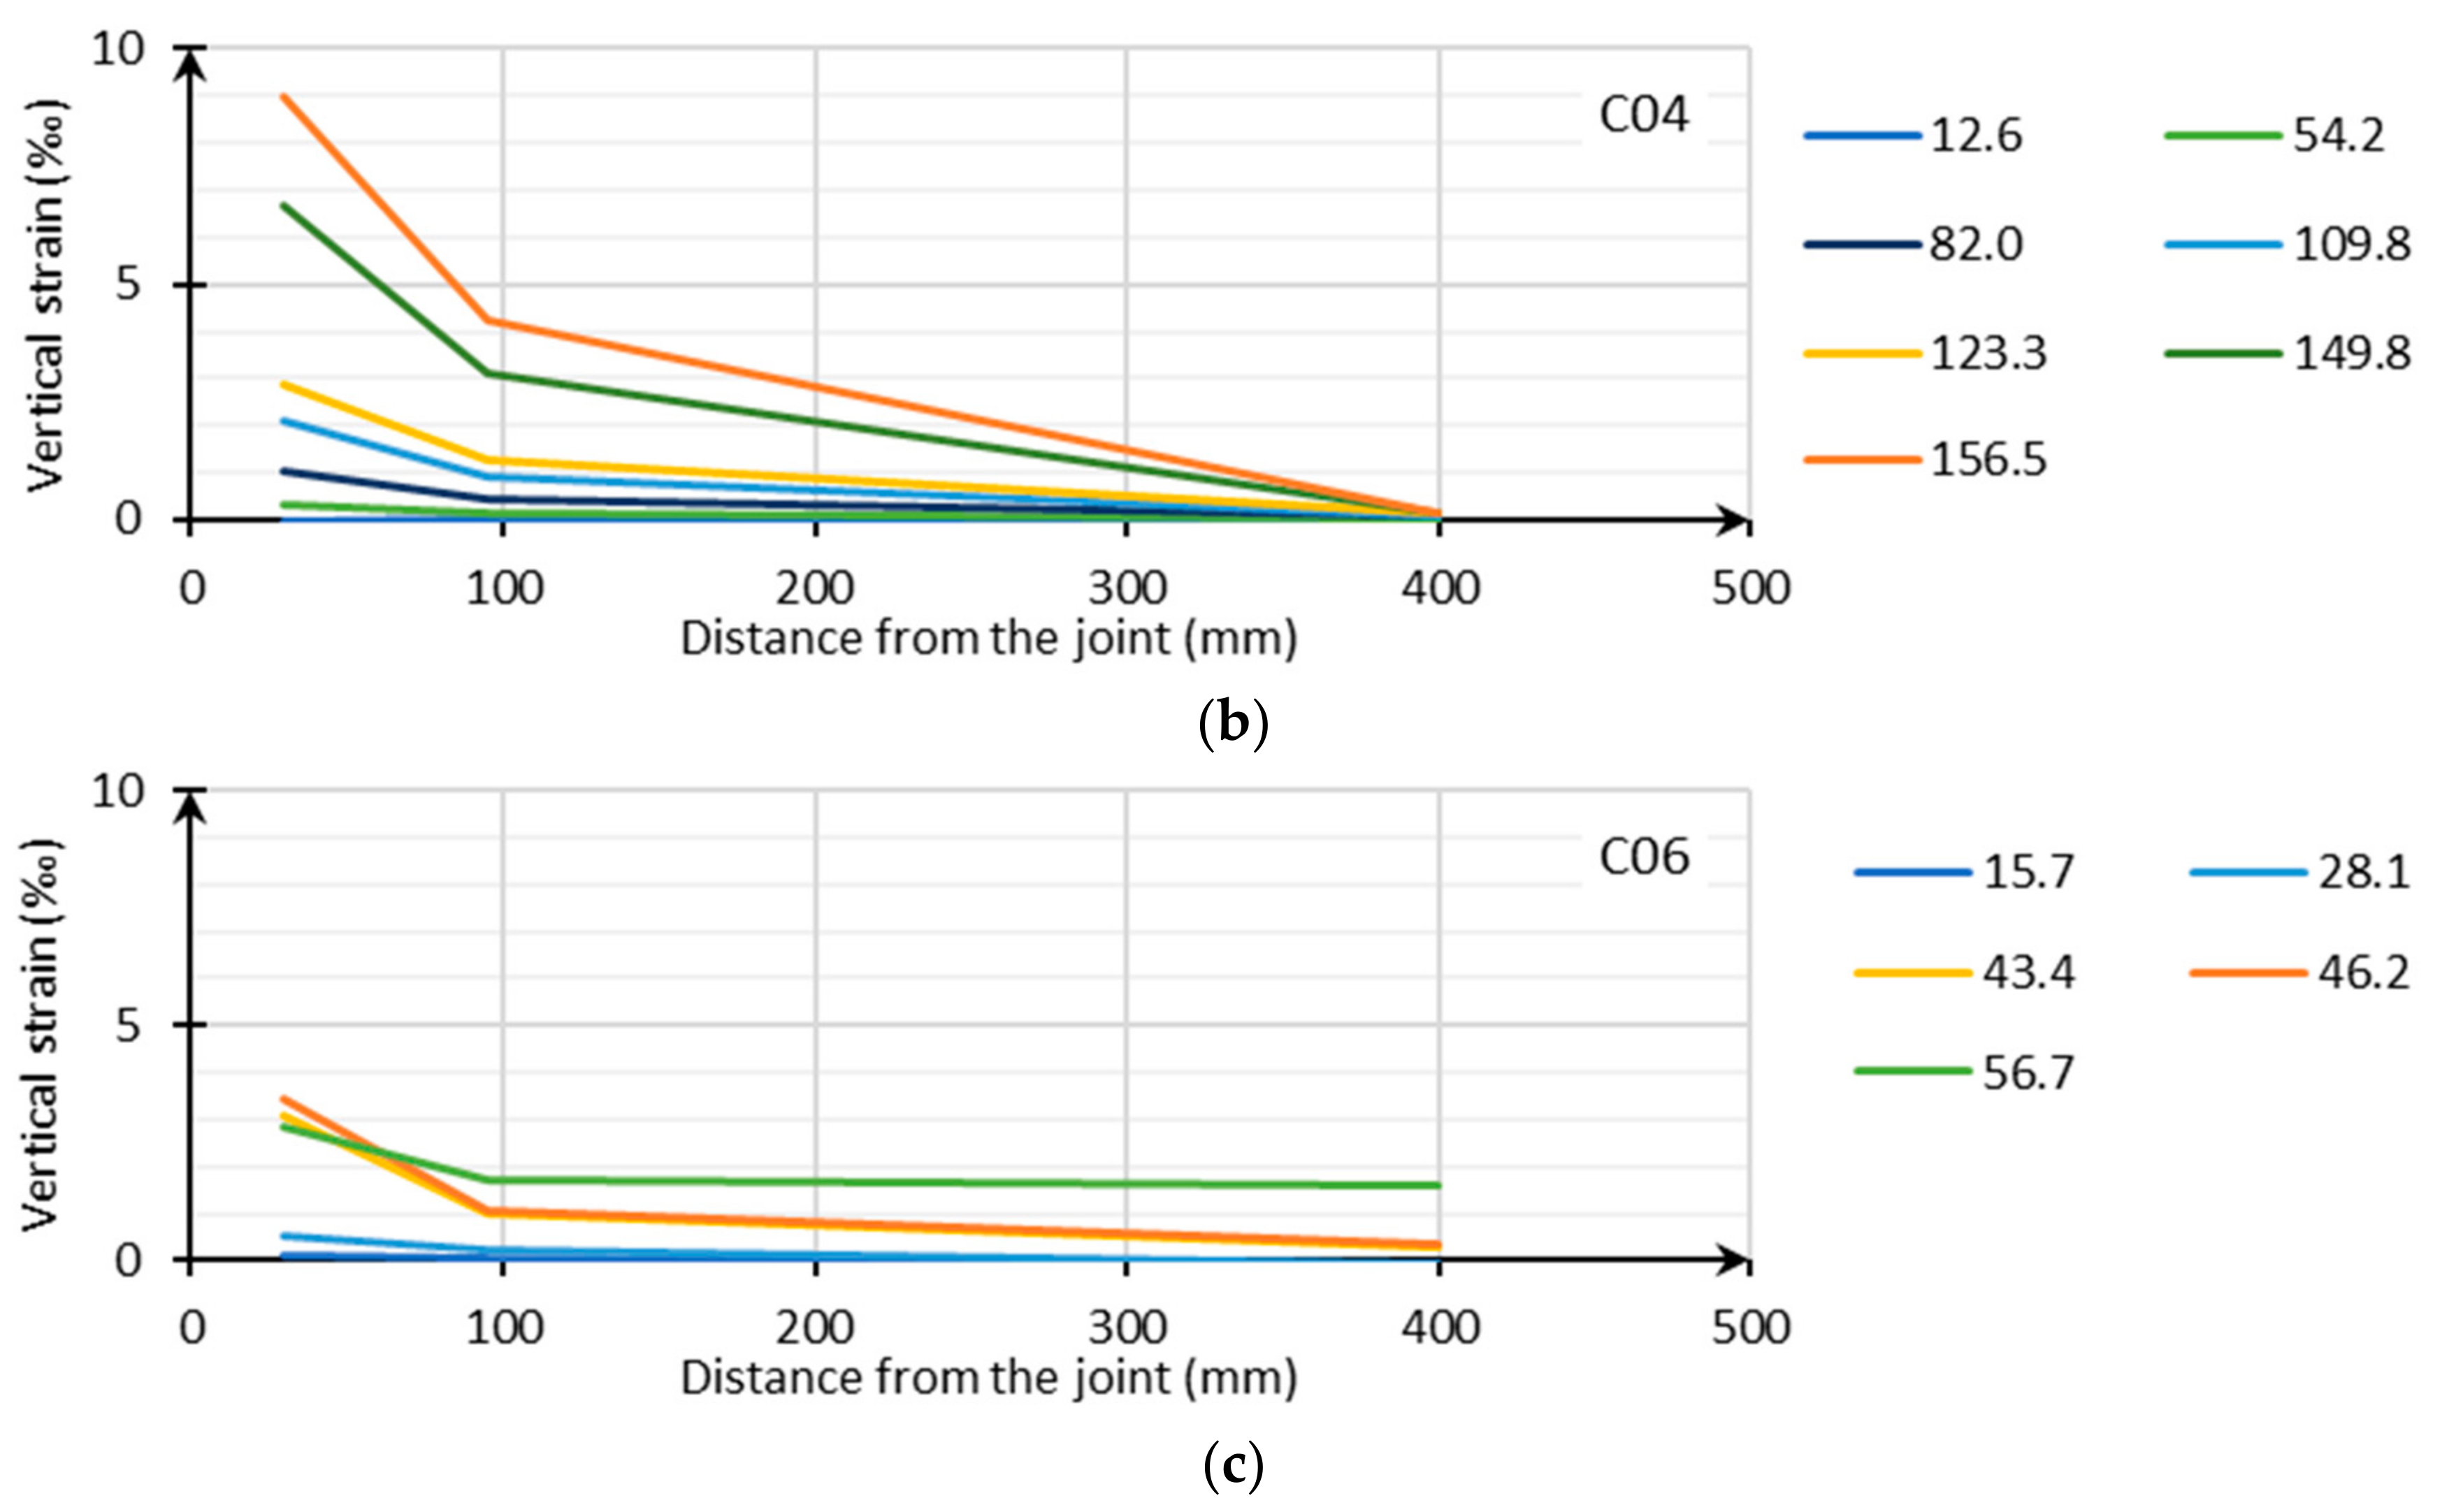
To detect possible delamination between floor plate and topping, vertical strains near the joint were measured in series C,
Figure 8. The results show that only delamination is detected in the zone between the joint and the lattice girder positioned at (a) 95 mm (C01) and (b) 400 mm (C02) from the joint. Due to a horizontal crack, the strain measured at 30 mm is higher for C01 than C04. In
Figure 8c the vertical strains for C06 (with Plexi) are given. The measurements do not really represent vertical delamination, but are caused by the horizontal displacement between the floor plate and the topping, resulting in an angle rotation of the vertical basis.
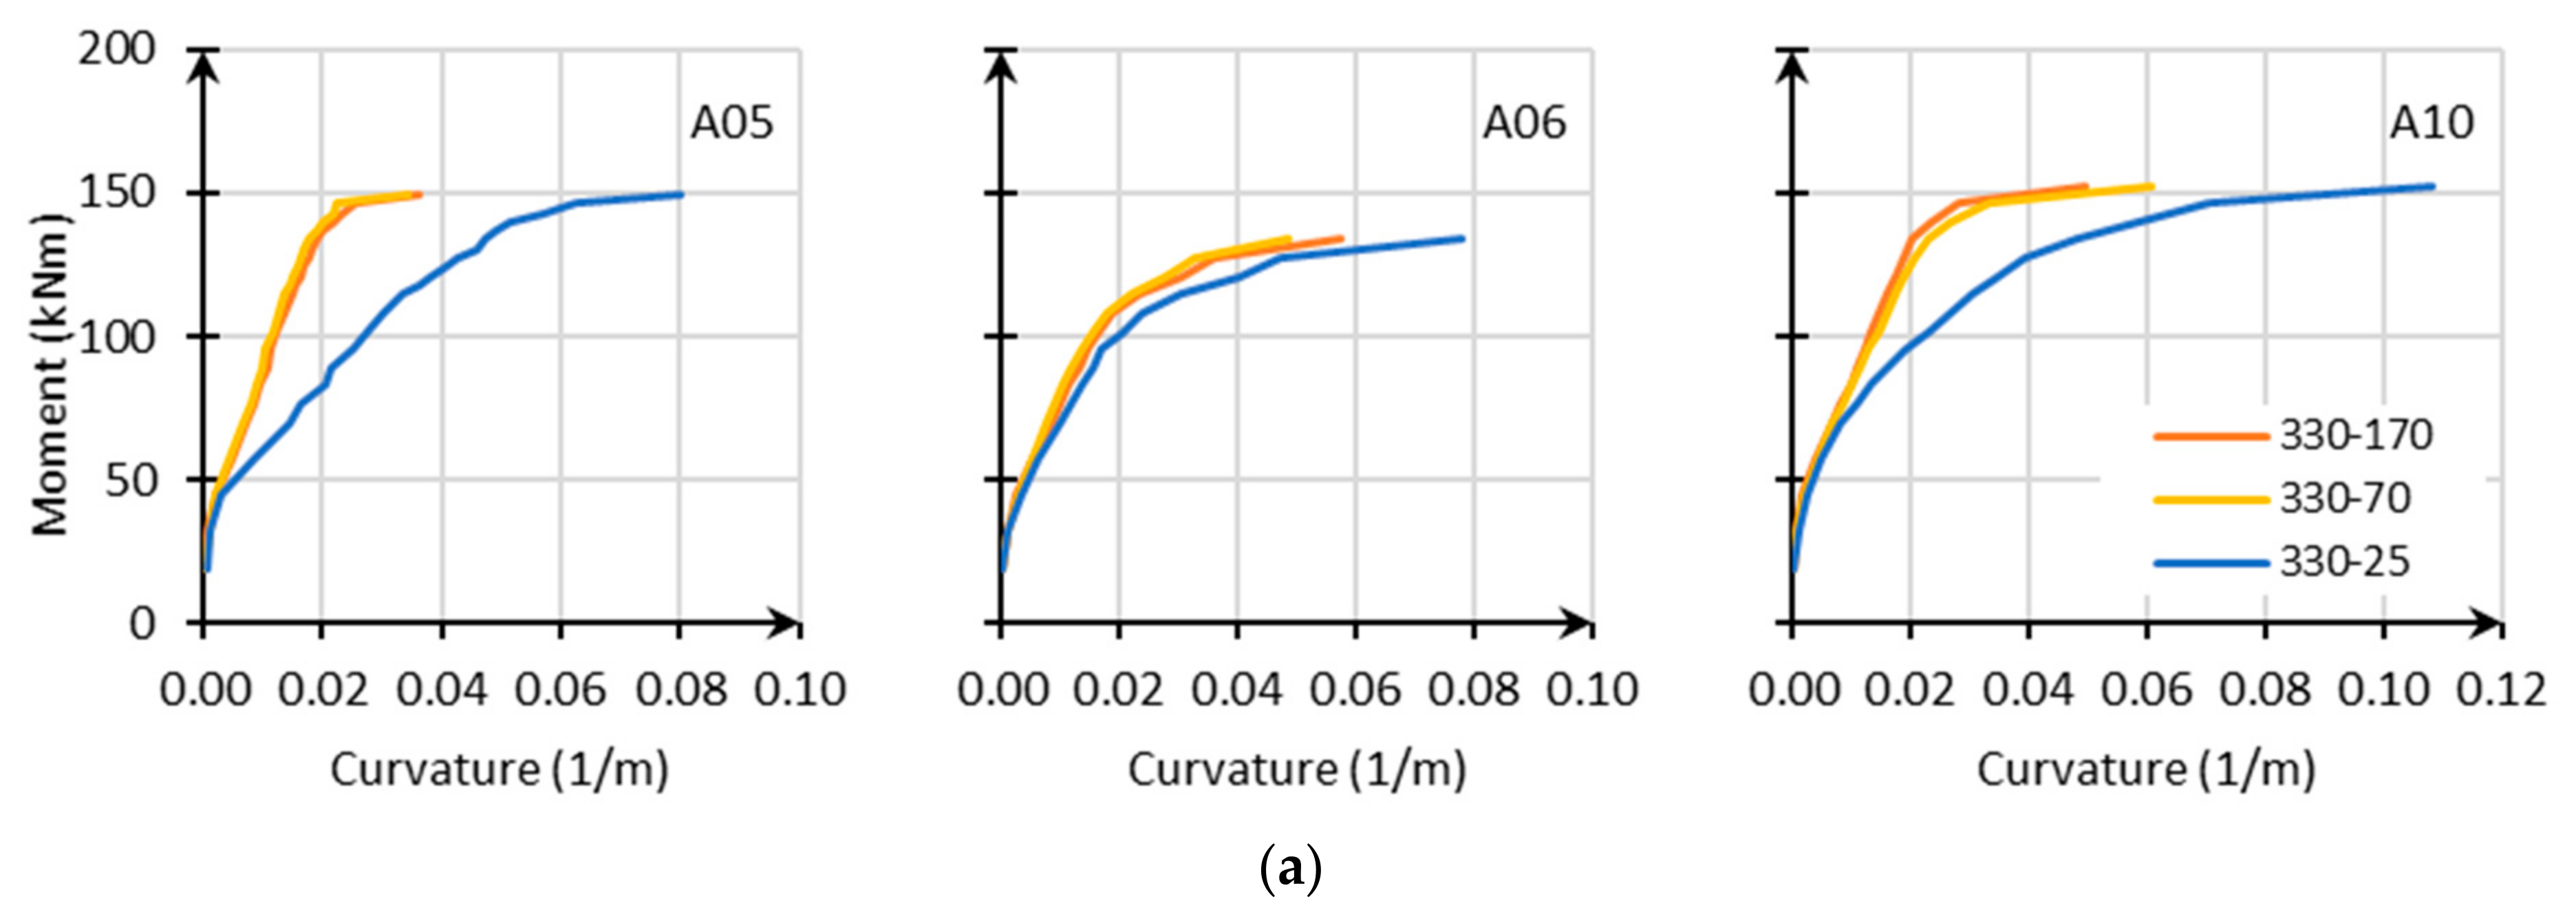
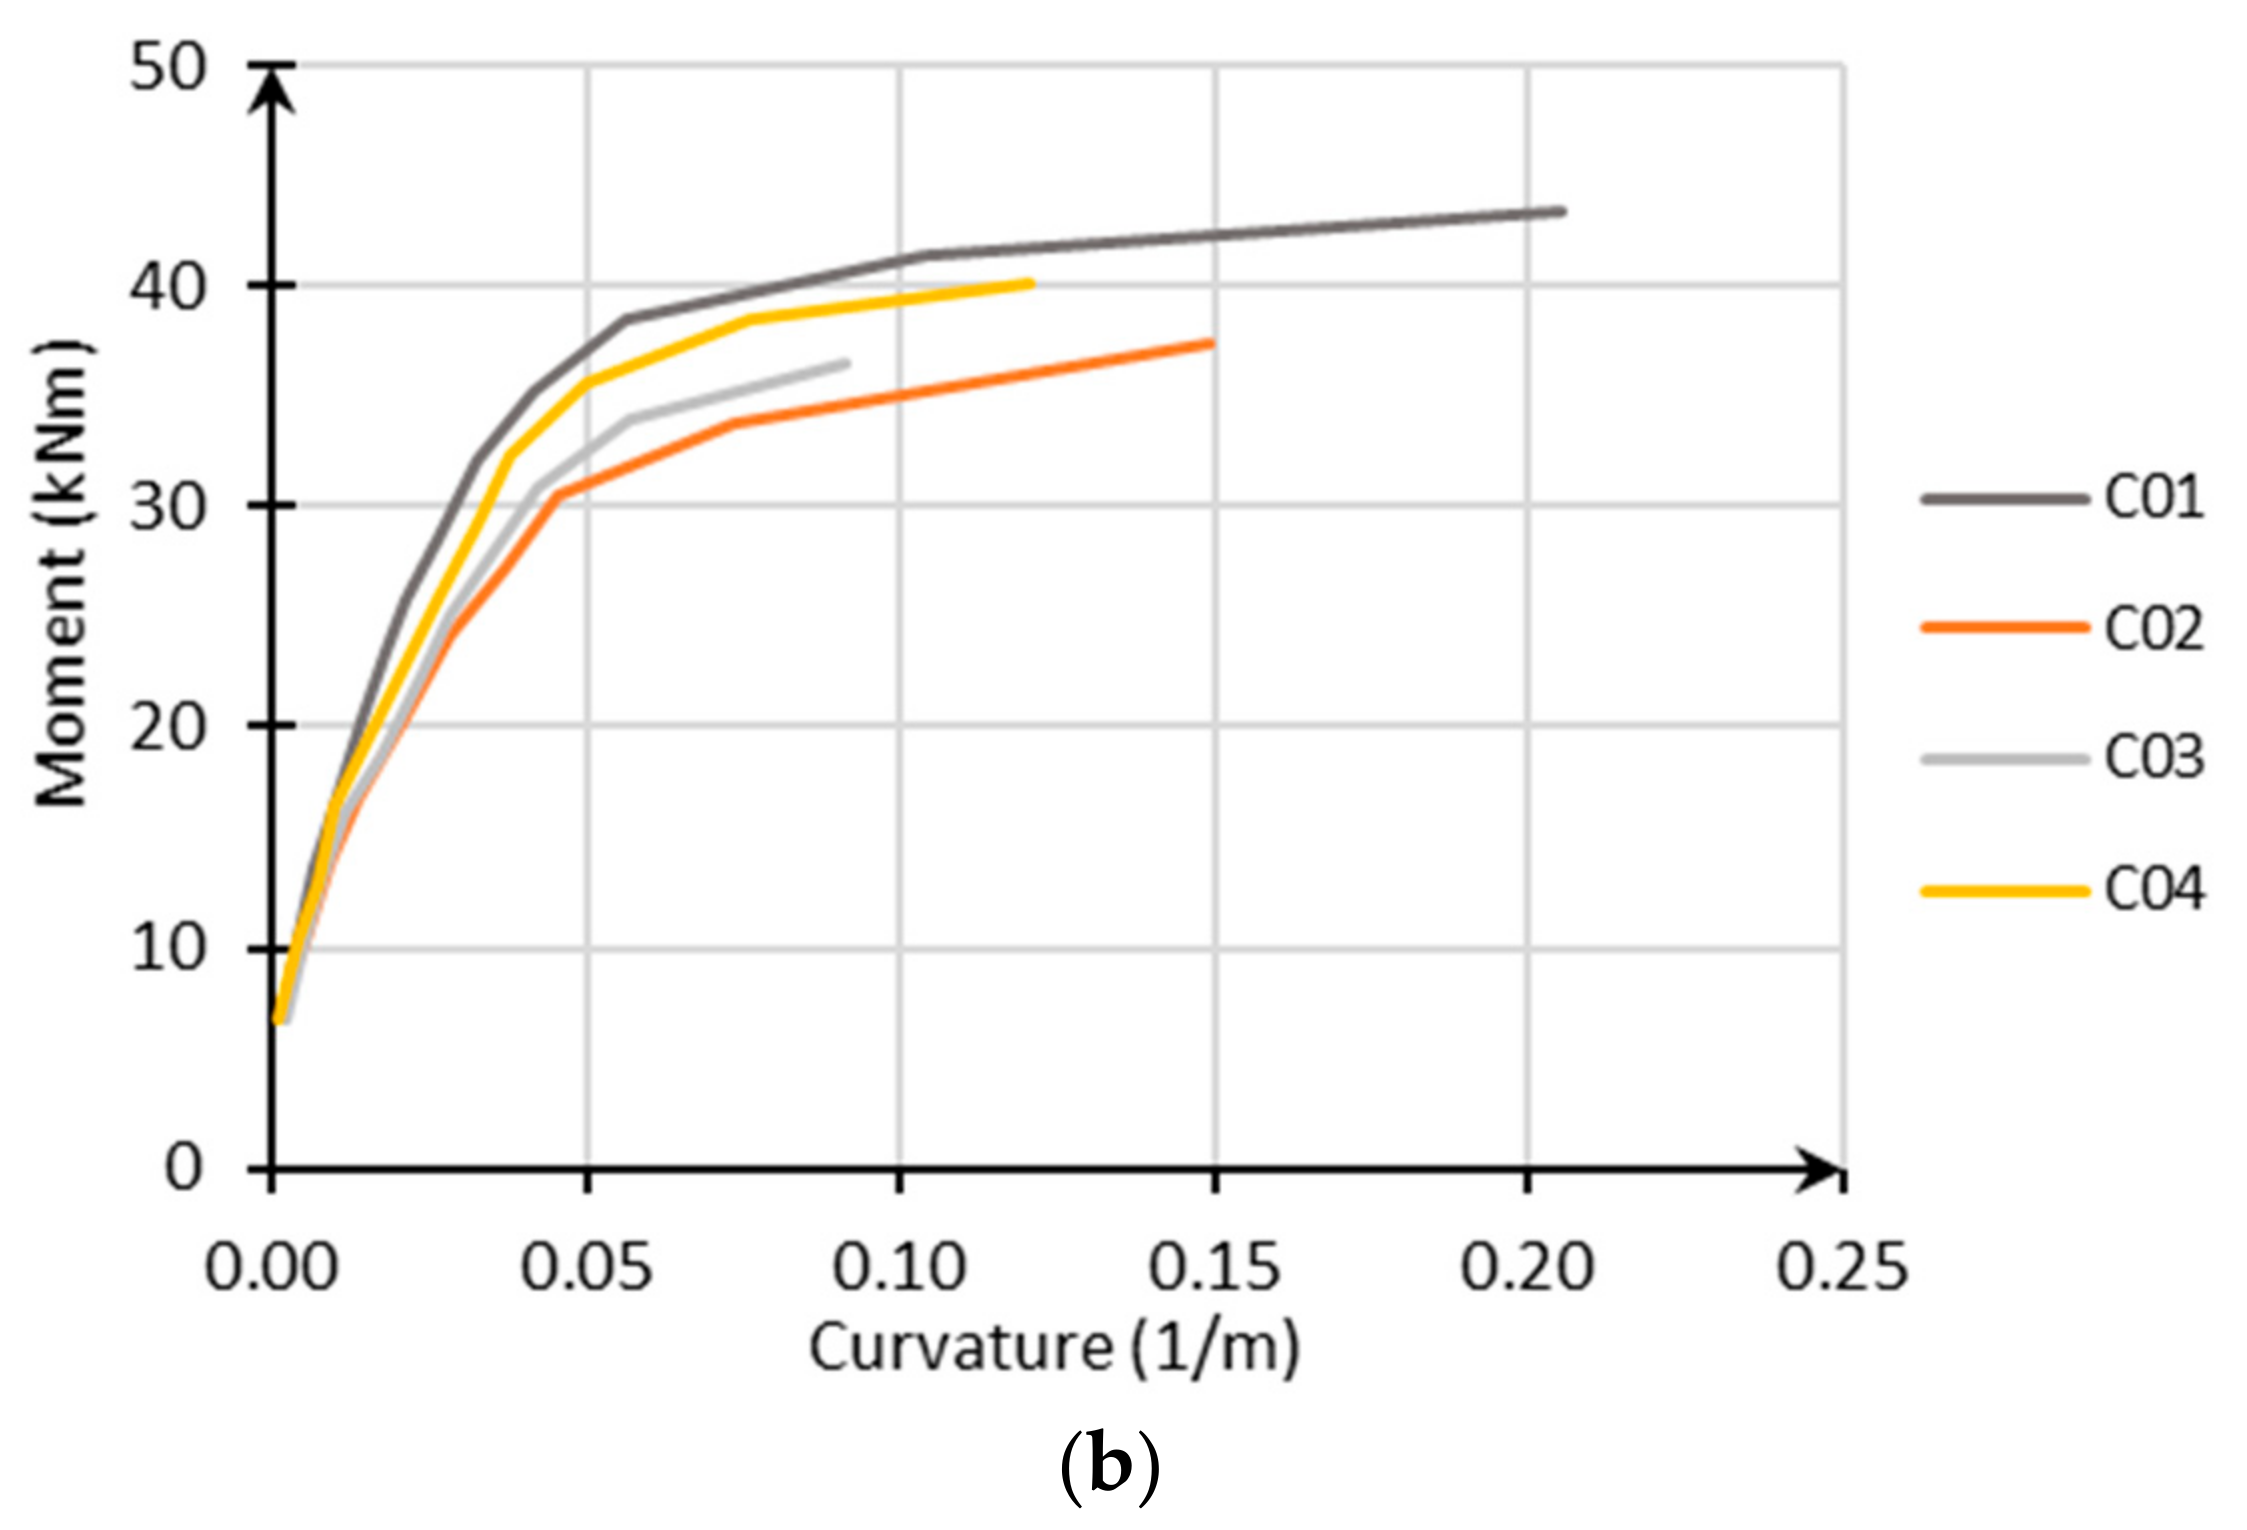
3.3.3. Moment Curvature Relation
An even more appropriate way to investigate the ductility is the moment–curvature relationship as given in
Figure 9. From the horizontal strains at different levels, the curvature can be derived by dividing the subtraction of the strains at two levels by the distance in between these two levels. In the legend of
Figure 9a, different levels (see
Section 2.3) are used to obtain the curvature, i.e., 330–170, meaning strains at level (v) and level (iii) are used. In
Figure 9b, the overall curvature with strains of level (v) and (i) of series C is given. To evaluate the ductility, the moment curvature relation from the positions (v—top) and (ii—overlap bar) should be used. Indeed, due to small overlap length it might be known that rebar in the floor plate cannot yet develop full plastic strength.
A curvature ductility factor µ
Φ is used mostly as a reference in the assessment of local ductility condition. Here, µ
Φ is defined as the ratio of post-yield strength curvature at minimum 85% of the ultimate moment resistance, to the curvature at yield under the assumption of a bilinear relation. Unfortunately, no indication can be found in [
4], so reference is made to [
29], where for the lowest ductility class (DCL) a value of at least two should be obtained (which corresponds to the upper limit of the behavior factor q = 1.5).
For series A, results are shown in
Figure 9a for A05 (lattice girder on 70 mm—µ
Φ = 2), A06 (bended up reinforcement—µ
Φ = 3), and A10 (solid slab—µ
Φ = 3) are given. Although the curvature of all slabs is sometimes at the limit, the behavior can be described as ductile. Remarkable is the effect of the bended up reinforcement (A06), which ensures that the curvature in the global element is the same for the different levels.
Figure 9b shows the moment–curvature relation of series C (C01–C04); values µ
Φ of at least three (C03) up to seven (C01) can be found, which corresponds more to medium ductility.
3.4. Visual Observations
Besides the measurements, one of the essential advantages of real tests is the visual observation that can confirm or disprove working hypotheses and clarify the key elements needed for the interpretation of the results.
3.4.1. Delamination
Visual and important delamination occurs in almost all the A-tests, but was not or barely observed in most of the B-, C-, and D-tests, see
Figure 10. Only in the B-series and C04 did nonsignificant delamination occur at the beginning, which stopped at the location of the lattice girder or the anchor rods. As the cracks appeared already at the beginning, it was not clear if the appearance might be instead related to the handling of the test specimens or due to the applied load.
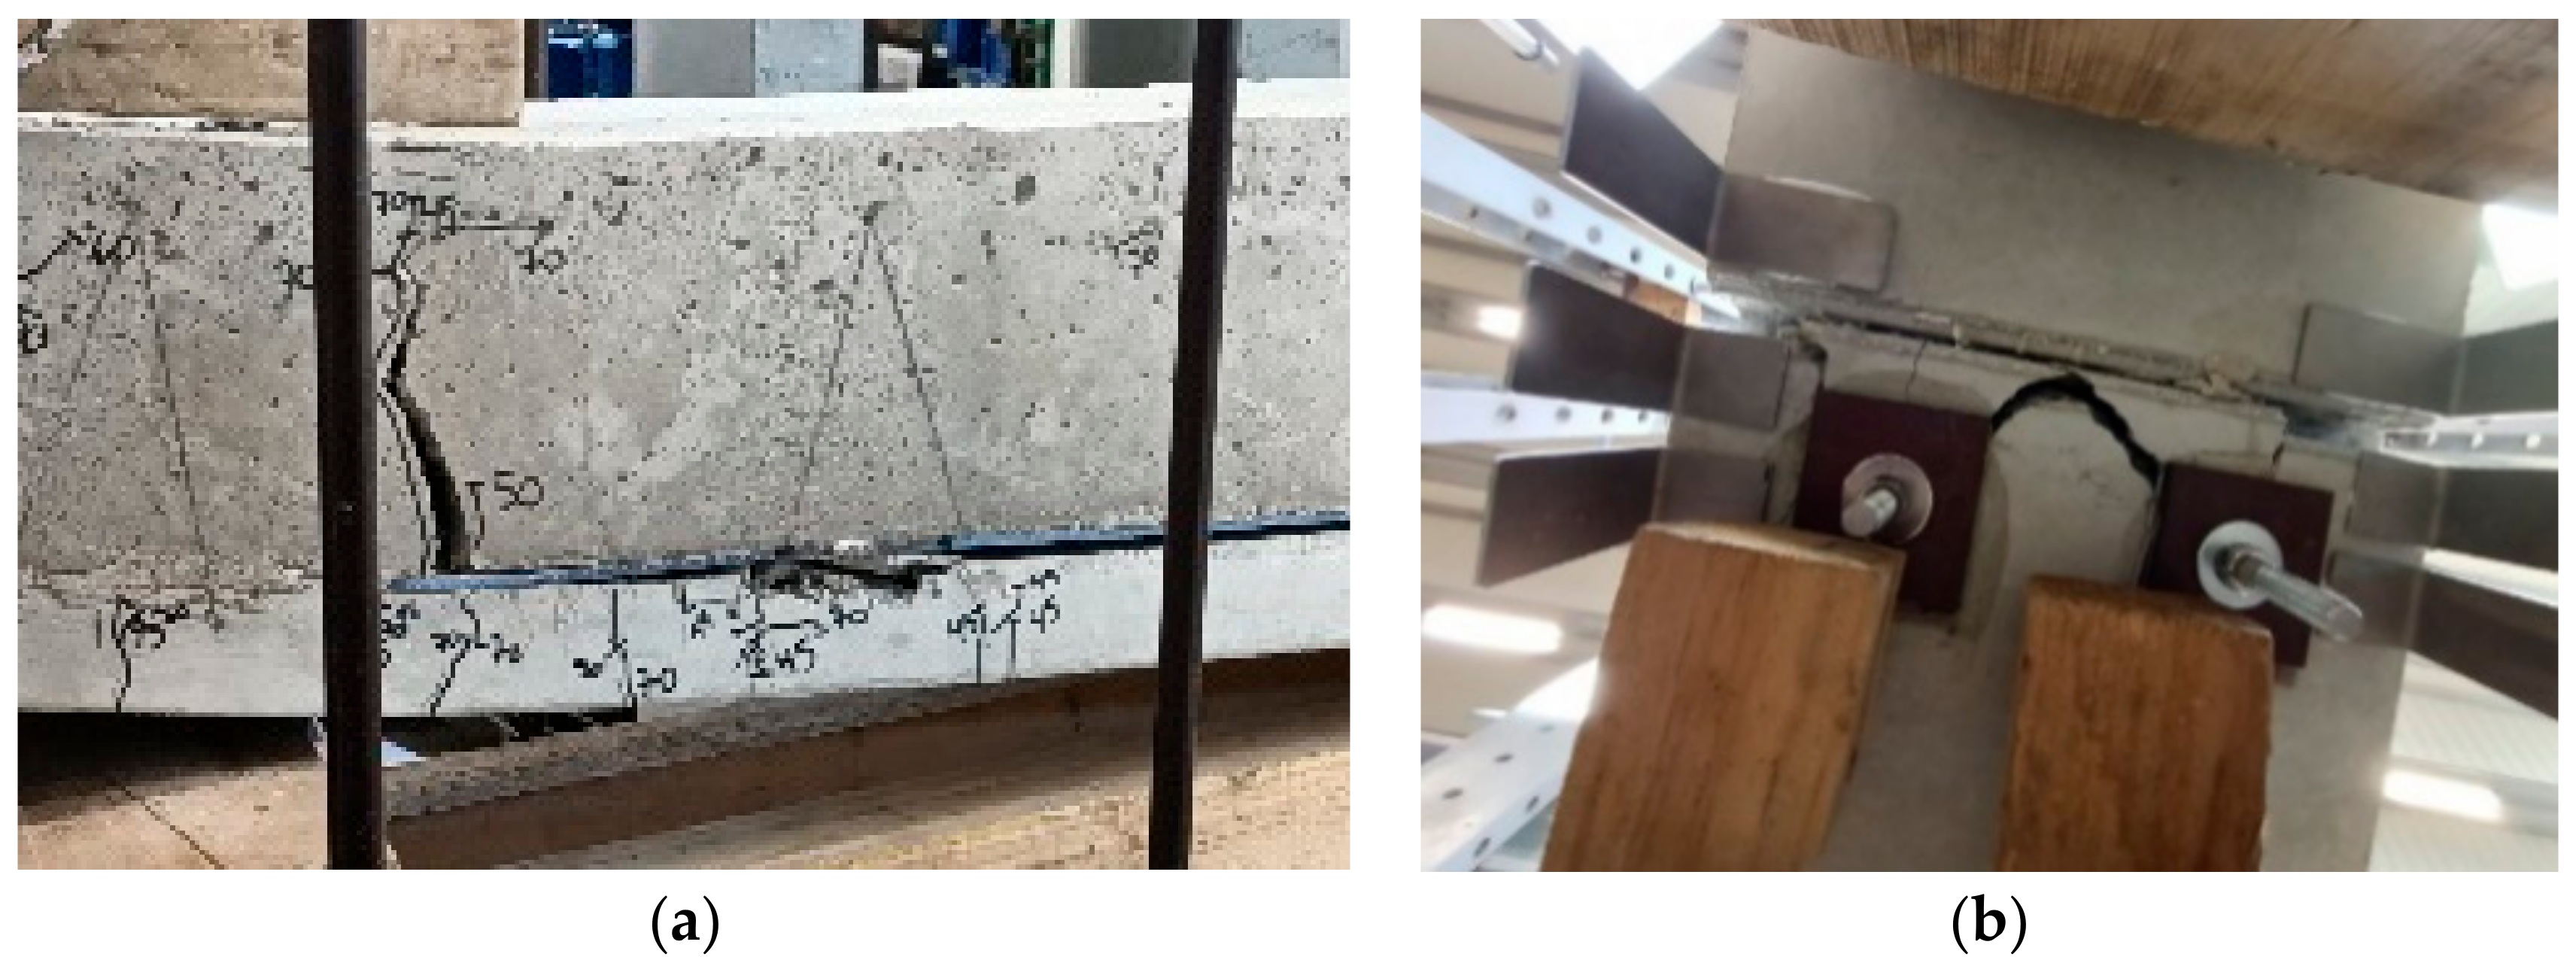
3.4.2. Overlap Block
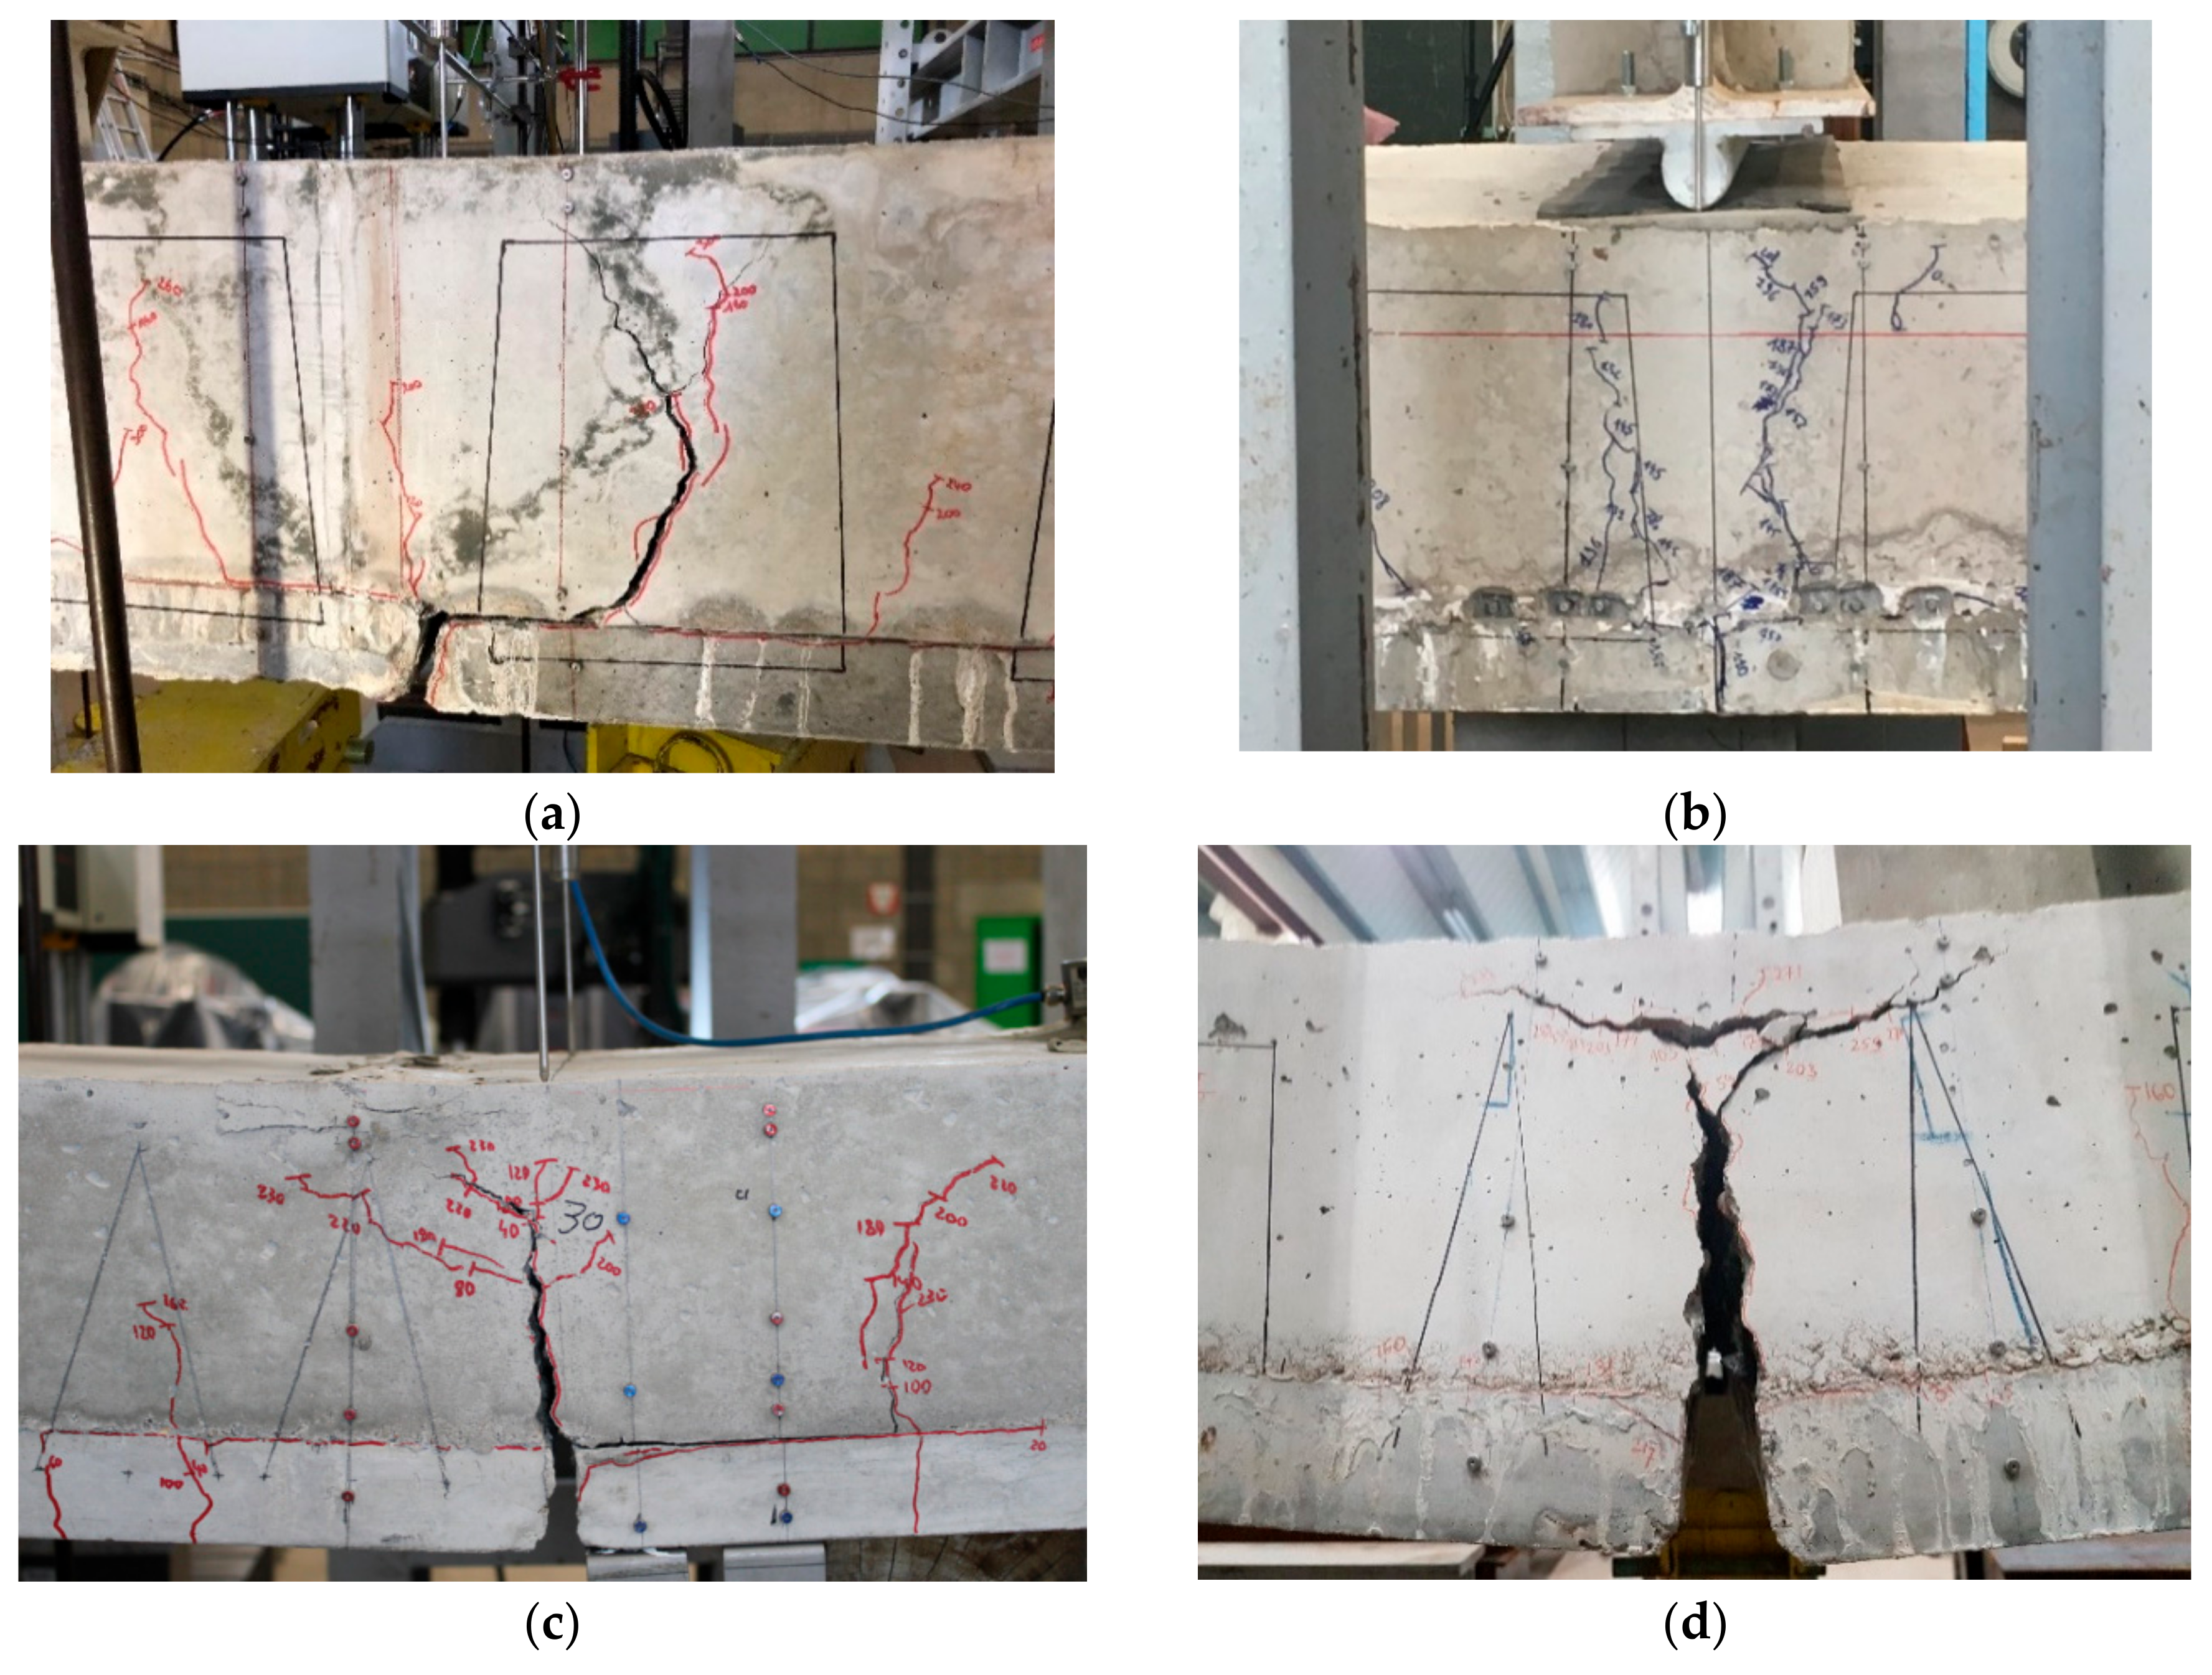
The crack pattern for the C05 and C06 specimens is entirely different from all other specimens. No crack was found at the joint location, due to the missing interaction surface, an overlap block can be observed. The end of this block corresponds with the end of the overlap reinforcement, as shown in
Figure 11a; at this location the bars do have a hook to prevent slip. Starting from beside the anchor rods, an increasing vertical opening can be detected through to the end of the anchor block. At this location, a wide crack appears with a width that corresponds more or less with the shifting distance between both floor plates at the joint location. To be clear, one side is fixed to the concrete topping, and the other side has a Plexi interface, see
Figure 4.
The vertical crack at the end of the overlap block stops before the upper surface of the concrete topping, creating a compression zone. Horizontal equilibrium seems to be guaranteed by the horizontal pull-out resistance of the lattice girders in combination with Vierendeel bending of the diagonals. As the anchor rods do have free space to move in test C05, they initially do not contribute to the equilibrium. Once the available slip is consumed, only a small increase can be observed due to the high lever arm for the Vierendeel caused by the opening in the floor plate, see
Figure 5b. Without any slip (test C06), it is observed that more strength can be developed (
Figure 5b), but the limit is reached once the anchor rods and the filling of the openings in the floor plate breaks out.
Figure 11b shows the lower side of the floorplate; the plateau indicated in
Figure 5b is caused by the contact of the broken concrete with the adjacent floorplate.
The most important observation is that with a failing interface, there is no vertical contact remaining at the end of the overlap block. Vertical equilibrium of the overlap block is assured at the location of the anchor rod or lattice girder that tries to prevent delamination. In a previous article [
28], this was not assumed and, therefore, the moment balance should be revisited.
4. Discussion
Some physical explanation was already given together with the description of the experimental results. In this chapter, design models are proposed and validated against the test results. Two different paths are followed. In the most general way, the model uncertainty is evaluated, which can be derived from the test results and compared to the proposed failure model [
30,
31]. This way of thinking is appropriate if a large number of test results are available. Secondly, in a more practical way, reflecting on the available guidelines for the interpretation of results from [
2], it is applicable if only a limited number of test results are available. In this manner, the reliability of the design model is deemed to be confirmed as
Ftest/
Fcalc ≥ 0.95 for each test and the average of all of the tests ≥1.00. Therefore,
Ftest is the measured value and
Fcalc is the calculated load using the failure mode observed.
4.1. Yield and Failure Loads
Basically, the observed failure mode should correspond to the proposed model assumed in the calculation. Even in combination with delamination during all the tests (except C05 and C06), it was the behavior of the reinforcement that governed the failure mode. With the application of a rectangular stress distribution for the compression zone in the slab, a design model using Equations (3) and (4) is proposed:
where:
Mcalc = estimated failure moment based on the design model, or test with abbreviation “test”;
As = cross-section area of the rebars;
σs = reference strength of the rebars, which can be the yield, ultimate, or the one corresponding with slip;
h = measured thickness of the slab at the joint location (midspan);
hp = thickness of the prefabricated floor plate;
c = applied concrete cover, including effects of the roughness on the upper face of the floor plate—in case of an intended surface, an extra 5 mm was counted for the roughness;
Ø = diameter of the overlap bars;
fc = concrete strength at the time of the test, based on cylinder strength;
b = width of the test specimen in the compression zone;
g = own weight per meter of the test specimen;
L = span in between the supports;
o = overhang over the supports;
a = distance between the support and the application of the concentrated load Ftest/2;
Ftest = test load when yielding failure or slipping of the reinforcement occurs—when after reaching a peak value, the capacity drops dramatically, the post-peak value is taken to satisfy ductility criteria;
G = dead load coming from the steel profiles between the test specimen and the hydraulic jack.
Differentiation must be made between nonsignificant and significant delamination. At the moment that nonsignificant delamination occurs, and this is the case for all solid slabs and slabs containing void formers but with a first lattice girder at 95 mm from the joint, the overlap length starts at the joint. However, for the opposite cases the overlap length starts only at the location of the center of the first lattice girder, see
Figure 11a. Notice that this fits the guidelines of [
16] and deviates from [
8], there the starting point was set equal to the first horizontal bar of the lattice girder. When the maximum overlap length is not available, the steel stress
σs will not reach the full capacity
fy and
fu of the rebars. A linear relationship between the available and the required overlap length defines the final steel stress in relation to
fy or
fu. No real differences could be observed between the position of the rebar (on the floor plate or with a concrete cover) and only a slight one in post-peak behavior, depending on the roughness of this interface. Hence, it seems that for the concrete finishing and preparation used (which corresponds all to the guidelines from the product certificate [
1]) no difference can be found between a rebar fully enveloped by concrete or one in the neighborhood of an interface. The resulting bond in the concrete matrix around a bar or the one partially enveloped plus the friction of the nonenveloped part seems to be equal, see
Figure 12b,c.
Considering the post-peak values for the A-series of tests and the full capacity for the B-, C-, and D-series, an excellent relation can be found between the tested and calculated values, see
Table 4. An average value of
µθ = 1.02 and a standard deviation
σθ of 0.06 are obtained. Without the value of test A03, which aims to be an outlier (≤
µθ – 3
σθ), the standard deviation is reduced to 0.05. This means that the coefficient of variation
Vθ is also equal to 0.05 (=0.05/1.02) and much lower as the one mentioned in [
30] for the bending moment capacity (static): 0.15. In this document, a lognormal distribution is recommended as a probabilistic model for the model uncertainty
γRd1. With the sensitivity factor for resistance
αR = 0.4∙0.8 = 0.32 (assuming a nonleading variable [
32]), a reliability index
β = 3.8 for a consequence class 2 building, and
Vθ = 0.05, then Equation (5) delivers a
γRD1-value of 1.06, again lower than the one expressed in [
31] as usual: 1.1.
Values of the tests C05 and C06 are not used in this statistical analysis as failure is initiated by a completely different failure mechanism, which is the reason why they are in a separate column and italicized in
Table 4. This failure model will be discussed in
Section 4.3.
4.2. Deformations and Delamination
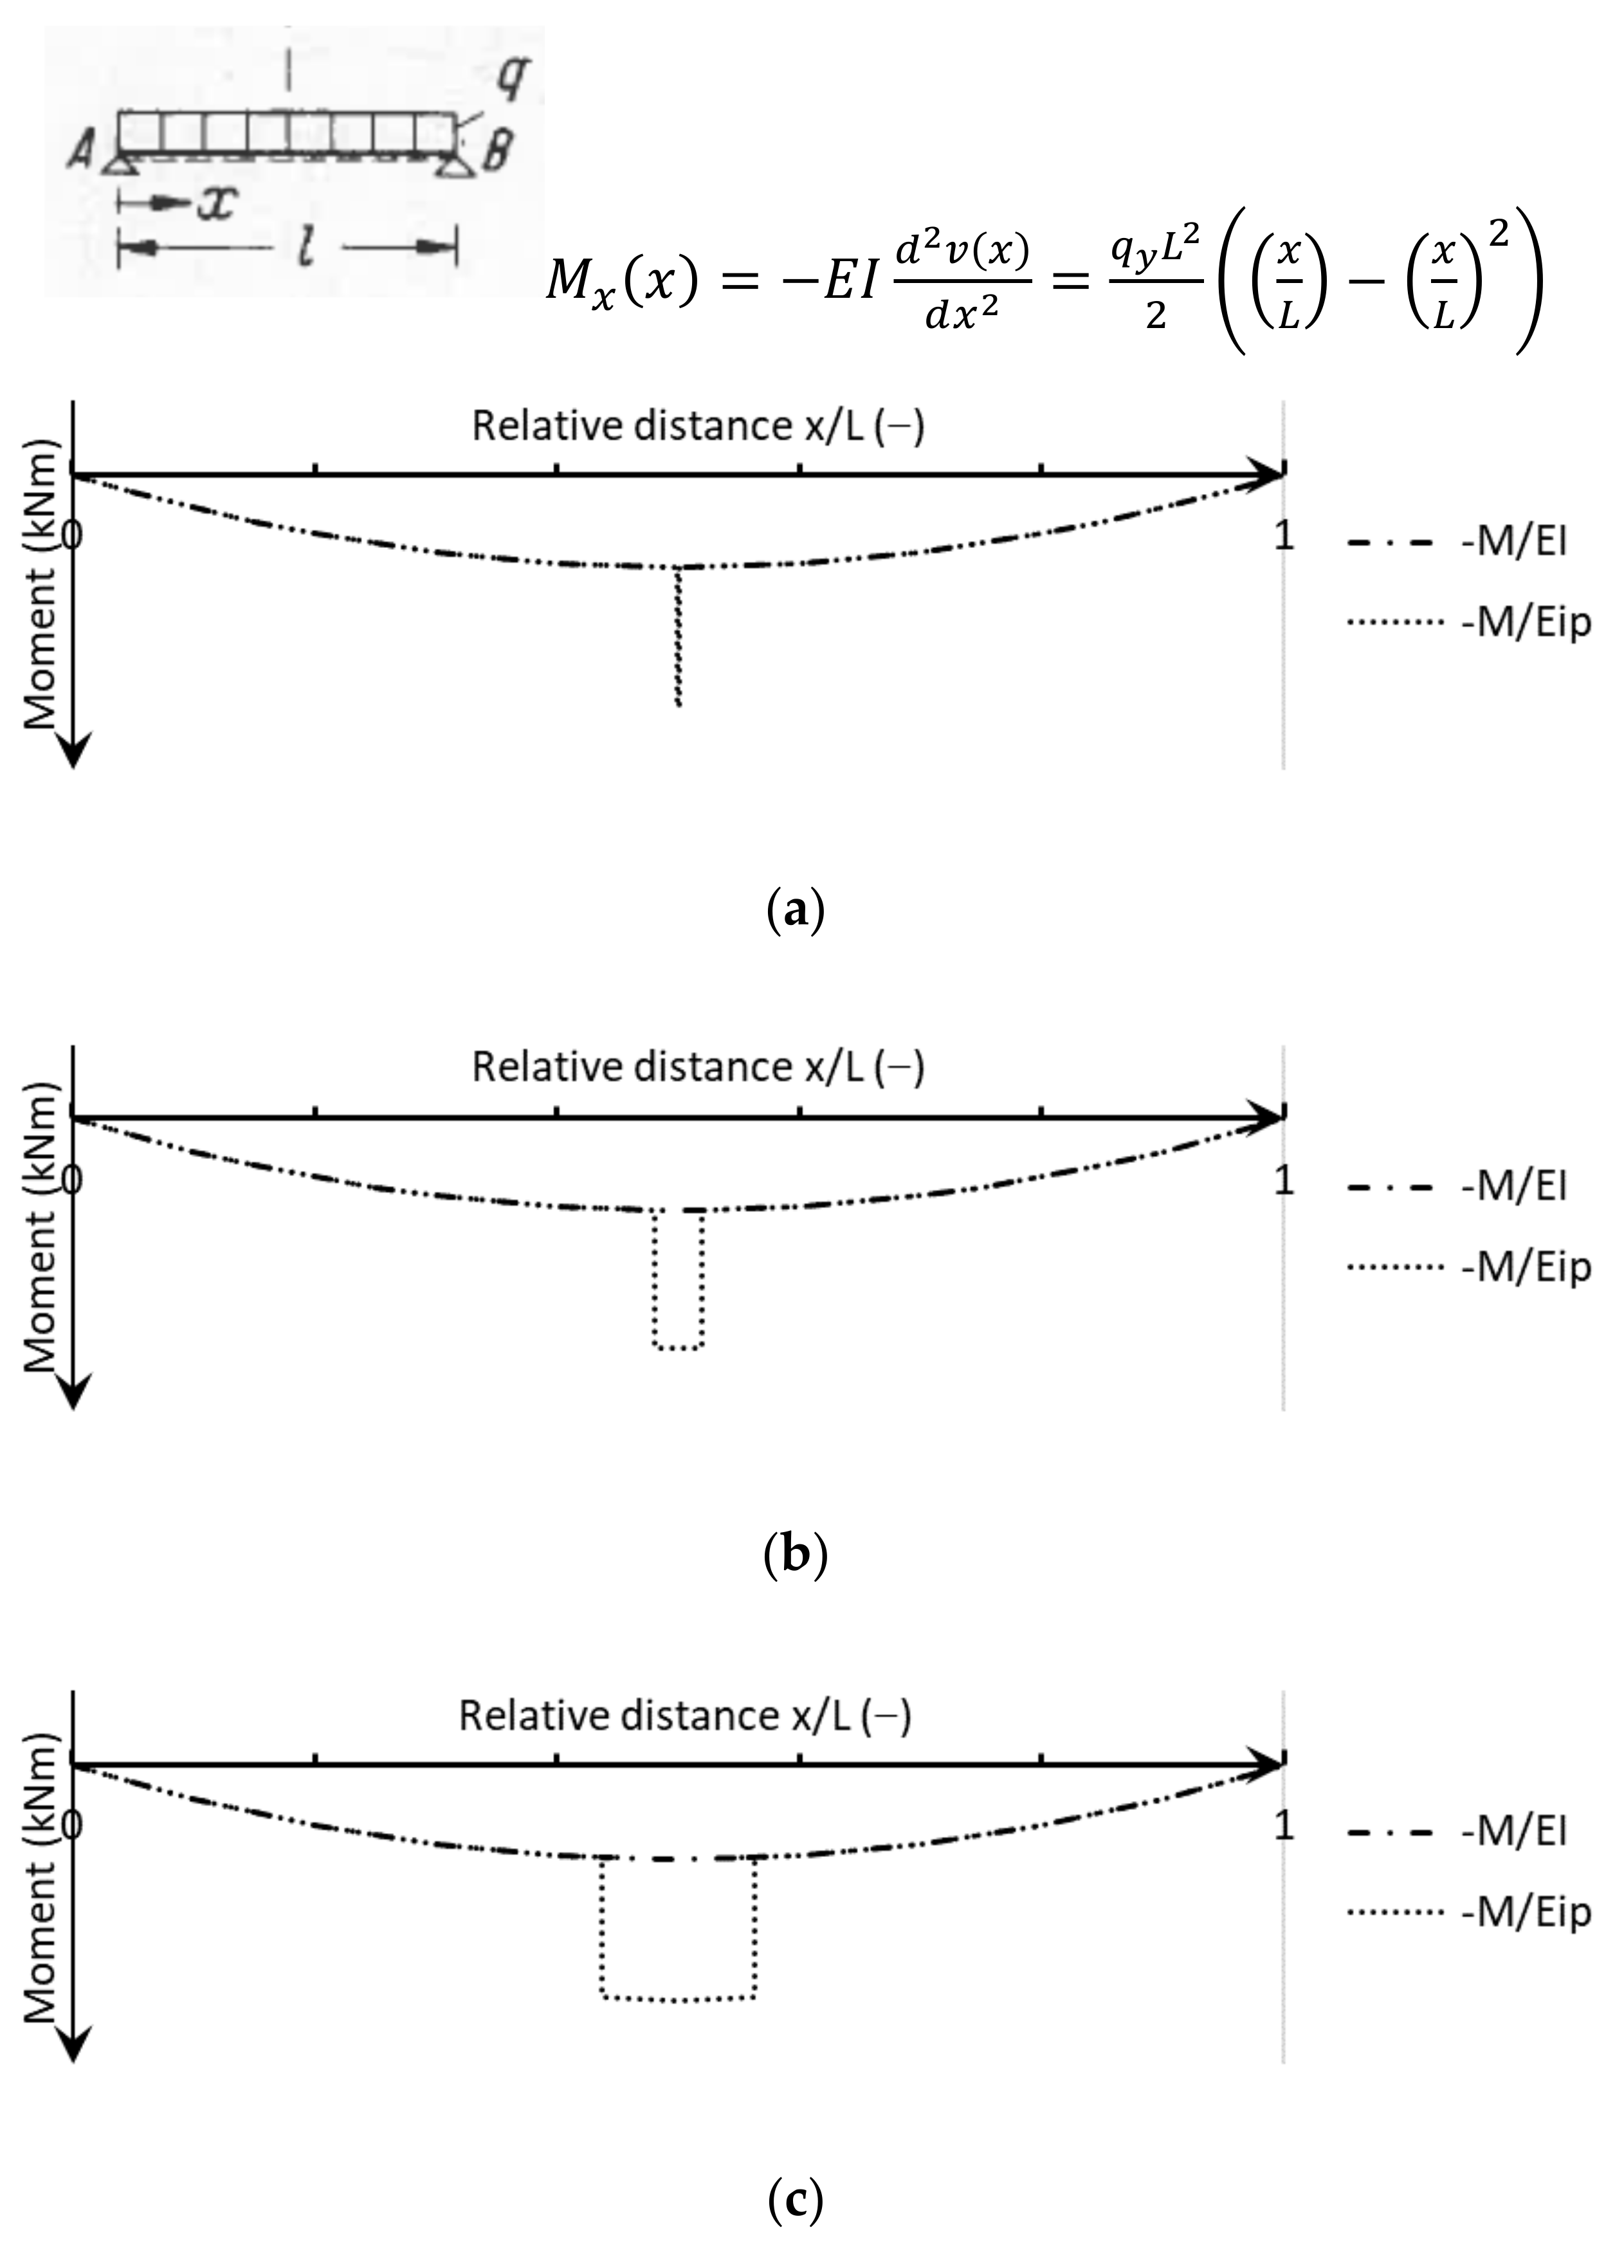
In actual practical design software for flat slabs, the underlying hypothesis is related to the hypothesis of Euler–Bernoulli. One key expression is given by Equation (6), which makes it clear that the deformation can be obtained by the double integration of curvature (1/
R). Consequently, the influence of a tiny joint (with second moment of area
Ip) should be neglectable.
It is shown by the crack pattern out of
Figure 10a that, due to delamination, the reduction of the second moment of area (
I) will not be limited to the width of the joint, but in the worst case, even extends to the distance in between the first lattice girder on each side of the joint. For the ease of explanation, the evolution of the last term in Equation (5) is given in
Figure 13. The example is calculated for a C-series test specimen with a span of 3.7 m and width of 0.45 m, thickness of 0.22 m, and different joint openings. In this practical case, the increment factor of the deformation (after double integration of -M/EI) for 1, 2 × 9.5, and 2 × 30 cm joints can be calculated as 1, 1.04, and 1.32 respectively.
The impact of delamination is not only noticeable on the resistance part of the assessment of a slab, but can also have a significant consequence on the deformation behavior. Starting from a 15 cm distance between the joint and the first lattice girder, the influence becomes equal to 10%. This explains the lack of stiffness of the A-tests compared to the C- and D-tests.
Several tests (A05, C03, C04, C05, and C06) were equipped with an anchor rod and hollow load cells. The rod was defined each time as it had almost the same transversal stiffness (parallel to the applied load) as the lattice girder which the rod was replacing. Still, we were unable to measure the force that was needed to block the delamination crack. In [
28], a theoretical model was developed, but this still needs confirmation and will be subject to further research.
4.3. Interface
From tests C05 and C06, the importance of the upper surface of the floor plate becomes clear. Without adhesion, an overlap block forms with mechanical interlock and very limited friction. The joints start to open almost directly and fail at load levels which are one-third of the ordinary capacity. With the aid of the test specimen with a free rod (C05) and one with a fitted rod (C06), the contribution of the lattice girder and the rod can be assessed. The latter is very important in a situation where, after execution, reasonable doubts can be expressed about the execution of floor plates or the preparation of the surface before casting the concrete topping.
4.3.1. Adhesion Stage
All test specimens (excluding C05 and C06) fulfilled the requirements of Section 6.2.5 out of [
4]. In none of the ordinary test specimens (therefore excluding C05 and C06) a shear failure at the interface could be observed—not at the supports where the transverse shear force was the highest or at the overlap reinforcement where, due to bond stresses related to the overlap of reinforcement, shear forces could also develop. From mechanics, it is logical that no shear stresses can develop in the middle, where the maximum moment occurs in the span, and the derivate of the moment becomes 0; at that location the shear force is also at the interface.
The actual prescriptions in [
4] allow for making use of both diagonals of a lattice girder. With a single leg and a slope
α between 45° and 135°, Equation (7) becomes valid. In the case of double diagonals with
α’ between 90° and 135°, this becomes Equation (8) as the cos terms do compensate for each other.
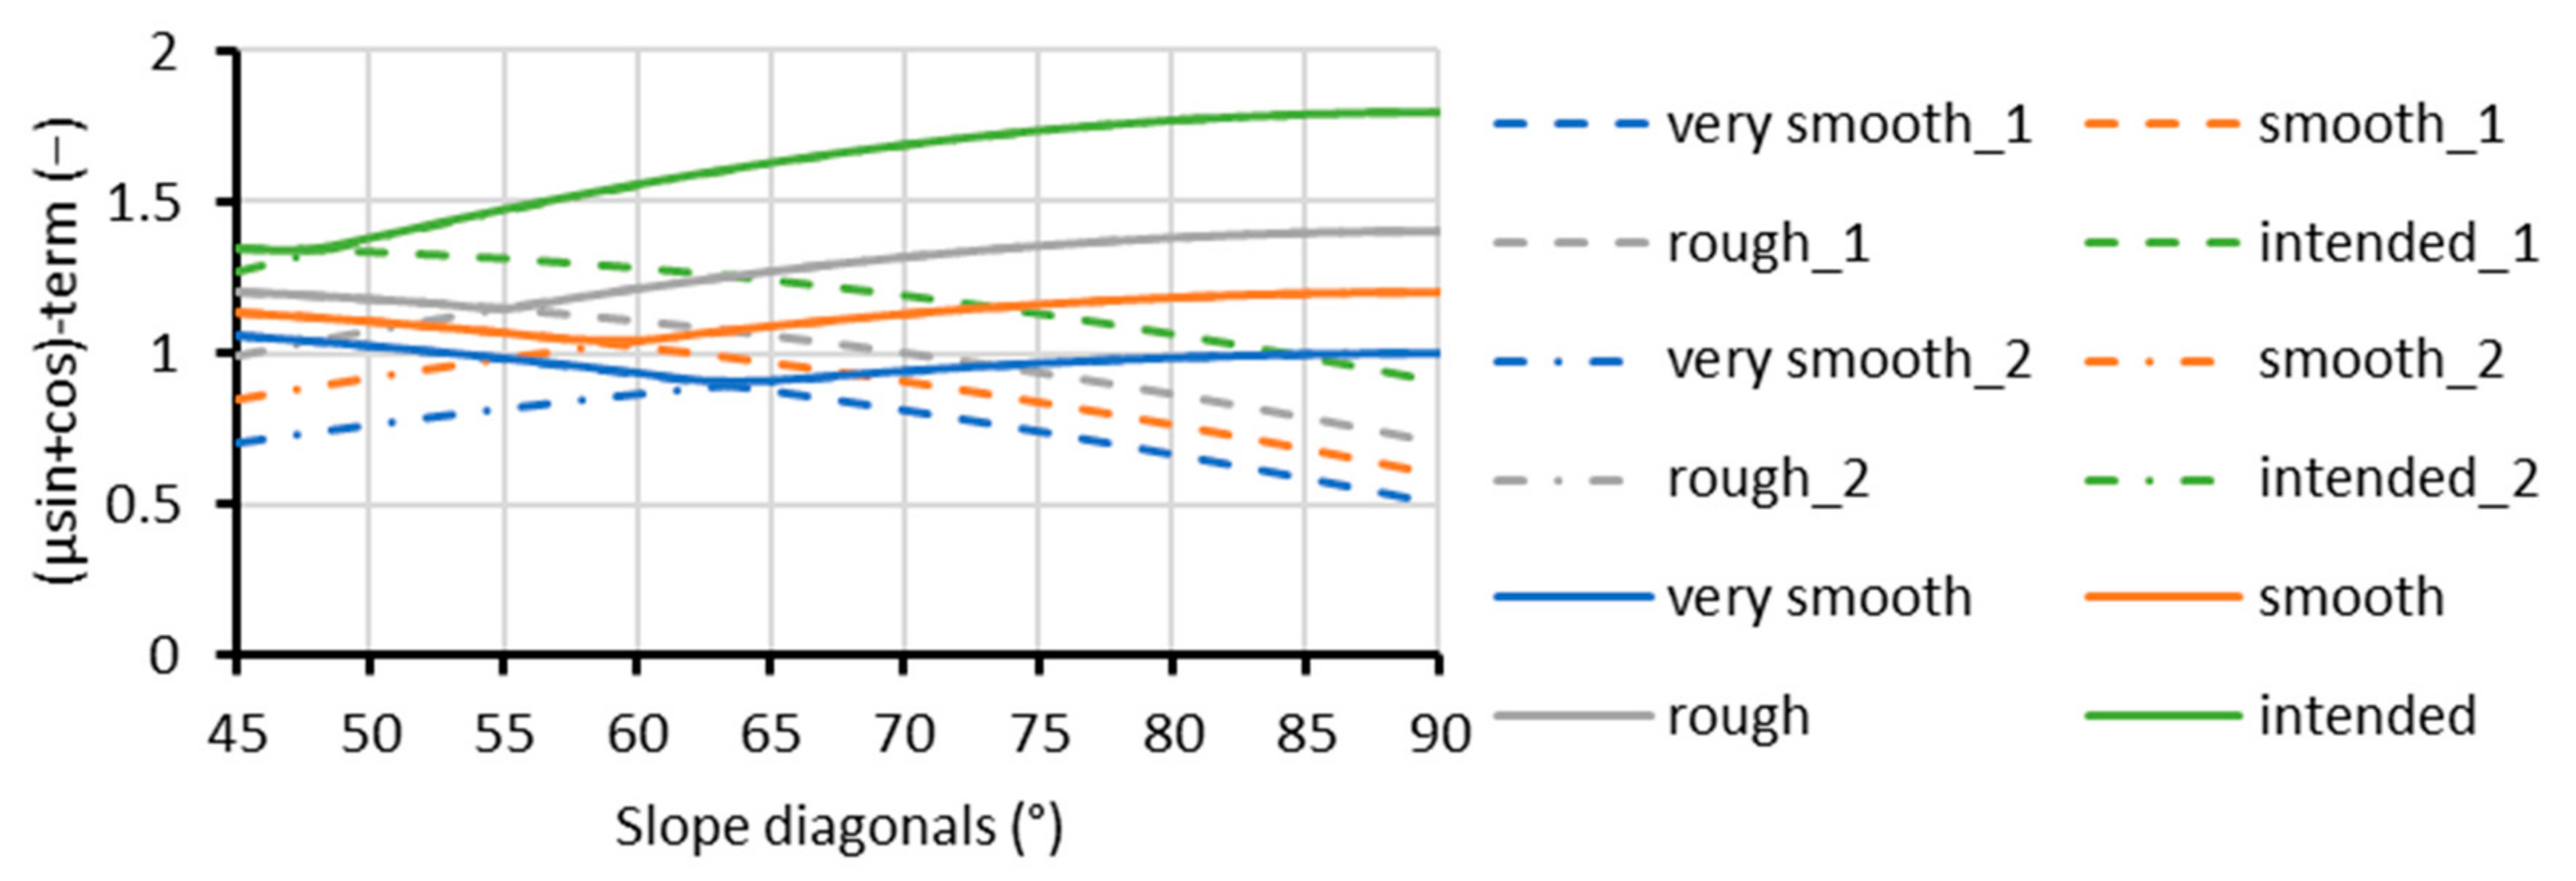
The double formulation generates a twofold curiosity. First, from physics, it seems logical that a double-leg lattice girder will never deliver a lower capacity than the single-leg version, so for the application of double-leg lattice girders it seems appropriate to use the envelope of both curves. These values can be found as the solid line in
Figure 14 that represents the last term from Equations (7) and (8). Except for the intended surface, it is seen that the influence of the roughness on the reinforcement contribution is relatively independent of the slope of the diagonals, and also the differences in between are limited. An endnote _1 indicates the single-leg contribution (Equation (7)), an endnote _2 denotes the double-leg contribution (Equation (8)), and no endnote refers to no envelope.
It should be noted, however, that Equations (7) and (8) can be discussed as an adhesion and that the contribution of the reinforcement is in one formula, which can be seen as a second curiosity. To activate the reinforcement, some displacement should be needed, and the adhesion parts become unlikely to occur; on the other hand, dowel action is missing, which will compensate for the previous favorable simplification. According to the authors’ idea, the proposed model in [
33] is more consistent.
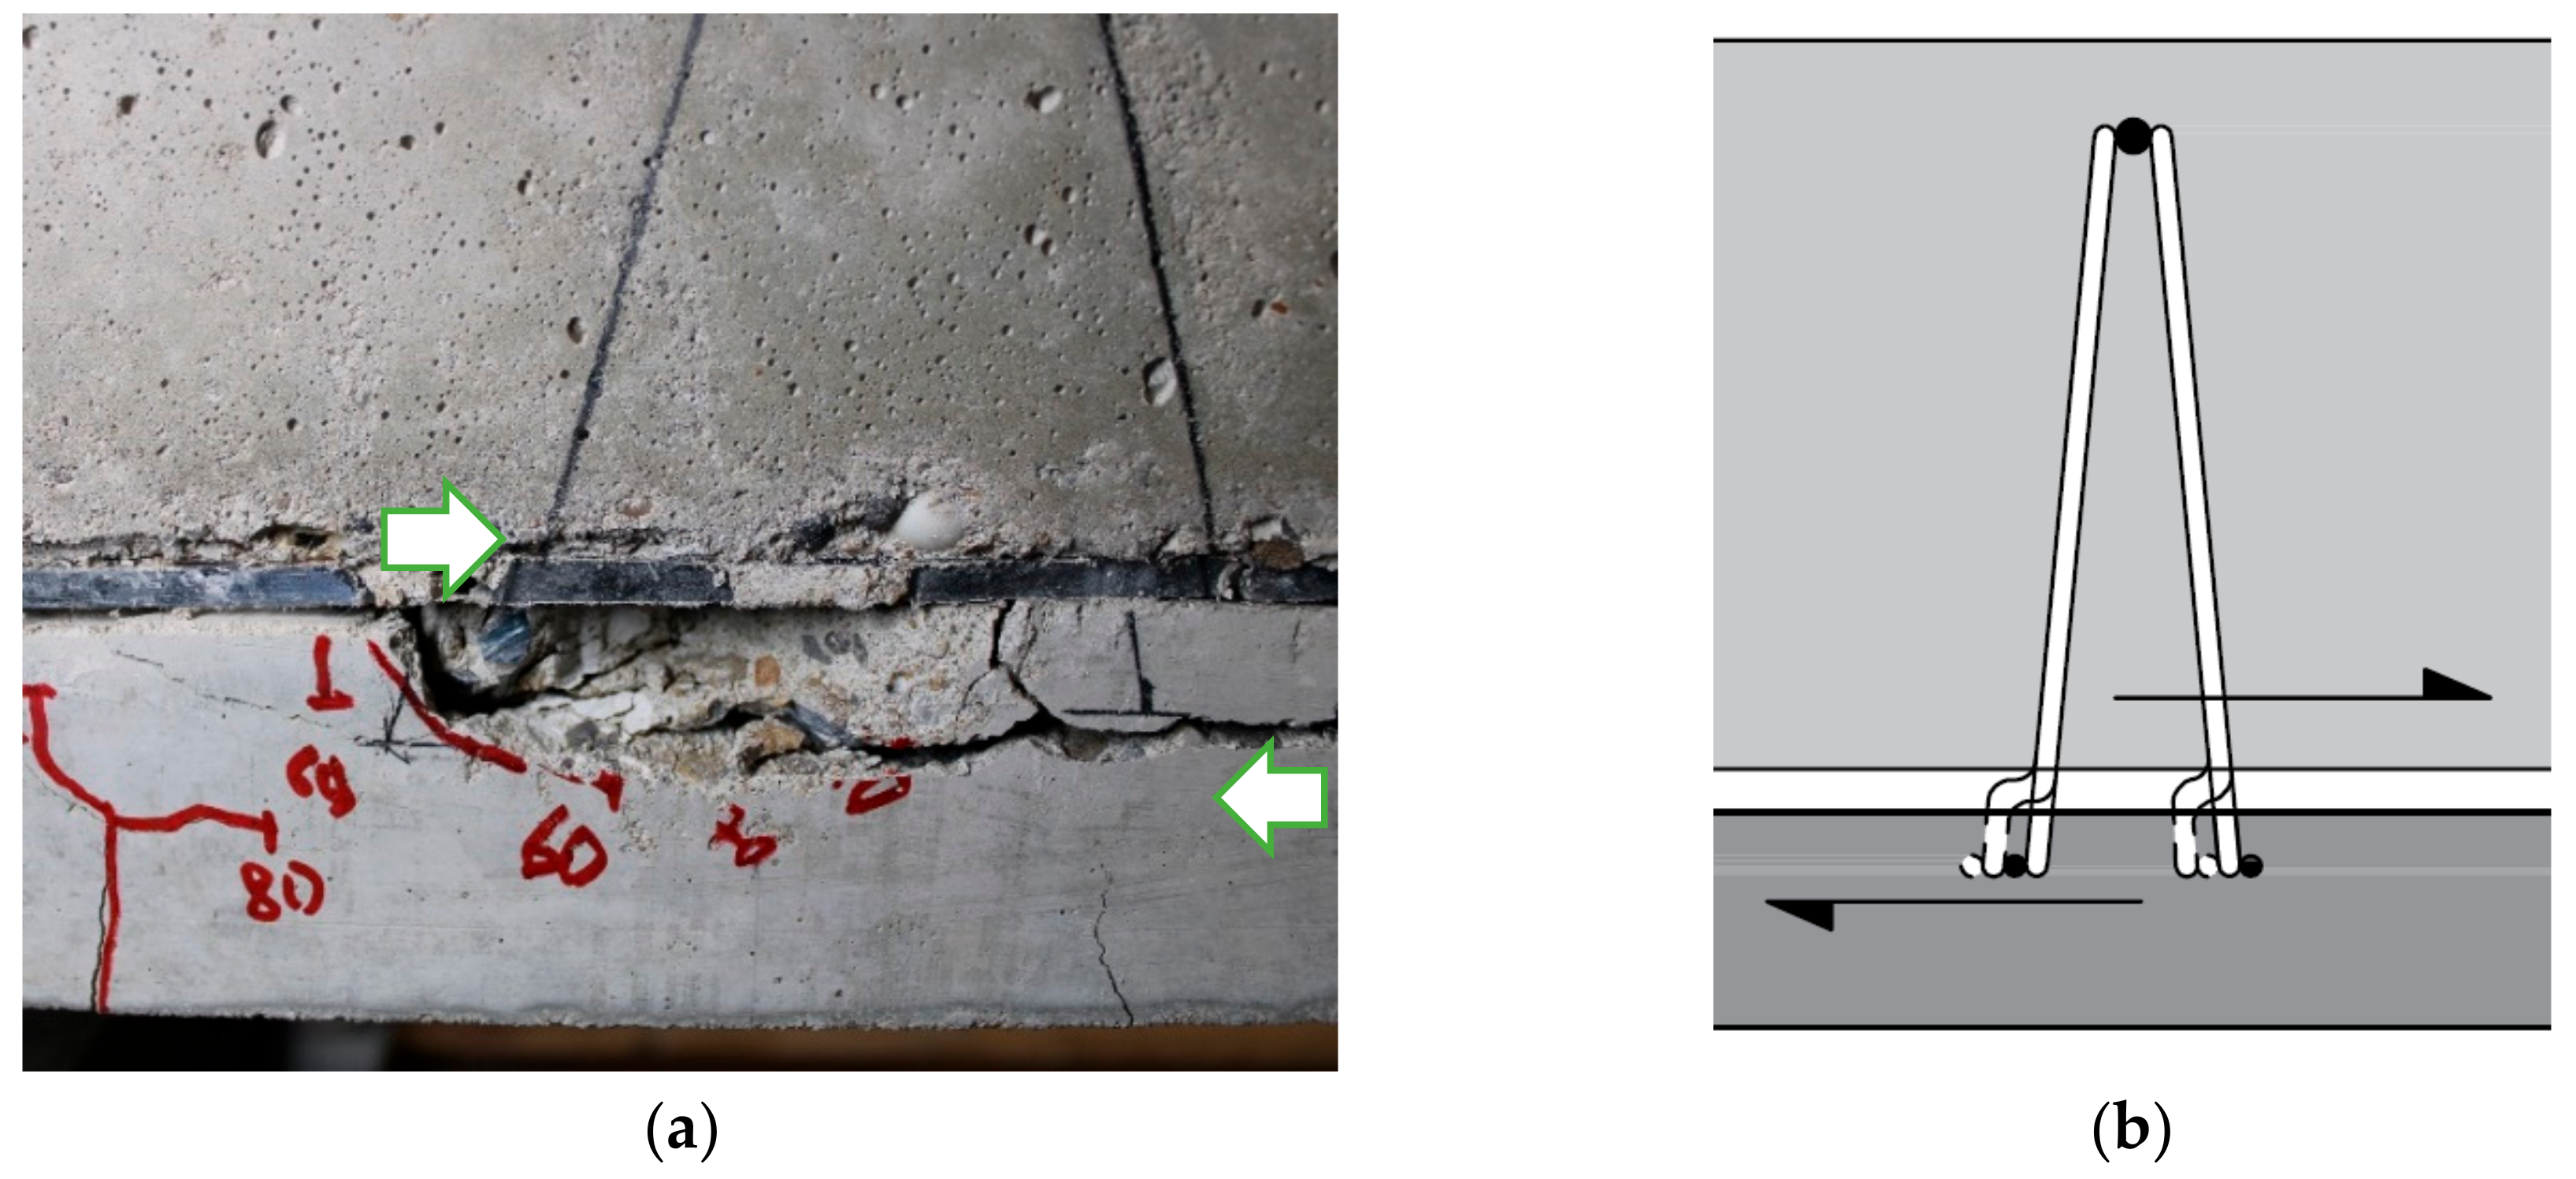
4.3.2. Vierendeel Effect of Lattice Girders
Figure 11 makes clear that at the end of the overlap block, a compression zone is active at the top of the block. Due to horizontal equilibrium, this is only possible by the transfer of horizontal forces from the overlap block into the floor plate. Without the excluded mechanism (with the Plexi) this can only be realized by the mean of the cosines-part of the force that can be developed in the diagonal and the dowel effect of this diagonal, reacting as a Vierendeel beam. Translation and rotation after failure is shown in
Figure 15a, and in a schematic way, the transfer of forces is represented in
Figure 15b. Only two well-equipped tests are available, so no statistical analysis can be performed, but the methodology from annex J of [
2] can be applied. Correspondence between the maximum measured values before failure and the calculated values based on Equations (9) and (10) delivers a
Ftest/
Fcalc,inter value of 0.96 and 1.14, thus both are above 0.95 with an average value above 1, which proves that the model fits well with the observations. In Equation (10), a constant factor of 0.4 mm is introduced to account for the effect that in each test at the location of the lattice girder an opening appeared during the test; see
Figure 15a after the test and
Figure 11a during the test.
where:
HR = horizontal resistance force that can be developed at the interface;
Fpl,dia = plastic capacity that can be developed in bending by the diagonals;
Fpl,rod = plastic capacity that can be developed in bending by the rods;
σs = reference strength of the rebars, abbreviation s for the diagonal bars and “s,rod“ for the rods;
Ø = diameter of the diagonals or throat diameter of the rod;
Plexi = thickness of the Plexi plate in mm, as 0.4 is the additional crack width in mm, all other thickness dimensions should also be written in mm;
n = number of diagonals for a double-leg lattice girder;
and other symbols already defined for Equations (3) and (4).
It should be noted that the proposed failure mechanism will only be observed by the elimination of adhesion, mechanical interlock, and friction. In practice, this will only occur where severe execution errors will be observed, such as concrete top casting on a significant dust or ice layer, for example. In the case of more moderate conditions, a sensitivity check was performed. It follows that only starting from a horizontal opening between the floor plate and concrete topping of 2.4 mm will the Vierendeel effect govern the design. Below 2.4 mm, this will be dowel action with an upper bound equal to the shear capacity of the lattice girders. However, this is not yet thoroughly investigated.
4.3.3. Rotation of Girders
It was already mentioned in
Section 4.3.2. that the horizontal part in the diagonal bars contributes to the horizontal equilibrium. This means that normal forces will develop in diagonal bars and two consequences can be linked: first, if one set of diagonal bars is working in tension, then the opposite will work in compression or the lattice girder will rotate, which was also visible during the tests. Second, the horizontal anchoring bars in the floor plate will have the tendency to be pulled out, and this was also observed, see
Figure 15a. The maximum force that can develop on a single pair of legs determined from the test is equal to 4∙550∙0.78∙5²/1000 = 42.9 kN.
Preliminary research about the pull-out force of lattice girders was already carried out within a total of 14 tests [
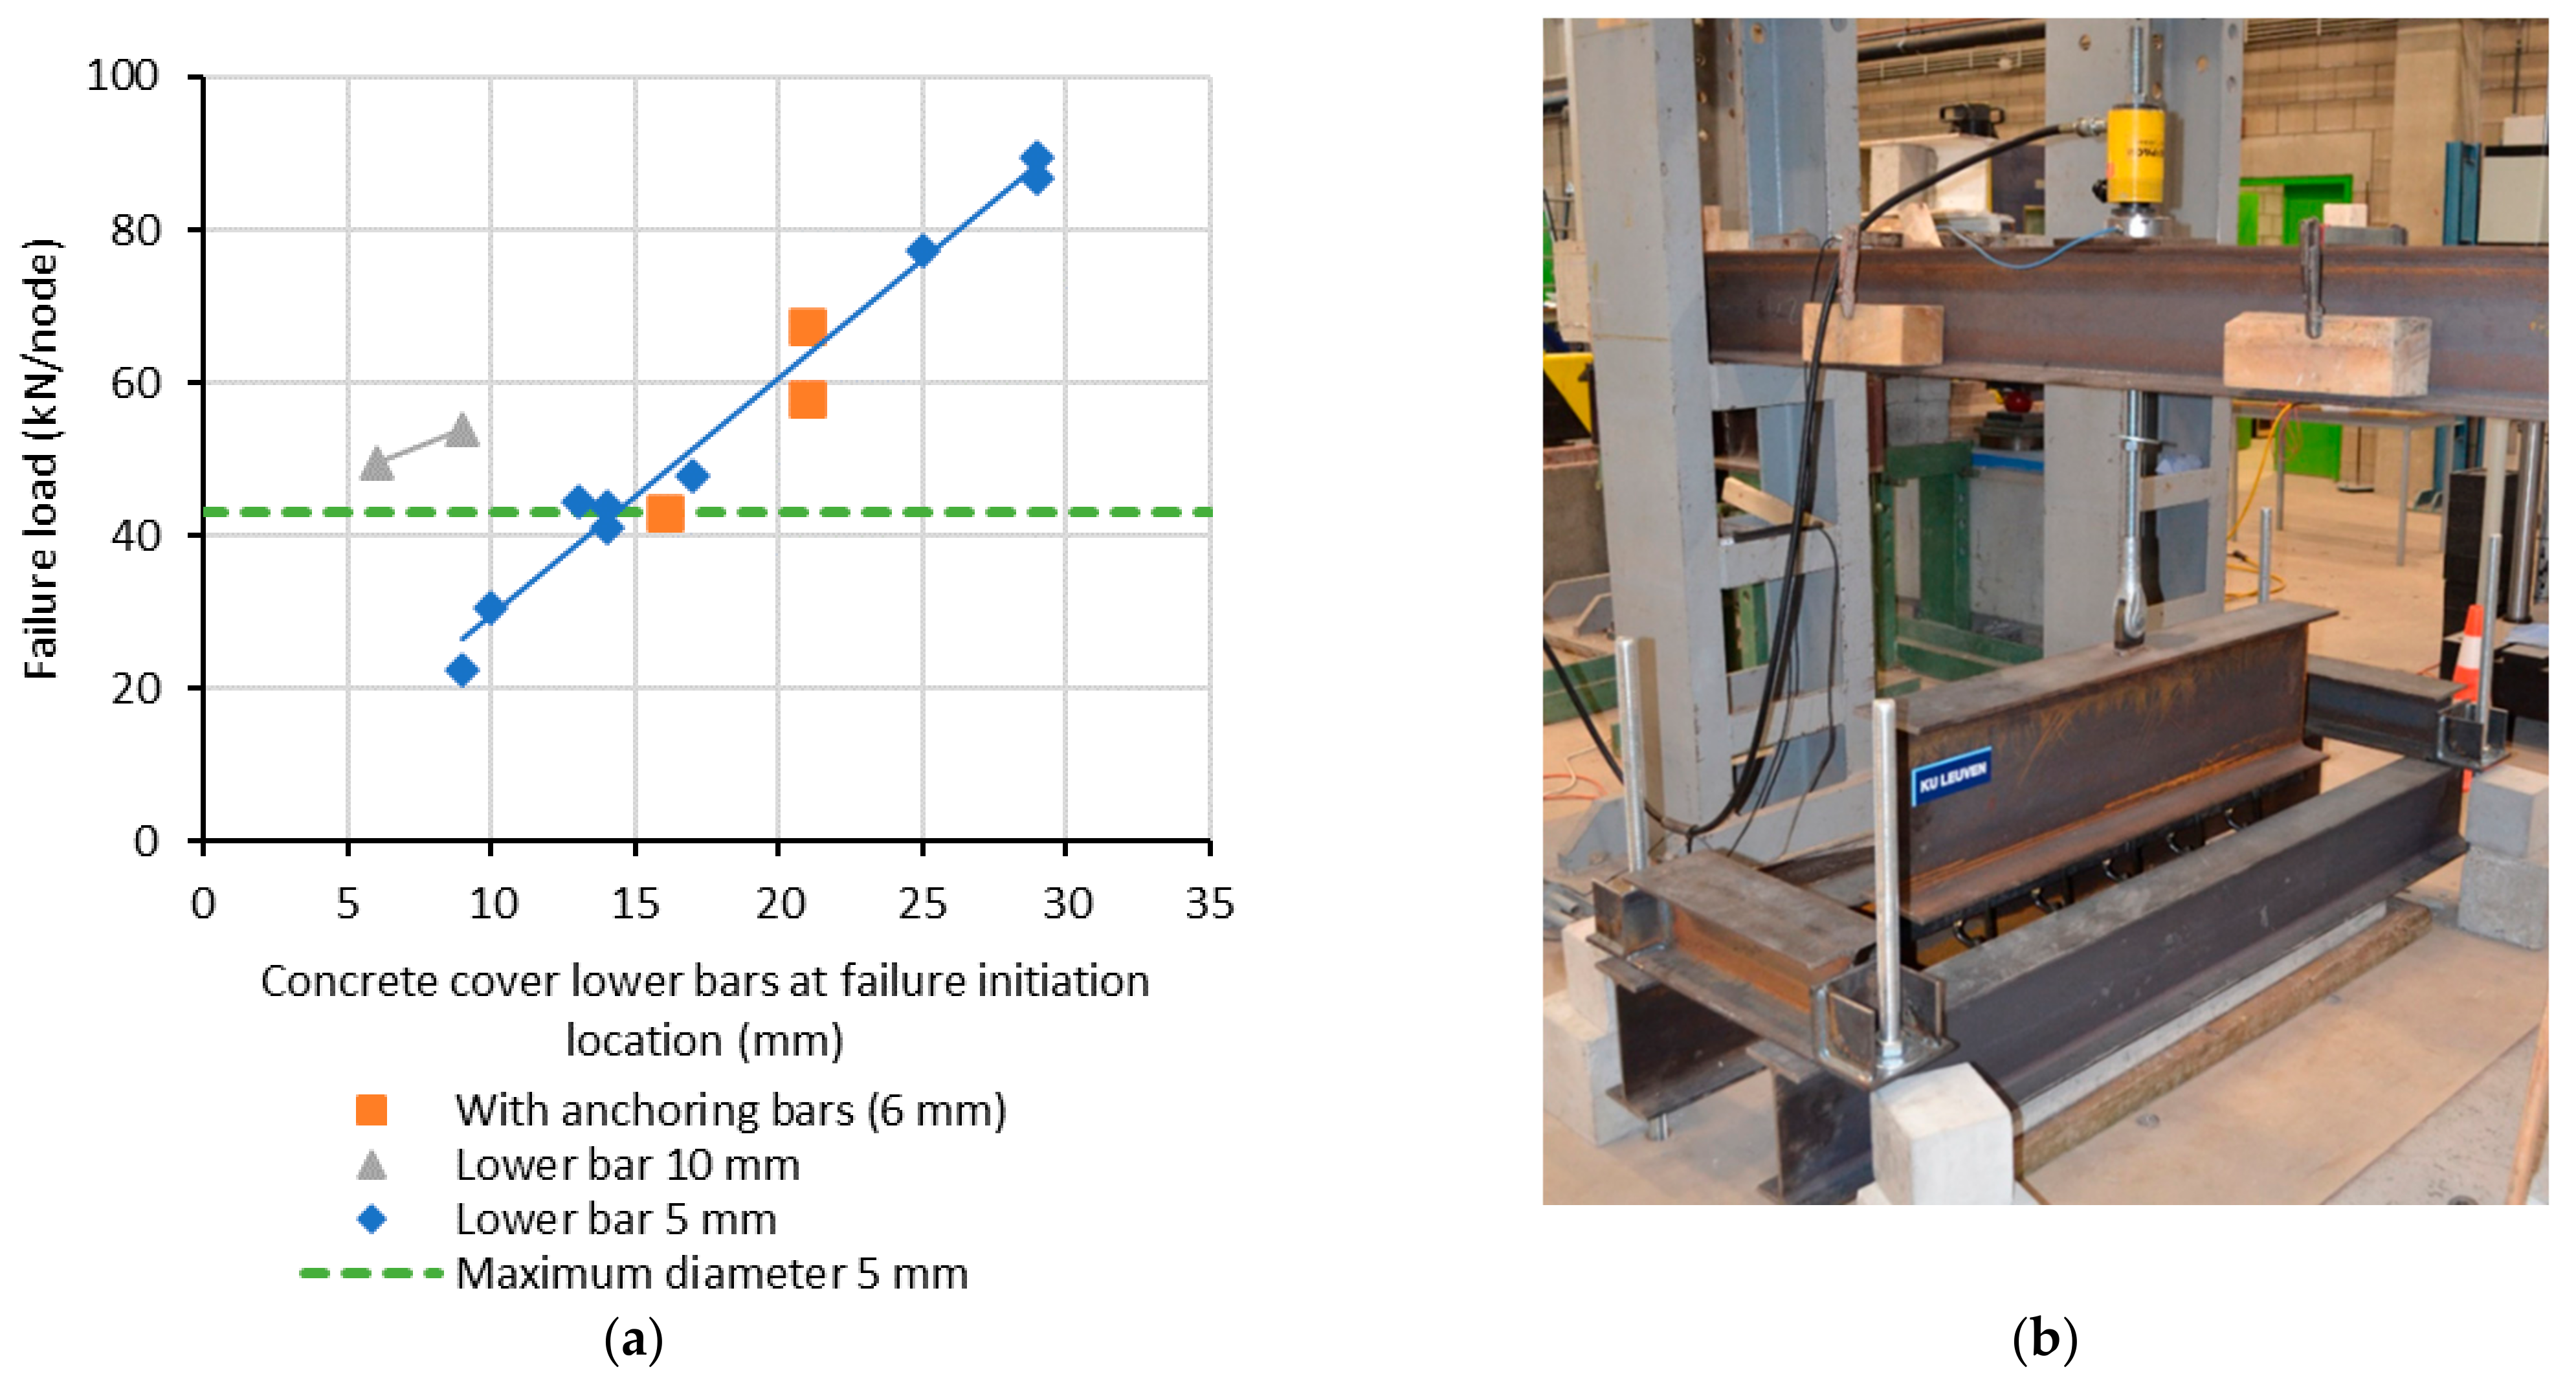
24]. The influence of the concrete cover was investigated—the diameter of the lower bars (limited to 2 tests) and the functionality of placing rebars of 6 mm over the lattice girder (each 50 cm). Only the influence of concrete cover and diameter was investigated, which results in the first idea about a failure formula for pure pull-out forces, see Equation (11). Test results and setup are shown in
Figure 16a,b, respectively. After completing test C06, it seems that both nodes did not even reach the desired 10 mm, in fact, only 8 mm. Based on
Figure 15a, pull-out of the lattice girder as observed could be expected.
During the test, it was observed that failure was always initiated at one node, which causes a chain response of the whole lattice girder of 1 m length, or five nodes. The concrete cover at the location of initiation was taken as the reference. On the other hand, no failure of the welds was observed, so it is useful to calculate the maximum force that can be taken by one node (four diagonals) of the lattice girder. From
Figure 16a, it is seen that starting from 15 mm concrete cover, more nodes will be involved in the failure mechanism as the measured loads exceed the steel capacity of the diagonals forming a node. Based on the 14 results and the failure model expressed by Equation (11), an average value of
Ftest/
Fcalc = 0.98 is obtained with a standard deviation of 0.17, coefficient of variation of 0.18, and a relatively high γ
RD1-value (1.24). As previously noted,
Vθ equals 0.15 for the bending capacity [
30]; this code gives a value of 0.25 for shear so the deviation seems still acceptable. However, following [
31], only a model factor of 1.1 is used for the safety factor on concrete, the difference with 1.24 obtained from our experiments should be included in an assessment procedure.
4.3.4. Bearing Resistance of Girders or Dowels
Once repair is needed, experiments C05 and C06 confirmed the favorable action of anchor rods. However, they should not allow free movement (C05) and an additional failure mechanism must be verified, namely the breaking out of the anchor rods from the floor plate (C06), see
Figure 11b. This failure mechanism happens at around 43 kN, when the elastic limit of the involved steel sections is also reached (two rods and eight legs of the lattice girder). Looking to the elastic capacity of the rods, this represents about half of the total value or at the load level of 43 kN a shear load of 35 kN may be expected in the rods. A simplified shape of the failure crack delivers a crack length of 2 × 95 + 225 = 415 mm, or with floor plate of 50 mm thickness, this results in a combined shear and tensile stress of only 1.69 N/mm². This cannot reasonably be linked to the tensile capacity of the floor plate, based on the relative high resistance values shown in
Table 1. From [
4], a twice higher average value may be expected, which can only be explained based on the stiffness ratios of the different components. Before cracking occurs, all load will be transferred by the anchor rods, and this should be the design option.
5. Conclusions
During the past years, an intensive campaign of bending and pull-tests have been worked out at Campus De Nayer of KU Leuven. Several different execution options—presence of voiding elements, location lattice girder, roughness, length of overlap bars, and even the simulation of possible execution errors—were carefully tested and investigated. This article delivers a comprehensive overview of the test results and accompanying design models are discussed.
It is shown that for the resistance verification at the joint location, the design can be based on the regulation for a solid slab with a reduced lever arm. However, the distance from the joint to the first lattice girder should be limited to 95 mm in combination with voiding elements; for massive slabs, good results are obtained up to 400 mm. This larger value is only based on a limited number of tests (A10 at 300 mm, C04 at 400 mm); caution should therefore be exercised in the use of this value. With the use of voiding elements, without protruding reinforcement and a distance of 300 mm, the starting point of the overlap must be moved from the joint location to the center of the first lattice girder. It should be noted that according to [
29], the joints should be classified as low ductility members, which is not a particular problem if the bending capacity of the slab does not contribute to the overall stability of the system.
With a failing interface (without adhesion, mechanical interlock, and friction) and severe delamination (above 2 mm), the lattice girders will transfer the forces coming from the overlap bars into the floor plates. This can be worked out on the basis of the Vierendeel principle by taking into account an extra 0.4 mm horizontal joint above the one that can be observed. Anchor rods can enhance the capacity of the joint, but should be designed on the full capacity of the joint and the breaking out mechanism must also be verified. The use of anchor rods seems to be an appropriate repair method.
To allow for a massive design approach without taking into account the effect of the joints, limiting the distance from the joint to the first lattice girder is advised, in the case of voiding elements, to a maximum of 15 cm (10% deviation). Additional protruding reinforcement can be foreseen to avoid lattice girders so close to the joint. This experimental study is limited to diameters of 16 mm for the overlap bars, a maximum amount of 1340 mm²/m, and the concrete with finishing for the floor plate and concrete topping as described.


