Abstract
In recent years, photovoltaic (PV) power generation has attracted considerable attention as a new eco-friendly and renewable energy generation technology. With the recent development of semiconductor manufacturing technologies, PV power generation is gradually increasing. In this paper, we analyze the types of defects that form in PV power generation panels and propose a method for enhancing the productivity and efficiency of PV power stations by determining the defects of aging PV modules based on their temperature, power output, and panel images. The method proposed in the paper allows the replacement of individual panels that are experiencing a malfunction, thereby reducing the output loss of solar power generation plants. The aim is to develop a method that enables users to immediately check the type of failures among the six failure types that frequently occur in aging PV panels—namely, hotspot, panel breakage, connector breakage, busbar breakage, panel cell overheating, and diode failure—based on thermal images by using the failure detection system. By comparing the data acquired in the study with the thermal images of a PV power station, efficiency is increased by detecting solar module faults in deteriorated photovoltaic power plants.
1. Introduction
In recent years, photovoltaic (PV) power has been receiving considerable attention as an alternative renewable energy source. Numerous studies on PV systems have attempted to improve the electrical performance of PV panels and have proposed maximum power estimation techniques and advanced power conversion techniques [1,2].
Owing to their environmental friendliness and good productivity, PV modules have been installed in various areas, including building rooftops, forests, and open fields. According to the “Korea Renewable Energy 2030 Plan”, Korea should increase the proportion of renewable energy production from the current value of 4% to 20% by 2030. However, the amount of waste from spent PV modules is expected to exceed 1900 tons in 2030 (the target year of the 2030 Plan) and 85,000 tons in 2040. Therefore, it is necessary to develop a method for the disposal of solar equipment in preparation for the end-of-life management of PV modules, understand the environmental and social issues of PV modules, and reduce the cost of PV power generation [3,4,5].
PV modules have a lifespan of approximately 20 years when exposed to the outside environment, and they can be used as semipermanent systems with low maintenance costs [6]. Further, it was reported that the electrical performance of systems operated for a long time in more technologically advanced countries degraded significantly because of the degradation of the electrical characteristics and discoloration of the buffer materials, such as ethylene-vinyl acetate, in addition to physical damage [7].
In general, defect diagnosis of an aging PV panel is performed by comparing its system status and output with that of a normally operating PV system. The defects of the system can be evaluated by measuring the voltage and current of the PV panel terminals. In a previous study, ZigBee communication models were used to identify the types of PV panel defects, and it is expected that these models can be used to obtain thermal imaging data of the PV panels that are determined to be defective through their voltage drops [8].
For the accurate localization of the defects and determination of the causes of the efficiency decrease in PV panels, a system that thoroughly reflects the natural environment should be developed to compare the PV panel output under various control conditions and to obtain experimental data, including thermal images for each failure type. When implementing an actual system with traditional models or electrical performance-based failure diagnosis techniques, errors and inaccuracies in the identification of the defects may be experienced since the system status, and the output contains random signal components. To reduce such errors, in this paper, a system has been proposed that detects the failures and malfunctions of aging PV panels based on image data [9,10,11,12].
Furthermore, it is necessary to develop a method for the detection of PV panel failures at a minimum cost and avoid replacing all the panels in a PV power station. To accelerate the defect detection in PV panels, in this study, we first designed and fabricated an environmental chamber for accelerated life tests to simulate the actual natural environment by controlling key variables, such as temperature, lighting irradiation (illumination intensity), humidity, and vibration. Further, the fabricated chamber was used to conduct artificial tests and analyze the key factors affecting the normal PV panel output through the Taguchi method. Subsequently, an aging PV panel failure detection system was developed by analyzing images of frequently occurring failure types.
Ultimately, the aim was to develop a method that enables users to immediately check the type of failures among the six failure types that frequently occur in aging PV panels—namely, hotspot, panel breakage, connector breakage, busbar breakage, panel cell overheating, and diode failure—based on thermal images by using the failure detection system. To this end, we first checked the output of a normally operating PV panel and then induced various failures on the panels to obtain image data by failure type through output comparison and thermal image capturing process. Subsequently, we checked whether the same image is generated when images are captured after establishing a small-scale power generation facility using the normal panels and faulty panels.
It is expected that the proposed method will enable efficient operation of PV power generation facilities by standardizing the thermal images that are used indiscriminately and allowing easy detection of failure types. Additionally, the method will also contribute to reducing the maintenance cost as it will enable users to determine which panel is producing the lowest output in the power generation facility. Further, we propose a detection system that enables easy detection of failure types by standardizing thermal images for each failure type after capturing PV panel images with a thermal imaging camera. In addition, a method that can increase the output in the PV power generation facility by detecting whether the output is the highest or lowest in the failure types and replacing the faulty panels in a timely manner is presented.
2. Structure of PV Panel and Causes of Power Loss
2.1. Structure of a PV Panel
Once the photons from sunlight enter the semiconductor composed of a P–N junction, the electrons separated by the internal electric field accumulate in the N-type silicon, generating a charge; a path is formed to enable current to flow in the direction opposite to electron flow [13,14,15].
In a typical PV power generation system, several solar cells are wired in series to form a panel-type module. Then, several modules are wired in series and parallel. Depending on the type of light-absorbing material, solar cells can be classified into three types: silicon-based, compound semiconductor-based, and organic semiconductor-based. Further, the order of commercialization is as follows: first-generation cells (crystalline silicon), second-generation cells (amorphous silicon, copper indium gallium selenide (CIGS), and cadmium telluride (CdTe)), third-generation cells (dye-sensitized and organic cells), and next-generation cells (quantum dots and plasmons).
Among these materials, crystalline silicon solar cells were the first to be commercialized, and they currently account for more than 90% of the solar cells on the world market. Further, thin-film solar cells (CdTe, CIGS, etc.) account for approximately 8% of the world market. Dye-sensitized solar cells and organic solar cells are attracting interest owing to their potential implementation in a variety of applications, such as building-integrated PV and mobile devices. In recent years, perovskite solar cells have been widely studied as potential alternatives to silicon solar cells [16].
2.2. Power-Loss Factors of PV Panels
Excluding manufacturing errors and deterioration, the factors that affect the power loss in PV panels can be categorized into three types: mismatch effect due to shading or dirt that occurs when panels are connected in series and parallel to increase the output, changes in solar altitude, and temperature increases. These three types of factors that affect the power loss in PV panels are described in detail in the following subsections.
2.2.1. Module Mismatch Losses and Application of Inverters
The required output of PV panels is generated by arranging them into strings, i.e., connecting several panels in series or parallel (arrays), rather than using the panels individually. During operation, shading effects due to obstruction factors such as clouds or fallen leaves may cause mismatch losses, which could lead to a decrease in the power output. Several methods to decrease the module mismatch losses have been developed, including the use of built-in module inverters, string inverters, and module built-in DC–DC converters [17,18,19,20,21]. However, these methods require a separate circuit for compensating for the voltage loss due to shadowed strings. For the implementation of these methods, the cost of the additional modules to be installed, and the power losses due to the presence of these modules should be analyzed.
2.2.2. Power Loss Caused by Solar Altitude Change and Tracking System
The altitude of the sun changes from sunrise to sunset and over different seasons. PV panels are most efficient when they are positioned perpendicular to the position of the sun; thus, it is efficient to use a solar tracking system. The methods for positioning panels at the optimal angle include tracking the sun through a software program, utilizing an optical sensor, or employing both methods. In a previous study, the use of a tracking system for one month led to an increase in the output power of a 100 W panel of approximately 18% compared to a case where no tracking system was used. Nevertheless, the implementation of the corresponding systems required additional structures and power systems and incurred maintenance costs and additional power consumption.
2.3. Power-Loss Factors of PV Panels
Excluding manufacturing errors and deterioration, the factors that affect the power loss in PV panels can be categorized into three types: mismatch effect due to shading or dirt that occurs when panels are connected in series and parallel to increase the output, changes in solar altitude, and temperature increases. These three types of factors that affect the power loss in PV panels are described in detail in the following subsections.
2.3.1. Module Mismatch Losses and Application of Inverters
The required output of PV panels is generated by arranging them into strings, i.e., connecting several panels in series or parallel (arrays), rather than using the panels individually. During operation, shading effects due to obstruction factors such as clouds or fallen leaves may cause mismatch losses, which could lead to a decrease in the power output. Several methods to decrease the module mismatch losses have been developed, including the use of built-in module inverters, string inverters, and module built-in DC–DC converters [16,17,18,19,20]. However, these methods require a separate circuit for compensating for the voltage loss due to shadowed strings. For the implementation of these methods, the cost of the additional modules to be installed, and the power losses due to the presence of these modules should be analyzed.
2.3.2. Power Loss Caused by Solar Altitude Change and Tracking System
The altitude of the sun changes from sunrise to sunset and over different seasons. PV panels are most efficient when they are positioned perpendicular to the position of the sun; thus, it is efficient to use a solar tracking system. The methods for positioning panels at the optimal angle include tracking the sun through a software program, utilizing an optical sensor, or employing both methods. In a previous study, the use of a tracking system for one month led to an increase in the output power of a 100 W panel of approximately 18% compared to a case where no tracking system was used [21]. Nevertheless, the implementation of the corresponding systems required additional structures and power systems and incurred maintenance costs and additional power consumption.
3. Methods and Materials
3.1. Analysis of Aging PV Panel Failure Types
There are two main types of PV panel failure modes: corrosion and solar cell or connection problems. However, corrosion problems are usually caused by reactions such as those occurring when a metal is exposed to oxygen, solutions such as water, and other microscopic organisms. Thus, corrosion can be neglected because it is rare and insignificant in most cases; thus, only solar cell and connection problems are analyzed. Table 1 summarizes the various solar cell failure mode types analyzed in this study. Among the failure modes presented in Table 1, the most critical is the hotspot type.

Table 1.
Solar cell failure types.
3.2. Specifications of Experimental PV Panels
Three PV panel models with different outputs and sizes were selected for the PV panel output comparison test; their parameters are presented in Table 2. The panel shown in the fourth column of the table was selected to analyze whether the failure types can be found in the panel.
Table 2.
Photovoltaic (PV) panel output and specifications.
3.3. Configuration of the Environmental Chamber
Figure 1 shows photographs of the interior and exterior of the experimental chamber constructed in this study. The chamber had an external size of 3000 (W) × 4500 (D) × 2800 (H) mm, rated power of 4800 W, a correlated color temperature of 5500 K, and lamp luminous flux of 180,000 Lm. (PV panel experimental chamber, Korea) The interior of the experimental chamber was sealed and designed to allow the control of the temperature and humidity using a thermo-hygrostat and induce vertical vibrations through a vibrator installed on the support structure area. Additionally, xenon lamps with a wavelength and light irradiation similar to those of the sun were installed on top of the chamber to irradiate the PV panel. Specifically, a total of six xenon lamps with a power of 1 kW (total: 6 kW) were installed inside the chamber, along with three 220 V power supplies. (UXL Xenon Short-Arc Lamps, UXL-16SB, Germany).
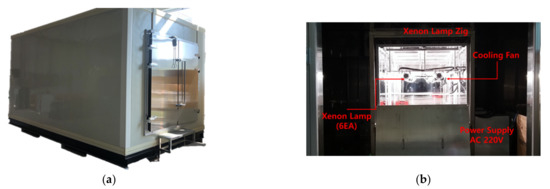
Figure 1.
Photographs of the (a) exterior and (b) the interior of the PV panel experimental chamber.
3.4. PV Panel Performance Test Method
The cells constituting the PV module generate heat during electricity generation. The cells display 100% of their normal starting efficiency when the temperature is maintained at 25 °C, and for every temperature increase of 1 °C, the efficiency decreases by 0.5%. Thus, it can be inferred that PV panels are sensitive to the temperature and that higher cell temperatures cause output degradation. Accordingly, the experiment was conducted by acquiring thermal images of the PV panel failures and considering the output decrease when the temperature increases in certain areas of the PV panels.
Assuming that the panel output degrades when a specific area of the panel heats up, the types of failure can be determined by taking a wide range of images of the power station with a drone equipped with a thermal imaging camera.
Table 3 summarizes the image acquisition methods for the most frequently occurring failure types. The thermal images used to determine the failure types can serve as a basis for reducing the maintenance cost of power generation stations by allowing only partial replacement of power generation equipment.
Table 3.
Panel image acquisition method for different panel failure types.
Figure 2 shows photographs of typical PV modules with different failure types. In figure, a total of six images are secured on failures by panel breakage, diode failure, connector degradation, hotspot, busbar breakage, and panel cell overheating to obtain thermal images that can immediately differentiate the type of failure in an aging PV panel.
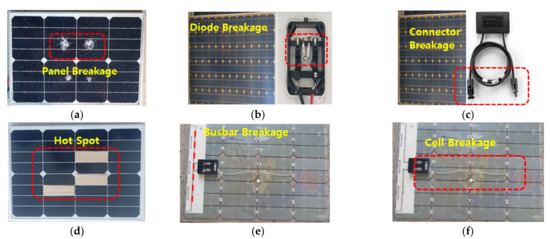
Figure 2.
Photographs of PV panels with different failure types: (a) panel breakage, (b) diode failure, (c) connector breakage, (d) hotspot, (e) busbar, and (f) overheating of panel cells.
3.5. Method for Securing PV Panel Failure Images by Constructing a Small-Scale Power Generation Facility
We established a small-scale power generation facility composed of normal and faulty panels using the failure types of Figure 2 and detected the images by failure type. The facility was equipped with a total of 32 panels, comprising two parallel modules, each composed of 16 panels connected in series. As each module generated 1.7 kW output, the facility was designed to generate a total of 3.4 kW when the two modules were connected. Additionally, the small-scale power generation facility was arranged so that the images of normal and faulty panel types could be analyzed. In this study, the PV panel images were analyzed after capturing them using a drone equipped with a thermal imaging camera. Table 4 shows Normal and faulty panel placement layout in the small-scale power generation facility.
Table 4.
Normal and faulty panel placement layout in the small-scale power generation facility.
4. Results
4.1. Key Factors of PV Module Output
Figure 3 shows the key factors affecting the PV module output obtained using the Taguchi experimental design method. In addition to the four main influential factors, the operator and maintenance time factors were analyzed. The operator factor was categorized as either professional or nonprofessional, denoted as U0 and U1, respectively; the maintenance time factor was set to 1 or 3 h, denoted as V0 and V1, respectively.
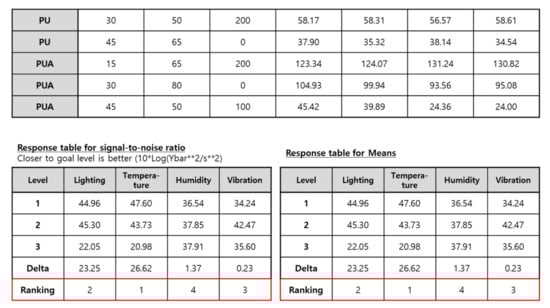
Figure 3.
Key factors affecting PV module output obtained using the Taguchi experimental design method.
From Figure 4, it can be seen that the level of influence of the factors was ranked based on signal-to-noise ratio and mean. Temperature and lighting have a high ranking in terms of both the signal-to-noise ratio and mean. It can be seen that the factors with higher response ranks were more likely to be recognized as key influential factors.
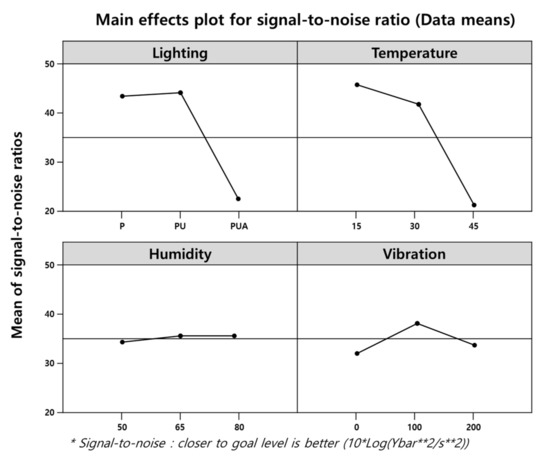
Figure 4.
Analysis results of the main effects of the signal-to-noise ratio.
Figure 4 shows the analysis results of the main effects of the signal-to-noise ratio. Similar to the response tables, the temperature and lighting factors show a greater influence (steeper slope) than the other factors.
4.2. Image Analysis According to Failure Type
We imaged the failures of twenty 35 W panels, twenty 220 W panels, and ten 365 W panels, for a total of 50 panels. Because the 35 W panels did not contain diodes, a total of five images were acquired for the failures of panel breakage, connector degradation, hotspots, busbars, and cell overheating. Furthermore, because the 220 and 365 W panels contain diodes, a total of six images, including the diode failure, were acquired for each panel type.
4.3. Analysis of the 365 W PV Panel
Table 5 presents the power output of the 365 W PV panel measured before and after different failure types. From the table, it can be seen that before failure, the output of the 365 W panel is 355.79 W, and after failure, it decreased by at least 10% in all cases.
Table 5.
Power output of the 365 W PV panel after different failure types.
Figure 5 shows photographs and thermal images of the 365 W PV panel after different types of failure. From the figure, it can be seen that overheating occurs in a certain part of the panel in the case of the hotspot problem. Furthermore, sporadic heat generation is observed in the case of diode malfunction. In the case of connector failure, heat generation is observed at the edges of the panel. In the case of cell overheating, heat generation is observed throughout the damaged areas. Lastly, in the case of busbar failure, overheating is observed in the area where the busbar is located.

Figure 5.
Photographs (left) and thermal images (right) of the 365 W panel with different failure types: (a) hotspot, (b) diode failure, (c) connector breakage, (d) panel breakage, (e) busbar, and (f) overheating of panel cells.
4.4. Analysis of the 220 W PV Panel
Table 6 presents the power output of the 220 W PV panel measured before and after different failure types. From the table, it can be seen that before failure, the output of the panel is 175.10 W. After diode failure, connector breakage, and cell overheating, the panel output is 0 W.
Table 6.
Power output of the 220 W PV panel after different failure types.
Figure 6 shows photographs and thermal images of the 220 W PV panel after different types of failures. It can be seen that the thermal images of the 220 W PV panels after different types of failures are similar to those of the 365 W PV panels.
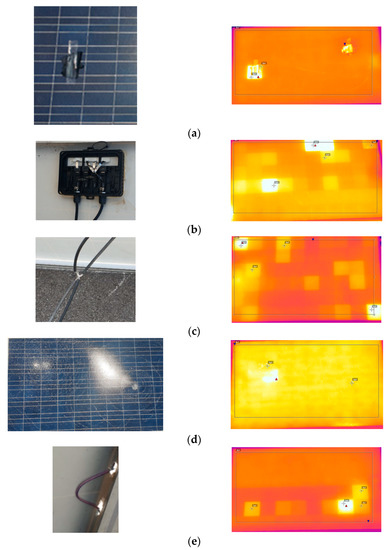
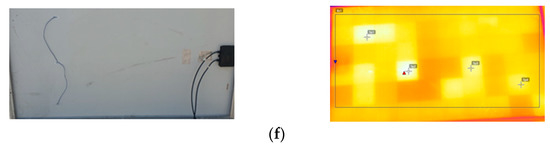
Figure 6.
Photographs (left) and thermal images (right) of the 220 W panel with different failure types: (a) hotspot, (b) diode failure, (c) connector breakage, (d) panel breakage, (e) busbar, and (f) overheating of panel cells.
4.5. Analysis of the 35 W PV Panel
Table 7 presents the power output of the 35 W PV panel measured before and after different failure types (excluding diode failure because low-output power panels do not contain diodes). After connector breakage and cell overheating, the panel output is 0 W.
Table 7.
Power output of the 35 W PV panel after different failure types.
Figure 7 shows photographs and thermal images of the 35 W PV panel after different types of failures. It can be seen that the thermal images of the 35 W PV panels after different types of failures are similar to those of the 365 and 220 W PV panels.
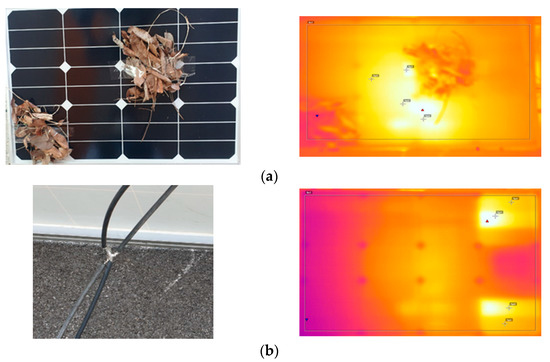
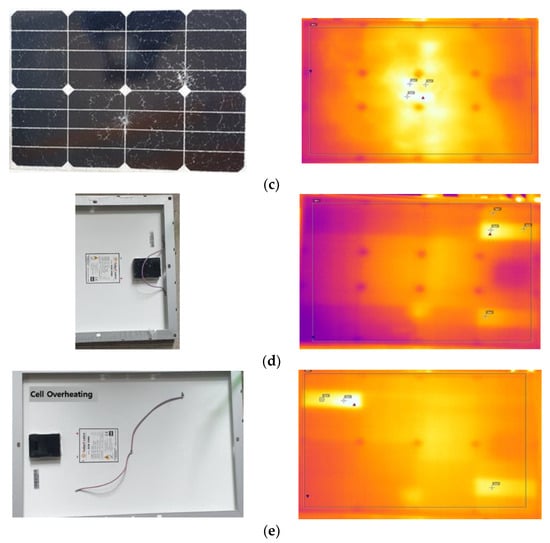
Figure 7.
Photographs (left) and thermal images (right) of the 35 W panel with different failure types: (a) hotspot, (b) connector breakage, (c) panel breakage, (d) busbar, and (e) overheating of panel cells.
4.6. PV Panel Thermal Image Analysis Results
Figure 8 shows thermal images of the investigated panels with different failure types. From figure, it can be seen that most of the failure images are similar. It can be concluded that by photographing a PV power station with a drone equipped with a thermal imaging camera, malfunctions in the panels can be discovered immediately. As a result, faulty panels can be replaced, enhancing the power output and efficiency of the station.
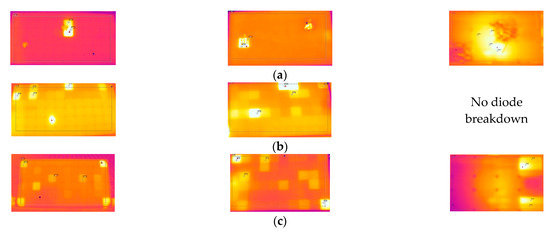

Figure 8.
Thermal images of the 365 W (left), 220 W (middle), and 35 W (right) panels after different failure types: (a) hotspot, (b) diode failure, (c) connector breakage, (d) panel breakage, (e) busbar, and (f) overheating of panel cells.
4.7. Output Data Comparison Analysis by Failure Type in the 365 W, 220 W, and 35 W Panels
As the output of the PV panels varies by size, failure types were generated on a total of 50 panels composed of 365 W, 220 W, and 35 W PV panels to compare the output data. Figure 5 illustrates failure images of a 365 W panel by failure type, while Figure 6 and Figure 7 illustrate failure images of a 220 W panel and a 35 W panel, respectively. Figure 8 shows combined thermal images for each output. The important factor here is to analyze the changes in the output in each failure type and propose a method for increasing the efficiency of the power generation facility by prioritizing replacement of the PV panels having the lowest output among the failure types.
Figure 9 compares the output values of each PV panel by failure type. In the figure, (a) to (f) indicate the following failure types: (a) hotspot, (b) diode failure, (c) connector breakage, (d) panel breakage, (e) busbar, and (f) overheating of panel cells. The failure type yielding the lowest panel output was analyzed as the (c) connector breakage, followed by (d) panel breakage, (b) diode failure, (e) busbar, (f) overheating of panel cells, and (a) hotspot. When the connector breakage was detected through PV panel imaging, the corresponding panel was analyzed as the panel requiring a priority in replacement. It is inferred that the panel that requires immediate replacement can be derived based on the images obtained using a thermal imaging camera and the panel output data.
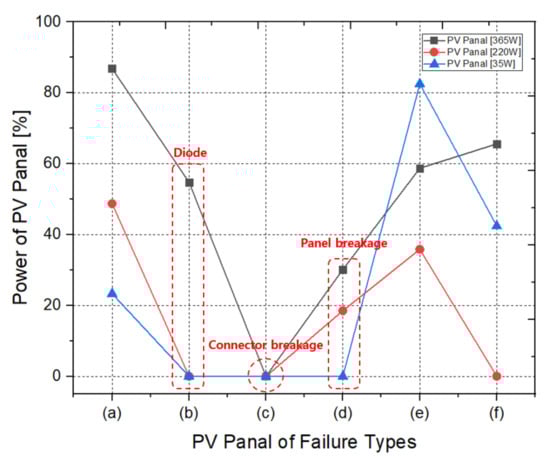
Figure 9.
Output comparison of each PV panel by failure type.
4.8. Thermal Image Results of Small-Scale Power Generation Facility
Based on the panel placement layout shown in Table 4, the PV panels were arranged using normal and faulty panels. The panels were arranged in parallel modules, with each module comprising16 panels in series. Further, a thermal imaging camera was attached to a drone to obtain the images of the normal and faulty PV panels. The images were captured during clear weather, and the drone was set to fly at the height of about 20 m from the ground.
Figure 10. Faulty panel images acquired using a thermal imaging camera. While panels #1, 3, 9, 11, 17, 19, 25, and 27 were normal panels without any failure shown in the thermal images, it can be seen that the rest of the panels other than the normal ones showed overheating of cells in certain areas of the panel as a result of taking images with a thermal imaging camera for each failure type, thereby generating various images. As for the connector breakage, it was possible to detect the failure with only the image analysis as severe overheating is generated throughout the PV panel. In the connector breakage, which yields the lowest output, the phenomenon in which the cells encounter overheating throughout the panels is observed. Through this image analysis, it was possible to check the results of image data for panels requiring immediate replacement by acquiring images of connector breakage, which displays the lowest panel output among the failure types.
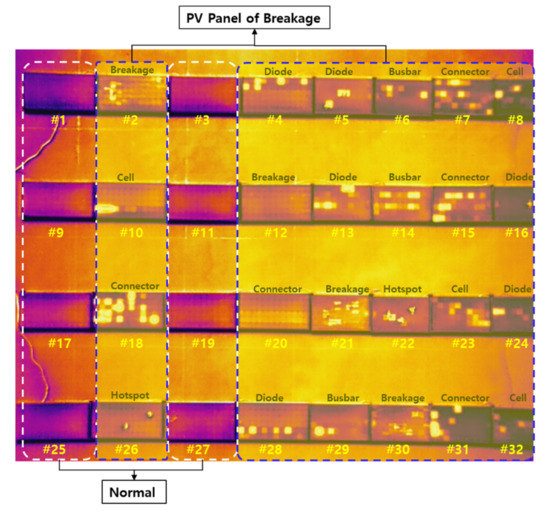
Figure 10.
Faulty panel images acquired using a thermal imaging camera.
5. Conclusions
In this study, we analyzed the power output of PV panels after different types of failure. To this end, we designed and fabricated an experimental chamber and placed PV panels inside the chamber. Xenon lamps were used to simulate sunlight irradiation. After generating different types of damage to PV panels with power outputs of 365, 220 and 35 W and irradiating these in the experimental chamber, failure images were acquired using a thermal imaging camera to analyze the damaged PV panels. Many similarities were found in the thermal images of the PV panels with different failures.
By comparing the data acquired in this study with the thermal images of a PV power station, PV panels experiencing malfunction could be identified, and the power output loss due to the defects could be calculated.
In the future, more failure images of panels in PV power stations should be captured using drones. By analyzing these images in real time, panel failures can be discovered, improving the efficiency of PV power stations.
Based on the experiment results of this study, it was possible to obtain images of PV panels showing the lowest output and overheating throughout the panels by conducting analysis on the thermal images of a PV power generation facility captured using a drone. While the output can be increased by replacing the entire panel when failure types occur, if the replacement priority is given on the connector breakage failure type that yields the lowest output among all failure types in consideration of the cost aspect, the output of the power generation facility can be improved, and the maintenance cost can be minimized as proposed in this study.
Author Contributions
Conceptualization, M.-H.H. and H.-S.L.; data curation, H.-S.L.; formal analysis, Y.-G.K.; methodology, Y.-D.K.; supervision, H.-R.C.; validation, H.-R.C. and M.-H.H.; visualization, H.-S.L.; writing—original draft, M.-H.H.; writing—review and editing, Y.-G.K. All authors have read and agreed to the published version of the manuscript.
Funding
This study was conducted with the support of the Korea Institute of Energy Technology Evaluation and Planning as “Developing image big data based real time detection system for detecting defective module applied to solar power plant (KETEP 20183010014230).”
Conflicts of Interest
The authors declare no conflict of interest.
References
- Larbes, C.; Cheikh, S.A.; Obeidi, T.; Zerguerras, A. Genetic algorithms optimized fuzzy logic control for the maximum power point tracking in photovoltaic system. Renew. Energy 2009, 34, 2093–2100. [Google Scholar] [CrossRef]
- Ram, J.P.; Babu, T.S.; Rajasekar, N. A comprehensive review on solar PV maximum power point tracking techniques. Renew. Sustain. Energy Rev. 2017, 67, 826–847. [Google Scholar] [CrossRef]
- Hong, Y.Y.; Buay, P.M.P. Robust design of type-2 fuzzy logic-based maximum power point tracking for photovoltaics. Sustain. Energy Technol. Assess. 2020, 38, 100669. [Google Scholar] [CrossRef]
- Kim, K.J. Development of hybrid type photovoltaic energy storage system for improvement of durability and electric power efficiency. J. Korean Soc. Mech. Technol. 2018, 20, 306–311. [Google Scholar]
- Madeti, S.R.; Singh, S.N. A comprehensive study on different types of faults and detection techniques for solar photovoltaic system. Sol. Energy 2017, 158, 161–185. [Google Scholar] [CrossRef]
- Qais, M.H.; Hasanien, H.M.; Alghuwainem, S.; Nouh, A.S. Coyote optimization algorithm for parameters extraction of three-diode photovoltaic models of photovoltaic modules. Energy 2019, 187, 116001. [Google Scholar] [CrossRef]
- Ilse, K.K.; Figgis, B.W.; Naumann, V.; Hagendorf, C.; Bagdahn, J. Fundamentals of soiling processes on photovoltaic modules. Renew. Sustain. Energy Rev. 2018, 98, 239–254. [Google Scholar] [CrossRef]
- Cho, H.C.; Jung, Y.J.; Lee, G.H. A study on fault detection for photovoltaic power modules using statistical comparison scheme. J. Korean Sol. Energy Soc. 2013, 33, 153–156. [Google Scholar] [CrossRef][Green Version]
- Ko, S.W.; So, J.H.; Hwang, H.M.; Ju, Y.C.; Song, H.J.; Shin, W.G.; Kang, G.H.; Choi, J.R.; Kang, I.C. The monitoring system with PV module-level fault diagnosis algorithm. J. Korean Sol. Energy Soc. 2018, 38, 21–28. [Google Scholar]
- So, J.H.; Ko, S.W.; Ju, Y.C. Losses comparison and analysis for fault modes of grid-connected photovoltaic system. J. Korean Sol. Energy Soc. 2017, 37, 23–32. [Google Scholar] [CrossRef][Green Version]
- Kim, Y.H.; Shim, K.S. Efficiency computation and failure detection of solar power generation panels. Comput. Syst. Theory 2013, 40, 1–7. [Google Scholar]
- Jeong, J.Y.; Choi, S.S.; Choi, H.Y.; Ryu, S.W.; Lee, I.C.; Rho, D.S. A study on the optimal configuration algorithm for modeling and improving the performance of PV module. J. Korean Acad. Industr. Coop. Soc. 2016, 17, 723–730. [Google Scholar]
- Bollinger, B.; Gillingham, K. Peer effects in the diffusion of solar photovoltaic panels. Mark. Sci. 2012, 31, 900–912. [Google Scholar] [CrossRef]
- Sohani, A.; Sayyaadi, H. Employing genetic programming to find the best correlation to predict temperature of solar photovoltaic panels. Energy Convers. Manag. 2020, 224, 113291. [Google Scholar] [CrossRef]
- Ezzaeri, K.; Fatnassi, H.; Bouharroud, R.; Guardo, L.; Bazgaou, A.; Wifaya, A.; Demarti, H.; Bekkaoui, A.; Aharoune, A.; Poncet, C.; et al. The effect of photovoltaic panels on the microclimate and on the tomato production under photovoltaic canarian greenhouses. Sol. Energy 2018, 173, 1126–1134. [Google Scholar] [CrossRef]
- Bayrak, F.; Oztop, H.F.; Selimefendigil, F. Effects of different fin parameters on temperature and efficiency for cooling of photovoltaic panels under natural convection. Sol. Energy 2019, 188, 484–494. [Google Scholar] [CrossRef]
- Picault, D.; Raison, B.; Bacha, S.; Aguilera, J.; Casa, J. Changing photovoltaic array interconnections to reduce mismatch losses: A case study. In Proceedings of the 2010 9th International Conference on Environment and Electrical Engineering, Prague, Czech Republic, 16–19 May 2010; pp. 37–40. [Google Scholar]
- Aoun, N.; Bailek, N. Evaluation of mathematical methods to characterize the electrical parameters of photovoltaic modules. Energy Convers. Manag. 2019, 193, 25–38. [Google Scholar] [CrossRef]
- Ma, T.; Gu, W.; Shen, L.; Li, M. An improved and comprehensive mathematical model for solar photovoltaic modules under real operating conditions. Sol. Energy 2019, 184, 292–304. [Google Scholar] [CrossRef]
- Ko, J.S.; Chung, D.H. Reconfiguration of PV module considering the shadow influence of photovoltaic system. J. Korean Inst. Illum. Electr. Install. Eng. 2013, 27, 36–44. [Google Scholar]
- Kish, G.J.; Lee, J.J.; Lehn, P.W. Modelling and control of photovoltaic panels utilising the incremental conductance method for maximum power point tracking. IET Renew. Power Gener. 2012, 6, 259–266. [Google Scholar] [CrossRef]


Publisher’s Note: MDPI stays neutral with regard to jurisdictional claims in published maps and institutional affiliations. |
© 2021 by the authors. Licensee MDPI, Basel, Switzerland. This article is an open access article distributed under the terms and conditions of the Creative Commons Attribution (CC BY) license (http://creativecommons.org/licenses/by/4.0/).