
Seismic and Geodetic Crustal Moment-Rates Comparison: New Insights on the Seismic Hazard of Egypt

 ,
,  ,
,  , , and
Abstract
:1. Introduction
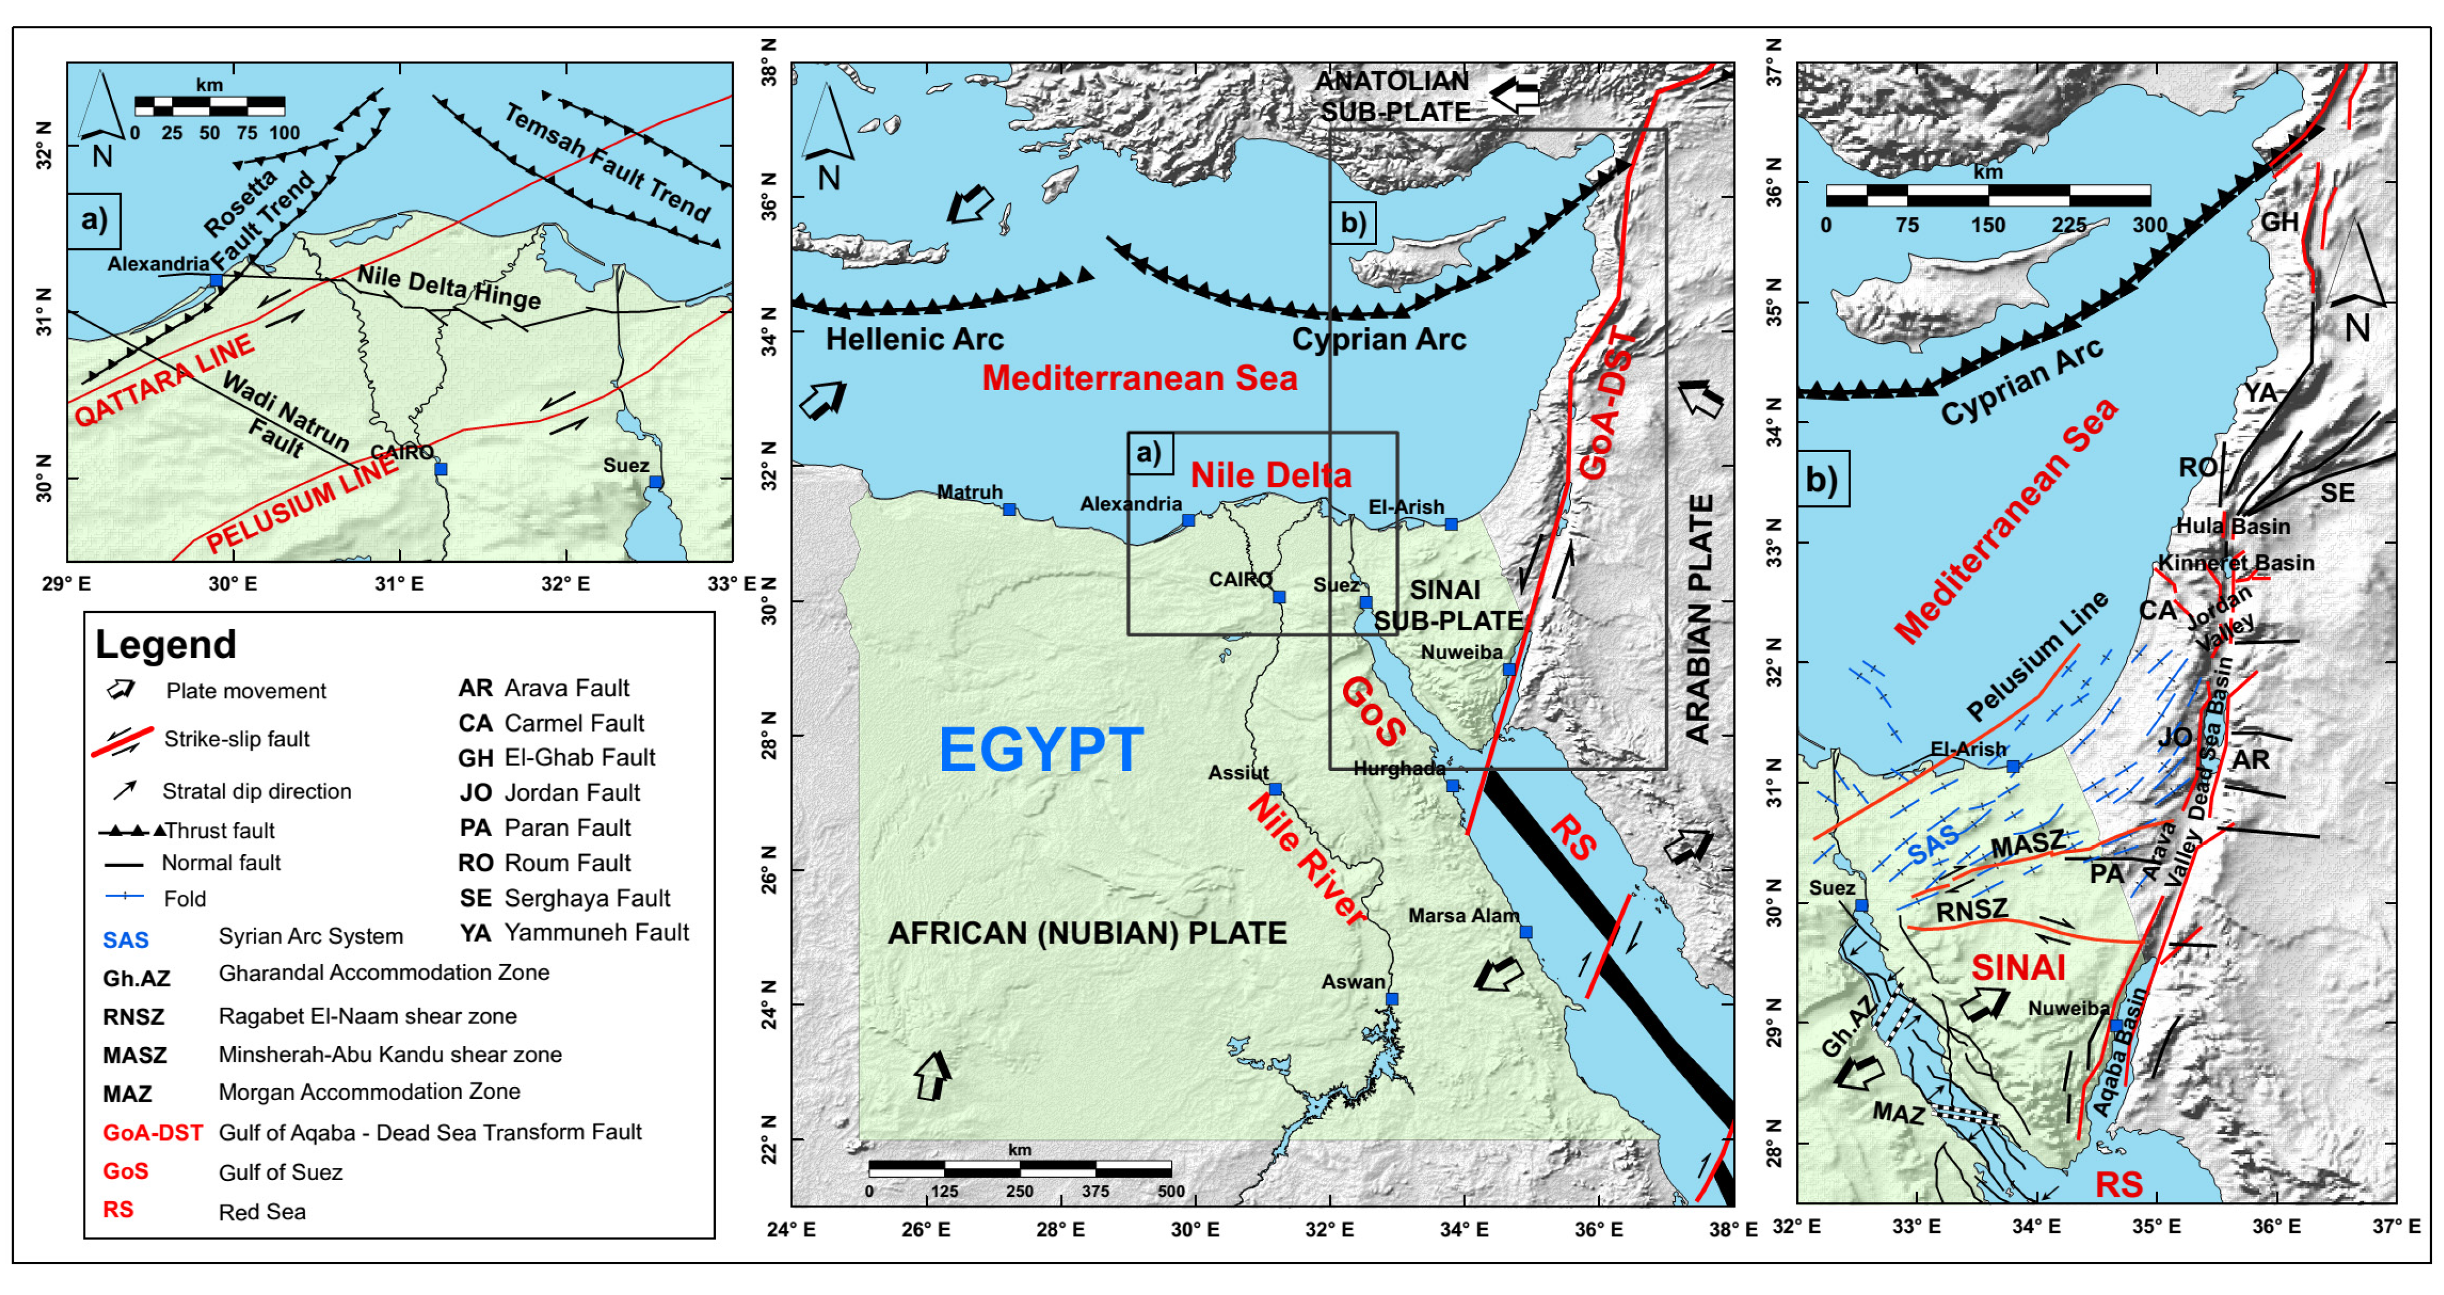
2. Tectonic Setting
3. Preparation of an Updated and Unified Earthquake Catalog
- The Poissonian earthquake catalog by Sawires et al. [48] for Egypt was considered as a priority since they considered both historical and instrumental earthquakes, covering large spatial (the whole territory of Egypt) and temporal extension (2200 B.C.–2014). The final number of earthquakes gathered from this catalog was 22,054 events.
- The local instrumental earthquake catalog of the Egyptian National Seismic Network was published by Abd El–Aal et al. [49]. They considered the time period from 1997 to 2019. A number of 1.543 earthquakes from this reference (including magnitudes equal to or greater than 3.0) was also included in our catalog.
- An additional number of earthquakes (4885 events) were collected from the Israel National Seismic Network (FDSN; https://www.fdsn.org/networks/detail/IS/; last accessed on 1 June 2021) in addition to other related publications (e.g., [50]).
- The instrumental earthquake catalog developed by Deif et al. [51] for the Arabian Peninsula was also considered, especially for the Red Sea region. Their catalog covers the period between 1900 and 2015, and 974 earthquakes from it were considered to be included in our database.
- Besides these local bulletins and catalogs (for Egypt, Israel, and the Arabian Peninsula), data from regional and international bulletins were also gathered. Within the period from 2014 until the present, a number of 393, 12, and 73 earthquakes in this region have been collected from the International Seismological Centre (ISC; http://www.isc.ac.uk/iscbulletin/search/; last accessed on 1 June 2021), the ISC-EHB bulletin (http://www.isc.ac.uk/isc-ehb/; last accessed on 1 June 2021), and the National Earthquake Information Center, United States Geological Survey (USGS; https://earthquake.usgs.gov/earthquakes/search/; last accessed on 1 June 2021), respectively.
- For those earthquakes compiled by Sawires et al. [48], ISC, EHB-ISC, and USGS bulletins, the same conversion relationships developed by these authors have been applied to convert macroseismic intensity values, mb, Ms, MD, and ML to Mw (Equations (1)–(5)).
- Finally, since the data collected from the Israel National Seismic Network are reported in MD scale, the conversion relationship developed by Ataeva et al. [50] to do the conversion to the Mw scale has been used (Equation (9)).
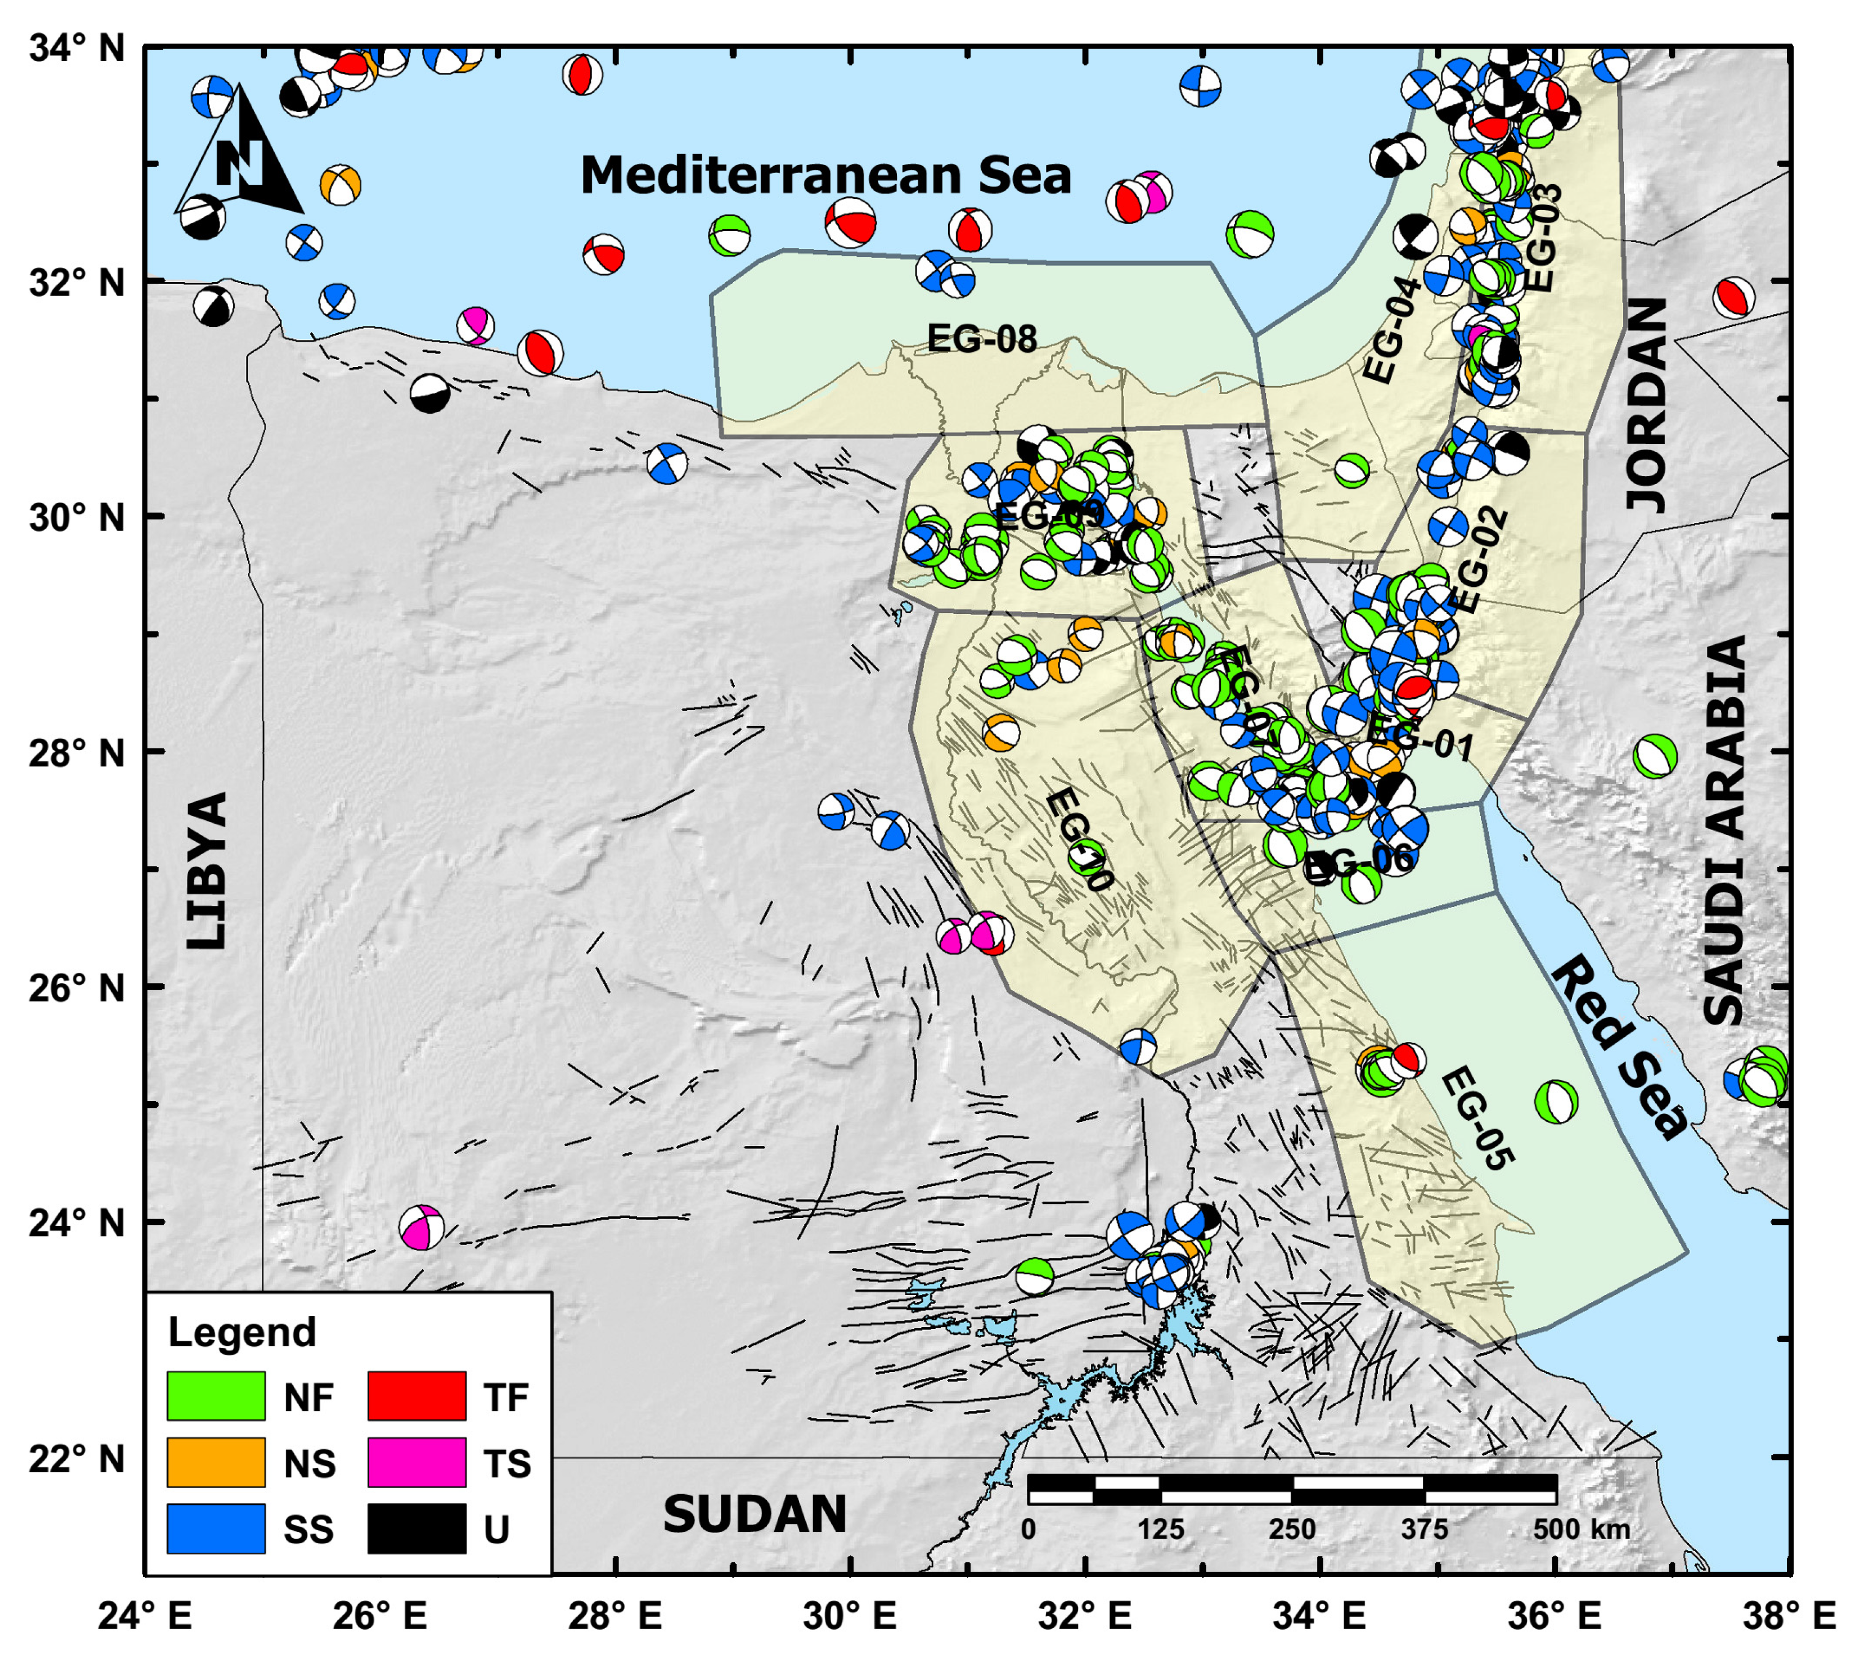
4. Seismicity of Egypt
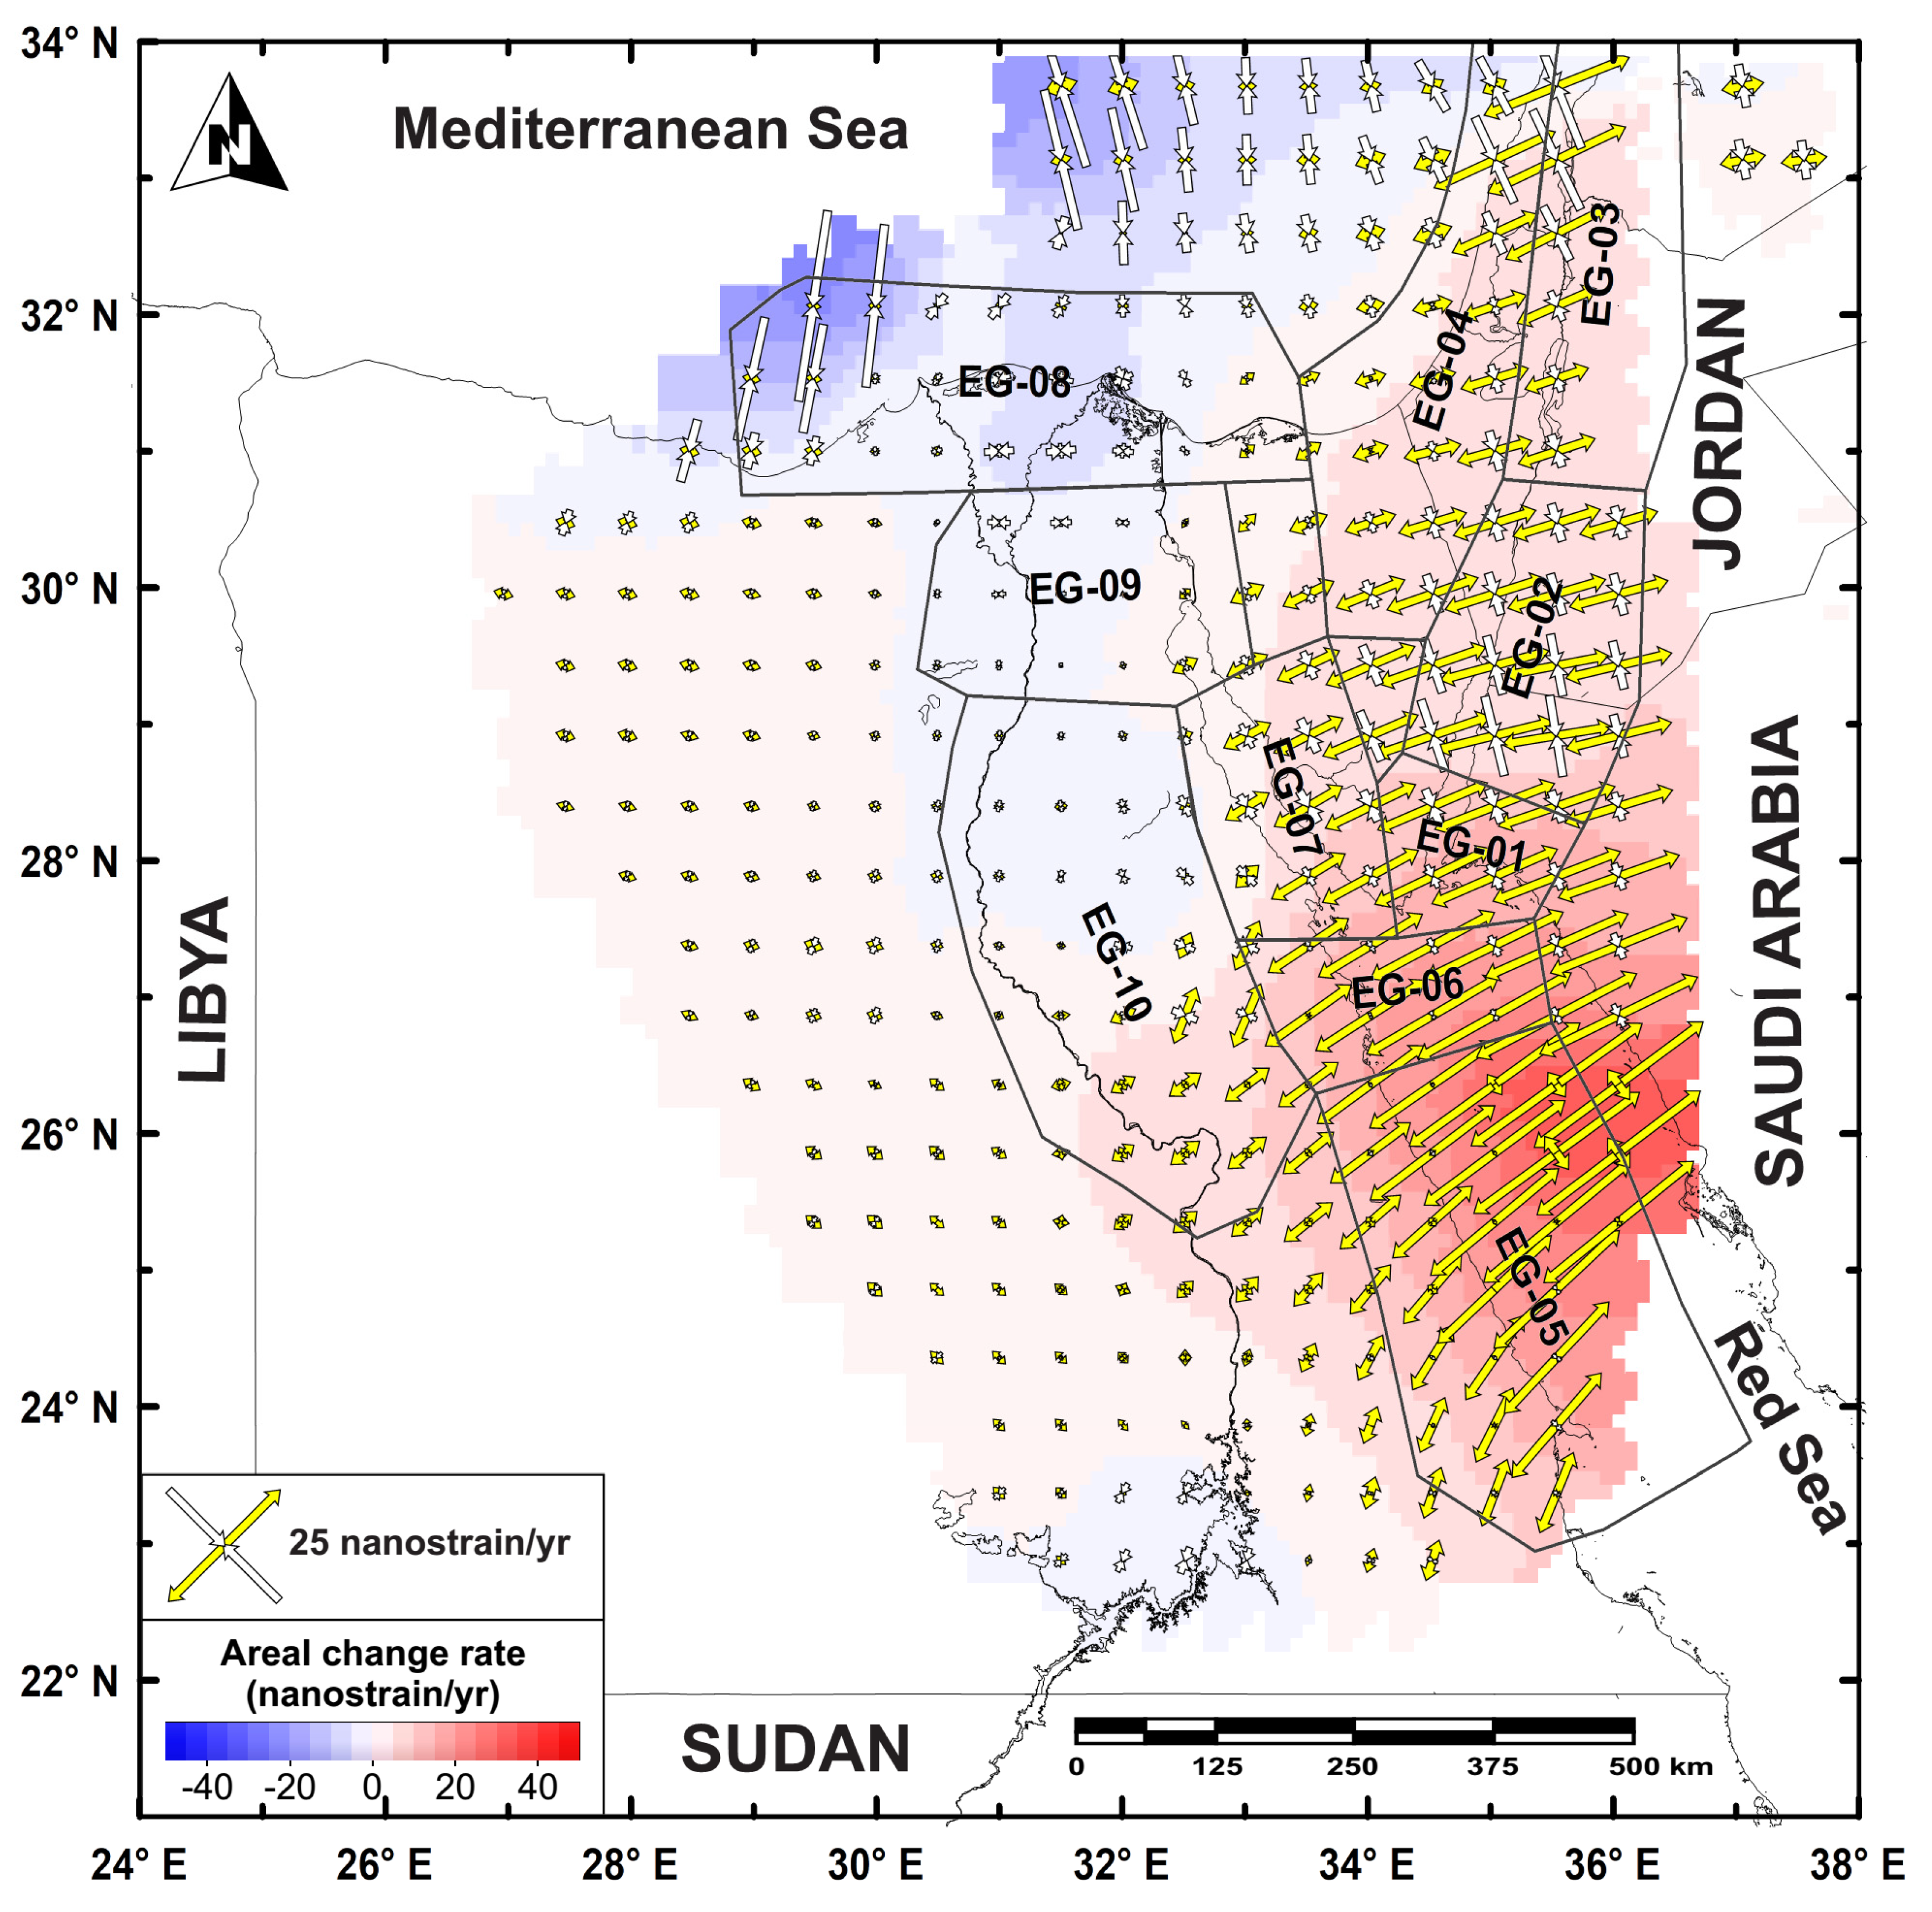
5. Geodetic Data
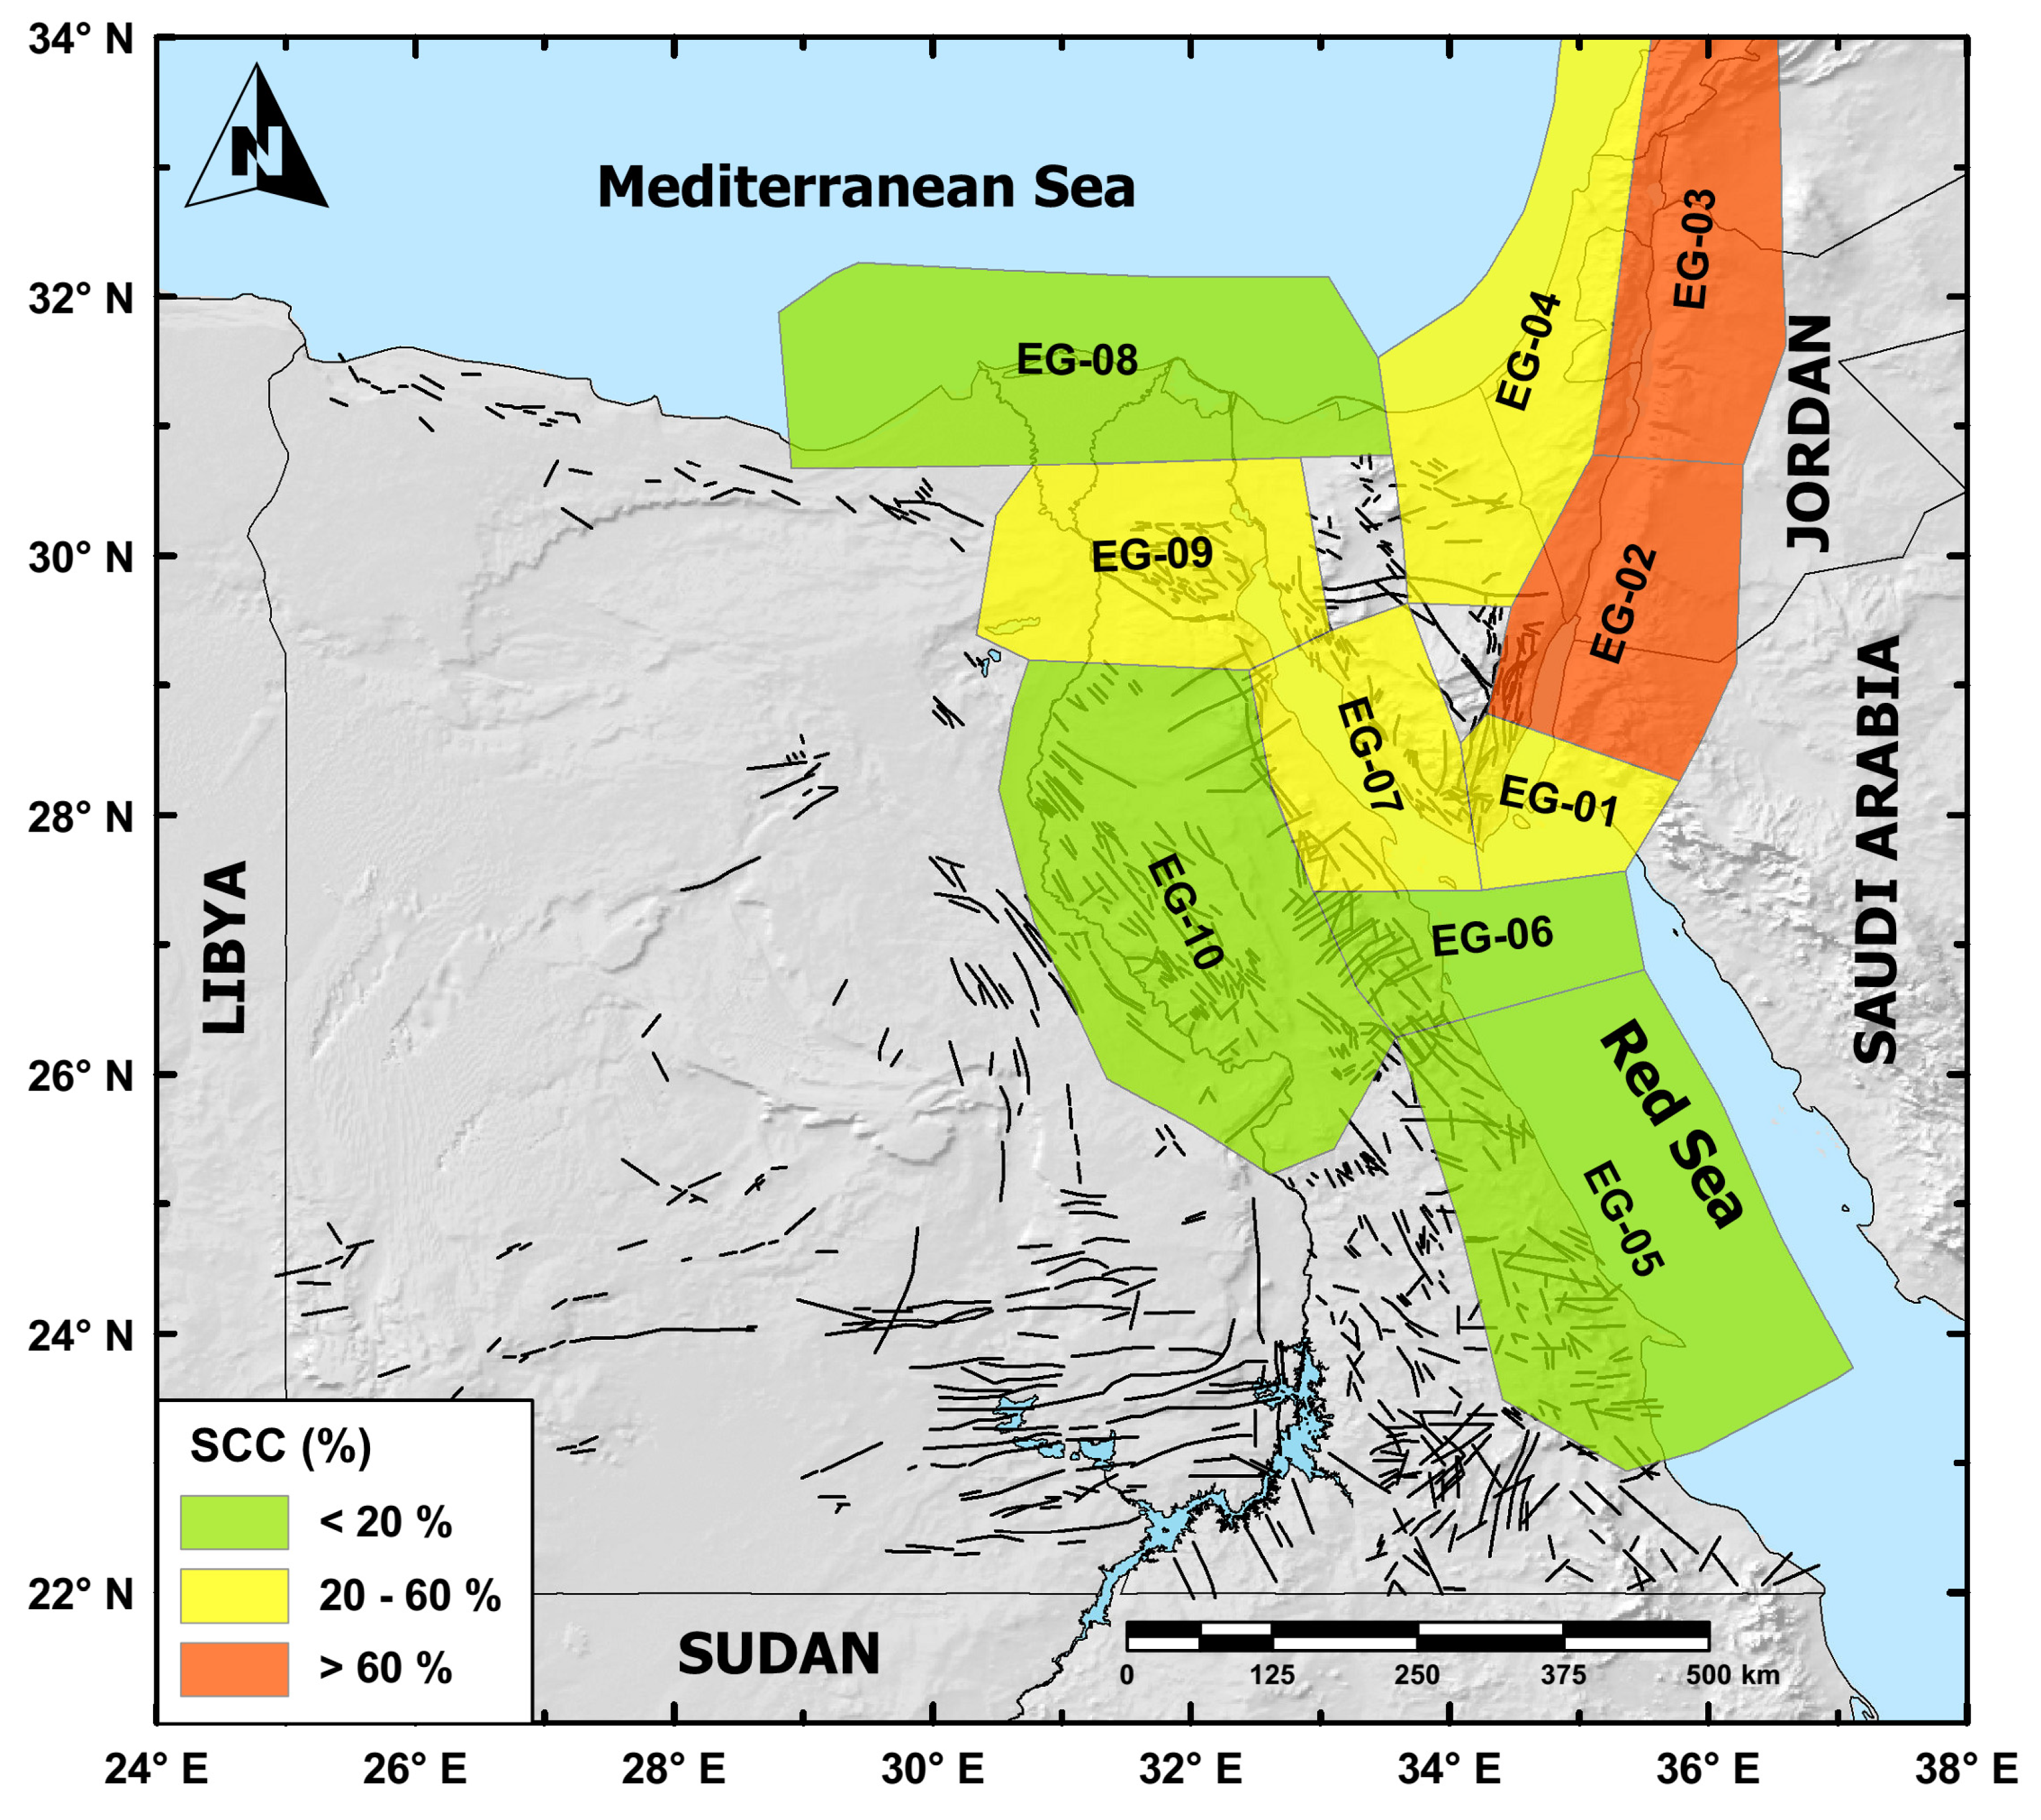
6. Delimitation of Seismic Sources
6.1. Seismic Sources along the Gulf of Aqaba–Dead Sea Transform Fault System (EG-01 to EG-04)
6.2. Seismic Sources along the Gulf of Suez–Red Sea Rift (EG-05 to EG-07)
6.3. Seismic Sources along the Nile Valley and the Nile Delta (EG-08 to EG-10)
7. Estimation of Seismicity Parameters and Seismic Moment-Rates
8. Geodetic Moment-Rates
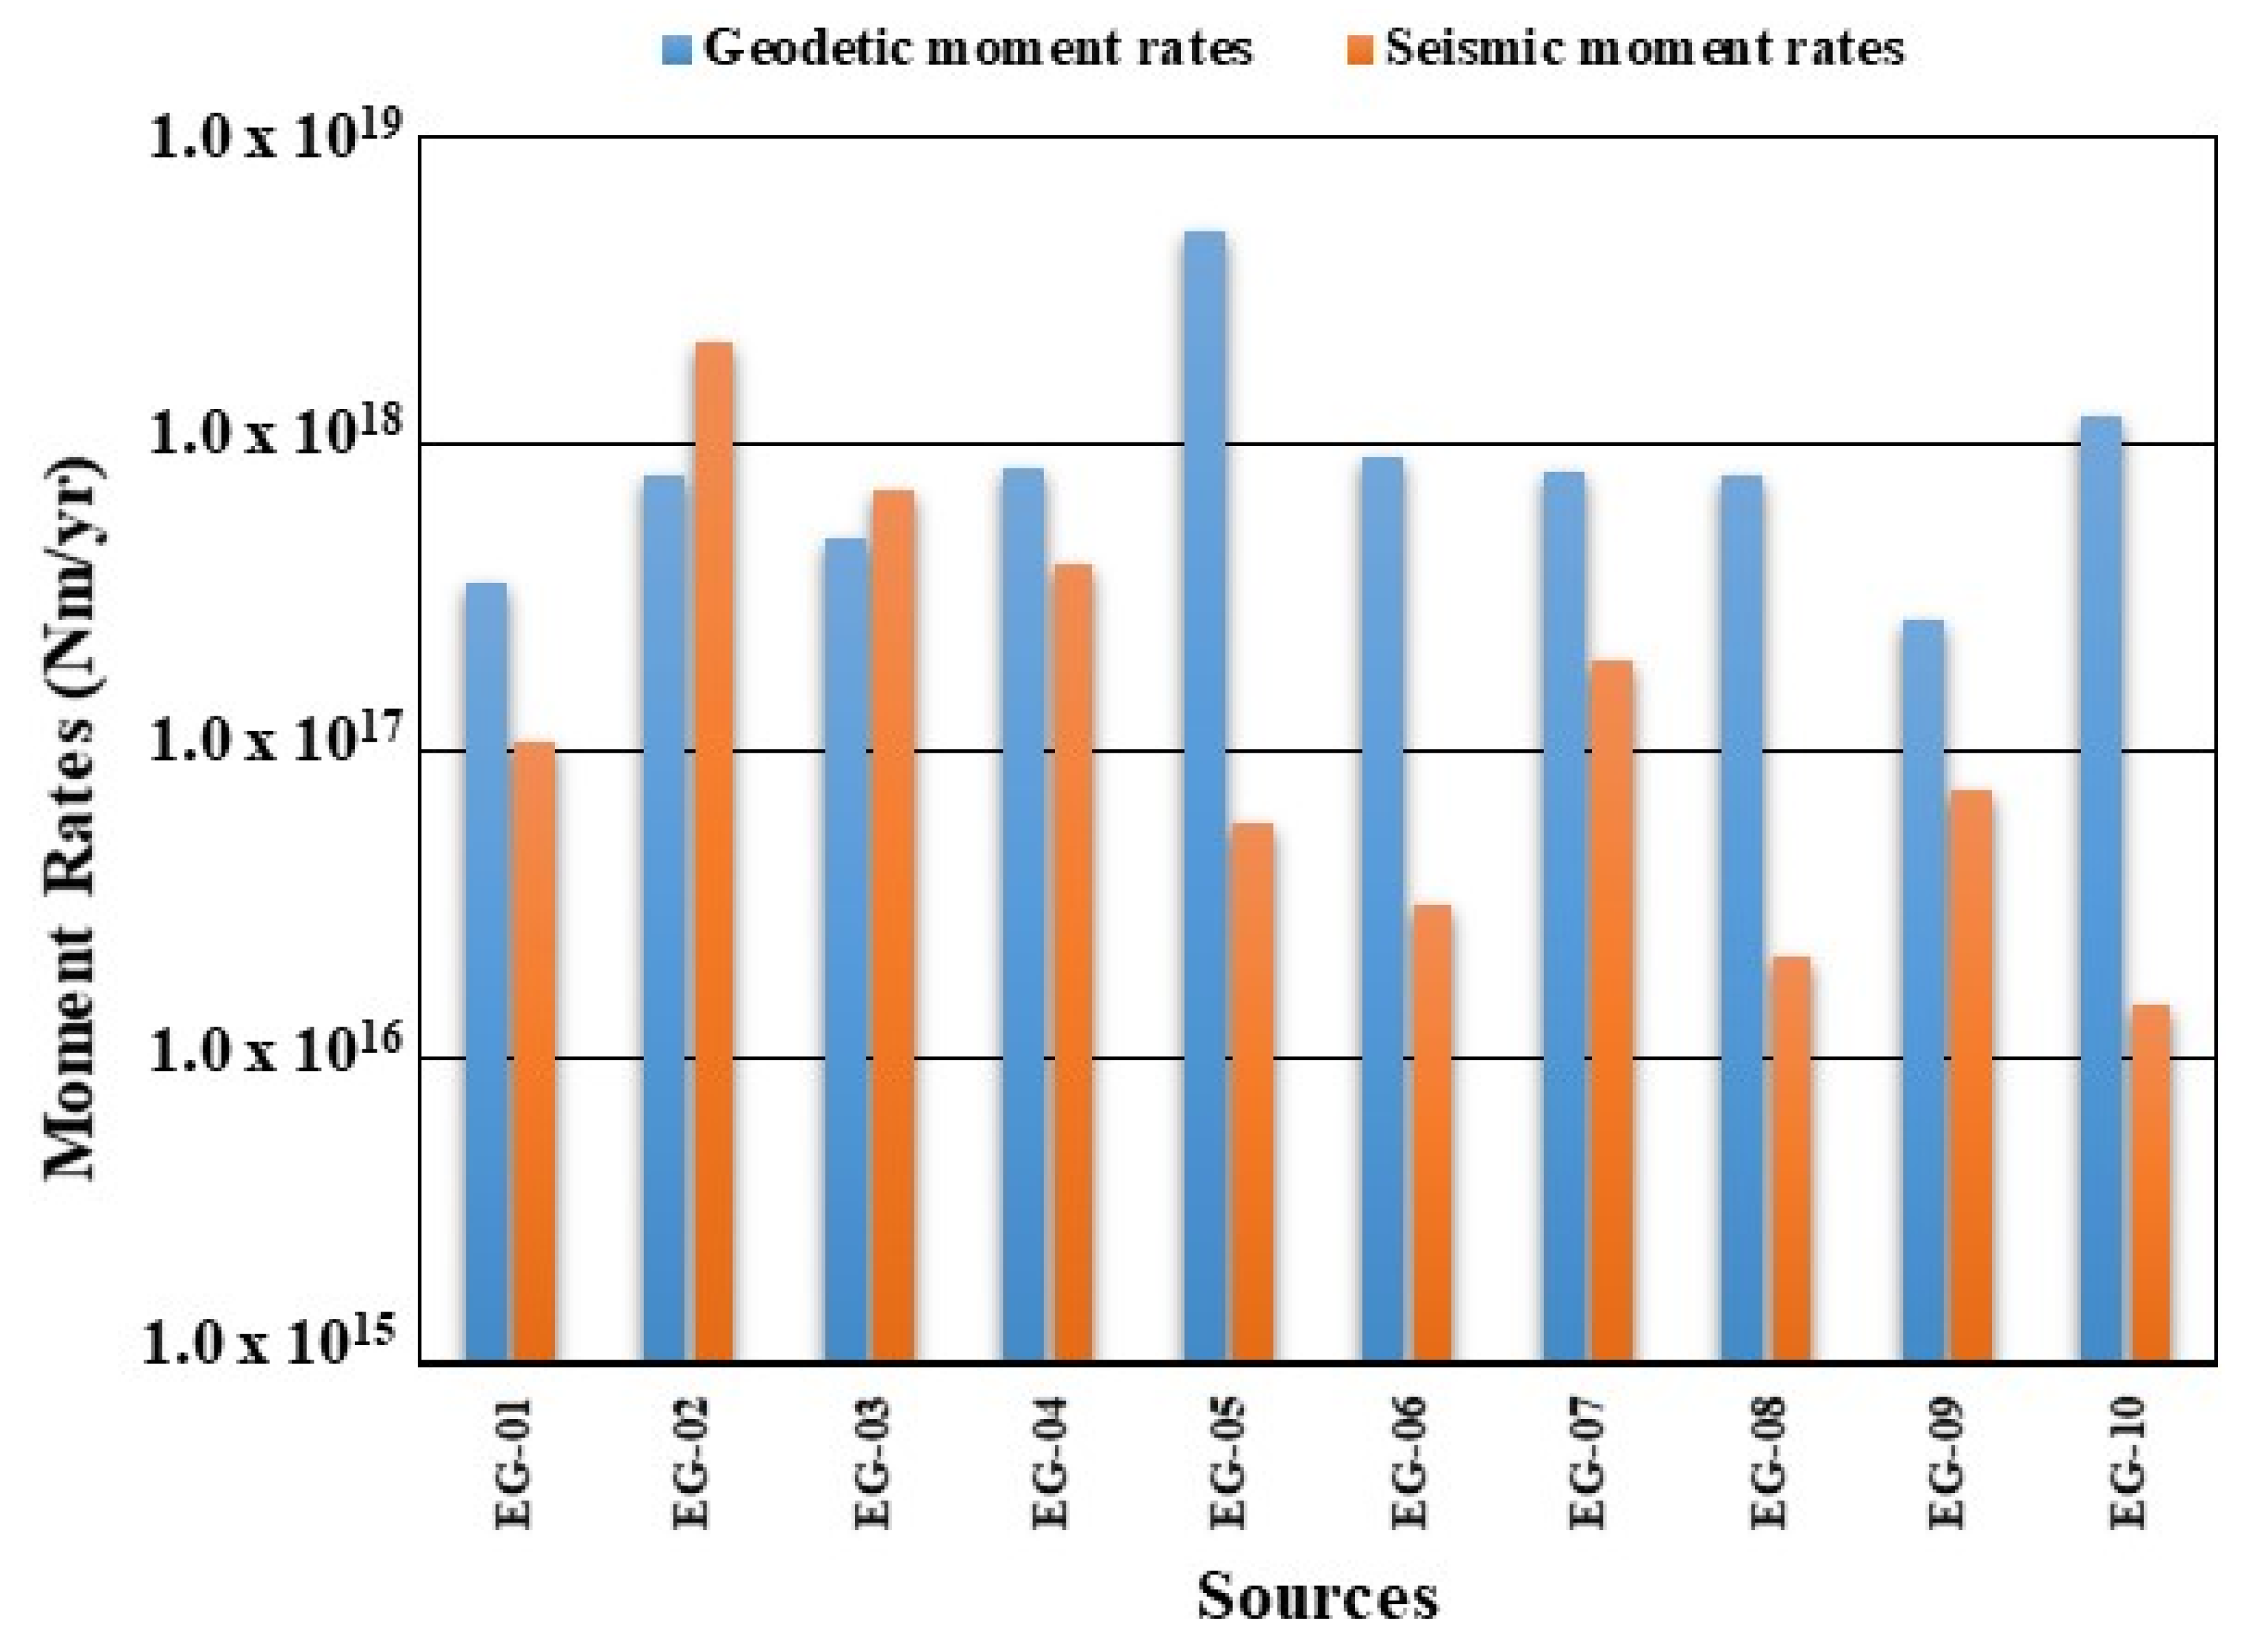
9. Seismic-Geodetic Moment-Rates Ratio
10. Summary and Conclusions
Author Contributions
Funding
Institutional Review Board Statement
Informed Consent Statement
Data Availability Statement
Acknowledgments
Conflicts of Interest
References
- Ward, S.N. On the consistency of earthquake moment rates, geological fault data, and space geodetic strain: The United States. Geophys. J. Int. 1998, 134, 172–186. [Google Scholar] [CrossRef] [Green Version]
- Blewitt, G.; Lavallée, D. Effect of annual signals on geodetic velocity. J. Geophys. Res. Solid Earth 2002, 107, ETG 9-1–ETG 9-11. [Google Scholar] [CrossRef] [Green Version]
- Palano, M.; Imprescia, P.; Agnon, A.; Gresta, S. An improved evaluation of the seismic/geodetic deformation-rate ratio for the Zagros Fold-and-Thrust collisional belt. Geophys. J. Int. 2018, 213, 194–209. [Google Scholar] [CrossRef]
- Palano, M.; Cannavò, F.; Ferranti, L.; Mattia, M.; Mazzella, M.E. Strain and stress fields in the Southern Apennines (Italy) constrained by geodetic, seismological and borehole data. Geophys. J. Int. 2011, 187, 1270–1282. [Google Scholar] [CrossRef] [Green Version]
- Ferranti, L.; Palano, M.; Cannavò, F.; Mazzella, M.E.; Oldow, J.S.; Gueguen, E.; Mattia, M.; Monaco, C. Rates of geodetic deformation across active faults in southern Italy. Tectonophysics 2014, 621, 101–122. [Google Scholar] [CrossRef]
- Sparacino, F.; Palano, M.; Peláez, J.A.; Fernández, J. Geodetic deformation versus seismic crustal moment-rates: Insights from the Ibero-Maghrebian region. Remote Sens. 2020, 12, 952. [Google Scholar] [CrossRef] [Green Version]
- Masson, F.; Chéry, J.; Hatzfeld, D.; Martinod, J.; Vernant, P.; Tavakoli, F.; Ghafory-Ashtiani, M. Seismic versus aseismic deformation in Iran inferred from earthquakes and geodetic data. Geophys. J. Int. 2005, 160, 217–226. [Google Scholar] [CrossRef]
- Bilham, R.; Ambraseys, N. Apparent Himalayan slip deficit from the summation of seismic moments for Himalayan earthquakes, 1500–2000. Curr. Sci. 2005, 88, 1658–1663. [Google Scholar]
- Pancha, A.; Anderson, J.G.; Kreemer, C. Comparison of seismic and geodetic scalar moment rates across the Basin and Range province. Bull. Seismol. Soc. Am. 2006, 96, 11–32. [Google Scholar] [CrossRef] [Green Version]
- Rontogianni, S. Comparison of geodetic and seismic strain rates in Greece by using a uniform processing approach to campaign GPS measurements over the interval 1994–2000. J. Geodyn. 2010, 50, 381–399. [Google Scholar] [CrossRef] [Green Version]
- Mazzotti, S.; Leonard, L.J.; Cassidy, J.F.; Rogers, G.C.; Halchuk, S. Seismic hazard in western Canada from GPS strain rates versus earthquake catalog. J. Geophys. Res. Solid Earth 2011, 116. [Google Scholar] [CrossRef]
- Palano, M.; Imprescia, P.; Gresta, S. Current stress and strain-rate fields across the Dead Sea Fault System: Constraints from seismological data and GPS observations. Earth Planet. Sci. Lett. 2013, 369–370, 305–316. [Google Scholar] [CrossRef]
- Chousianitis, K.; Ganas, A.; Evangelidis, C.P. Strain and rotation rate patterns of mainland Greece from continuous GPS data and comparison between seismic and geodetic moment release. J. Geophys. Res. Solid Earth 2015, 120, 3909–3931. [Google Scholar] [CrossRef]
- Bos, A.G.; Spakman, W. Kinematics of the southwestern U.S. deformation zone inferred from GPS motion data. J. Geophys. Res. Solid Earth 2005, 110, 1–16. [Google Scholar] [CrossRef] [Green Version]
- D’Agostino, N. Complete seismic release of tectonic strain and earthquake recurrence in the Apennines (Italy). Geophys. Res. Lett. 2014, 41, 1155–1162. [Google Scholar] [CrossRef]
- Stevens, V.L.; Avouac, J.P. Millenary Mw > 9.0 earthquakes required by geodetic strain in the Himalaya. Geophys. Res. Lett. 2016, 43, 1118–1123. [Google Scholar] [CrossRef] [Green Version]
- Gutenberg, B.; Richter, C.F. Seismicity of the Earth; Princeton University Press: Princeton, NJ, USA, 1954. [Google Scholar]
- Youngs, R.R.; Coppersmith, K.J. Implications of fault slip rates and earthquake recurrence models to probabilistic seismic hazard estimates. Int. J. Rock Mech. Min. Sci. Geomech. Abstr. 1986, 23, 125. [Google Scholar] [CrossRef]
- Savage, J.C.; Simpson, R. Surface strain accumulation and the seismic moment tensor. Bull. Seismol. Soc. Am. 1997, 87, 1345–1353. [Google Scholar]
- Zolfaghari, M.R. Geodetic deformation vs. seismic strain deduced by historical earthquakes across the Alborz Mountains. J. Seismol. 2009, 13, 647–663. [Google Scholar] [CrossRef]
- McKenzie, D. Active Tectonics of the Mediterranean Region. Geophys. J. Int. 1972, 30, 109–185. [Google Scholar] [CrossRef] [Green Version]
- Ben-Menahem, A.; Nur, A.; Vered, M. Tectonics, seismicity and structure of the Afro-Eurasian junction—The breaking of an incoherent plate. Phys. Earth Planet. Inter. 1976, 12, 1–50. [Google Scholar] [CrossRef]
- Ben-Avraham, Z.; Nur, A.; Giuseppe, C. Active transcurrent fault system along the North African passive margin. Tectonophysics 1987, 141, 249–260. [Google Scholar] [CrossRef]
- WCC-Woodward Clyde Consultants. Earthquake Activity and Stability Evaluation for the Aswan High Dam; Submitted to Aswan High Dam Authority; Ministry of Irrigation: Aswan, Egypt, 1985. [Google Scholar]
- Kebeasy, R. Seismicity. In The Geology of Egypt; A.A. Balkerma: Rotterdam, The Netherlands, 1990; pp. 51–59. [Google Scholar]
- DeMets, C.; Gordon, R.G.; Argus, D.F. Geologically current plate motions. Geophys. J. Int. 2010, 181, 1–80. [Google Scholar] [CrossRef] [Green Version]
- Coleman, R.G. Geologic background of the Red Sea. In The Geology of Continental Margins; Springer: Berlin/Heidelberg, Germany, 1974; pp. 743–751. [Google Scholar]
- Hempton, M.R. Constraints on Arabian Plate motion and extensional history of the Red Sea. Tectonics 1987, 6, 687–705. [Google Scholar] [CrossRef]
- Bosworth, W.; Mcclay, K. Structural and stratigraphic evolution of the Gulf of Suez Rift, Egypt: A synthesis. In Peri-Tethys Memoir 6: Peri-Tethyan Rift/Wrench Basins and Passive Margins; Ziegler, P.A., Cavazza, W., Robertson, A.H.F., Crasquin-Soleau, S., Eds.; French National Museum of Natural History: Paris, France, 2001; pp. 567–606. ISBN 2-85653-528-3. [Google Scholar]
- Schlumberger. Geology of Egypt. In Well Evaluation Conference; Schlumberger: Cairo, Egypt, 1984. [Google Scholar]
- Freund, R.; Garfunkel, Z.; Zak, I. The Shear along the Dead Sea Rift. Philos. Trans. R. Soc. Lond. 1970, 267, 107–130. [Google Scholar]
- Salamon, A.; Hofstetter, A.; Garfunkel, Z.; Ron, H. Seismotectonics of the Sinai subplate—The eastern Mediterranean region. Geophys. J. Int. 2003, 155, 149–173. [Google Scholar] [CrossRef] [Green Version]
- Bartov, Y.; Steinitz, G.; Eyal, M.; Eyal, Y. Sinistral movement along the Gulf of Aqaba—Its age and relation to the opening of the Red Sea. Nature 1980, 285, 220–222. [Google Scholar] [CrossRef]
- Joffe, S.; Garfunkel, Z. Plate kinematics of the circum Red Sea—A re-evaluation. Tectonophysics 1987, 141, 5–22. [Google Scholar] [CrossRef]
- Sneh, A. The Dead Sea Rift: Lateral displacement and downfaulting phases. Tectonophysics 1996, 263, 277–292. [Google Scholar] [CrossRef]
- Marco, S.; Agnon, A.; Ellenblum, R.; Eidelman, A.; Basson, U.; Boas, A. 817-Year-old walls offset sinistrally 2.1 m by the Dead Sea transform, Israel. J. Geodyn. 1997, 24, 11–20. [Google Scholar] [CrossRef]
- Garfunkel, Z.; Zak, I.; Freund, R. Active faulting in the dead sea rift. Tectonophysics 1981, 80, 1–26. [Google Scholar] [CrossRef]
- Zilberman, E.; Amit, R.; Heimann, A.; Porat, N. Changes in Holocene Paleoseismic activity in the Hula pull-apart basin, Dead Sea Rift, northern Israel. Tectonophysics 2000, 321, 237–252. [Google Scholar] [CrossRef]
- Amit, R.; Zilberman, E.; Porat, N.; Enzel, Y. Relief Inversion in the Avrona Playa as Evidence of Large-Magnitude Historical Earthquakes, Southern Arava Valley, Dead Sea Rift. Quat. Res. 1999, 52, 76–91. [Google Scholar] [CrossRef]
- Klinger, Y.; Avouac, J.P.; Abou Karaki, N.; Dorbath, L.; Bourles, D.; Reyss, J.L. Slip rate on the Dead Sea transform fault in northern Araba valley (Jordan). Geophys. J. Int. 2000, 142, 755–768. [Google Scholar] [CrossRef] [Green Version]
- Gomez, F.; Meghraoui, M.; Darkal, A.N.; Hijazi, F.; Mouty, M.; Suleiman, Y.; Sbeinati, R.; Darawcheh, R.; Al-Ghazzi, R.; Barazangi, M. Holocene faulting and earthquake recurrence along the Serghaya branch of the Dead Sea fault system in Syria and Lebanon. Geophys. J. Int. 2003, 153, 658–674. [Google Scholar] [CrossRef] [Green Version]
- Sawires, R.; Peláez, J.A.; Fat-Helbary, R.E.; Panzera, F.; Ibrahim, H.A.; Hamdache, M. Probabilistic Seismic Hazard Deaggregation for Selected Egyptian Cities. Pure Appl. Geophys. 2017, 174, 1581–1600. [Google Scholar] [CrossRef]
- Kamel, H.; Eita, T.; Sarhan, M. Nile delta hydrocarbon potentiality. In Proceedings of the 14th Egyptian General Petroleum Corporation Exploration and Production Conference, Cairo, Egypt, 15–18 October 1998. [Google Scholar]
- Meshref, W. Tectonic framework. In The Geology of Egypt; Said, R., Ed.; A.A. Balkerma: Rotterdam, The Netherlands, 1990; pp. 113–155. [Google Scholar]
- Younes, A.I.; McClay, K. Development of accommodation zones in the Gulf of Suez-Red Sea Rift, Egypt. Am. Assoc. Pet. Geol. Bull. 2002, 86, 1003–1026. [Google Scholar]
- Heidbach, O.; Ben-Avraham, Z. Stress evolution and seismic hazard of the Dead Sea Fault System. Earth Planet. Sci. Lett. 2007, 257, 299–312. [Google Scholar] [CrossRef] [Green Version]
- Sawires, R.; Peláez, J.A.; Fat-helbary, R.E.; Ibrahim, H.A. An earthquake catalogue (2200 B.C. to 2013) for seismotectonic and Seismic Hazard Assessment Studies in Egypt. In Earthquakes and Their Impact on Society; D’Amico, S., Ed.; Springer International Publishing: Cham, Switzerland, 2016; pp. 97–136. ISBN 9783319217536. [Google Scholar]
- Abd El–Aal, A.E.-A.K.; AbdelHafiez, H.E.; Saadalla, H.; Soliman, M.S. A homogenous moment magnitude and local magnitude scaling relation for earthquakes in Egypt. NRIAG J. Astron. Geophys. 2020, 9, 532–538. [Google Scholar] [CrossRef]
- Ataeva, G.; Shapira, A.; Hofstetter, A. Determination of source parameters for local and regional earthquakes in Israel. J. Seismol. 2015, 19, 389–401. [Google Scholar] [CrossRef]
- Deif, A.; Al-Shijbi, Y.; El-Hussain, I.; Ezzelarab, M.; Mohamed, A.M.E. Compiling an earthquake catalogue for the Arabian Plate, Western Asia. J. Asian Earth Sci. 2017, 147, 345–357. [Google Scholar] [CrossRef]
- Sawires, R.; Peláez, J.A.J.A.; AlHamaydeh, M.; Henares, J. A state-of-the-art seismic source model for the United Arab Emirates. J. Asian Earth Sci. 2019, 186, 104063. [Google Scholar] [CrossRef]
- Gardner, J.K.; Knopoff, L. Is the sequence of earthquakes in Southern California, with aftershocks removed, Poissonian? Bull. Seismol. Soc. Am. 1974, 64, 1363–1367. [Google Scholar]
- Sawires, R.; Santoyo, M.A.; Peláez, J.A.; Corona Fernández, R.D. An updated and unified earthquake catalog from 1787 to 2018 for seismic hazard assessment studies in Mexico. Sci. Data 2019, 6, 241. [Google Scholar] [CrossRef] [Green Version]
- AbdelHafiez, H.E.; Tawfiek, A. A review of the Egyptian National Seismological Network after 20 years of operation. NRIAG J. Astron. Geophys. 2020, 9, 330–340. [Google Scholar] [CrossRef] [Green Version]
- Moustafa, S.S.R.; Deif, A. A magnitude scale for Egyptian National Seismic Network (ENSN). NRIAG J. Geophys. 2009, 32, 633–651. [Google Scholar]
- Poirier, J.P.; Taher, M.A. Historical seismicity in the near and Middle East, North Africa, and Spain from Arabic documents (VIIth-XVIIIth century). Bull. Seismol. Soc. Am. 1980, 70, 2185–2201. [Google Scholar] [CrossRef]
- Maamoun, M.; Allam, A.; Megahed, A. Seismicity of Egypt. Bull. Helwan Inst. Astron. Geophys. 1984, 4, 109–160. [Google Scholar]
- Ambraseys, N.N.; Melville, C.P.; Adams, R.D. The Seismicity of Egypt, Arabia and the Red Sea: A Historical Review; Cambridge University Press: New York, NY, USA, 1994. [Google Scholar]
- Badawy, A. Historical seismicity of Egypt. Acta Geod. Geophys. Hung. 1999, 34, 119–135. [Google Scholar] [CrossRef]
- Rashwan, M.; Sawires, R.; Radwan, A.M.; Sparacino, F.; Peláez, J.A.; Palano, M. Crustal Strain and Stress Fields in Egypt from Geodetic and Seismological Data. Remote Sens. 2021, 13, 1398. [Google Scholar] [CrossRef]
- EGSA Egyptian Geological Survey Authority. Geological Map of Egypt; Egyptian Geological Survey: Cairo, Egypt, 1981. [Google Scholar]
- Garfunkel, Z. Internal structure of the Dead Sea leaky transform (rift) in relation to plate kinematics. Tectonophysics 1981, 80, 81–108. [Google Scholar] [CrossRef]
- Girdler, R.W. The Dead Sea transform fault system. Tectonophysics 1990, 180, 1–13. [Google Scholar] [CrossRef]
- Mahmoud, Y.; Masson, F.; Meghraoui, M.; Cakir, Z.; Alchalbi, A.; Yavasoglu, H.; Yönlü, O.; Daoud, M.; Ergintav, S.; Inan, S. Kinematic study at the junction of the East Anatolian fault and the Dead Sea fault from GPS measurements. J. Geodyn. 2013, 67, 30–39. [Google Scholar] [CrossRef]
- Eyal, M.; Eyal, Y.; Bartov, Y.; Steinitz, G. The tectonic development of the western margin of the Gulf of Elat (Aqaba) rift. Tectonophysics 1981, 80, 39–66. [Google Scholar] [CrossRef]
- Abdel-Fattah, A.K.; Hussein, H.M.; Ibrahim, E.M.; El Atta, A.S.A. Fault plane solutions of the 1993 and 1995 Gulf of Aqaba earthquakes and their tectonic implications. Ann. Geophys. 1997, 40. [Google Scholar] [CrossRef]
- Pinar, A.; Türkelli, N. Source inversion of the 1993 and 1995 Gulf of Aqaba earthquakes. Tectonophysics 1997, 283, 279–288. [Google Scholar] [CrossRef]
- Hofstetter, A.; Thio, H.K.; Shamir, G. Source mechanism of the 22/11/1995 Gulf of Aqaba earthquake and its aftershock sequence. J. Seismol. 2003, 7, 99–114. [Google Scholar] [CrossRef]
- Hussein, H.M.; Abou Elenean, K.M.; Marzouk, I.A.; Korrat, I.M.; Abu El-Nader, I.F.; Ghazala, H.; ElGabry, M.N. Present-day tectonic stress regime in Egypt and surrounding area based on inversion of earthquake focal mechanisms. J. Afr. Earth Sci. 2013, 81, 1–15. [Google Scholar] [CrossRef]
- Shapira, A.; Jarradat, M. Earthquake Risk and Loss Assessment in Aqaba and Eilat Regions; Submitted to the U.S. Aid-Merc Program; 1995; Available online: https://scholar.google.com/scholar?hl=en&as_sdt=0%2C5&q=Earthquake+Risk+and+Loss+Assessment+in+Aqaba+and+Eilat+Regions+1995&btnG= (accessed on 23 August 2021).
- Reches, Z.; Hoexter, D.F. Holocene seismic and tectonic activity in the Dead Sea area. Tectonophysics 1981, 80, 235–254. [Google Scholar] [CrossRef]
- Heimann, A. The Development of the Dead Sea Rift and Its Margins in Northern Israel in the Pliocene and Pleistocene; The Hebrew University of Jerusalem: Jerusalem, Israel, 1990. [Google Scholar]
- Gardosh, M.; Reches, Z.; Garfunkel, Z. Holocene tectonic deformation along the western margins of the Dead Sea. Tectonophysics 1990, 180, 123–137. [Google Scholar] [CrossRef]
- Steinitz, G.; Bartov, Y.; Hunziker, J.C. K-Ar age determinations of some Miocene–Pliocene basalts in Israel: Their significance to the tectonics of the Rift Valley. Geol. Mag. 1978, 115, 329–340. [Google Scholar] [CrossRef] [Green Version]
- Cochran, J.R.; Martinez, F.; Steckler, M.S.; Hobart, M.A. Conrad deep: A new northern Red Sea deep. Earth Planet. Sci. Lett. 1986, 78, 18–32. [Google Scholar] [CrossRef]
- Roeser, H.A. A detailed magnetic survey of the Southern Red Sea—Hans Albert Roeser—Google Books. Geol. Jahrb. 1975, 13, 131–153. [Google Scholar]
- Makris, J.; Rihm, R. Shear-controlled evolution of the Red Sea: Pull apart model. Tectonophysics 1991, 198, 441–466. [Google Scholar] [CrossRef]
- Searle, R.C.; Ross, D.A. A Geophysical Study of the Red Sea Axial Trough between 20*5 and 22 N. Geophys. J. Int. 1975, 43, 555–572. [Google Scholar] [CrossRef] [Green Version]
- McKenzie, D.P.; Davies, D.; Molnar, P. Plate Tectonics of the Red Sea and East Africa. Nature 1970, 226, 243–248. [Google Scholar] [CrossRef]
- Bosworth, W.; Taviani, M. Late Quaternary reorientation of stress field and extension direction in the southern Gulf of Suez, Egypt: Evidence from uplifted coral terraces, mesoscopic fault arrays, and borehole breakouts. Tectonics 1996, 15, 791–802. [Google Scholar] [CrossRef]
- Moustafa, A.R. Internal structure and deformation of an accommodation zone in the northern part of the Suez rift. J. Struct. Geol. 1996, 18, 93–107. [Google Scholar] [CrossRef]
- Lyberis, N. Tectonic evolution of the Gulf of Suez and the Gulf of Aqaba. Tectonophysics 1988, 153, 209–220. [Google Scholar] [CrossRef]
- Bosworth, W. A high-strain rift model for the southern Gulf of Suez (Egypt). Geol. Soc. Spec. Publ. 1995, 80, 75–102. [Google Scholar] [CrossRef]
- Chorowicz, J.; Sorlien, C. Oblique extensional tectonics in the Malawi Rift, Africa. Geol. Soc. Am. Bull. 1992, 104, 1015–1023. [Google Scholar] [CrossRef]
- Daggett, P.H.; Morgan, P.; Boulos, F.K.; Hennin, S.F.; El-Sherif, A.A.; El-Sayed, A.A.; Basta, N.Z.; Melek, Y.S. Seismicity and active tectonics of the Egyptian Red Sea margin and the northern Red Sea. Tectonophysics 1986, 125, 313–324. [Google Scholar] [CrossRef]
- Hurukawa, N.; Seto, N.; Inoue, H.; Nishigami, K.; Marzouk, I.; Megahed, A.; Ibrahim, E.M.; Murakami, H.; Nakamura, M.; Haneda, T.; et al. Seismological Observations in and around the Southern Part of the Gulf of Suez, Egypt. Bull. Seismol. Soc. Am. 2001, 1994, 708–717. [Google Scholar] [CrossRef]
- Abdel-fattah, A.K. An approach to investigate earthquake source processes. Acta Geol. Pol. 2003, 51, 257–269. [Google Scholar]
- Gergawi, A.; El-Khashab, A. Seismicity of U.A.R. Bull. Helwan Inst. Astron. Geophys. 1986, 76. [Google Scholar]
- Fairhead, J.D.; Girdler, R.W. The seismicity of the Red Sea, Gulf of Aden and Afar Triangle. Philos. Trans. R. Soc. Lond. 1970, 267, 49–74. [Google Scholar] [CrossRef]
- Maamoun, M.; El-Khashab, H.M. Seismic studies of the Shedwan (Red Sea) earthquake. Bull. Helwan Inst. Astron. Geophys. 1978, 171, 22–46. [Google Scholar]
- Jackson, J.; McKenzie, D. Active tectonics of the Alpine–Himalayan Belt between western Turkey and Pakistan. Geophys. J. R. Astron. Soc. 1984, 77, 185–264. [Google Scholar] [CrossRef]
- Abou Elenean, K.M. Focal Mechanisms of Small and Moderate Size Earthquakes Recorded by the Egyptian National Seismic Network (ENSN), Egypt. NRIAG J. Geophys. 2007, 6, 117–151. [Google Scholar]
- Sandford, K.S. Paleolithic man and the Nile Valley in Upper and Middle Egypt. Chic. Univ. Orient. Inst. Publ. 1934, 18, 1–131. [Google Scholar]
- Said, R. The Geology of Egypt; Elservier: New York, NY, USA, 1962. [Google Scholar]
- Issawi, B. Geology of the South Western Desert of Egypt. Ann. Geol. Surv. Egypt 1981, 2, 57–66. [Google Scholar]
- Philobbos, E.R.; Riad, S.; Omran, A.A.; Othman, A.B. Stages of fracture development controlling the evolution of the Nile Valley in Egypt. Egypt J. Geol. 2000, 44, 503–532. [Google Scholar]
- Said, R. The Geological Evolution of the River Nile; Springer: New York, NY, USA, 1981. [Google Scholar]
- Abdel Aal, A.; El-Barkooky, A.; Gerrites, M.; Meyer, H.; Schwander, M.; Zaki, H. Tectonic evolution of the Eastern Mediterranean Basin and its significance for hydrocarbon productivity in the ultra-deep water of the Nile Delta. In Proceedings of the Mediterranean Offshore Conference, Alexandria, Egypt, 15–17 October 2000. [Google Scholar]
- Maamoun, M.; Ibrahim, E.M. Tectonic activity in Egypt as indicated by earthquakes. Bull. Helwan Inst. Astron. Geophys. 1978, 170, 1–13. [Google Scholar]
- Abdel-Rahman, M.A.; El-Etr, H.A. The orientational characteristics of the structure grain of the eastern desert of Egypt. In Proceedings of the Symposium of the Evolution and Mineralization of the Arabian-Nubian Shield, Jeddah, Saudi Arabia, 3–5 February 1978. [Google Scholar]
- Abou Elenean, K.M. Seismotectonics of Egypt in Relation to the Mediterranean and Red Sea Tectonics. Ph.D. Thesis, Ain Shams University, Cairo, Egypt, 1997. [Google Scholar]
- Khan, P.K.; Ghosh, M.; Chakraborty, P.P.; Mukherjee, D. Seismic b-Value and the Assessment of Ambient Stress in Northeast India. Pure Appl. Geophys. 2011, 168, 1693–1706. [Google Scholar] [CrossRef] [Green Version]
- Pelaez, J.A.; Hamdache, M.; Sanz de Galdeano, C.; Sawires, R.; Garcia Hernandez, M.T. Forecasting moderate earthquakes in Northern Algeria and Morocco. In Earthquakes and Their Impact on Society; D’Amico, S., Ed.; Springer International Publishing: Cham, Switzerland, 2016; pp. 81–95. ISBN 9783319217536. [Google Scholar]
- Weichert, D.H. Estimation of the earthquake recurrence parameters for unequal observation periods for different magnitudes. Bull. Seismol. Soc. Am. 1980, 70, 1337–1346. [Google Scholar] [CrossRef]
- Robson, D.S.; Whitlock, J.H. Estimation of a truncation point. Biometrika 1964, 51, 33–39. [Google Scholar] [CrossRef]
- Cooke, P. Statistical inference for bounds of random variables. Biometrika 1979, 66, 367–374. [Google Scholar] [CrossRef]
- Kijko, A.; Singh, M. Statistical Tools for Maximum Possible Earthquake Magnitude Estimation. Acta Geophys. 2011, 59, 674–700. [Google Scholar] [CrossRef] [Green Version]
- Sawires, R.; Peláez, J.A.; Ibrahim, H.A.; Fat-Helbary, R.E.; Henares, J.; Hamdache, M. Delineation and characterization of a new seismic source model for seismic hazard studies in Egypt. Nat. Hazards 2016, 80, 1823–1864. [Google Scholar] [CrossRef]
- Hanks, T.C.; Kanamori, H. A moment magnitude scale. J. Geophys. Res. 1979, 84, 2348. [Google Scholar] [CrossRef]
- Hyndman, R.D.; Weichert, D.H. Seismicity and rates of relative motion on the plate boundaries of Western North America. Geophys. J. Int. 1983, 72, 59–82. [Google Scholar] [CrossRef] [Green Version]
- Sasajima, R.; Shibazaki, B.; Iwamori, H.; Nishimura, T.; Nakai, Y. Mechanism of subsidence of the Northeast Japan forearc during the late period of a gigantic earthquake cycle. Sci. Rep. 2019, 9, 5726. [Google Scholar] [CrossRef] [PubMed] [Green Version]
- Hussain, E.; Wright, T.J.; Walters, R.J.; Bekaert, D.P.S.; Lloyd, R.; Hooper, A. Constant strain accumulation rate between major earthquakes on the North Anatolian Fault. Nat. Commun. 2018, 9, 1392. [Google Scholar] [CrossRef] [PubMed]


| Magnitude | Completeness Period | Activity Rate (Events/Year) |
|---|---|---|
| Mw ≥ 3.0 | 1995–2012 | 111.0 |
| Mw ≥ 3.5 | 1990–2012 | 26.2 |
| Mw ≥ 4.0 | 1980–2020 | 11.0 |
| Mw ≥ 4.5 | 1980–2020 | 4.14 |
| Mw ≥ 5.0 | 1925–2020 | 0.909 (1 EQ by year) |
| Mw ≥ 5.5 | 1900–2020 | 0.249 (1 EQ every 4 years) |
| Mw ≥ 6.0 | 700–2020 | 0.0273 (1 EQ every 35–40 years) |
| Mw ≥ 6.5 | 700–2020 | 0.00956 (1 EQ every ~100 years) |
| Mw ≥ 7.0 | 240–2020 | 0.00417 (1 EQ every ~240 years) |
| Source | n (Mw ≥ 4.0) | mmax obs. | Date (yyyy/mm/dd) | D50 (km) | D90 (km) | λ (≥4.0) | b-Value | Δm (1) | mmax (2) | Seismic Moment-Rate (1016 N·m/yr) |
|---|---|---|---|---|---|---|---|---|---|---|
| EG-01 | 37 | Mw 6.1, mb 5.8 | 1993/08/03 | 6.0 | 18.0 | 1.05 ± 0.16 | 0.81 ± 0.11 | 3.5–6.1 | 6.50 ± 0.30 | 10.5 |
| EG-02 | 51 | Mw 7.2, mb 6.0 | 1995/11/22 | 11.0 | 23.0 | 3.46 ± 0.52 | 1.58 ± 0.11 (3) | 4.0–6.1 | 6.25 ± 0.56 | 213.0 |
| EG-03 | 96 | XI, Mw 7.7 | 746/--/-- | 11.0 | 22.5 | 1.04 ± 0.11 | 0.85 ± 0.02 | 3.5–7.7 | 7.85 ± 0.56 | 69.2 |
| EG-04 | 54 | XI, Mw 7.7 | 748/--/-- | 9.9 | 20.3 | 0.47 ± 0.06 | 0.81 ± 0.04 | 3.5–7.7 | 7.85 ± 0.56 | 40.0 |
| EG-05 | 37 | Mb 6.2, Mw 5.7 | 1955/11/12 | 12.0 | 23.0 | 2.09 ± 0.36 | 1.35 ± 0.11(3) | 4.0–5.7 | 5.85 ± 0.40 | 5.7 |
| EG-06 | 44 | Mw 5.5 | 2020/06/16 | 10.9 | 23.8 | 1.53 ± 0.20 | 1.25 ± 0.19 | 3.5–5.5 | 5.60 ± 0.07 | 3.1 |
| EG-07 | 68 | Mw 6.8, MS 6.6 | 1969/03/31 | 14.4 | 25.0 | 1.49 ± 0.20 | 0.98 ± 0.04 | 4.0–6.8 | 7.15 ± 0.26 | 19.5 |
| EG-08 | 34 | mb 6.5, Mw 6.4 | 1955/09/12 | 20.0 | 27.0 | 0.29 ± 0.05 | 0.92 ± 0.05 | 3.5–6.4 | 6.50 ± 0.39 | 2.1 |
| EG-09 | 97 | IX-X, Mw 6.7 | 1262/--/-- | 9.6 | 25.0 | 1.14 ± 0.13 | 1.05 ± 0.04 | 4.0–6.7 | 6.75 ± 0.54 | 7.4 |
| EG-10 | 27 | VIII, Mw 6.2 | 857/04/-- 1264/02/20 | 12.0 | 25.0 | 0.70 ± 0.14 | 1.05 ± 0.13 | 3.5–5.4 | 5.40 ± 0.54 | 2.2 |
| Source | Area (1010 km2) | D90 (km) | Maximum Strain (ns/yr) | Geodetic Moment-Rate (1016 N·m/yr) | SCC (%) |
|---|---|---|---|---|---|
| EG-01 | 1.65 | 18.0 | 19.8 ± 1.1 | 35.3 ± 1.96 | 29.8 |
| EG-02 | 3.89 | 23.0 | 14.4 ± 1.2 | 77.4 ± 6.45 | 275.3 |
| EG-03 | 4.20 | 22.5 | 8.6 ± 1.7 | 48.8 ± 9.65 | 141.8 |
| EG-04 | 5.24 | 20.3 | 12.8 ± 1.3 | 81.7 ± 8.30 | 49.0 |
| EG-05 | 9.16 | 23.0 | 39.0 ± 0.9 | 493.0 ± 11.4 | 1.2 |
| EG-06 | 2.37 | 23.8 | 26.2 ± 0.7 | 88.7 ± 2.37 | 3.5 |
| EG-07 | 3.13 | 25.0 | 17.2 ± 1.1 | 80.8 ± 5.17 | 24.1 |
| EG-08 | 6.97 | 27.0 | 7.0 ± 0.7 | 79.1 ± 7.91 | 2.6 |
| EG-09 | 4.10 | 25.0 | 4.3 ± 0.9 | 26.4 ± 5.53 | 27.8 |
| EG-10 | 8.45 | 25.0 | 9.7 ± 0.6 | 123.0 ± 7.60 | 1.8 |
Publisher’s Note: MDPI stays neutral with regard to jurisdictional claims in published maps and institutional affiliations. |
© 2021 by the authors. Licensee MDPI, Basel, Switzerland. This article is an open access article distributed under the terms and conditions of the Creative Commons Attribution (CC BY) license (https://creativecommons.org/licenses/by/4.0/).
Share and Cite
Sawires, R.; Peláez, J.A.; Sparacino, F.; Radwan, A.M.; Rashwan, M.; Palano, M. Seismic and Geodetic Crustal Moment-Rates Comparison: New Insights on the Seismic Hazard of Egypt. Appl. Sci. 2021, 11, 7836. https://doi.org/10.3390/app11177836
Sawires R, Peláez JA, Sparacino F, Radwan AM, Rashwan M, Palano M. Seismic and Geodetic Crustal Moment-Rates Comparison: New Insights on the Seismic Hazard of Egypt. Applied Sciences. 2021; 11(17):7836. https://doi.org/10.3390/app11177836
Chicago/Turabian StyleSawires, Rashad, José A. Peláez, Federica Sparacino, Ali M. Radwan, Mohamed Rashwan, and Mimmo Palano. 2021. "Seismic and Geodetic Crustal Moment-Rates Comparison: New Insights on the Seismic Hazard of Egypt" Applied Sciences 11, no. 17: 7836. https://doi.org/10.3390/app11177836
APA StyleSawires, R., Peláez, J. A., Sparacino, F., Radwan, A. M., Rashwan, M., & Palano, M. (2021). Seismic and Geodetic Crustal Moment-Rates Comparison: New Insights on the Seismic Hazard of Egypt. Applied Sciences, 11(17), 7836. https://doi.org/10.3390/app11177836