
Application of SPRi Biosensors for Determination of 20S Proteasome and UCH-L1 Levels in the Serum and Urine of Transitional Bladder Cancer Patients


Abstract
1. Introduction
2. Materials and Methods
2.1. Reagents
2.2. Patients
2.3. Preparation of Biological Samples
2.4. Procedure for Determination of Concentrations with SPRi Biosensors
2.4.1. Biosensor Preparation
2.4.2. SPRi Measurements
2.5. Statistical Analysis
3. Results
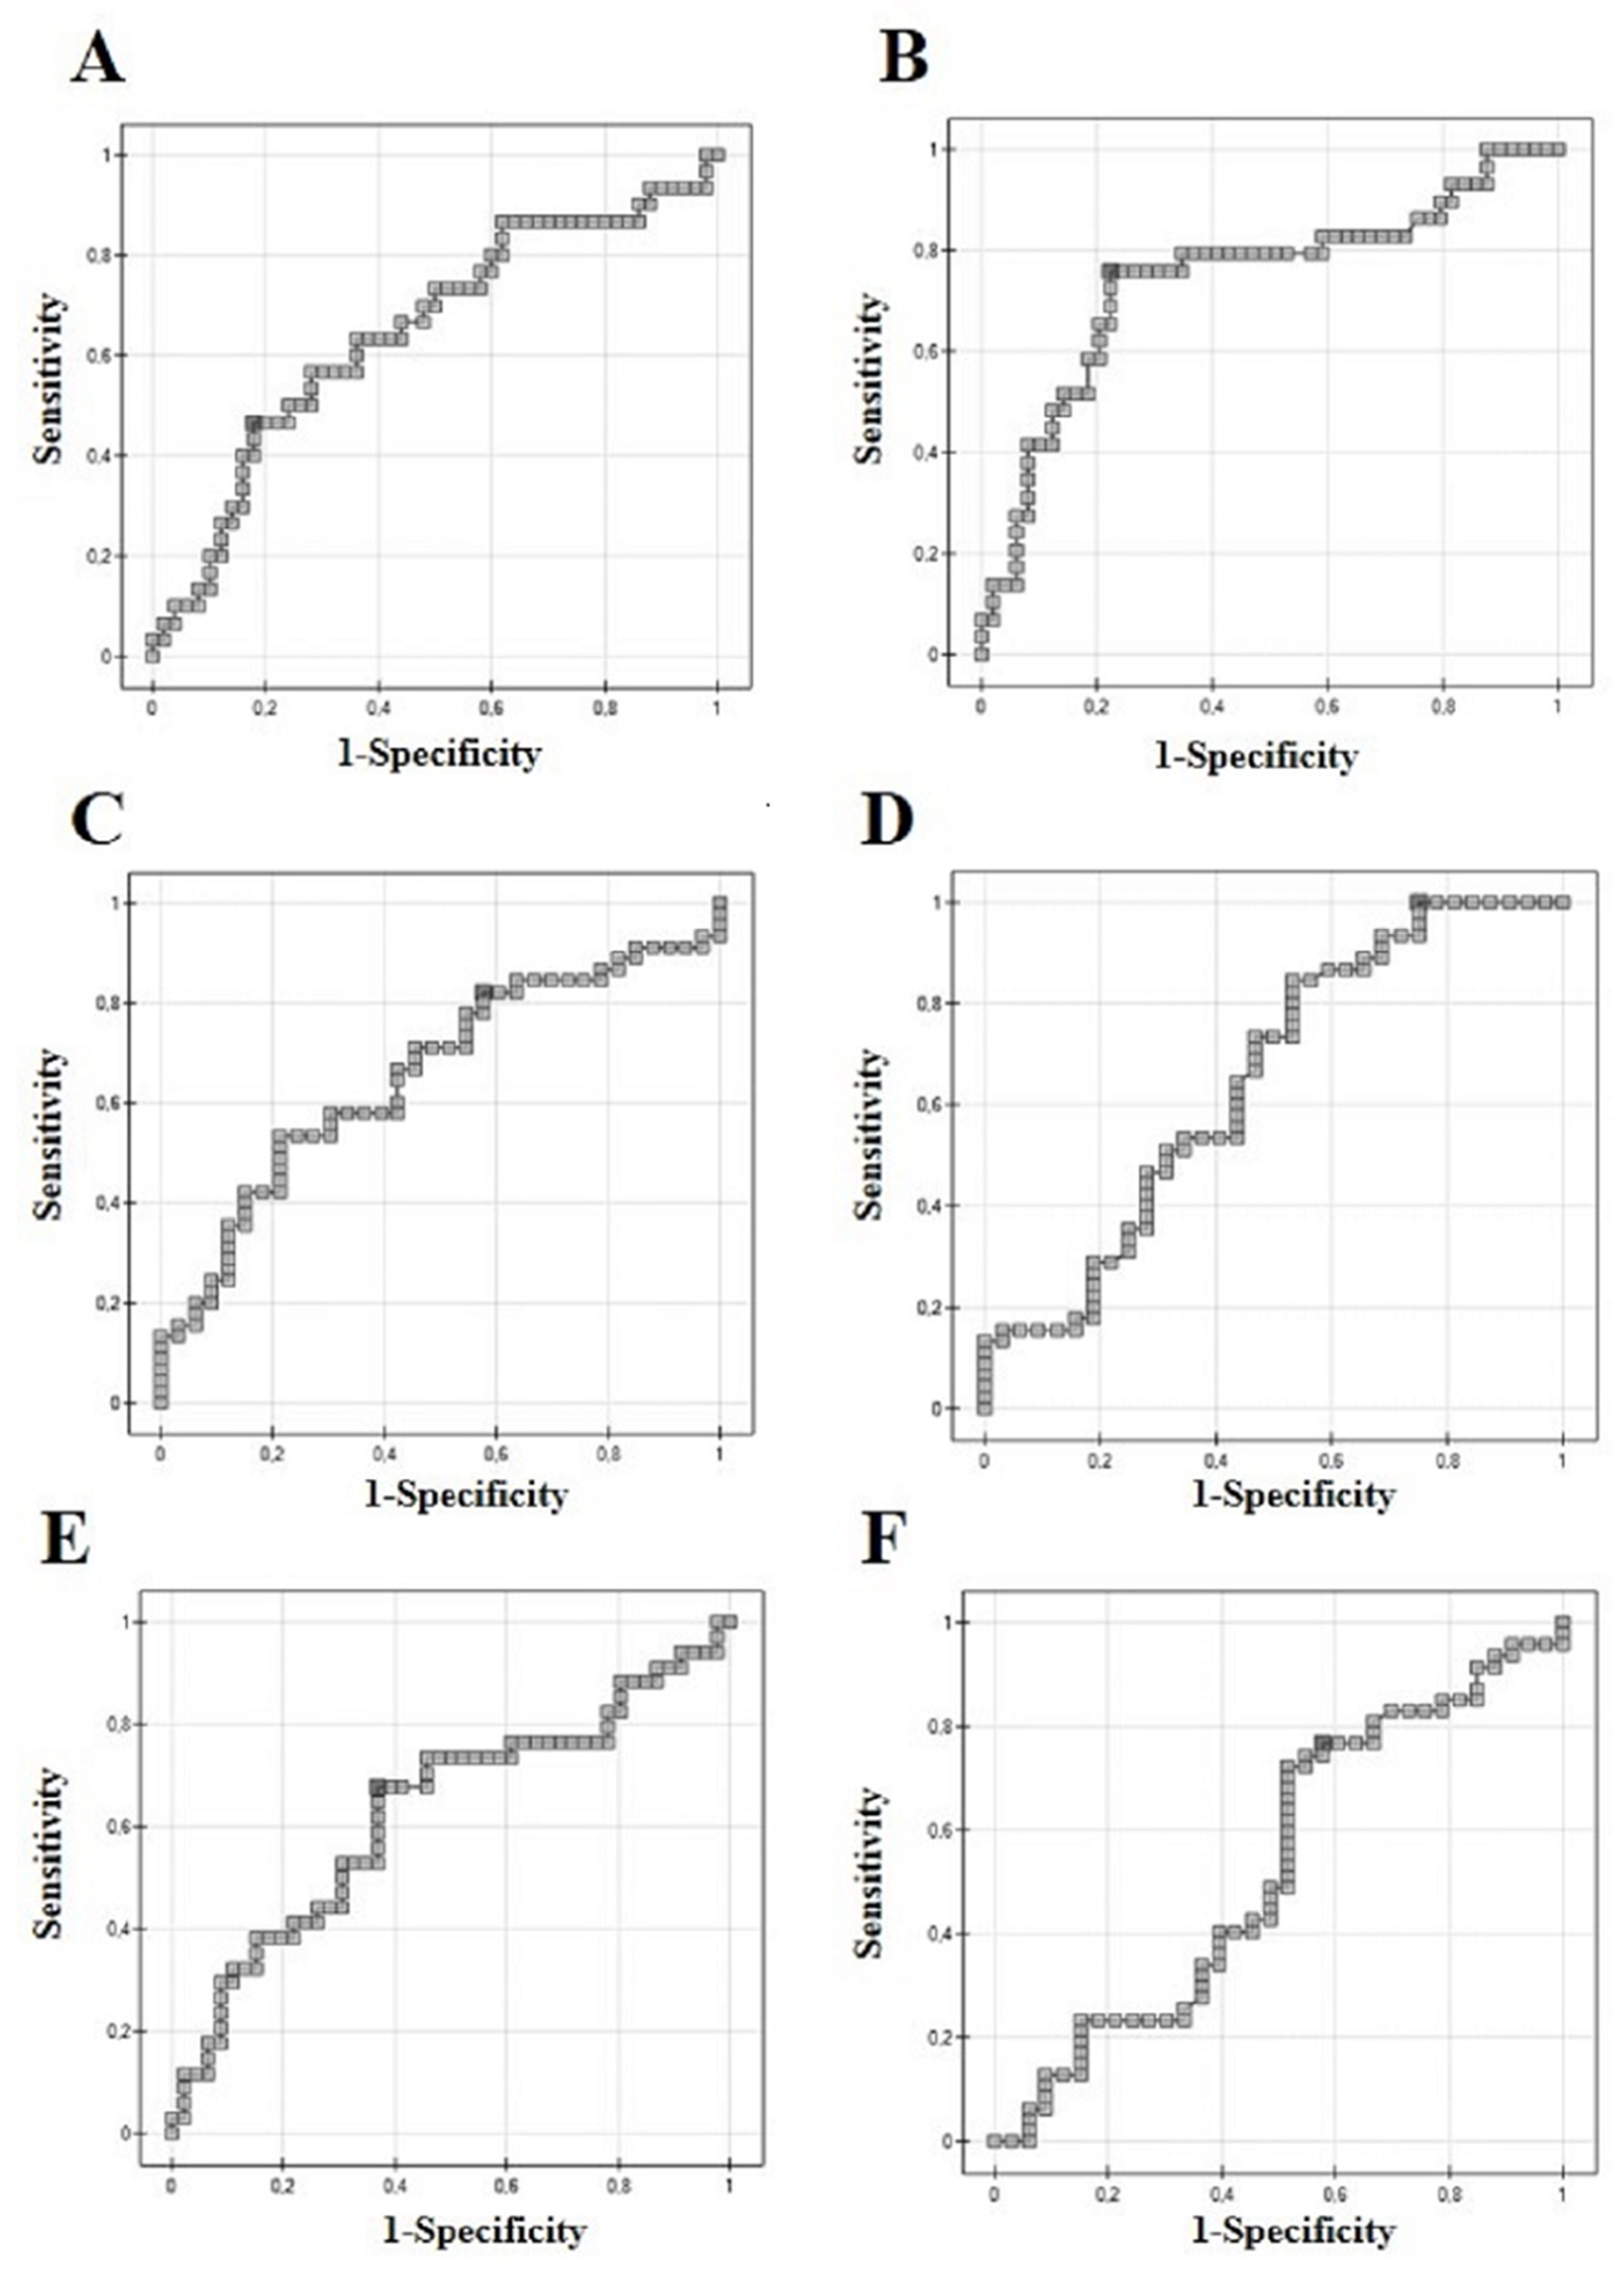
3.1. ROC Analysis
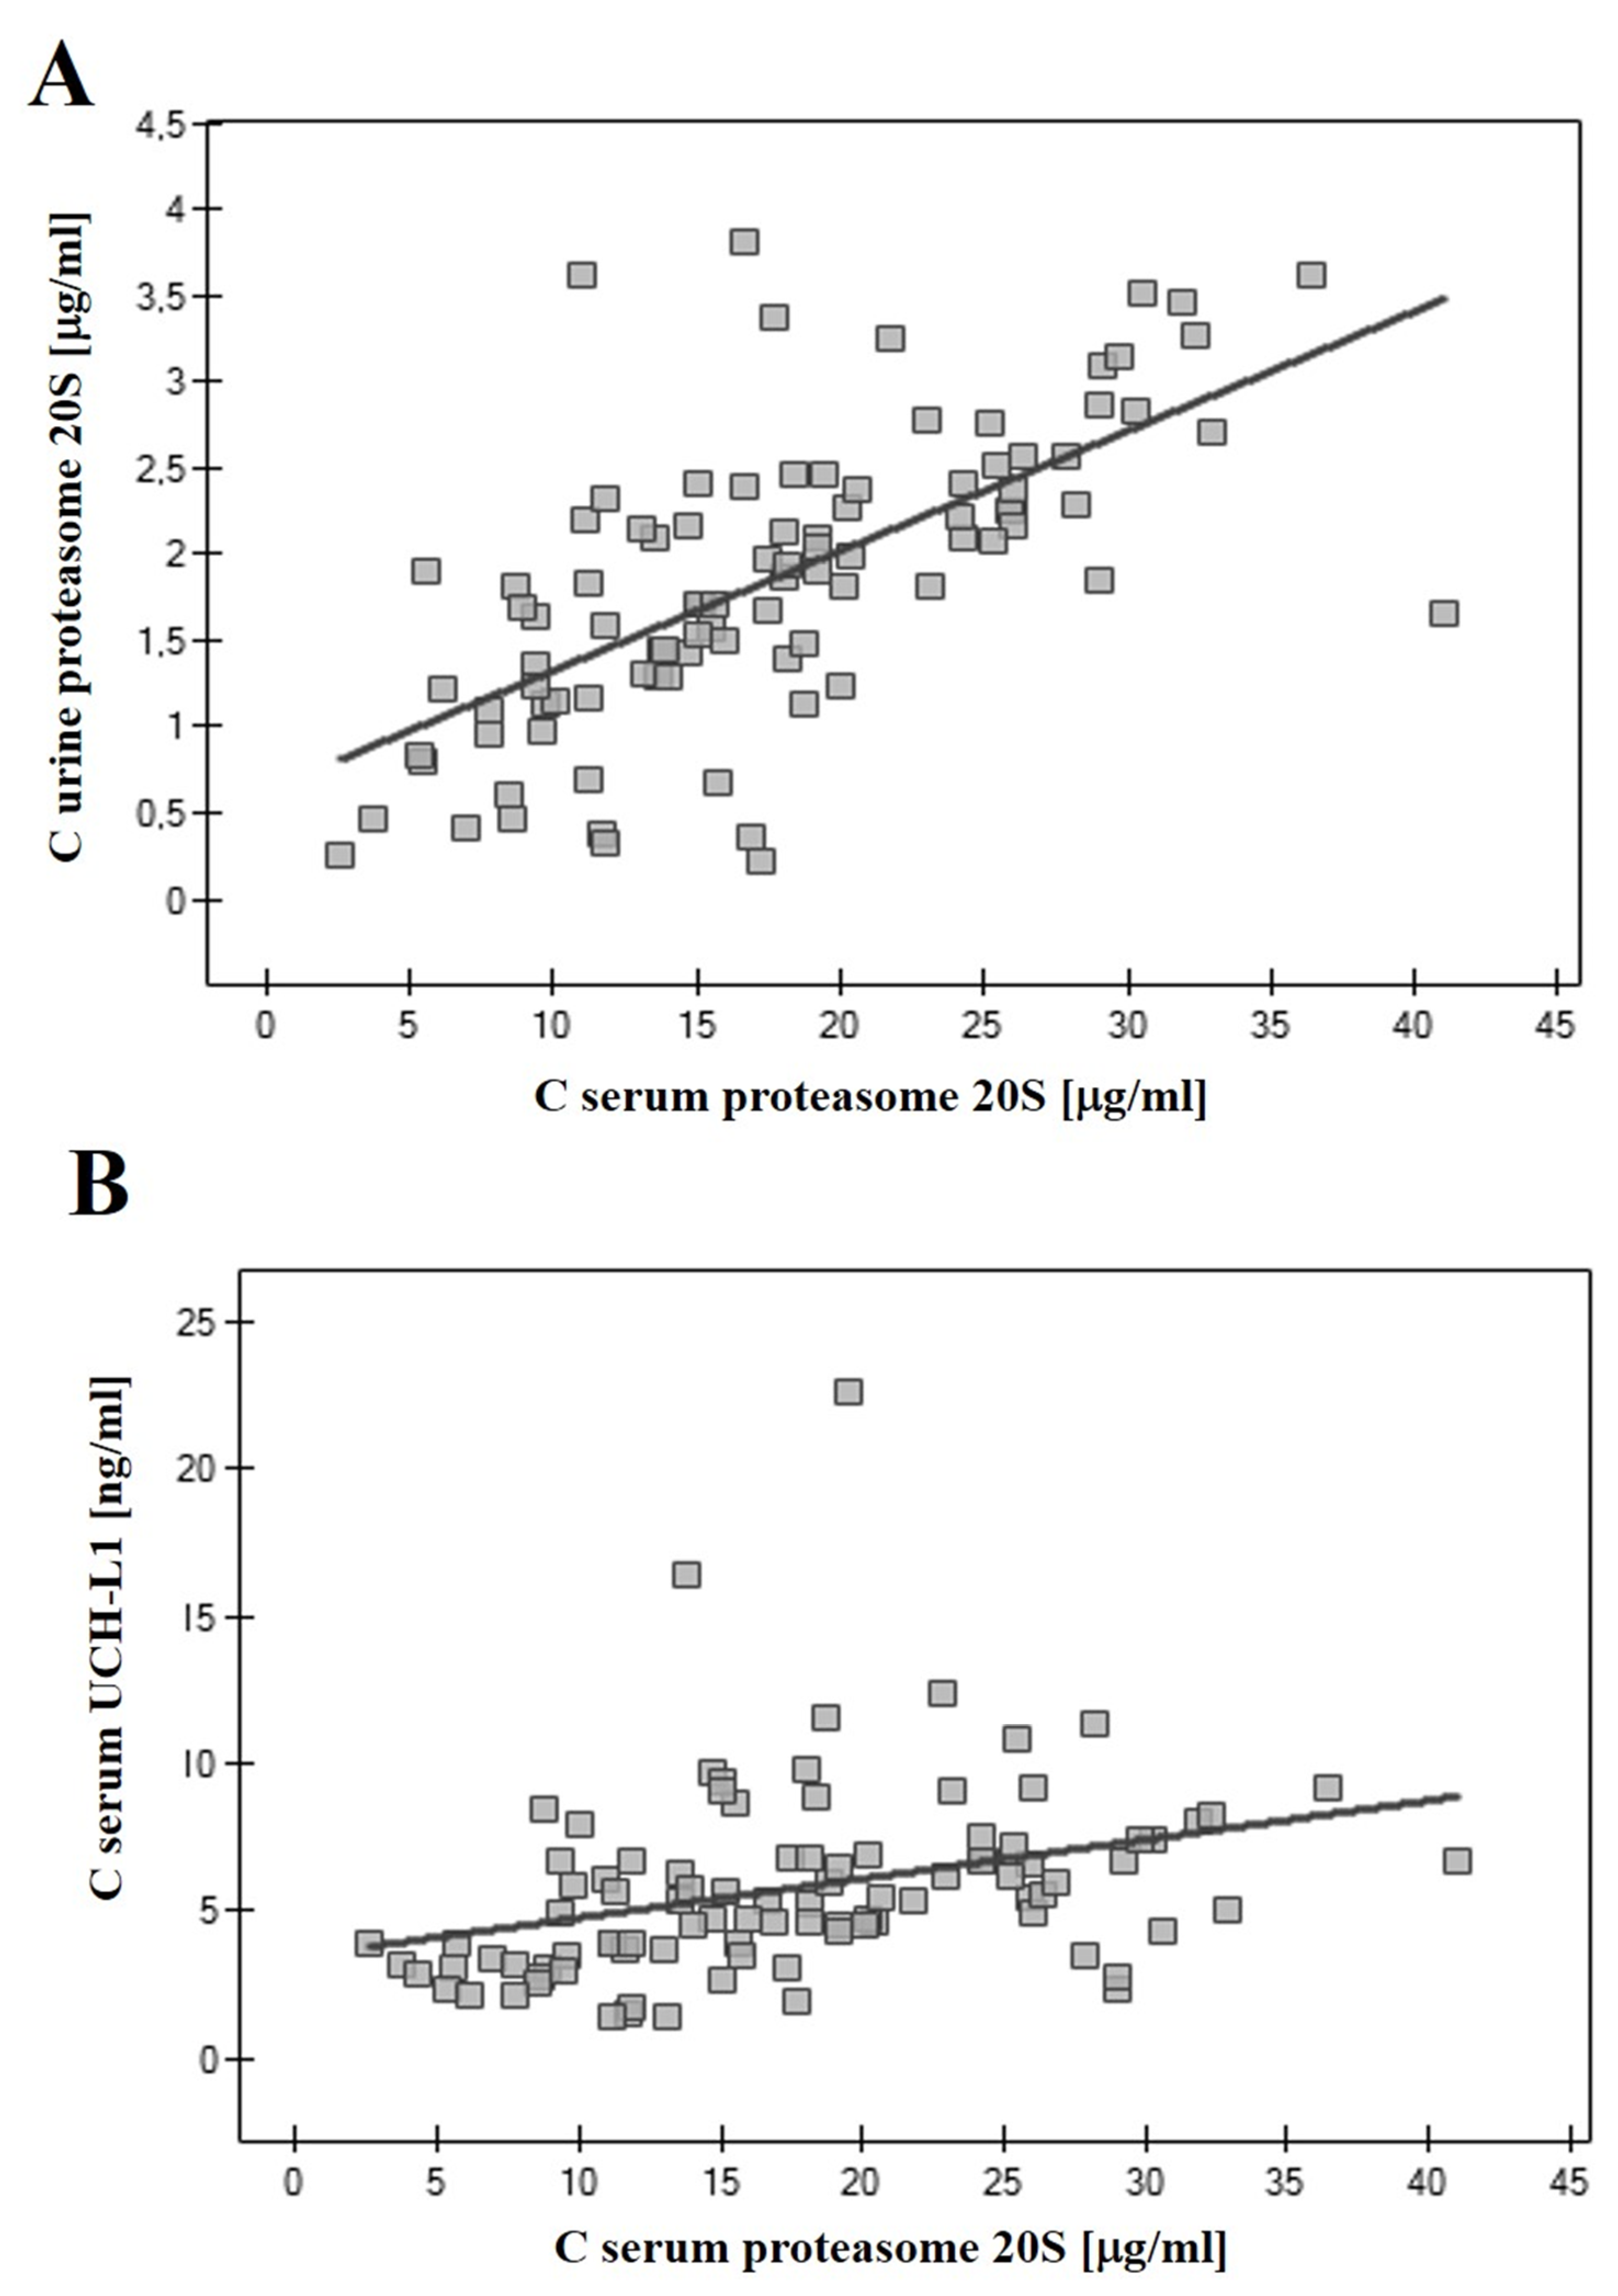
3.2. Correlations of 20S Proteasome and UCH-L1
3.3. UCH-L1 to 20S Proteasome Serum Concentration Ratio
4. Discussion
Author Contributions
Funding
Institutional Review Board Statement
Informed Consent Statement
Data Availability Statement
Conflicts of Interest
References
- Bray, F.; Ferlay, J.; Soerjomataram, I.; Siegel, R.L.; Torre, L.A.; Jemal, A. Global Cancer Statistics 2018: GLOBOCAN Estimates of Incidence and Mortality Worldwide for 36 Cancers in 185 Countries. CA Cancer J. Clin. 2018, 68, 394–424. [Google Scholar] [CrossRef]
- Mori, K.; Mostafaei, H.; Abufaraj, M.; Yang, L.; Egawa, S.; Shariat, S.F. Smoking and bladder cancer: Review of the recent literature. Curr. Opin. Urol. 2020, 30, 720–725. [Google Scholar] [CrossRef]
- Fernández, M.I.; Brausi, M.; Clark, P.E.; Cookson, M.S.; Grossman, H.B.; Khochikar, M.; Kiemeney, L.A.; Malavaud, B.; Sanchez-Salas, R.; Soloway, M.S.; et al. Epidemiology, prevention, screening, diagnosis, and evaluation: Update of the ICUD-SIU joint consultation on bladder cancer. World J. Urol. 2019, 37, 3–13. [Google Scholar] [CrossRef] [PubMed]
- Soria, F.; Krabbe, L.M.; Todenhöfer, T.; Dobruch, J.; Mitra, A.P.; Inman, B.A.; Gust, K.M.; Lotan, Y.; Shariat, S.F. Molecular markers in bladder cancer. World J. Urol. 2019, 37, 31–40. [Google Scholar] [CrossRef]
- Charpentier, M.; Gutierrez, C.; Guillaudeux, T.; Verhoest, G.; Pedeux, R. Noninvasive Urine-Based Tests to Diagnose or Detect Recurrence of Bladder Cancer. Cancers 2021, 13, 1650. [Google Scholar] [CrossRef] [PubMed]
- Tu, Y.; Chen, C.; Pan, J.; Xu, J.; Zhou, Z.G.; Wang, C.Y. The Ubiquitin Proteasome Pathway (UPP) in the regulation of cell cycle control and DNA damage repair and its implication in tumorigenesis. Int. J. Clin. Exp. Pathol. 2012, 5, 726–738. [Google Scholar]
- Manasanch, E.E.; Korde, N.; Zingone, A.; Tageja, N.; Fernandez de Larrea, C.; Bhutani, M.; Wu, P.; Roschewski, M.; Landgren, O. The proteasome: Mechanisms of biology and markers of activity and response to treatment in multiple myeloma. Leuk. Lymphoma 2014, 55, 1707–1714. [Google Scholar] [CrossRef] [PubMed]
- Cloos, J.; Roeten, M.S.F.; Franke, N.E.; Van Meerloo, J.; Zweegman, S.; Kaspers, G.J.L.; Jansen, G. (Immuno) proteasomes as therapeutic target in acute leukemia. Cancer Metastasis Rev. 2017, 36, 599–615. [Google Scholar] [CrossRef]
- Oldziej, A.; Bolkun, L.; Galar, M.; Kalita, J.; Ostrowska, H.; Romaniuk, W.; Kloczko, J. Assessment of proteasome concentration and chymotrypsin-like activity in plasma of patients with newly diagnosed multiple myeloma. Leuk. Res. 2014, 38, 925–930. [Google Scholar] [CrossRef]
- Johnson, D.E. The ubiquitin-proteasome system: Opportunities for therapeutic intervention in solid tumors. Endocr. Relat. Cancer 2015, 22, T1–T17. [Google Scholar] [CrossRef]
- Vriend, J.; Nachtigal, M.W. Ubiquitin Proteasome Pathway Transcriptome in Epithelial Ovarian Cancer. Cancers 2021, 13, 2659. [Google Scholar] [CrossRef]
- Sharma, A.; Liu, H.; Tobar-Tosse, F.; Chand Dakal, T.; Ludwig, M.; Holz, F.G.; Loeffler, K.U.; Wüllner, U.; Herwig-Carl, M.C. Ubiquitin Carboxyl-Terminal Hydrolases (UCHs): Potential Mediators for Cancer and Neurodegeneration. Int. J. Mol. Sci. 2020, 21, 3910. [Google Scholar] [CrossRef] [PubMed]
- Zhang, X.; Meng, T.; Cui, S.; Feng, L.; Liu, D.; Pang, Q.; Wang, P. Ubiquitination of Nonhistone Proteins in Cancer Development and Treatment. Front. Oncol. 2021, 10, 621294. [Google Scholar] [CrossRef] [PubMed]
- Fang, Y.; Shen, X.Z. Ubiquitin carboxyl-terminal hydrolases: Involvement in cancer progression and clinical implications. Cancer Metastasis Rev. 2017, 36, 669–682. [Google Scholar] [CrossRef]
- Matuszczak, E.; Tylicka, M.; Komarowska, M.D.; Debek, W.; Hermanowicz, A. Ubiquitin carboxy-terminal hydrolase L1—physiology and pathology. Cell. Biochem. Funct. 2020, 38, 533–540. [Google Scholar] [CrossRef] [PubMed]
- Hurst-Kennedy, J.; Chin, L.S.; Li, L. Ubiquitin C-Terminal Hydrolase L1 in Tumorgenesis. Biochem. Res. Int. 2012, 2012, 123706. [Google Scholar] [CrossRef] [PubMed]
- Seliger, B.; Fedorushchenko, A.; Brenner, W.; Ackermann, A.; Atkins, D.; Hanash, S.; Lichtenfels, R. Ubiquitin COOH-terminal hydrolase 1: A biomarker of renal cell carcinoma associated with enhanced tumor cell proliferation and migration. Clin. Cancer Res. 2007, 13, 27–37. [Google Scholar] [CrossRef] [PubMed][Green Version]
- Arpalahti, L.; Saukkonen, K.; Hagström, J.; Mustonen, H.; Seppänen, H.; Haglund, C.; Holmberg, C.I. Nuclear ubiquitin C-terminal hydrolase L5 expression associates with increased patient survival in pancreatic ductal adenocarcinoma. Tumour. Biol. 2017, 9, 1010428317710411. [Google Scholar] [CrossRef]
- Yamazaki, T.; Hibi, K.; Takase, T.; Tezel, E.; Nakayama, H.; Kasai, Y.; Ito, K.; Akiyama, S.; Nagasaka, T.; Nakao, A. PGP9.5 as a marker for invasive colorectal cancer. Clin. Cancer Res. 2002, 8, 192–195. [Google Scholar]
- Matějíková, J.; Kubiczková, L.; Sedlaříková, L.; Potáčová, A.; Hájek, R.; Sevčíková, S. Degradation of proteins by ubiquitin proteasome pathway. Klin. Onkol. 2013, 26, 251–256. [Google Scholar] [CrossRef][Green Version]
- Fhu, C.W.; Ali, A. Dysregulation of the Ubiquitin Proteasome System in Human Malignancies: A Window for Therapeutic Intervention. Cancers 2021, 13, 1513. [Google Scholar] [CrossRef]
- Nguyen, T.H.; Kugler, J.M. Ubiquitin-Dependent Regulation of the Mammalian Hippo Pathway: Therapeutic Implications for Cancer. Cancers 2018, 10, 121. [Google Scholar] [CrossRef] [PubMed]
- Mani, A.; Gelmann, E.P. The Ubiquitin-Proteasome Pathway and Its Role in Cancer. J. Clin. Oncol. 2005, 23, 4776–4789. [Google Scholar] [CrossRef] [PubMed]
- Budenholzer, L.; Cheng, C.L.; Li, Y.; Hochstrasser, M. Proteasome Structure and Assembly. J. Mol. Biol. 2017, 429, 3500–3524. [Google Scholar] [CrossRef] [PubMed]
- Das, C.; Hoang, Q.Q.; Kreinbring, C.A.; Luchansky, S.J.; Meray, R.K.; Ray, S.S.; Lansbury, P.T.; Ringe, D.; Persko, G.A. Structural basis for conformational plasticity of the Parkinson’s disease-associated ubiquitin hydrolase UCH-L1. Proc. Nat. Acad. Sci. USA 2006, 103, 4675–4680. [Google Scholar] [CrossRef]
- Osaka, H.; Wang, Y.L.; Takada, K.; Takizawa, S.; Setsuie, R.; Li, H.; Sato, Y.; Nishikawa, K.; Sun, Y.J.; Sakurai, M.; et al. Ubiquitin carboxy-terminal hydrolase L1 binds to and stabilizes monoubiquitin in neuron. Hum. Mol. Genet. 2003, 12, 1945–1958. [Google Scholar] [CrossRef]
- Matuszczak, E.; Tylicka, M.; Dębek, W.; Sankiewicz, A.; Gorodkiewicz, E.; Hermanowicz, A. Overexpression of ubiquitin carboxyl-terminal hydrolase L1 (UCHL1) in serum of children after thermal injury. Adv. Med. Sci. 2017, 62, 83–86. [Google Scholar] [CrossRef]
- Mondello, S.; Kobeissy, F.; Vestri, A.; Hayes, R.L.; Kochanek, P.M.; Berger, R.P. Serum Concentrations of Ubiquitin C-Terminal Hydrolase-L1 and Glial Fibrillary Acidic Protein after Pediatric Traumatic Brain Injury. Sci. Rep. 2016, 6, 28203. [Google Scholar] [CrossRef]
- Gorodkiewicz, E.; Ostrowska, H.; Sankiewicz, A. SPR imaging biosensor for the 20S proteasome: Sensor development and application to measurement of proteasomes in human blood plasma. Mikrochim. Acta. 2011, 175, 177–184. [Google Scholar] [CrossRef]
- Sankiewicz, A.; Laudanski, P.; Romanowicz, L.; Hermanowicz, A.; Roszkowska-Jakimiec, W.; Debek, W.; Gorodkiewicz, E. Development of surface plasmon resonance imaging biosensors for detection of ubiquitin carboxyl-terminal hydrolase L1. Anal. Biochem. 2015, 469, 4–11. [Google Scholar] [CrossRef]
- Matuszczak, E.; Tylicka, M.; Hermanowicz, A.; Debek, W.; Sankiewicz, A.; Gorodkiewicz, E. Application of SPR Imaging Biosensor for the Measurement of 20S Proteasomes in Blood Plasma of Children with Thermal Injury. Ann. Clin. Lab. 2016, 46, 407–411. [Google Scholar]
- Gorodkiewicz, E.; Guszcz, T.; Roszkowska-Jakimiec, W.; Kozłowski, R. Cathepsin D serum and urine concentration in superficial and invasive transitional bladder cancer as determined by surface plasmon resonance imaging. Oncol. Lett. 2014, 8, 1323–1327. [Google Scholar] [CrossRef] [PubMed][Green Version]
- Laudanski, P.; Gorodkiewicz, E.; Ramotowska, B.; Charkiewicz, R.; Kuzmicki, M.; Szamatowicz, J. Determination of cathepsins B, D and G concentration in eutopic proliferative endometrium of women with endometriosis by the surface plasmon resonance imaging (SPRI) technique. Eur. J. Obstet. Gynecol. Reprod. Biol. 2013, 169, 80–83. [Google Scholar] [CrossRef]
- Sankiewicz, A.; Romanowicz, L.; Laudanski, P.; Zelazowska-Rutkowska, B.; Puzan, B.; Cylwik, B.; Gorodkiewicz, E. SPR imaging biosensor for determination of laminin-5 as a potential cancer marker in biological material. Anal. Bioanal. Chem. 2016, 408, 5269–5276. [Google Scholar] [CrossRef] [PubMed]
- Gorodkiewicz, E.; Charkiewicz, R.; Rakowska, A.; Bajko, P.; Chyczewski, L.; Niklinski, J. SPR imaging biosensor for podoplanin: Sensor development and application to biological materials. Mikrochim. Acta 2012, 176, 337–343. [Google Scholar] [CrossRef]
- Goldberg, A.L. Protein degradation and protection against misfolded or damaged proteins. Nature 2003, 426, 895–899. [Google Scholar] [CrossRef] [PubMed]
- De Martino, M.; Hoetzenecker, K.; Ankersmit, H.J.; Roth, G.A.; Haitel, A.; Waldert, M.; Klatte, T. Serum 20S proteasome is elevated in patients with renal cell carcinoma and associated with poor prognosis. Br. J. Cancer 2012, 106, 904–908. [Google Scholar] [CrossRef]
- Romaniuk, W.; Kalita, J.; Ostrowska, H.; Kloczko, J. Proteasome 20S in multiple myeloma: Comparison of concentration and chymotrypsin-like activity in plasma and serum. Scand. J. Clin. Lab. Investig. 2018, 78, 253–257. [Google Scholar] [CrossRef]
- Hoffmann, O.; Heubner, M.; Anlasik, T.; Winterhalter, M.; Dahlmann, B.; Kasimir-Bauer, S.; Kimmig, R.; Wohlschlaeger, J.; Sixt, S.U. Circulating 20S proteasome in patients with non-metastasized breast cancer. Anticancer Res. 2011, 6, 2197–2201. [Google Scholar]
- Stoebner, P.E.; Lavabre-Bertrand, T.; Henry, L.; Guiraud, I.; Carillo, S.; Dandurand, M.; Joujoux, J.M.; Bureau, J.P.; Meunier, L. High plasma proteasome levels are detected in patients with metastatic malignant melanoma. Br. J. Dermatol. 2005, 152, 948–953. [Google Scholar] [CrossRef]
- Egerer, K.; Kuckelkorn, U.; Rudolph, P.E.; Rückert, J.C.; Dörner, T.; Burmester, G.R.; Kloetzel, P.M.; Feist, E. Circulating proteasomes are markers of cell damage and immunologic activity in autoimmune diseases. J. Rheumatol. 2002, 29, 2045–2052. [Google Scholar]
- Roth, G.A.; Moser, B.; Krenn, C.; Roth-Walter, F.; Hetz, H.; Richter, S.; Brunner, M.; Jensen-Jarolim, E.; Wolner, E.; Hoetzenecker, K.; et al. Heightened levels of circulating 20S proteasome in critically ill patients. Eur. J. Clin. Investig. 2005, 35, 399–403. [Google Scholar] [CrossRef]
- Gruba, N.; Wysocka, M.; Brzezińska, M.; Dębowski, D.; Sieńczyk, M.; Gorodkiewicz, E.; Guszcz, T.; Czaplewski, C.; Rolka, K.; Lesner, A. Bladder cancer detection using a peptide substrate of the 20S proteasome. FEBS J. 2016, 283, 2929–2948. [Google Scholar] [CrossRef] [PubMed]
- Leiblich, A.; Cross, S.S.; Catto, J.W.; Pesce, G.; Hamdy, F.C.; Rehman, I. Human prostate cancer cells express neuroendocrine cell markers PGP 9.5 and chromogranin A. Prostate 2007, 67, 1761–1769. [Google Scholar] [CrossRef] [PubMed]
- Kwan, S.Y.; Au-Yeung, C.L.; Yeung, T.L.; Rynne-Vidal, A.; Wong, K.K.; Risinger, J.I.; Lin, H.K.; Schmandt, R.E.; Yates, M.S.; Mok, S.C.; et al. Ubiquitin Carboxyl-Terminal Hydrolase L1 (UCHL1) Promotes Uterine Serous Cancer Cell Proliferation and Cell Cycle Progression. Cancers 2020, 12, 118. [Google Scholar] [CrossRef] [PubMed]
- Mohammad, R.M.; Maki, A.; Pettit, G.R.; Al-Katib, A.M. Bryostatin 1 induces ubiquitin COOH-terminal hydrolase in acute lymphoblastic leukemia cells. Enzyme Protein 1996, 49, 262–272. [Google Scholar] [CrossRef] [PubMed]
- Toyokuni, S. Iron-induced carcinogenesis: The role of redox regulation. Free Radic. Biol. Med. 1996, 20, 553–566. [Google Scholar] [CrossRef]
- Shang, F.; Gong, X.; Taylor, A. Activity of ubiquitin-dependent pathway in response to oxidative stress. Ubiquitin-activating enzyme is transiently up-regulated. J. Biol. Chem. 1997, 272, 23086–23093. [Google Scholar] [CrossRef]
- Gomes-Marcondes, M.C.; Tisdale, M.J. Induction of protein catabolism and the ubiquitin-proteasome pathway by mild oxidative stress. Cancer Lett. 2002, 180, 69–74. [Google Scholar] [CrossRef]
- Tsakiri, E.N.; Sykiotis, G.P.; Papassideri, I.S.; Terpos, E.; Dimopoulos, M.A.; Gorgoulis, V.G.; Bohmann, D.; Trougakos, I.P. Proteasome dysfunction in Drosophila signals to an Nrf2-dependent regulatory circuit aiming to restore proteostasis and prevent premature aging. Aging Cell 2013, 12, 802–813. [Google Scholar] [CrossRef] [PubMed]
- Jung, T.; Catalgol, B.; Grune, T. The proteasomal system. Mol. Asp. Med. 2009, 30, 191–296. [Google Scholar] [CrossRef] [PubMed]
- Suh, K.S.; Tanaka, T.; Sarojini, S.; Nightingale, G.; Gharbaran, R.; Pecora, A.; Goy, A. The role of the ubiquitin proteasome system in lymphoma. Crit. Rev. Oncol. Hematol. 2013, 87, 306–322. [Google Scholar] [CrossRef] [PubMed]
- Schlafer, D.; Shah, K.S.; Panjic, E.H.; Lonial, S. Safety of proteasome inhibitors for treatment of multiple myeloma. Expert Opin. Drug Saf. 2017, 16, 167–183. [Google Scholar] [CrossRef] [PubMed]


| Variable | Range | Number of Patients |
|---|---|---|
| Age (year) | <65 | 34 |
| >65 | 48 | |
| Gender | Women | 23 |
| Men | 59 | |
| Tumour stage | Superficial (Ta + T1) | 51 |
| Invasive (T2 + T3 + T4) | 31 | |
| Tumour grade | Low grade | 35 |
| High grade | 47 | |
| Tumour size (mm) | <30 | 49 |
| >30 | 33 | |
| Recurrence | Primary | 35 |
| Recurrent | 47 | |
| Multiplicity | Single | 46 |
| Multiply | 36 |
| Bladder Cancer Patients | Healthy Donors | |||||
|---|---|---|---|---|---|---|
| Average | Median | Average | Median | p | Test | |
| Proteasome serum | 15.45 | 15.13 | 2.72 | 2.89 | <0.0001 | T-Student for independent |
| [µg/mL] | ||||||
| Proteasome urine | 1.69 | 1.81 | 0.26 | 0.24 | <0.0001 | U-Mann |
| [µg/mL] | Whitney | |||||
| UCHL-1 serum | 4.97 | 4.72 | 0.45 | 0.45 | <0.0001 | U-Mann |
| [ng/mL] | Whitney | |||||
| UCHL-1 urine | 0.63 | 0.66 | 0.18 | 0.18 | <0.0018 | U-Mann–Whitney |
| [ng/mL] | ||||||
| Parameter | Proteasome 20S | UCH-L1 | ||||
|---|---|---|---|---|---|---|
| Concentration | Concentration | |||||
| [µg/mL] | [ng/mL] | |||||
| Range | Median | p-Value | Range | Median | p-Value | |
| Primary/recurrent | ||||||
| Primary (35) | 7.78–36.42 | 19.81 | 0.0258 | 1.47–22.61 | 6.3 | 0.0621 |
| Recurrent (47) | 3.75–32.91 | 15.92 | 1.54–11.51 | 5.5 | (NS) | |
| Multiplicity | ||||||
| Single (46) | 3.75–36.42 | 18.08 | 0.6458 | 1.54–11.32 | 5.36 | 0.0329 |
| Multiply (36) | 5.64–32.91 | 18.94 | (NS) | 1.47–22.61 | 6.7 | |
| Stage | ||||||
| Non-muscle | 3.75–32.91 | 16.27 | 0.0264 | 1.47–11.51 | 4.99 | 0.0001 |
| invasive (51) | ||||||
| (Ta + T1) | ||||||
| Muscle invasive (31) (T2 + T3 = T4) | 5.64–36.42 | 23.54 | 2.74–22.61 | 6.95 | ||
| Grade | ||||||
| Low-grade (34) | 3.75–28.99 | 15.06 | 0.0036 | 1.47–9.85 | 4.65 | 0.0001 |
| High-grade (48) | 5.64–36.42 | 20.07 | 2.74–22.61 | 6.62 | ||
| Size (mm) | ||||||
| <30 (49) | 6.19–30.56 | 16.62 | 0.0668 | 1.54–22.61 | 5.6 | 0.1761 |
| >30 (33) | 3.75–36.42 | 19.68 | (NS) | 1.47–12.34 | 6.41 | (NS) |
| Parameter | Proteasome 20S | UCH-L1 | ||||
|---|---|---|---|---|---|---|
| Concentration | Concentration | |||||
| [µg/mL] | [ng/mL] | |||||
| Range | Median | p-Value | Range | Median | p-Value | |
| Primary/recurrent | ||||||
| Primary (35) | 0.32–3.62 | 2.25 | 0.0446 | 0.28–1.07 | 0.71 | 0.0892 |
| Recurrent (47) | 0.38–3.81 | 1.81 | 0.26–1.05 | 0.67 | (NS) | |
| Multiplicity | ||||||
| Single (46) | 0.38–3.81 | 2.08 | 0.5656 | 0.28–1.07 | 0.7 | 0.1722 |
| Multiply (36) | 1.13–3.51 | 1.85 | (NS) | 0.26–1.05 | 0.67 | (NS) |
| Stage | ||||||
| Non-muscle | 0.38–3.81 | 1.82 | 0.0448 | 0.27–1.05 | 0.66 | 0.0574 |
| invasive (51) | (NS) | |||||
| (Ta + T1) | ||||||
| Muscle invasive (31) | 1.23–3.62 | 2.25 | 0.26–1.07 | 0.77 | ||
| (T2 + T3 = T4) | ||||||
| Grade | ||||||
| Low-grade (34) | 0.38–3.38 | 1.7 | 0.0033 | 0.28–1.07 | 0.67 | 0.4409 |
| High-grade (48) | 1.13–3.81 | 2.21 | 0.26–1.05 | 0.73 | (NS) | |
| Size (mm) | ||||||
| <30 (49) | 0.38–3.81 | 1.81 | 0.2258 | 0.26–1.05 | 0.66 | 0.0184 |
| >30 (33) | 0.42–3.62 | 2.21 | (NS) | 0.28–1.07 | 0.85 | |
| AUC | p | Sensitivity | Specificity | PPV | NPV | Cut-Off | |
|---|---|---|---|---|---|---|---|
| Proteasome 20S | 0.64 | 0.029 | 21.79 | ||||
| Muscle-invasive | 46 | 82 | 61 | 71 | |||
| (Figure 2A) | |||||||
| Proteasome 20S | 0.65 | 0.019 | 13.54 | ||||
| High-grade | 82 | 42 | 66 | 63 | |||
| (Figure 2B) | |||||||
| Proteasome 20S | 0.62 | 0.49 | 17.48 | ||||
| Recurrence | 67 | 63 | 57 | 72 | |||
| (Figure 2C) | |||||||
| UCH-L1 | 0.74 | 0.0003 | 75 | 77 | 66 | 84 | 6.27 |
| Muscle-invasive | |||||||
| (Figure 2D) | |||||||
| UCH-L1 | 0.64 | 0.02 | 2.74 | ||||
| High-grade | 100 | 25 | 65 | 100 | |||
| (Figure 2E) | |||||||
| UCH-L1 | 0.53 | 0.62 | 76 | 42 | 65 | 56 | 4.51 |
| Recurrence | |||||||
| (Figure 2F) |
Publisher’s Note: MDPI stays neutral with regard to jurisdictional claims in published maps and institutional affiliations. |
© 2021 by the authors. Licensee MDPI, Basel, Switzerland. This article is an open access article distributed under the terms and conditions of the Creative Commons Attribution (CC BY) license (https://creativecommons.org/licenses/by/4.0/).
Share and Cite
Sankiewicz, A.; Guszcz, T.; Gorodkiewicz, E. Application of SPRi Biosensors for Determination of 20S Proteasome and UCH-L1 Levels in the Serum and Urine of Transitional Bladder Cancer Patients. Appl. Sci. 2021, 11, 7835. https://doi.org/10.3390/app11177835
Sankiewicz A, Guszcz T, Gorodkiewicz E. Application of SPRi Biosensors for Determination of 20S Proteasome and UCH-L1 Levels in the Serum and Urine of Transitional Bladder Cancer Patients. Applied Sciences. 2021; 11(17):7835. https://doi.org/10.3390/app11177835
Chicago/Turabian StyleSankiewicz, Anna, Tomasz Guszcz, and Ewa Gorodkiewicz. 2021. "Application of SPRi Biosensors for Determination of 20S Proteasome and UCH-L1 Levels in the Serum and Urine of Transitional Bladder Cancer Patients" Applied Sciences 11, no. 17: 7835. https://doi.org/10.3390/app11177835
APA StyleSankiewicz, A., Guszcz, T., & Gorodkiewicz, E. (2021). Application of SPRi Biosensors for Determination of 20S Proteasome and UCH-L1 Levels in the Serum and Urine of Transitional Bladder Cancer Patients. Applied Sciences, 11(17), 7835. https://doi.org/10.3390/app11177835