Abstract
Accurate and rapid identification of the severe and non-severe COVID-19 patients is necessary for reducing the risk of overloading the hospitals, effective hospital resource utilization, and minimizing the mortality rate in the pandemic. A conjunctive belief rule-based clinical decision support system is proposed in this paper to identify critical and non-critical COVID-19 patients in hospitals using only three blood test markers. The experts’ knowledge of COVID-19 is encoded in the form of belief rules in the proposed method. To fine-tune the initial belief rules provided by COVID-19 experts using the real patient’s data, a modified differential evolution algorithm that can solve the constraint optimization problem of the belief rule base is also proposed in this paper. Several experiments are performed using 485 COVID-19 patients’ data to evaluate the effectiveness of the proposed system. Experimental result shows that, after optimization, the conjunctive belief rule-based system achieved the accuracy, sensitivity, and specificity of 0.954, 0.923, and 0.959, respectively, while for disjunctive belief rule base, they are 0.927, 0.769, and 0.948. Moreover, with a 98.85% AUC value, our proposed method shows superior performance than the four traditional machine learning algorithms: LR, SVM, DT, and ANN. All these results validate the effectiveness of our proposed method. The proposed system will help the hospital authorities to identify severe and non-severe COVID-19 patients and adopt optimal treatment plans in pandemic situations.
1. Introduction
The whole world is fighting against COVID-19 pandemic caused by 2019 novel coronavirus (SARS-CoV-2) since December 2019. It is a highly infectious disease that transmits human to human through respiratory droplets and physical contact [1]. As of 26 April 2021, the virus has caused 147,902,942 confirmed cases and 3,124,964 deaths in around 270 countries including Bangladesh (https://www.worldometers.info/coronavirus/, accessed on 26 April 2021). A patient who is in normal health condition can recover very shortly after appropriate home medication [2]. In patients with high-risk factors such as old age and underlying comorbidities—particularly cardiovascular diseases, diabetics, respiratory disease, and other conditions, the disease becomes severe and the patients need oxygen, prolonged ventilation, and even extracorporeal membrane oxygenation (ECMO), particularly for patients with acute respiratory distress syndrome (ARDS) [3,4]. Many deaths have been reported worldwide due to the lack of emergency medical support. It becomes difficult to provide emergency medical support to the overwhelming number of patients for a third world country like Bangladesh and India where healthcare resources are very limited or for an overcrowded hospital due to the shortage of emergency medical facilities as well as trained personnel. In such situations, it is necessary to quickly prioritize the severe patients to ensure efficient and optimal utilization of hospital resources. Doing so will help to avoid any irreversible consequences as well as to lessen the mortality rate. Therefore, doctors and clinicians need to initially assess the severity of COVID-19 in patients immediately after they visit the hospital based on their clinical data and laboratory test reports. However, it is very difficult for clinicians to make such difficult decisions without past specific experience [4]. Moreover, due to the biases associated with humans such as tiredness, stress, anxiety, and environmental interfering factors, the severity of disease predicted by doctors may be inaccurate [5,6]. Besides, it is difficult to distinguish COVID-19 from pneumonia and flu due to the similarities among them. Any fallacious diagnosis or prediction may cause great loss to the patients as well as destructive consequences in controlling the pandemic [7]. A computer-aided clinical decision support system (CDSS) that imitates the decision-making process of a domain expert can help doctors overcome these limitations. Moreover, CDSS can reduce the uncertainties and processing time as well as derive new knowledge from clinical data that can be used by physician in complex decision-making [8]. Previously, numerous CDSSs using artificial intelligence techniques such as support vector machine [9,10,11], neural network [12,13,14], and logistic regression [15] have developed to improve the quality of services at health care.
All of the above-mentioned methods have some limitations. None of the Support Vector Machine (SVM), Neural Network (NN), Logistic Regression (LR), or Decision Tree (DT) methods address uncertainty in data. Moreover, represent a completely data-driven approach. They do not take into account the experts’ knowledge to establish the nonlinear relationship between the input and output. Their performance and efficacy significantly depend on the training and test dataset, although there is an integrated relationship between data and knowledge in medical domain [8]. Besides, SVM and ANN are black-box approaches; their internal structures are not interpretable to the user. However, uncertainties are significant characteristics of both clinical knowledge and clinical data. They prevail in nearly all clinical decision-making process. Nearly all clinical decision-making process are affected by uncertainty [16]. Furthermore, expert domain knowledge plays a critical role in the clinical decision. Therefore, a knowledge-based system that integrates clinical domain knowledge of the experts in modeling the nonlinear casual relationship between the antecedent factors and dependent outcome under different types of uncertainties is more suitable for CDSS.
The belief rule-based expert system (BRBES) employed in this paper develops an intelligent CDSS to predict the severity of COVID-19 in patients as it meets the above-mentioned requirements for CDSS. It has the capability of dealing with uncertainties both in knowledge representation and reasoning. Besides, it integrates the advantage of data driven and knowledge driven approach into a single framework with learning capability to approximate nonlinear functions and works as a universal estimator [8]. In BRBES, a hybrid knowledge representation scheme known as belief rule base (BRB) is employed to store the vague, random, fuzzy, incomplete, and imprecise clinical domain knowledge of experts in the form of belief rule to establish a nonlinear casual relationship between medical antecedents and consequent. The inference process to find the prediction outcome for illness severity of COVID-19 in a patient is implemented taking uncertain information of antecedent. The inference mechanism of BRBES is implemented using evidential reasoning approach (ER) that combines the activated rules in the BRB to reach a conclusion based on observed uncertain clinical data for a specific patient. ER possess the capability of rationally reserving the uncertainties in BRB and reflecting their effect on the final decision [17]. The initial BRB is constructed taking suggestion from the doctors who provided the parameters of each belief rule including the referential values of the antecedent attributes, antecedent-attribute weights, rule weights, and the belief degrees in the consequent part. However, doctors may not be able to accurately determine these parameters due to the limitations of human knowledge [18]. Therefore, an improved differential evaluation (IDE) optimization algorithm is proposed to fine tuned these parameters with accumulated patient data.
Research shows that lactic dehydrogenase (LDH), lymphocytes, and high-sensitivity C-reactive protein (hs-CRP) are the three most efficient indicators for the disease severity for all COVID-19 variants [3,4,7,19]. Therefore, in the proposed CDSS, these three features are used to predict the severity of COVID-19 in a patient.
The effectiveness of the proposed system is verified by comparing its performance with state-of-the-art machine learning algorithms using a real patient dataset. The result shows that the prediction performance of BRBES is better than traditional machine learning algorithms.
The rest of the paper is organised as follows. Section 2 gives an overview of the related works. Section 3 explains the belief rule-based expert systems (BRBES) methodology along with the optimization of BRBES using differential evaluation algorithm. The knowledge base construction, experimental setup, and the performance measure metrics are presented in Section 4. Section 5 includes the results and discussion, while Section 6 concludes the article.
2. Related Work
Artificial intelligent based clinical decision support systems have been successfully used in healthcare for various tasks including predicting risk of heart failure [20], mortality in pneumonia [21,22], mortality risk in critical care [23,24,25]. These expert systems assist medical experts to understand and evaluate clinical findings better. Therefore, they can choose an optimal decision in a critical situation. In this study, we proposed a knowledge based expert system using a belief rule base to predict the clinical severity prediction of COVID-19. There are very few similar studies in the literature about the clinical severity prediction of COVID-19.
The authors of [4] used machine learning techniques to predict the clinical severity of coronavirus. The data used in this study were collected from Wenzhou Central Hospital and Cangnan People’s Hospital in Wenzhou, China, and are not privately accessible. First, three feature selection methods—information gain, gini-index, and chi-square statistics—were used to select the eleven most important clinical features. Six different machine learning algorithms—logistic regression, k-nearest neighborhood (KNN), two different decision trees, random forests, and support vector machines (SVM)—were applied. The performance of the classifiers was evaluated with only accuracy values. Best accuracy was obtained with SVM classifier with 80%. This method do not integrate the expert knowledge in the prediction process. Moreover, the accuracy is not very high to be applicable in the hospitals.
In the another study [26], the authors applied machine learning classifiers to predict COVID-19 diagnosis. Clinical data was obtained from Hospital Israelita Albert Einstein at Sao Paulo Brazil. 18 clinical findings were considered in the study and classifiers were evaluated with AUC, sensitivity, specificity, F1- score, Brier score, positive predictive value, and negative predictive value. Five different classifiers were applied including, SVM, random forests, neural networks, logistic regression, and gradient boosted trees. The best AUC score was obtained with both SVM and random forest classifiers: 0.847.
In [27], a clinical predictive model for COVID-19 was proposed. In the study, data were collected from Hospital Israelita Albert Einstein at Sao Paulo, Brazil, like in this study and in [26]. The authors applied various machine learning applications, including Random Forest (RF), Neural Network (NN), Logistic Regression (LR), Support Vector Machine (SVM), eXtreme Gradient Boosting(XGBoost), and determined the performance of classifiers by calculating sensitivity, specificity, and AUC scores. The best performance was obtained with XGB with 66% AUC score. The dataset used in this study is very small in size and the prediction accuracy is very low.
The authors of [28] compared the performance of six deep learning models including Deep Neural Network (DNN), Convolutional Neural Networks (CNN), Long Short-Term Memory (LSTM), Recurrent Neural Networks (RNN), CNNLSTM, and CNNRNN to predict COVID-19 infection. Data used in this study were collected from Hospital Israelita Albert Einstein at Sao Paulo, Brazil, like in [26]. The dataset contains 18 laboratory findings of only 600 patients, where 520 patients were normal and 80 patients were COVID positive. The performance of the each of the predictive models was assessed in terms of accuracy, f1-score, precision, recall, and area under ROC curve (AUC) using both 10-fold cross-validation and train–test split approaches. Eighteen of the most important clinical features, which have a vital role in COVID-19 disease according to the studies in [4,26,27], were considered to develop the predictive models. The best performance was achieved with LSTM with an accuracy of 86.66%, F1-score of 91.89%, precision of 86.75%, recall of 99.42%, and AUC of 62.50%. The data set used in this study is very small. Moreover, expert knowledge is not take into consideration in the decision-making.
The performance and robustness of the machine learning-based radiomic model for different levels of COVID-19 severity prediction are investigated in [29]. A chest CT image dataset of 1110 COVID-19 patients is used in this study to classify the severity of each patient into mild, moderate, and severe. One-hundred-and-seven radiomic features are extracted from each CT for application of machine learning algorithm. The dataset was randomly divided into training and holdout validation set consisting of 60% and 40% of data, respectively. After selecting the most significant features using the statistical method, a logistic regression model is applied predicting severe cases from mild and moderate cases. The predictive power of the models is measured using the Area Under Curve (AUC) of the Receiver Operating Characteristic (ROC) curve. Their predictive model can predict mild from severe COVID-19 with AUC = 0.85 and moderate from severe COVID-19 with AUC = 0.65. Machine Learning-based radiomic models proposed in this study were moderately sensitive to inter-observer classifications, and thus cannot be used without any caution.
In [30], the authors proposed an interpretable machine learning method using the random forest algorithm for severe and non-severe COVID-19 clinical type classification. They used 26 symptom features and 26 biochemistry features collected from a cohort of 214 non-severe and 148 severe type COVID-19 patients from Wuhan, China, to train and validate the machine learning model. Their proposed method achieved 90% and 95% predictive accuracy when symptom and biochemistry features are used independently as input. Further, they extracted the five most significant features from each modality applying the Gini impurity feature selection method. Combining these top ten features from both modalities their proposed method achieved 99% predictive accuracy. However, collecting biochemistry features is costly, especially for a country like Bangladesh. Therefore, it cannot be used as an initial screening tool for triaging in Bangladesh.
In [31], the authors utilized several machine learning algorithms to build the COVID-19 severeness detection model based on urine and blood tests. The data were collected from 137 clinically confirmed cases of COVID-19 who were hospitalized at Tongji Hospital between the date 18 January 2020 to 13 February 2020. Seventy-five of these patients were severe and 62 were normal. Clinically obtained values including age, sex, body temperature, heart rate, respiratory rate, blood pressure, and the blood/urine test data were used as features in this study. Using all these features, five machine learning models were then built applying Logistic Regression (LR), Support Vector Machine (SVM), Random Forest (RF), K nearest neighbor (KNN), and AdaBoost algorithms. Among these models, the Support Vector Machine (SVM) exhibited superior performance with an overall accuracy of 0.7926. Next, using the Student t-test, 32 most important features whose p-value were less than 0.05 were selected. Four features were further removed for inter-feature redundancies. The final SVM model was trained using 28 features and achieved an overall accuracy of 0.8148. However, the dataset used in this study is small in size and not balanced. Moreover, the prediction accuracy is not satisfactory to be used as a screening tool in hospitals. A summary of the related works are shown in the Table 1.

Table 1.
Summary of the related works.
3. Materials and Methods
3.1. BRBES
A BRBES consists of two components: (1) the belief rule base (BRB) which is considered a knowledge base to store a set of uncertain rules and (2) evidential reasoning (ER)-based inference engine to induce new results based on the association of test input and the BRB. The following two sections describe how to model domain knowledge under uncertainty using BRB and ER based inference process.
Modeling Domain Knowledge Using BRB
In BRBES, the domain knowledge of experts are modeled using belief rule which is extended version of traditional if-then rule. A belief rule consists of two parts: the first part is antecedent or premises which includes all the antecedents attributes or inputs while the other part is consequent or conclusion which contains the consequent attribute. A weight is given to each belief rule to show its relative importance. The higher weight indicates more importance.
3.2. Inference with BRB Using ER Approach
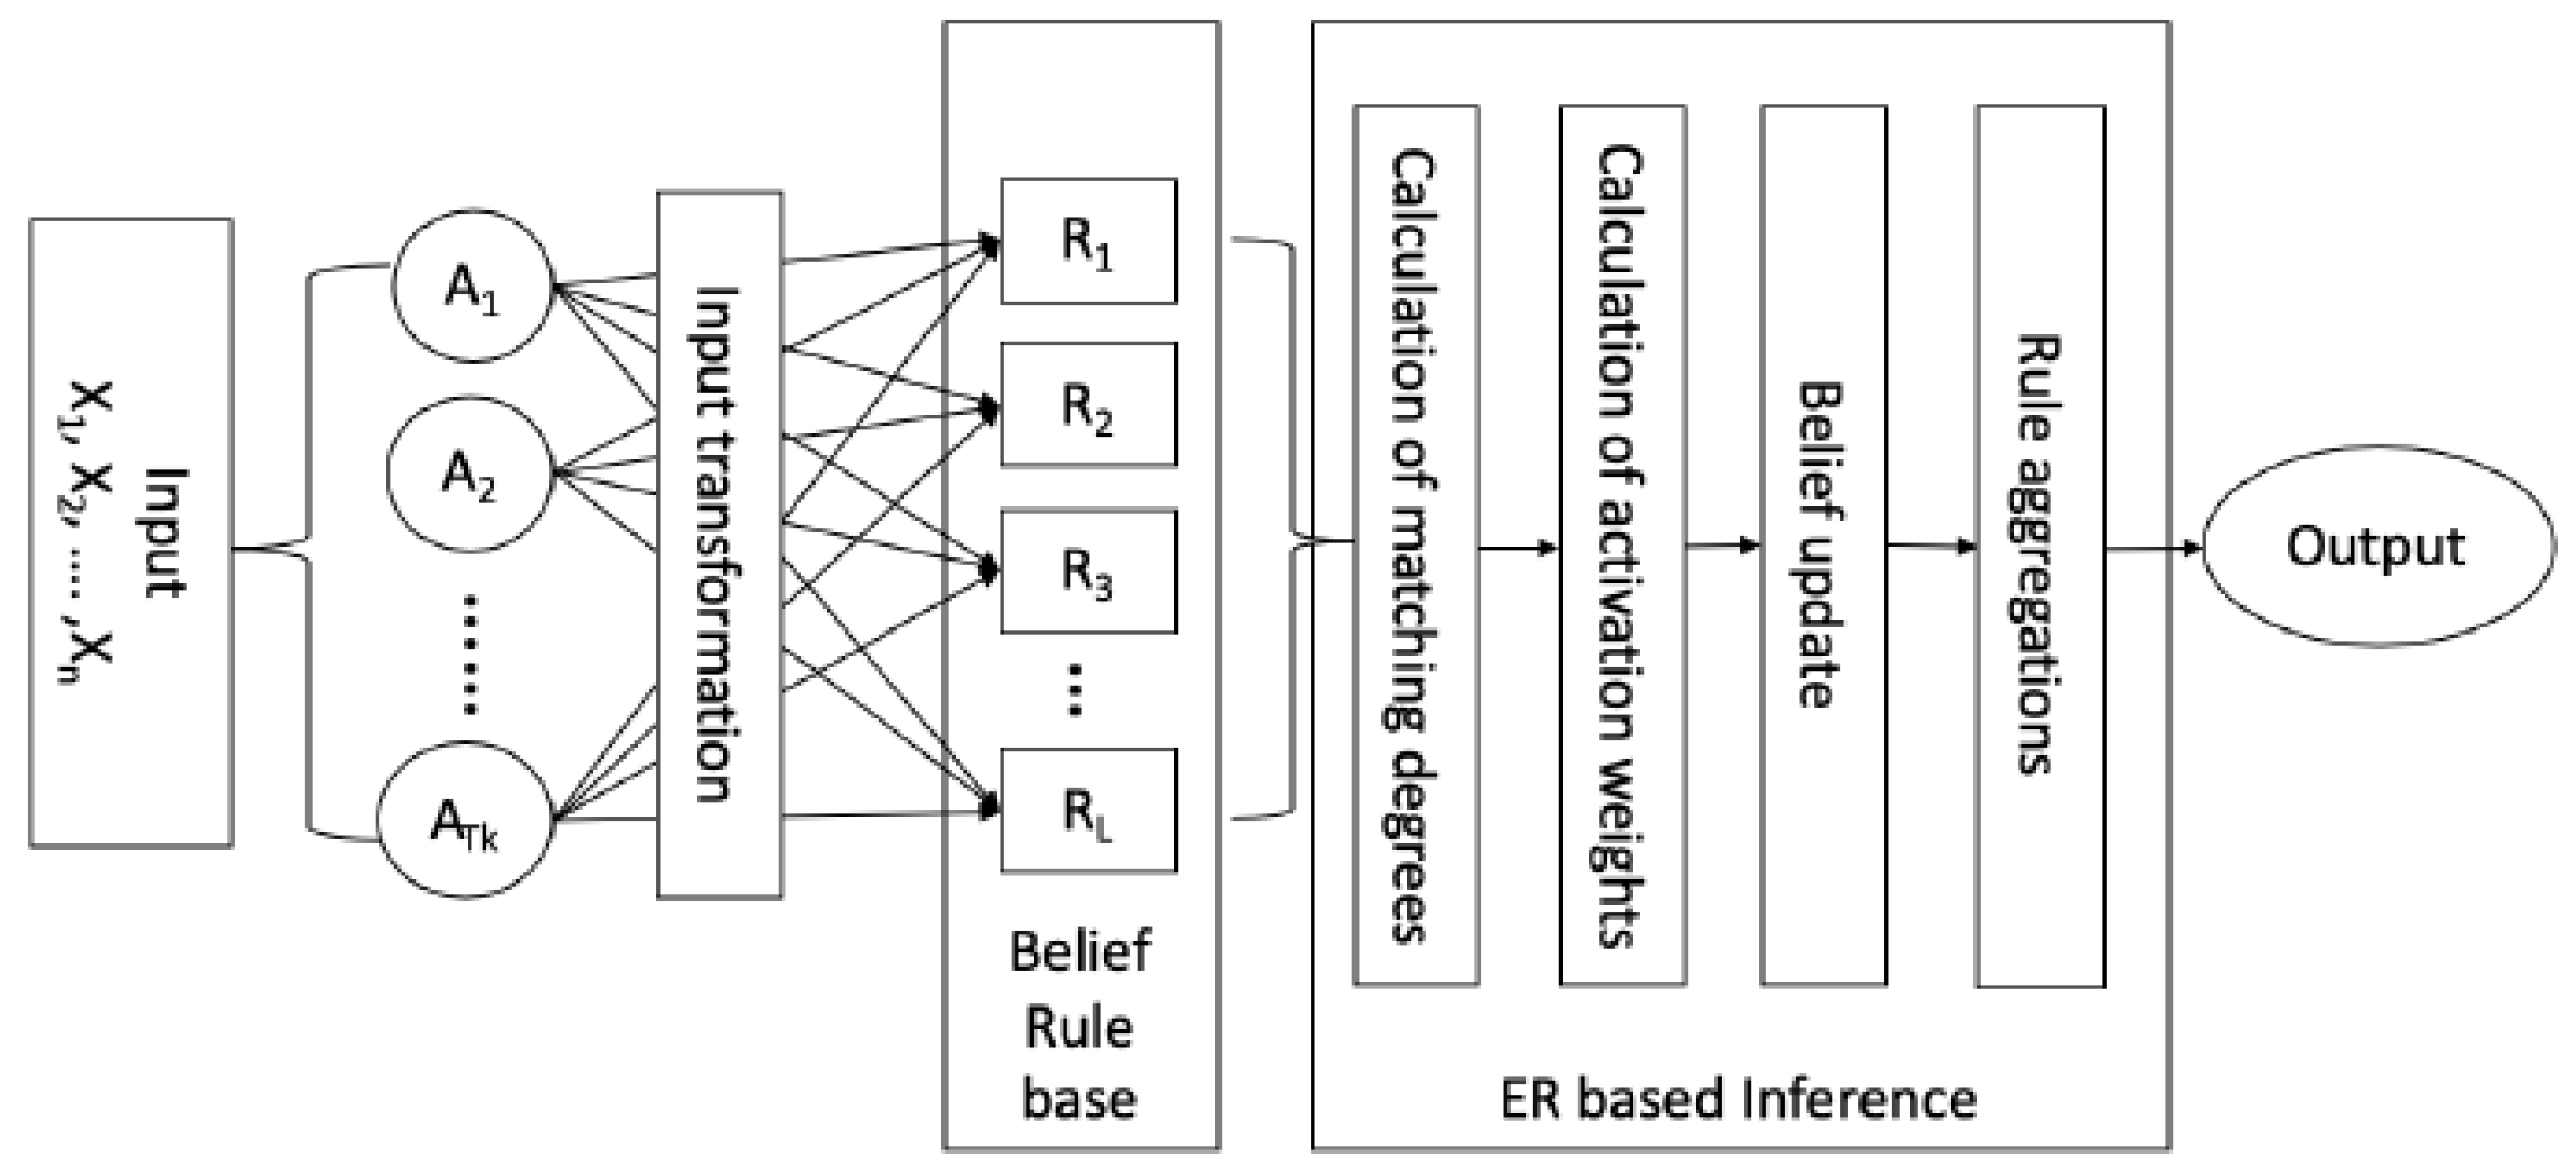
Inference with BRB using ER approach mainly includes four steps namely input transformation, calculation of individual matching degree, calculation of of activation weights, belief update, and rule aggregation as shown in Figure 1.
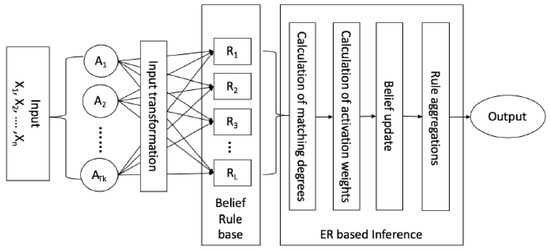
Figure 1.
Working process of BRBES.
3.2.1. Input Transformation and Individual Matching Degree Calculation
The numerical values or subjective judgments used as input to the antecedent variables are transformed to belief distributions on corresponding referential term associated with each attribute.This transformation can be done using rule- or utility-based equivalence transformation techniques [32]. For example, the numerical input value of the ith antecedent attribute is transformed as follows:
where is the jth referential term of the ith antecedent attribute, represents the utility value of is the degree to which the input belongs to the referential term with , and
Finally, the belief distribution over referential terms is represented as follows:
where M is the number of antecedent variable in the BRB and is the number of referential terms for the ith antecedent variable. Through this distribution, each referential value of the antecedent variables in the BRB will get a belief degree known as the individual matching degree that quantifies the amount of input value match with the associated referential values. When the individual matching degrees are assigned to the referential values of the kth rule, then the antecedent part of the rule can be defined as follows:
where and
3.2.2. Calculation of Activation Weight of Each Belief Rule
To quantify the overall impact of each belief rule in the inference process, an activation weight of each belief rule is calculated based on the weight associated with each rule and individual matching degrees of referential terms generated from then input transformation as described by (1). However, a belief rule may consists of more than one antecedent attributes linked with logical connectives AND or OR under conjunctive and disjunctive assumption respectively. Therefore, it is necessary to find out the combined matching degree of a rule considering all the antecedent attributes of the rule. The combined matching degree of a belief rule measures the degree to which the input vector matches the antecedent part of that rule and is computed integrating all the individual matching degrees associated with the rule. To do so, individual matching degrees of all the antecedent attributes in the kth rule need to be integrated using an aggregation function. Proper care should be taken in selection of the aggregation function. While “AND” connective is used to form the rule, the combined matching degree for the kth rule can be calculated using the following simple weighted multiplicative aggregation function:
Otherwise, if the “OR” connective is used for all the antecedents in a rule, then the combined matching degree for the kth rule is calculated using the following weighted sum aggregation function:
where is the normalized weight of the ith antecedent attribute with The contribution of an antecedent attribute towards is positively related to the weight of the attribute. In other words, an important attribute play greater role in determining [33]. Finally, the activation weight of the kth rule is generated by weighting and normalizing the combined matching degree given by (7) as
where represents the relative weight of the kth rule. Note that and . When the activation weight of a rule becomes zero, then the rule is not activated and it has no impact on the inference process [34].
3.2.3. Construction of BRB Expression Matrix
After calculating the rule activation weight for all the rules in the belief rule base, the knowledge in the belief rule can be summarized using a belief rule expression matrix shown in Table 2.
Table 2.
A belief rule expression matrix summarizing the information of the belief rule base with L belief rules and N consequent referential values.
In the next step, the inference procedure is implemented in order to combine all rules for generating the final belief degrees for based on the rule expression matrix [33].
3.2.4. Integration of Activated Belief Rule Using ER Algorithm
Based on the belief rule expression matrix shown in Table 2, the rules whose activation weight are not zero should be aggregated to generate a final belief distribution on all possible consequents or outcomes. The combined belief degree associated with the corresponding consequent can be calculated using the Analytical ER approach as shown in Equation (8):
The final belief distribution generated by ER is represented by …, , where is the final belief degree attached to the jth consequent after combining all activated rules in the BRB [17]. Afterward, the class with the largest belief degree is selected as the final derived result for the test input x as follows:
3.3. Training BRB with Historical Data
The objective of the optimization process is to find a set of parameters that reduce the classification error rate. This is achieved by minimizing the variance or deviation between the output from BRBES, which is known as simulated output , and the output from the real system, known as observed output as shown in Figure 2.
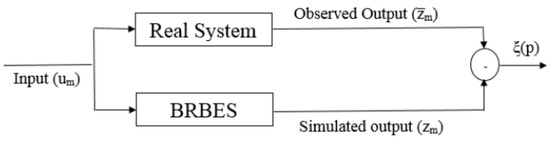
Figure 2.
Optimal learning process of BRBES.
A set of real-world dataset is used as the training data in the optimization process. The inference output of BRBES is compared with actual output for each training sample. Assume that T number of training samples are used to train the BRBES and BRBES provides inaccurate prediction for C samples using the parameter vector P. Then, the classification error rate of the BRBES can be denoted as follows:
The parameter vector P consists of L rule weights , M attribute weights , and N belief degree for each belief rule . Therefore, the parameter vector optimization model of BRBES can be described as follows:
where Equation (11) is the objective function used to minimize the classification error, Equations (12) and (13) are constrain on belief degree in the BRBES; Equations (14) and (15) are on the antecedent attribute weights and the rule weights, respectively; Equation (16) is the constrain on the utility values of the referential values of the antecedent attributes in the BRB; and denotes a small value to differentiate between two adjacent referential values for the th antecedent attribute in the BRBES. and are the lower and upper bounds of the mth antecedent attribute in the BRB, respectively. To solve the constrained optimization problem mentioned above, the optimization algorithm should be used. A modified differential evaluation (DE) based optimization algorithm is employed in this paper to optimize the BRB which is described in the following section.
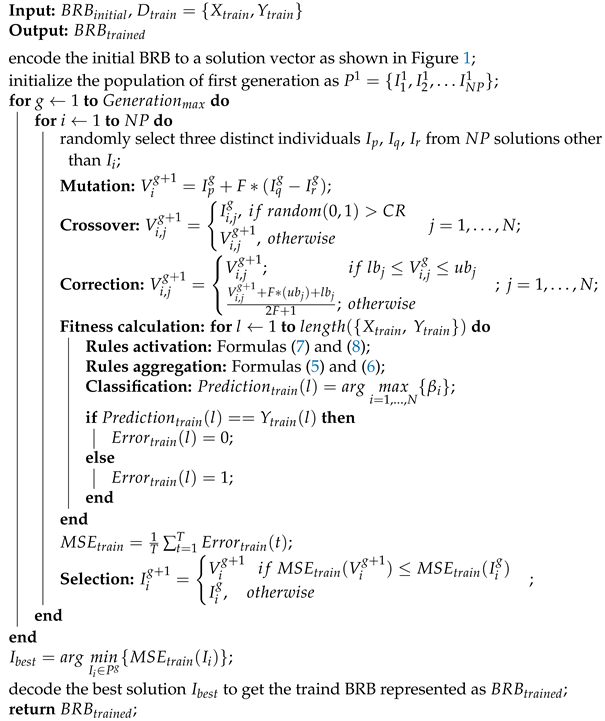
3.4. The Modified DE Algorithm
The original DE algorithm is a state-of-the-art-evolutionary algorithm for unconstrained nonlinear or non-convex continuous optimization problems. However, the optimization problem of BRB is constrained in nature. Therefore, the original DE algorithm is modified so that the optimal parameters can meet the constrains. The modified DE consists of the following operations.
Mutation: For any parameter vector in the population at generation t which is basically a belief rule base consists of knowledge representation parameters attribute weights, rule weights and consequent belief degree encoded as a solution vector as shown in Figure 1, three parameter vectors, , , and , which are distinct from each other as well as from , are randomly selected from parameter vectors to generate so-called donor vector as follows:
where F is a constant known as mutation operator. Normally, and is more stable and efficient [35].
Crossover: The crossover operation is performed between two parameter vectors and using the following equation:
where is the ith parameter in the cth parameter vector and N is the total number of parameter in a vector. is the crossover probability which controls the mutated value. Normally is an appropriate choice [35].
Correction: The parameter value in the newly generated parameter vector may not satisfy the constraints shown in Equations (12)–(16) as its mutation operation is based on the differential information between the parameter vectors. Therefore, it is necessary to correct the value of parameters. Correction of constraints shown in Equations (13)–(15) are performed using the following formula:
To ensure that the lth belief rule is complete meaning that the summation of degree of beliefs associated with all the consequents in lth rule is one as shown in Equation (12), further, the following correction is carried out:
where . is the corrected degree of belief associated with the ith consequent in lth belief rule. The donor vector is updated with .
Selection: The newly generated parameter vector is basically a belief rule base that consists of knowledge representation parameters attribute weights, rule weights, and consequent belief degree that satisfied all the constrains shown in Equations (12)–(16) and can be used to generate inferential output for any input following the steps discussed in Section 3.2. Therefore, the objective function in Equation (11) can be evaluated using the parameter vector to find its fitness . Similarly, the fitness of parameter vector is evaluated. Two fitness values are then compared to select which parameter vector will enter the next generation as follows:
Equation (23) ensures that parameter vector with the minimum objective value is chosen for next generation. The parameter learning algorithm for BRB with DE is shown in Algorithm 1.
| Algorithm 1: Optimization of BRB with Modified DE. |
 |
4. Experiments
4.1. Dataset
The dataset used in this study was collected by the authors of [19] from Tongji Hospital located in the region of Wuhan, China. The dataset includes the epidemiological, demographic, clinical, laboratory, and mortality outcome information collected from the medical records of 485 patients. In this study, to develop the predictive model, we consider three laboratory information: lactic dehydrogenase (LDH), lymphocytes, and high-sensitivity C-reactive protein (h-CRP) of a patient as features. Among the patients, those who are transferred to ICU are considered critical patients and the rest of the patients are considered normal in this study. Therefore, the dataset consists of 110 positive instances (critical) and 375 negative(normal) samples.
4.2. Experimental Settings
The real patient data described in Section 4.1 are used to performs different set of experiments to validate the proposed method and to compare its performance with others state-of-art methods. Fivefold cross-validation technique is performed to train and test all the predictive models to avoid the effect of the data imbalance as well as to avoid overfitting and underfitting. The dataset was split into five folds where each fold contains roughly the same proportion of the two types of outcome. A single fold out of five folds is kept to test the model while the remaining four folds are used to train the model The performance of the proposed method is evaluated in terms of three criteria—accuracy, specificity, and sensitivity. These are widely used performance measure matrices for classification problem. The metrics are calculated based on the confusion matrix shown in the Table 3.
Table 3.
Confusion matrix for COVID-19 severity prediction.
Accuracy is defined as the ratio of total number of prediction that are correct [36].
Sensitivity is the proportion of positive observed values (critical patient) correctly predicted as positive (critical) [36].
Specificity is the proportion of negative tuples (non-severe patients) are correctly identified [36].
Besides, the ROC curve is used for comprehensive and visual comparison of different classifiers’ performance [37]. In the ROC curve, the area under the curve (AUC) is calculated to estimate the accuracy of the classifier where a larger AUC value indicates higher accuracy [38]. Python programming language [39] (version 3.6.1) is used for implementation of Conjunctive and Disjunctive BRB.
The first experiment was perform to compare the prediction performance of Conjunctive and Disjunctive to select the best BRB model.
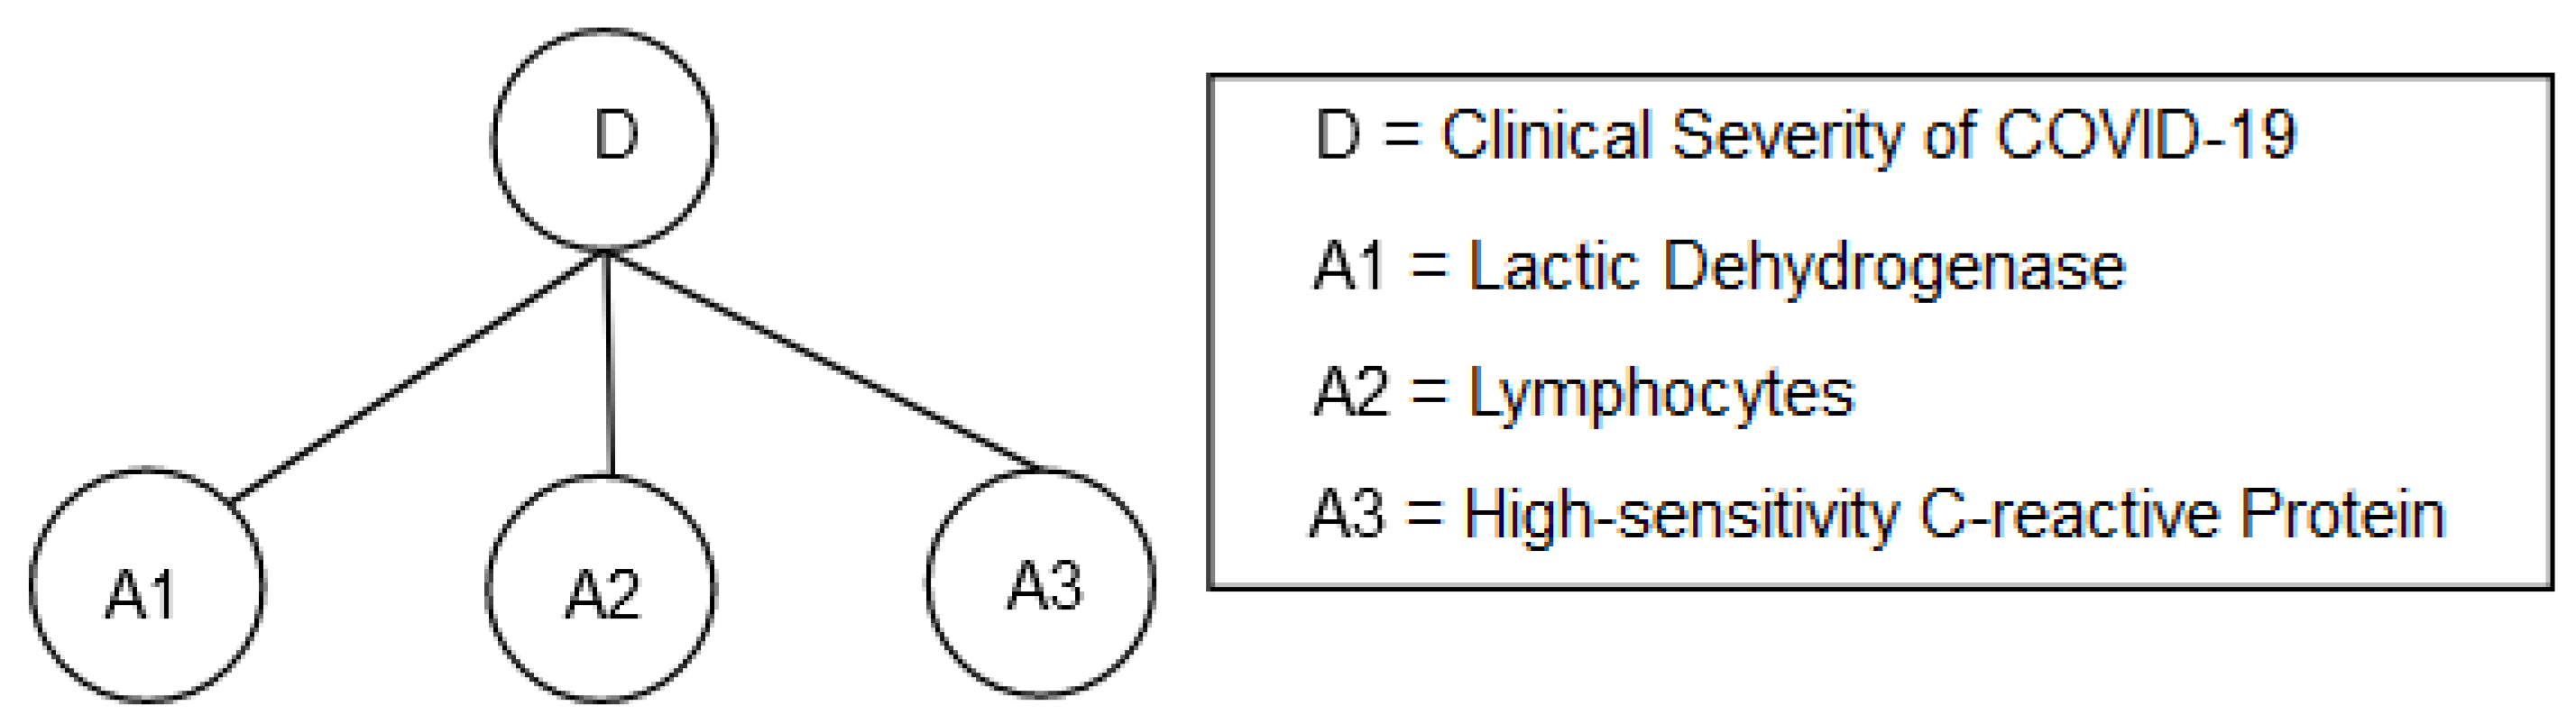
The BRB model is depicted in Figure 3 where lactic dehydrogenase (LDH), lymphocytes, and high-sensitivity C-reactive protein (hs-CRP) are antecedent attributes while the clinical severity of COVID-19 was considered as the consequent attribute. The referential points and their initial numerical values for all antecedent attributes are shown in Table 4, Table 5 and Table 6. The referential points and corresponding numerical values for both the antecedent and consequent attributes are determined based on the suggestions of a group of physicians who have practical experience in COVID-19 patient treatment.
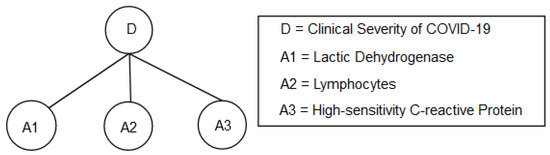
Figure 3.
BRB model for clinical severity of COVID-19.
Table 4.
The referential points and corresponding numerical values of antecedent lactic dehydrogenase (LDH).
Table 5.
The referential points and corresponding numerical values of antecedent lymphocytes.
Table 6.
The referential points and corresponding numerical values of antecedent high-sensitivity C-reactive protein (hs-CRP).
Eventually, the initial conjunctive belief rule base (CBRB) consisting of 125 rules and disjunctive belief rule base (DBRB) consisting of five rules are shown in Table 7 and Table 8. According to the physicians, all the belief rules are not equally important for COVID-19 clinical severity prediction. Some rules are most significant while others are less significant. Therefore, different weights are assigned to the rules of initial BRBs to quantify the rule’s importance.
Table 7.
Initial conjunctive belief rule base.
Table 8.
Initial disjunctive belief rule base.
The weights of all the antecedent attributes lactic dehydrogenase (LDH), lymphocytes, and high-sensitivity C-reactive protein (hs-CRP) are set to 1 for both CBRB and DBRB as all of them are equally important for predicting clinical severity of COVID-19. Initial numerical values of referential points, rule weight, attributes weight, and consequent belief degrees in CBRB and DBRB are optimized according to the optimization model shown in Equations (11)–(18) using the DE algorithm. For each BRB model, DE was run for 2000 generations with 100 individuals in each generation. In both case, the crossover probability (R) and mutation factor (F) are set to and , respectively.
The second experiment was design to compare the performance of proposed method with four traditional machine learning techniques namely, decision tree (DT), support vector machine (SVM), logistic regression (LR), and artificial neural network. All the traditional machine-learning algorithms are implemented using Scikit-learn package in Python [40]. The neural network (NN) architecture consists of two hidden layers with 10 and 5 neurons, respectively. The number of hidden layers and neurons in each layer are determined empirically. Each neuron of two hidden layers uses the sigmoid activation to address nonlinearity of data. The hidden layers are followed by an output layer consisting of a single neuron with sigmoid activation functions to predict the category. The network is trained for 100 iterations using Adam algorithm to optimize binary cross entropy loss function with a learning rate of 0.001.
For SVM, since our dataset is small, we used a linear kernel to avoid overfitting. Besides, we empirically selected the value of C as 1.25 which optimizes the margin of the hyperplane and thereby minimizes misclassification on training data.
The logistic regression is implemented using binary cross-entropy as the loss function with l2 penalization. We used the lbfgs optimizer with a learning rate of 0.001 to minimize the binary cross-entropy loss.
For the Decision Tree (DT), we used the Gini-index as the splitting criteria and maximum depth was set to 3 so that the model can avoid overfitting. Other parameters for all the models are kept default as in the scikit learn. A summary of the hyperparameters settings of different machine learning models used in this study for comparison is shown in the Table 9.
Table 9.
Hyperparameters settings of different machine learning models.
5. Result and Discussion
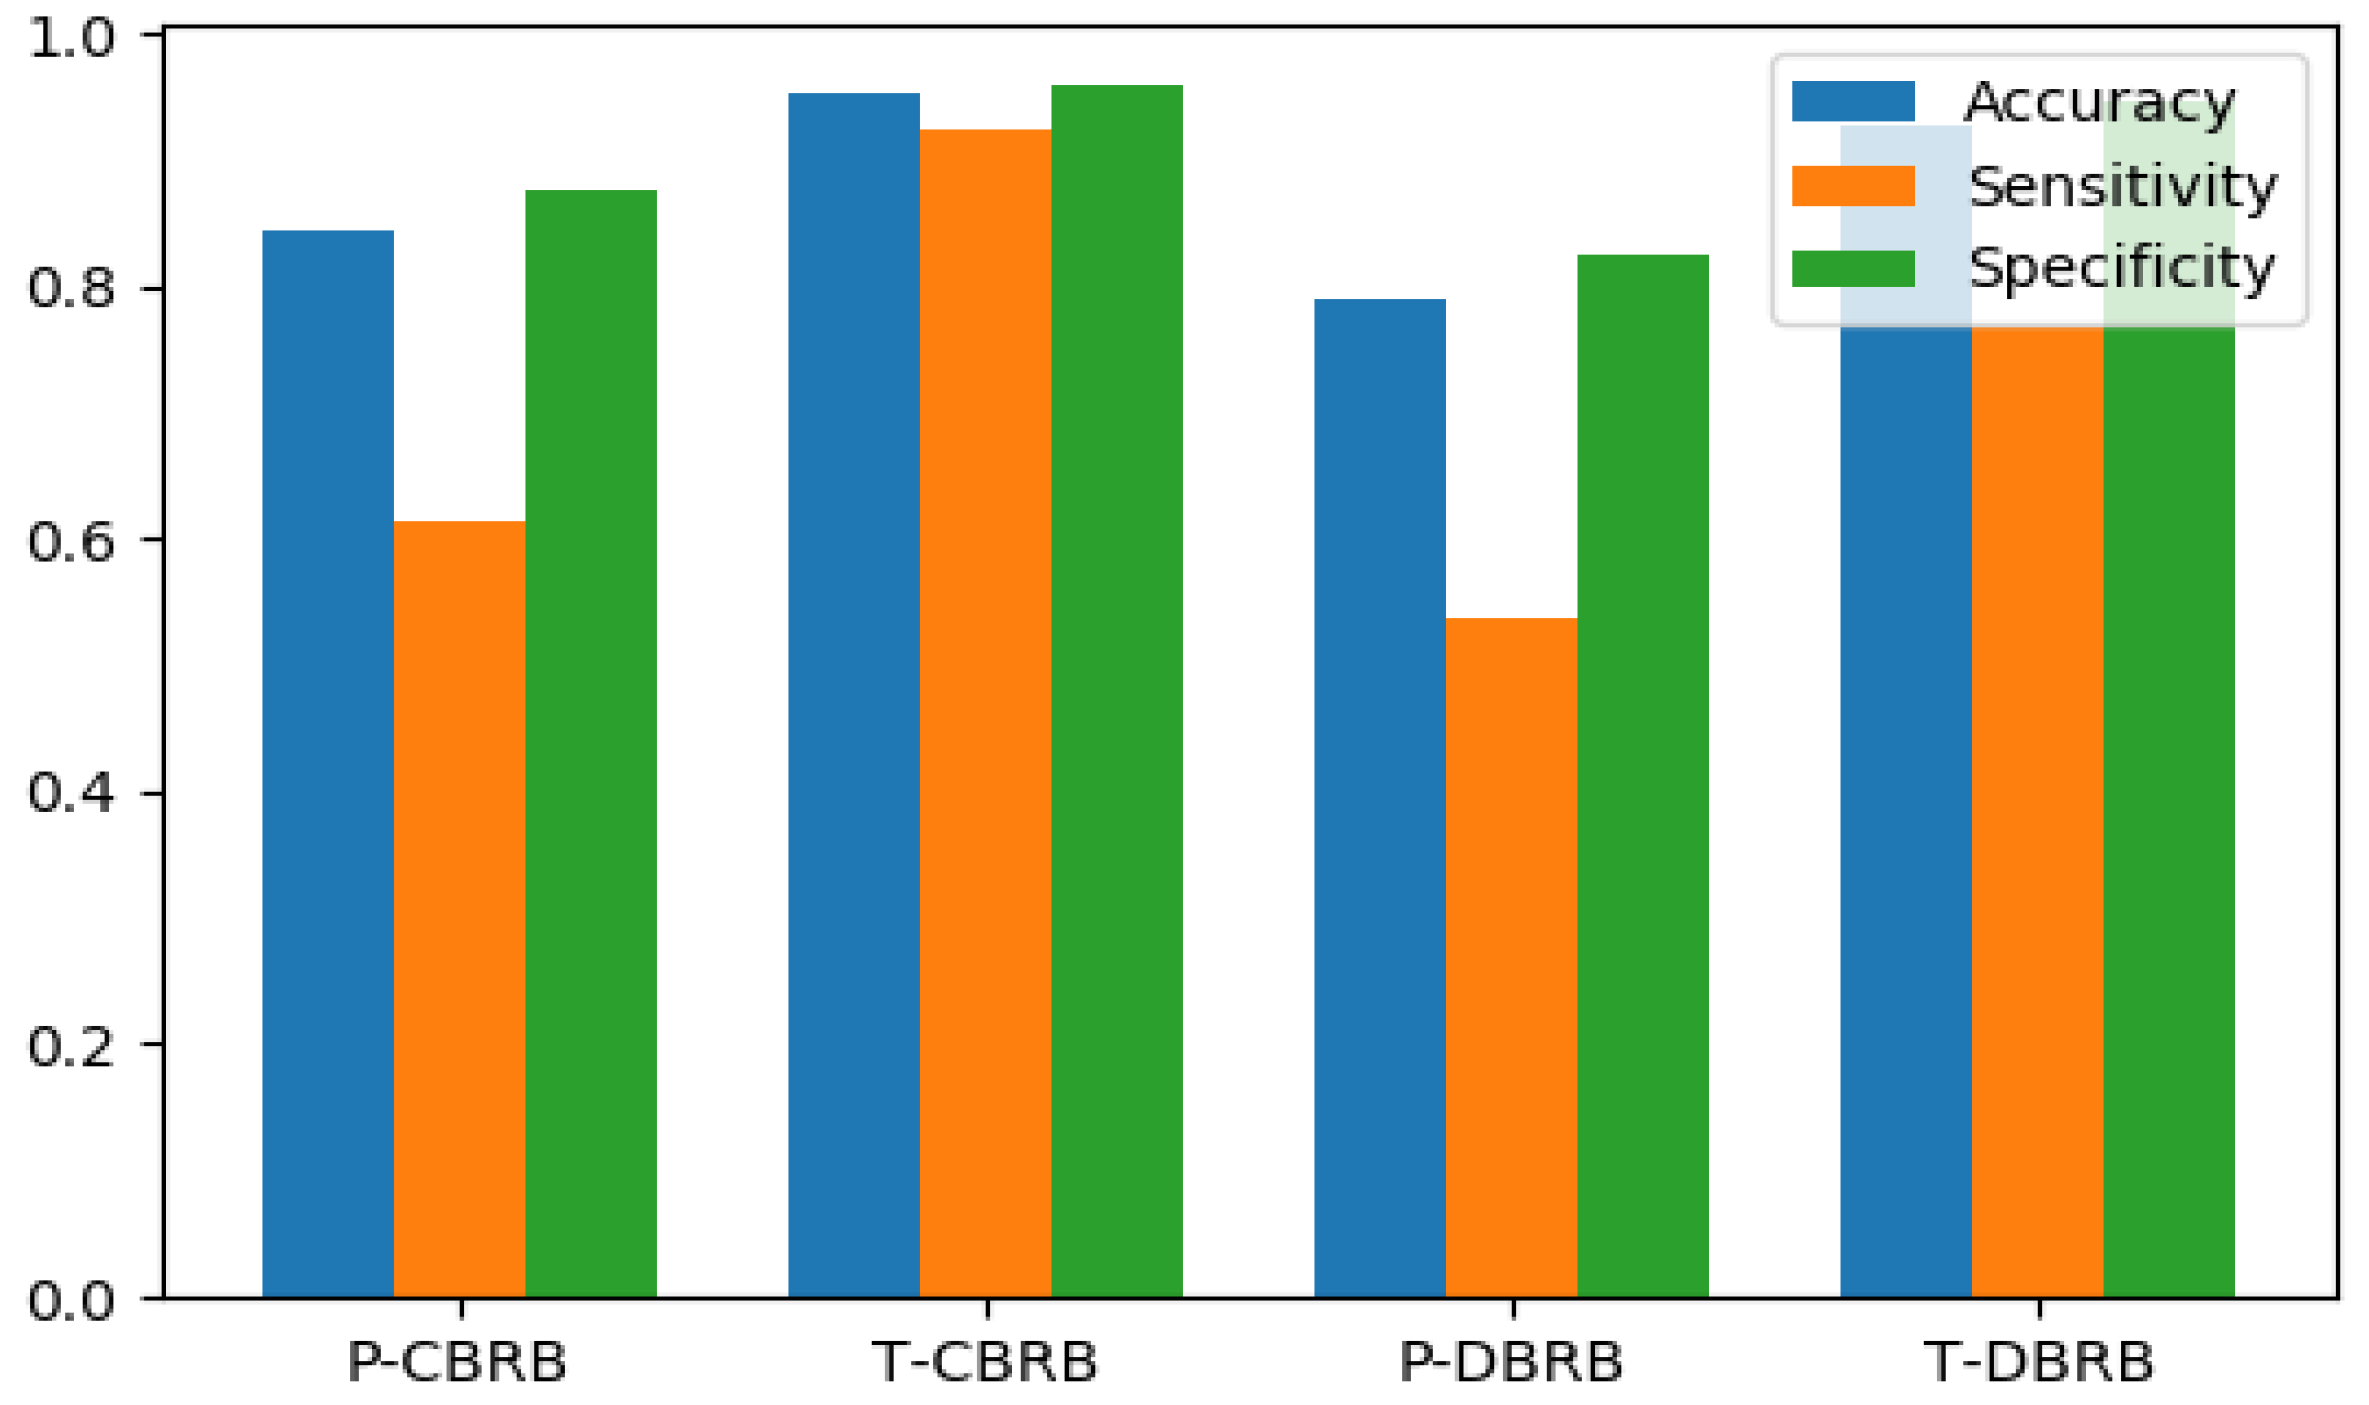
Four indices including accuracy, specificity and sensitivity for pre-trained CBRB, pretrained DBRB, trained CBRB and trained DBRB which are labelled as P-CBRB, P-DBRB, T-CBRB, and T-DBRB, respectively, are shown in Table 10. These results are shown graphically in Figure 4.
Table 10.
Comparision among different BRB models.
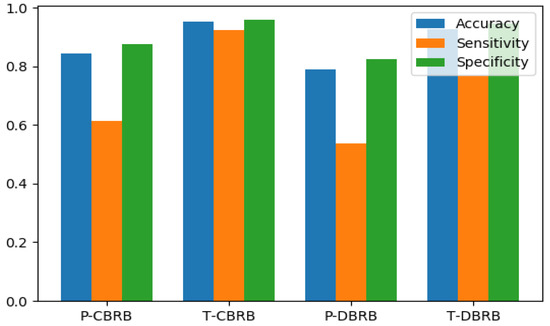
Figure 4.
Comparison of Accuracy, Sensitivity and Specificity for P-CBRB, T-CBRB, P-DBRB, and T-DBRB.
As shown in Table 10, all the evaluation indices are higher for CBRB than DBRB before and after training. This is because CBRB has large number of knowledge representation parameters compared to DBRB. Therefore, more expert knowledge can be modeled through CBRB which can better map the nonlinear casual relationship between the antecedents and consequent. Table 10 also shows that accuracy of T-CBRBES and T-DBRBES is 0.954 and 0.927, respectively, which is greatly higher than P-CBRBES and P-DBRBES (0.845 and 0.791, respectively). The other two indices—sensitivity and specificity—show a similar pattern. This demonstrates the effectiveness of the DE base optimization technique for both types of the BRBES; it also indicates that the initial BRBs provided by domain experts significantly deviated from the reality and further reveals that DE can fine tuned the initial knowledge base provided by domain expert using a historical data set such a way that can reflect the real situation more accurately. Above all, the trained CBRB performs better than all other BRB models and is utilized in the rest of the experiments. In order to further testify the effectiveness of the proposed BRBES in identifying severe and non-severe COVID-19, it is compared with five state-of-the-art machine learning algorithms including logistic regression (LR), support vector machine (SVM), neural network (NN), and decision tree (DT).
The comparison results are shown in Table 11. The comparison results of proposed BRBES with traditional machine learning algorithms are graphically shown in Figure 5.
Table 11.
Comparison among different machine learning algorithms.
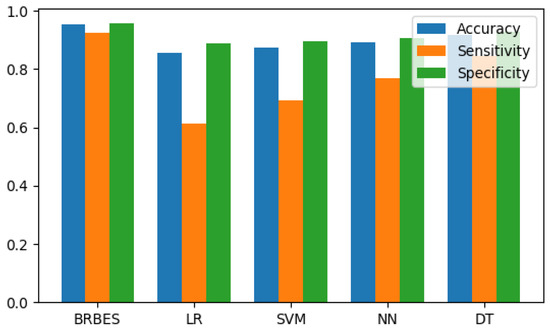
Figure 5.
Comparison of accuracy, sensitivity, and specificity for BRBES (T-CBRB), LR, SVM, NN, and DT.
According to the result presented in Table 11, the BRBES perform better in classification than all the aforementioned machine learning algorithms. The accuracy of BRBES is approximately 11%, 9%, 7%, and 3% higher than LR, SVM, NN, and DT, respectively. The other two matrices (i.e., sensitivity and specificity) of BRBES are also better than other methods to a large margin. All these aforementioned results prove that BRBES outperforms the traditional machine learning algorithms in early prediction of COVID-19 clinical severity.
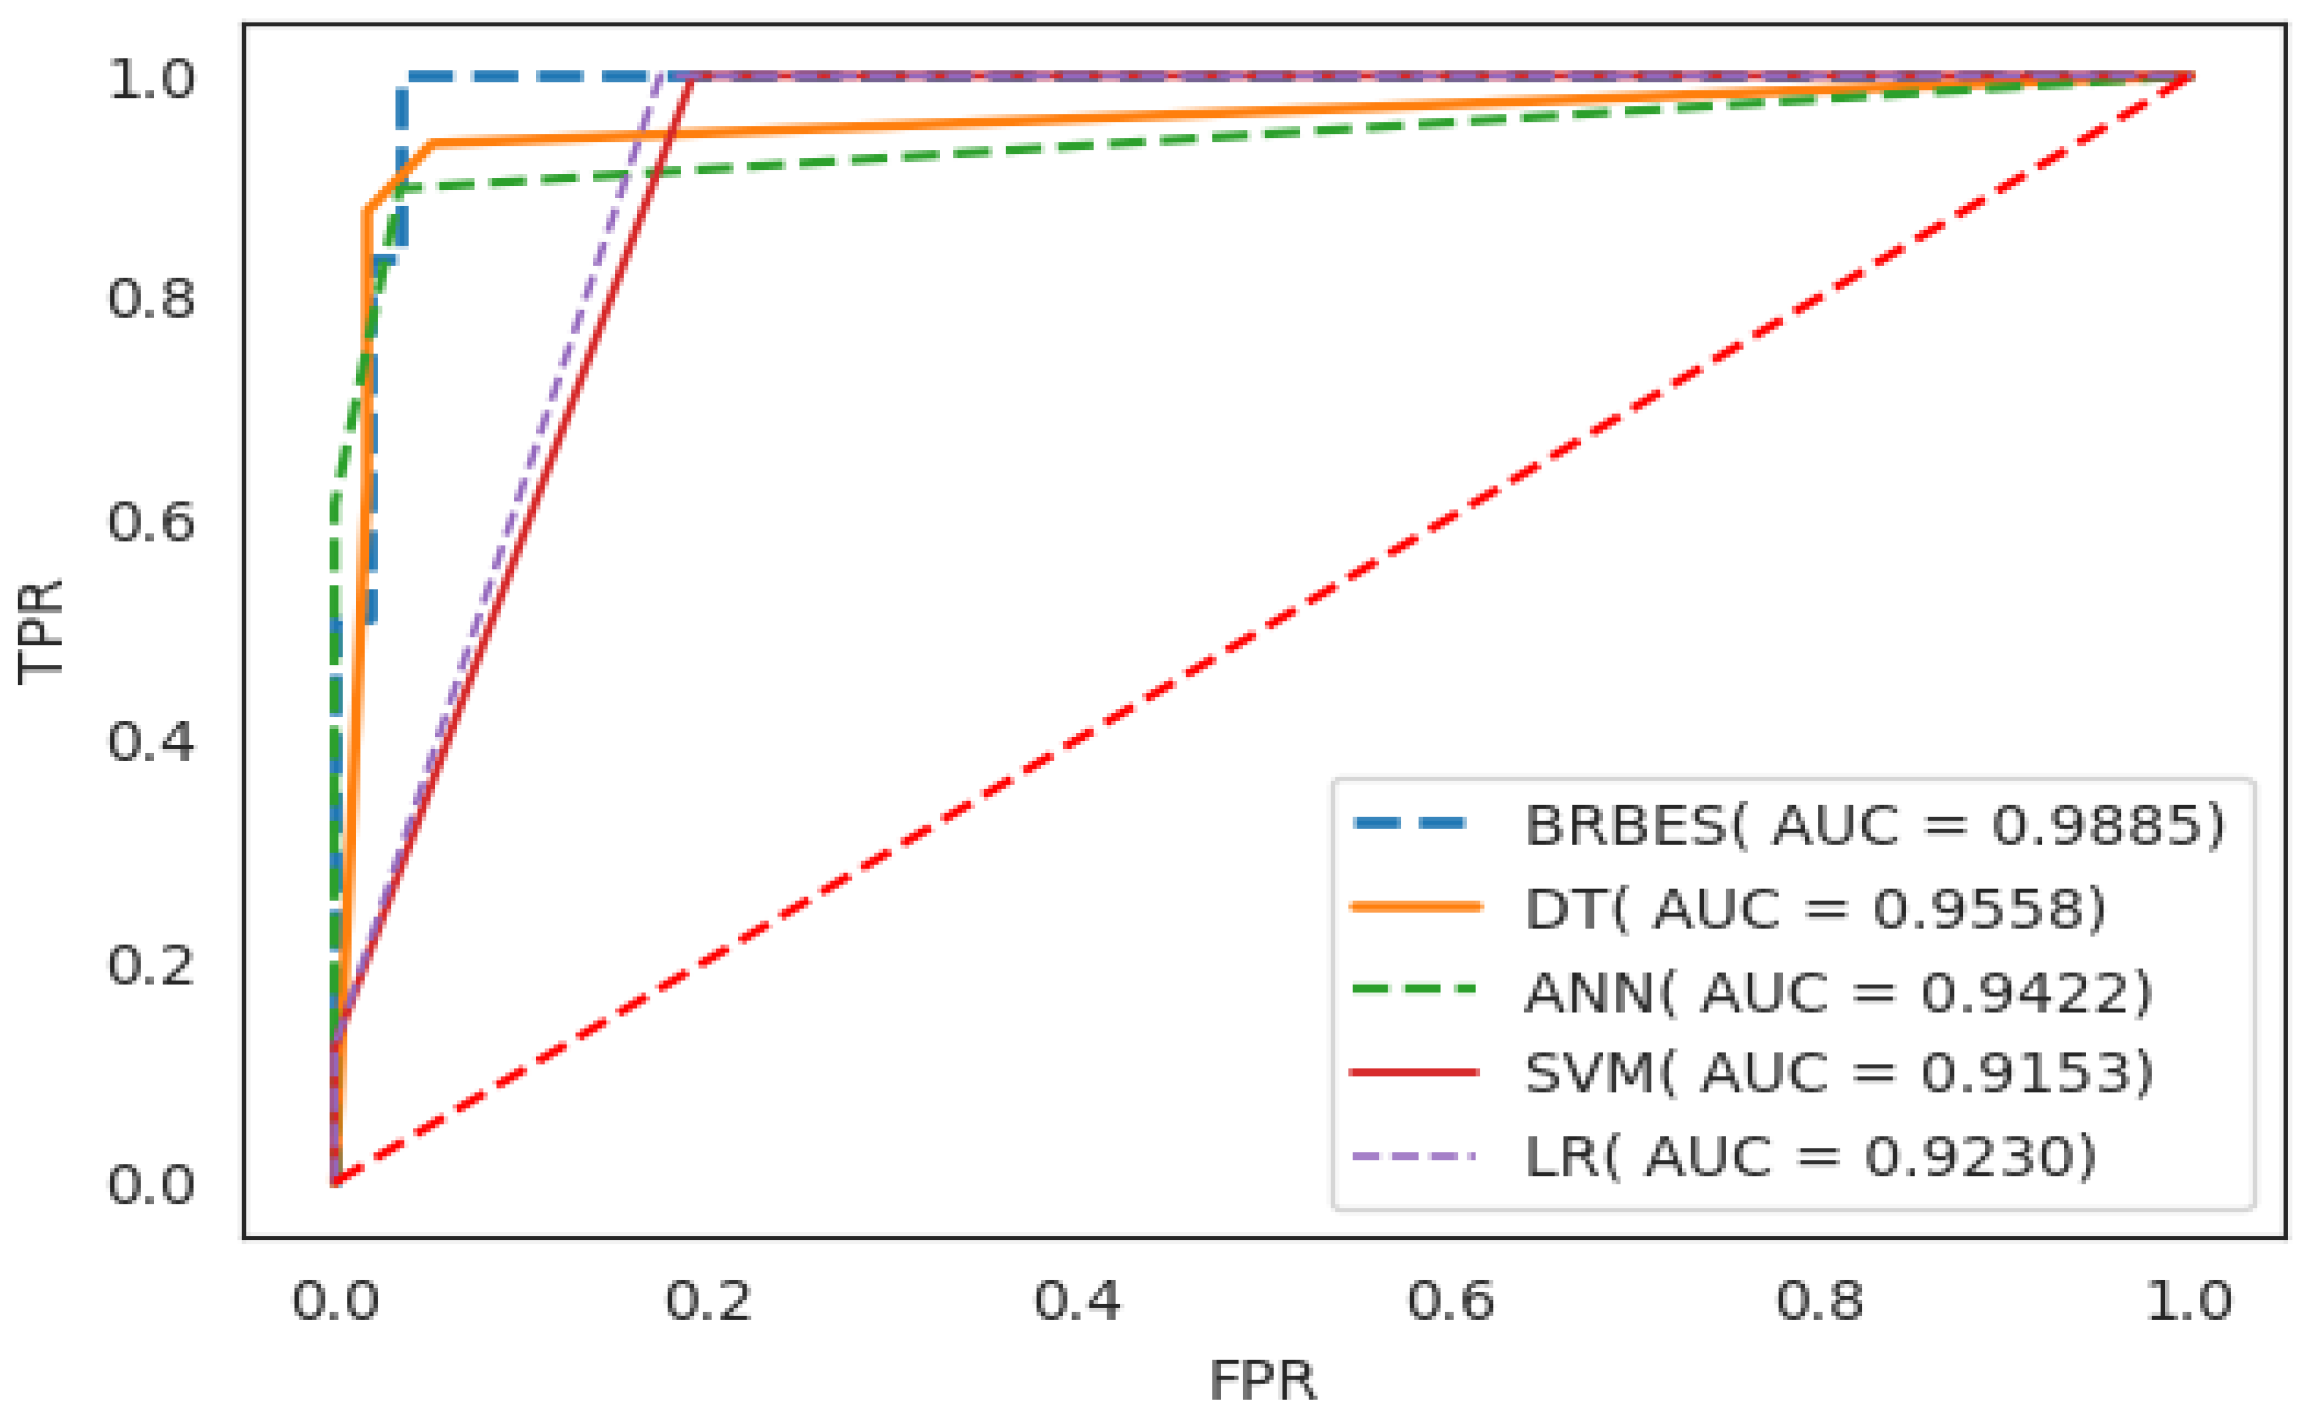
Finally, the ROC curves and AUC values for the classifiers mentioned above—BRBES, SVM, LR, NN, and DR—are shown in Figure 6 to clearly compare their performance. The AUC values for BRBES, DT, ANN, SVM, and LR are 0.9885, 0.9558, 0.9422, 0.9153, and 0.9230, respectively. It is evident that our proposed BRBES achieved better performance in both ROC curves and AUC values than all the traditional machine learning algorithms compared in this study. Moreover, the standard deviation of BRBES is the lowest among all the methods which demonstrate that our proposed method is more stable than traditional machine learning algorithms. This is because unlike BRBES, the machine learning algorithms are data-driven; they rely just on data to predict the outcome, whereas BRBES is both a data-driven and knowledge-driven approach. The experts knowledge about the domain can be integrate in the BRBES in the form of belief rule base which can be later fine-tuned using different optimization techniques utilizing historical data to imitate the real situation. Thus, BRBES predicts the outcome base on both expert knowledge and data. Moreover, BRBES can address different types of uncertainty like incompleteness, ignorance, vagueness, imprecision, and ambiguity, which is not true for traditional machine learning algorithms. Therefore, we can conclude that the ability to take into account the expert knowledge in the inference process and handling different type of uncertainty in data are the secrete behind the superior performance of BRBES.

Figure 6.
Comparision of BRBES (T-CBRB) with traditional machine learning algorithms.
6. Conclusions
This paper proposed a COVID-19 severity prediction method based on the belief rule-based expert system. The proposed method can integrate the advantages of knowledge-based plus data-driven approaches in a single framework that is more suitable for COVID-19 severity identification. The initial belief rule base is established by expert knowledge which is further optimized by COVID-19 patients’ data using a modified differential evolution algorithm. The results of the experiments conducted on real patients’ data demonstrate that the method is feasible and accurate. We find that the conjunctive belief rule base CDSS is more effective than the disjunctive one. The conjunctive belief rule base CDSS achieved accuracy, sensitivity, and specificity of 0.954, 0.923, and 0.959, respectively, which is significantly higher than the traditional machine learning approaches. In future, other factors that may influence the clinical severity prediction of COVID-19 can be addressed. Moreover, other optimization algorithms and even hybridization of them as well as other dataset can be explored. Federated learning in COVID-19 severity prediction can be addressed also for preserving the privacy of the patients. Furthermore, we have a plan to extend the proposed CDSS for other diseases that people will have to face as the result of viruses’ mutations. Further research can be done to make the system more versatile so that it can predict the COVID-19 severity for different nationalities having different immune systems.
Author Contributions
F.A.: conceptualization, data curation, methodology, validation, visualization, software, formal analysis, writing—original draft preparation, resources; M.S.H.: supervision, methodology, investigation, validation, project administration, writing—review and editing; R.U.I.: supervision, investigation, validation, writing—review; K.A.: supervision, investigation, validation, resources, project administration, writing—review and editing, funding acquisition. All authors have read and agreed to the published version of the manuscript.
Funding
This research received no external funding.
Institutional Review Board Statement
Not applicable.
Informed Consent Statement
Not applicable.
Data Availability Statement
Data set used in this study is available on request from the corresponding author.
Conflicts of Interest
The authors declare no conflict of interest.
Abbreviations
The following abbreviations are used in this manuscript:
| BRBES | Belief Rule-Based Expert System |
| CBRB | Conjunctive Belief Rule Base |
| DBRB | Disjunctive Belief Rule Base |
| CDSS | Clinical Decision Support System |
| DE | Differential Evolution |
| SVM | Support Vector Machine |
| DT | Decision Tree |
| ANN | Artificial Neural Network |
| LR | Logistic Regression |
References
- Gao, Y.; Li, T.; Han, M.; Li, X.; Wu, D.; Xu, Y.; Zhu, Y.; Liu, Y.; Wang, X.; Wang, L. Diagnostic utility of clinical laboratory data determinations for patients with the severe COVID-19. J. Med. Virol. 2020, 92, 791–796. [Google Scholar] [CrossRef]
- Tan, L.; Wang, Q.; Zhang, D.; Ding, J.; Huang, Q.; Tang, Y.Q.; Wang, Q.; Miao, H. Lymphopenia predicts disease severity of COVID-19: A descriptive and predictive study. Signal Transduct. Target. Ther. 2020, 5, 1–3. [Google Scholar] [CrossRef]
- Velavan, T.P.; Meyer, C.G. Mild versus severe COVID-19: Laboratory markers. Int. J. Infect. Dis. 2020, 95, 304–307. [Google Scholar] [CrossRef] [PubMed]
- Jiang, X.; Coffee, M.; Bari, A.; Wang, J.; Jiang, X.; Shi, J.; Dai, J.; Cai, J.; Zhang, T.; Wu, Z.; et al. Towards an artificial intelligence framework for data-driven prediction of coronavirus clinical severity. Comput. Mater. Contin. 2020, 63, 537–551. [Google Scholar] [CrossRef]
- Ohlsson, M. WeAidU—A decision support system for myocardial perfusion images using artificial neural networks. Artif. Intell. Med. 2004, 30, 49–60. [Google Scholar] [CrossRef]
- Garg, A.X.; Adhikari, N.K.; McDonald, H.; Rosas-Arellano, M.P.; Devereaux, P.J.; Beyene, J.; Sam, J.; Haynes, R.B. Effects of computerized clinical decision support systems on practitioner performance and patient outcomes: A systematic review. JAMA 2005, 293, 1223–1238. [Google Scholar] [CrossRef]
- Tan, C.; Huang, Y.; Shi, F.; Tan, K.; Ma, Q.; Chen, Y.; Jiang, X.; Li, X. C-reactive protein correlates with CT findings and predicts severe COVID-19 early. J. Med. Virol. 2020, 92, 856–862. [Google Scholar] [CrossRef] [PubMed] [Green Version]
- Yadollahpour, A.; Nourozi, J.; Mirbagheri, S.A.; Simancas-Acevedo, E.; Trejo-Macotela, F.R. Designing and implementing an ANFIS based medical decision support system to predict chronic kidney disease progression. Front. Physiol. 2018, 9, 1753. [Google Scholar] [CrossRef]
- Vieira, S.M.; Mendonça, L.F.; Farinha, G.J.; Sousa, J.M. Modified binary PSO for feature selection using SVM applied to mortality prediction of septic patients. Appl. Soft Comput. 2013, 13, 3494–3504. [Google Scholar] [CrossRef]
- Finkelstein, J.; Cheol Jeong, I. Machine learning approaches to personalize early prediction of asthma exacerbations. Ann. N. Y. Acad. Sci. 2017, 1387, 153. [Google Scholar] [CrossRef]
- Yao, J.; Dwyer, A.; Summers, R.M.; Mollura, D.J. Computer-aided diagnosis of pulmonary infections using texture analysis and support vector machine classification. Acad. Radiol. 2011, 18, 306–314. [Google Scholar] [CrossRef] [Green Version]
- Zafeiris, D.; Rutella, S.; Ball, G.R. An artificial neural network integrated pipeline for biomarker discovery using Alzheimer’s disease as a case study. Comput. Struct. Biotechnol. J. 2018, 16, 77–87. [Google Scholar] [CrossRef] [PubMed]
- Harjai, S.; Khatri, S.K. An intelligent clinical decision support system based on artificial neural network for early diagnosis of cardiovascular diseases in rural areas. In Proceedings of the 2019 Amity International Conference on Artificial Intelligence (AICAI), Dubai, United Arab Emirates, 4–6 February 2019; pp. 729–736. [Google Scholar]
- Er, O.; Temurtas, F.; Tanrıkulu, A.Ç. Tuberculosis disease diagnosis using artificial neural networks. J. Med. Syst. 2010, 34, 299–302. [Google Scholar] [CrossRef]
- Schrag, A.; Siddiqui, U.F.; Anastasiou, Z.; Weintraub, D.; Schott, J.M. Clinical variables and biomarkers in prediction of cognitive impairment in patients with newly diagnosed Parkinson’s disease: A cohort study. Lancet Neurol. 2017, 16, 66–75. [Google Scholar] [CrossRef] [Green Version]
- Anooj, P. Clinical decision support system: Risk level prediction of heart disease using weighted fuzzy rules. J. King Saud Univ. Comput. Inf. Sci. 2012, 24, 27–40. [Google Scholar] [CrossRef] [Green Version]
- Kong, G.; Xu, D.L.; Body, R.; Yang, J.B.; Mackway-Jones, K.; Carley, S. A belief rule-based decision support system for clinical risk assessment of cardiac chest pain. Eur. J. Oper. Res. 2012, 219, 564–573. [Google Scholar] [CrossRef]
- Wang, Y.M.; Yang, L.H.; Fu, Y.G.; Chang, L.L.; Chin, K.S. Dynamic rule adjustment approach for optimizing belief rule-base expert system. Knowl. Based Syst. 2016, 96, 40–60. [Google Scholar] [CrossRef]
- Yan, L.; Zhang, H.T.; Goncalves, J.; Xiao, Y.; Wang, M.; Guo, Y.; Sun, C.; Tang, X.; Jing, L.; Zhang, M.; et al. An interpretable mortality prediction model for COVID-19 patients. Nat. Mach. Intell. 2020, 2, 283–288. [Google Scholar] [CrossRef]
- Wu, J.; Roy, J.; Stewart, W.F. Prediction modeling using EHR data: Challenges, strategies, and a comparison of machine learning approaches. Med. Care 2010, 48, S106–S113. [Google Scholar] [CrossRef]
- Cooper, G.F.; Aliferis, C.F.; Ambrosino, R.; Aronis, J.; Buchanan, B.G.; Caruana, R.; Fine, M.J.; Glymour, C.; Gordon, G.; Hanusa, B.H.; et al. An evaluation of machine-learning methods for predicting pneumonia mortality. Artif. Intell. Med. 1997, 9, 107–138. [Google Scholar] [CrossRef]
- Wu, C.; Rosenfeld, R.; Clermont, G. Using data-driven rules to predict mortality in severe community acquired pneumonia. PLoS ONE 2014, 9, e89053. [Google Scholar] [CrossRef] [PubMed] [Green Version]
- Clermont, G.; Angus, D.C.; DiRusso, S.M.; Griffin, M.; Linde-Zwirble, W.T. Predicting hospital mortality for patients in the intensive care unit: A comparison of artificial neural networks with logistic regression models. Crit. Care Med. 2001, 29, 291–296. [Google Scholar] [CrossRef]
- Ghassemi, M.; Naumann, T.; Doshi-Velez, F.; Brimmer, N.; Joshi, R.; Rumshisky, A.; Szolovits, P. Unfolding physiological state: Mortality modelling in intensive care units. In Proceedings of the 20th ACM SIGKDD International Conference on Knowledge Discovery and Data Mining, New York, NY, USA, 24–27 August 2014; pp. 75–84. [Google Scholar]
- Johnson, A.E.; Pollard, T.J.; Mark, R.G. Reproducibility in critical care: A mortality prediction case study. In Proceedings of the Machine Learning for Healthcare Conference, Boston, MA, USA, 18–19 August 2017; pp. 361–376. [Google Scholar]
- Batista, A.d.M.; Miraglia, J.; Donato, T.; Chiavegatto Filho, A.; de Moraes Batista, A.F.; Miraglia, J.L.; Donato, T.H.R.; Chiavegatto Filho, A.D.P. COVID-19 diagnosis prediction in emergency care patients: A machine learning approach. In Hospital Israelita Albert Einstein-Big Data Analytics M; Department of Epidemiology SoPH, University of Sao Paulo: São Paulo, Brazil, 2020. [Google Scholar]
- Schwab, P.; Schütte, A.D.; Dietz, B.; Bauer, S. predCOVID-19: A Systematic Study of Clinical Predictive Models for Coronavirus Disease 2019. arXiv 2020, arXiv:2005.08302. [Google Scholar]
- Alakus, T.B.; Turkoglu, I. Comparison of deep learning approaches to predict COVID-19 infection. Chaos Solitons Fractals 2020, 140, 110120. [Google Scholar] [CrossRef]
- Yip, S.S.; Klanecek, Z.; Naganawa, S.; Kim, J.; Studen, A.; Rivetti, L.; Jeraj, R. Performance and Robustness of Machine Learning-based Radiomic COVID-19 Severity Prediction. medRxiv 2020. [Google Scholar] [CrossRef]
- Chen, Y.; Ouyang, L.; Bao, F.S.; Li, Q.; Han, L.; Zhu, B.; Ge, Y.; Robinson, P.; Xu, M.; Liu, J.; et al. An Interpretable Machine Learning Framework for Accurate Severe vs. Non-Severe COVID-19 Clinical Type Classification. 2020. SSRN 3638427. Available online: https://papers.ssrn.com/sol3/papers.cfm?abstract_id=3638427 (accessed on 2 May 2021).
- Yao, H.; Zhang, N.; Zhang, R.; Duan, M.; Xie, T.; Pan, J.; Peng, E.; Huang, J.; Zhang, Y.; Xu, X.; et al. Severity detection for the coronavirus disease 2019 (COVID-19) patients using a machine learning model based on the blood and urine tests. Front. Cell Dev. Biol. 2020, 8, 683. [Google Scholar] [CrossRef]
- Yang, J.B. Rule and utility based evidential reasoning approach for multiattribute decision analysis under uncertainties. Eur. J. Oper. Res. 2001, 131, 31–61. [Google Scholar] [CrossRef]
- Yang, J.B.; Liu, J.; Wang, J.; Sii, H.S.; Wang, H.W. Belief rule-base inference methodology using the evidential reasoning approach-RIMER. IEEE Trans. Syst. Man Cybern. Part Syst. Hum. 2006, 36, 266–285. [Google Scholar] [CrossRef]
- Hossain, M.S.; Rahaman, S.; Kor, A.L.; Andersson, K.; Pattinson, C. A belief rule based expert system for datacenter pue prediction under uncertainty. IEEE Trans. Sustain. Comput. 2017, 2, 140–153. [Google Scholar] [CrossRef] [Green Version]
- Price, K.; Storn, R.M.; Lampinen, J.A. Differential Evolution: A Practical Approach to Global Optimization; Springer Science & Business Media: Berlin/Heidelberg, Germany, 2006. [Google Scholar]
- Mining, W.I.D. Data mining: Concepts and techniques. Morgan Kaufinann 2006, 10, 559–569. [Google Scholar]
- Bradley, A.P. The use of the area under the ROC curve in the evaluation of machine learning algorithms. Pattern Recognit. 1997, 30, 1145–1159. [Google Scholar] [CrossRef] [Green Version]
- Islam, R.U.; Hossain, M.S.; Andersson, K. A novel anomaly detection algorithm for sensor data under uncertainty. Soft Comput. 2018, 22, 1623–1639. [Google Scholar] [CrossRef] [Green Version]
- Python Programming Language. In Proceedings of the USENIX Annual Technical Conference, Santa Clara, CA, USA, 17–22 June 2007; Volume 41, p. 36. Available online: https://thereaderwiki.com/en/Python_(programming_language) (accessed on 2 May 2021).
- Pedregosa, F.; Varoquaux, G.; Gramfort, A.; Michel, V.; Thirion, B.; Grisel, O.; Blondel, M.; Prettenhofer, P.; Weiss, R.; Dubourg, V.; et al. Scikit-learn: Machine learning in Python. J. Mach. Learn. Res. 2011, 12, 2825–2830. [Google Scholar]


Publisher’s Note: MDPI stays neutral with regard to jurisdictional claims in published maps and institutional affiliations. |
© 2021 by the authors. Licensee MDPI, Basel, Switzerland. This article is an open access article distributed under the terms and conditions of the Creative Commons Attribution (CC BY) license (https://creativecommons.org/licenses/by/4.0/).