Article

Microscopic Mechanism of the Macroscopic Mechanical Properties of Cement Modified Subgrade Silty Soil Subjected to Freeze-Thaw Cycles

1
School of Transportation, Jilin University, Changchun 130022, China
2
School of Transportation Science and Engineering, Jilin Jianzhu University, Changchun 130118, China
*
Author to whom correspondence should be addressed.
Appl. Sci. 2020, 10(6), 2182; https://doi.org/10.3390/app10062182
Submission received: 4 February 2020 / Accepted: 20 March 2020 / Published: 23 March 2020

Abstract

:
In order to study the effects of the microstructure parameters of cement modified subgrade silty soil (CMSS) in a frozen area under freeze-thaw (F-T) cycles on the macroscopic mechanical properties, the static triaxial test, scanning electron microscopy (SEM), and grey relation analysis (GRA) were implemented on silty soil modified with 0% and 2% cement at optimum moisture content from the northwest in Jilin Province in China. The results showed that the shear strength, the cohesion of 0% and 2% CMSS, decreased with the increase of F-T cycles, while the internal friction angle was not obviously changed. The shear strength and its parameters of 2% CMSS doubled compared to that of 0% CMSS. The micro-parameters, representing the particle morphological characteristics, particle arrangement, and pore characteristics of CMSS, changed differently under F-T cycles. If the cement was not added, the cohesion and the internal friction angle were most sensitive to the average particle diameter (Dp) and the average particle abundance (C), respectively. When the cement content was 2%, the cohesion was chiefly affected by the particle size fractal dimension (Dps), while the internal friction angle was mainly related to the average pore diameter (Dh). The main principle of cement improvement was to decrease Dh of soil under F-T cycles.

1. Introduction

The area of the Chinese territory covered by frozen soil is the third largest in the world, of which the seasonally frozen area is 5.137 × 10⁶ km2, accounting for 53.5% of the country’s land area [1,2], widely distributed in the northeast and northwest. The freezing and thawing cause the strength of the subgrade soil to decrease during the spring-thaw period, resulting in the part or all of the bearing capacity being lost, thereby reducing the pavement quality. The silty soil as a widely distributed subgrade material in the northeast of China is exposed to at least one freeze-thaw (F-T) cycle each year. Because it has low natural moisture content, a small plasticity index, and weak shear strength, these make it sensitive to frost heave and water stabilities [3,4]. In general, the subgrade material in the seasonally frozen area filled with silty soil has the problems of large settlement deformation and difficult compaction, so it is necessary to modify it before using as the subgrade material [5,6,7,8,9].
At present, most of the excellent fillers are used to improve the quality of the subgrade material. However, due to the lack of high-quality fillers along the road, the transportation costs will cause a significant increase in engineering costs. Therefore, the use of a modifier to improve the soil is a very effective method. The modifiers for improved soil are still mainly cement, lime, fly ash, and so on, in domestic and foreign applications [10]. According to the relevant literature, the macro-mechanical properties and frost resistance of cement modified soil are better than those of the other modified soils: the cohesion of cement modified soil was 2~3 times that of lime modified soil at the same F-T times and cooling temperature [11]. The cohesion, shear strength, and California Bearing Ratio (CBR) values of cement modified soil were significantly higher than those of lime modified soil at an equal blend ratio [12,13,14,15]. The improvement of shear strength in Libyan silt soil by lime was only within a certain range, and the improvement in compressibility with cement was more obvious [16]. The unconfined compressive strength of modified soil increased as the cement content and cement age increased, while it increased first and then decreased with the increasing amount of fly ash [17]. The strength of cement modified soil was high in the early stage and increased obviously in the later stage, which could effectively reduce the subgrade maintenance costs and prolong its service life under the long-term F-T cycles. Hence, the cement modified silty soil was chosen as the research objective.
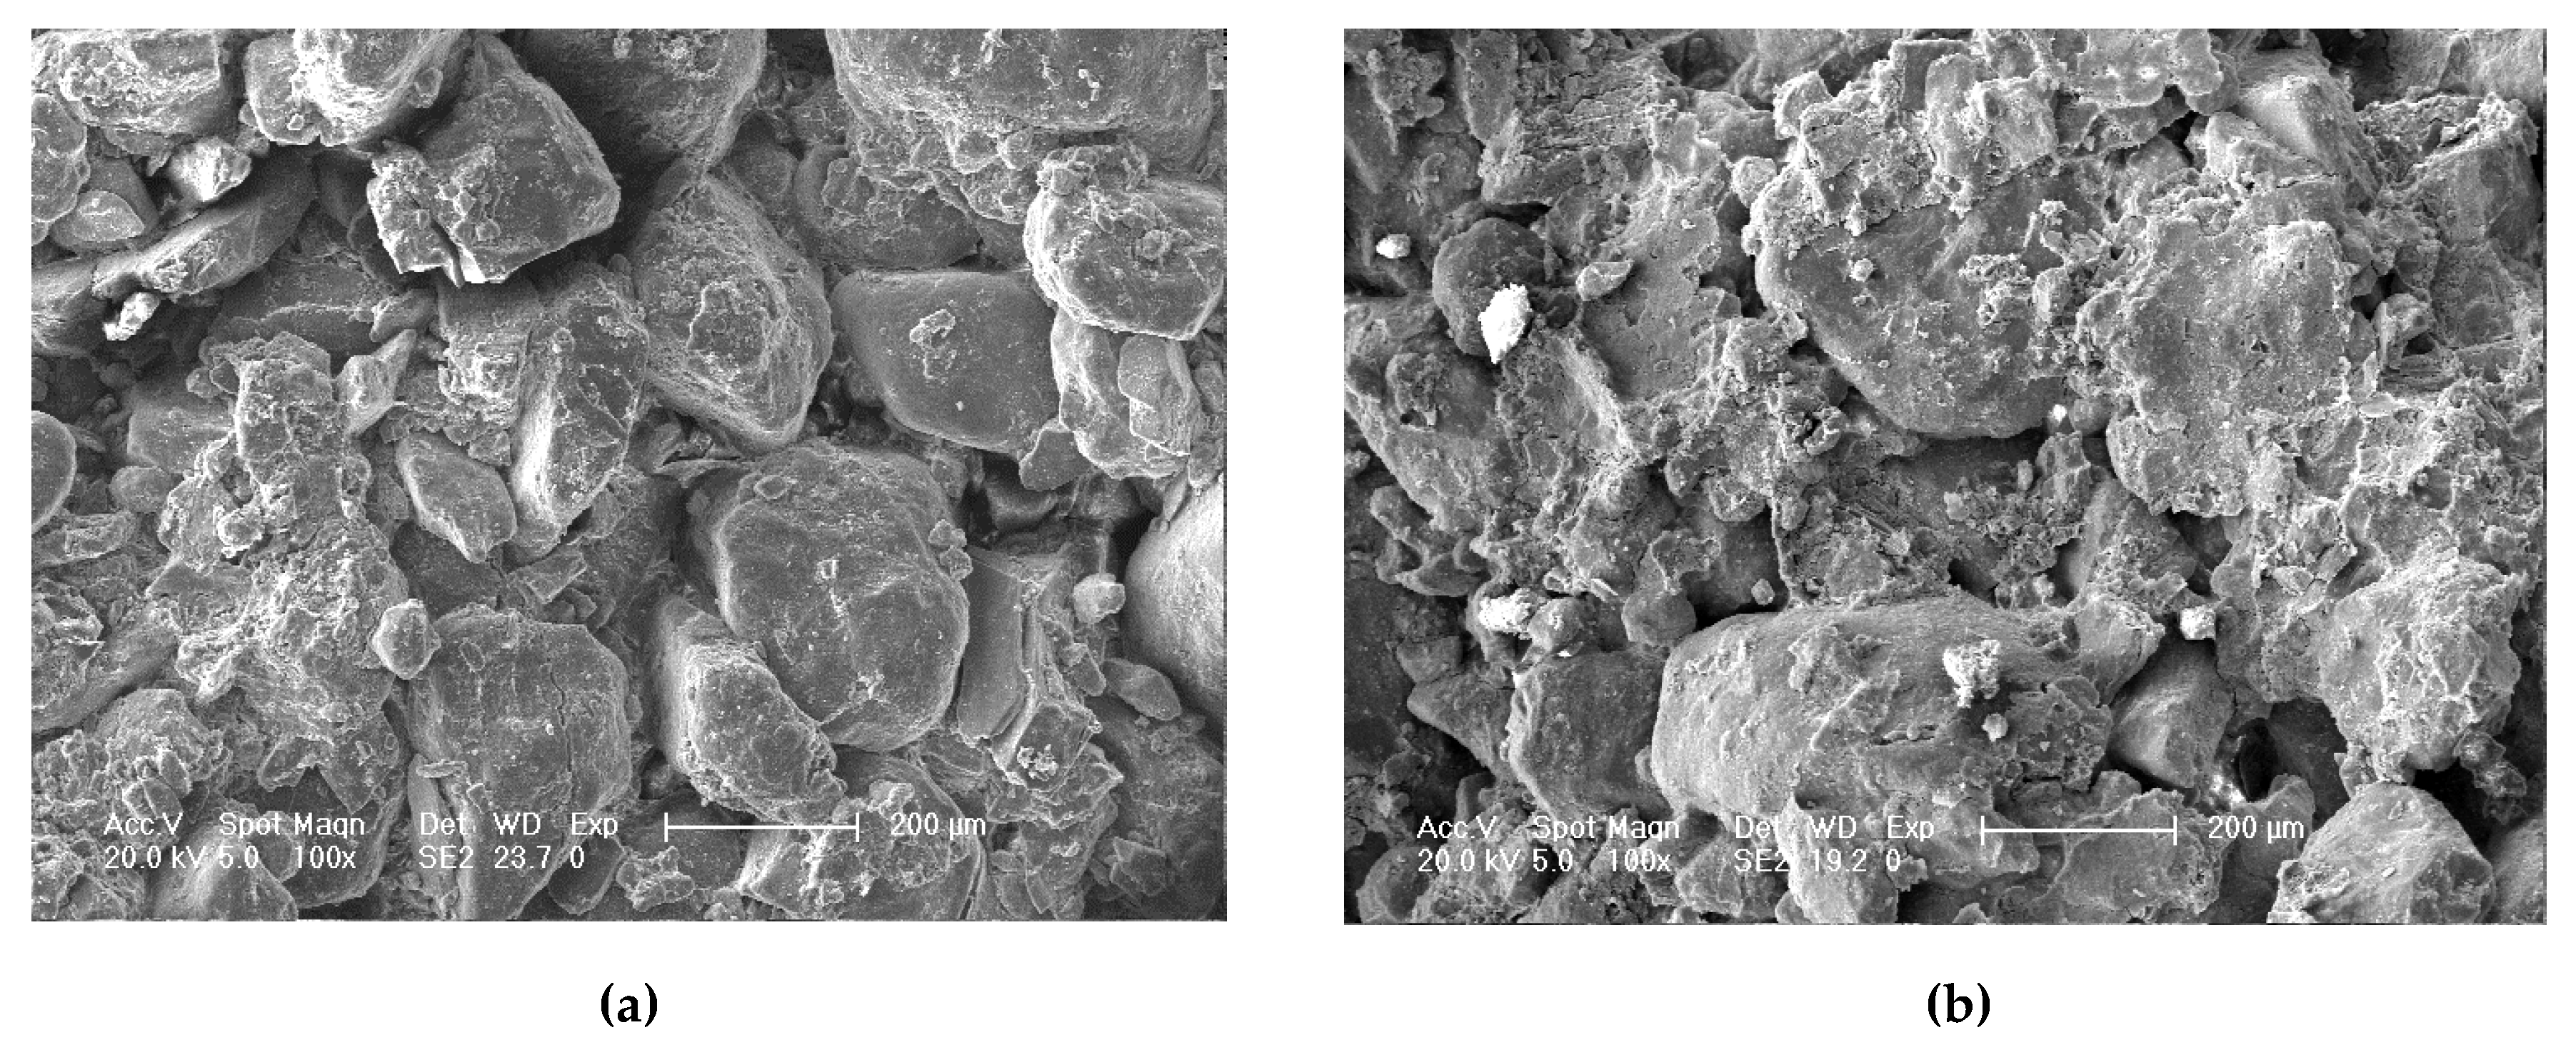
The microstructure properties of soil include the size, shape, and surface characteristics and the connection and arrangement of the particles. To study the intrinsic nature of the physical and mechanical behaviors, the variation of the soil microstructure, which largely affects the engineering properties of the soil, must be grasped. The study methods for the microstructure mainly include optical microscopy, X-ray diffraction (XRD), mercury intrusion, gas adsorption, and scanning electron microscopy (SEM). Among these methods, SEM is widely used because it can precisely obtain the size, shape, arrangement, and pore development inside the microstructure unit [18,19,20].
Currently, many researchers are purely analyzing the factors affecting the microstructure while the effect of F-T cycles and the modifier are little involved, as well as the microscopic mechanism of the mechanical properties is rarely demonstrated. Only the characteristics of lime modified soil with larger pores could be influenced by the water content and compaction of the soil [21]. The physicochemical factors that made up the micro level and how it affected soil behaviors have been discussed [22]. A laboratory study about the behavior of Brasilia subgrade lateritic soil showed that the pore size distribution was a bimodal curve and changed with the compression, which also indicated that the microstructure was strongly related to the mechanical behavior [23]. The impact of nanosilica on the microstructure and mechanical characteristics of cemented sandy soil was investigated by atomic force microscopy (AFM), SEM, and XRD tests. The results indicated that the addition of nanosilica with the optimum percentage to cement stabilized sandy soil could enhance its mechanical and microstructure properties [24]. The microstructural behavior of Brasilia clay was studied by the bimodal pore size distribution (PSD) analyses, and the bimodal van Genuchten curve was used to perform the model of the PSD curves. The loading and the compacting had no influence on the micro-pores of soil, and the changes only occurred on the macro-pores [
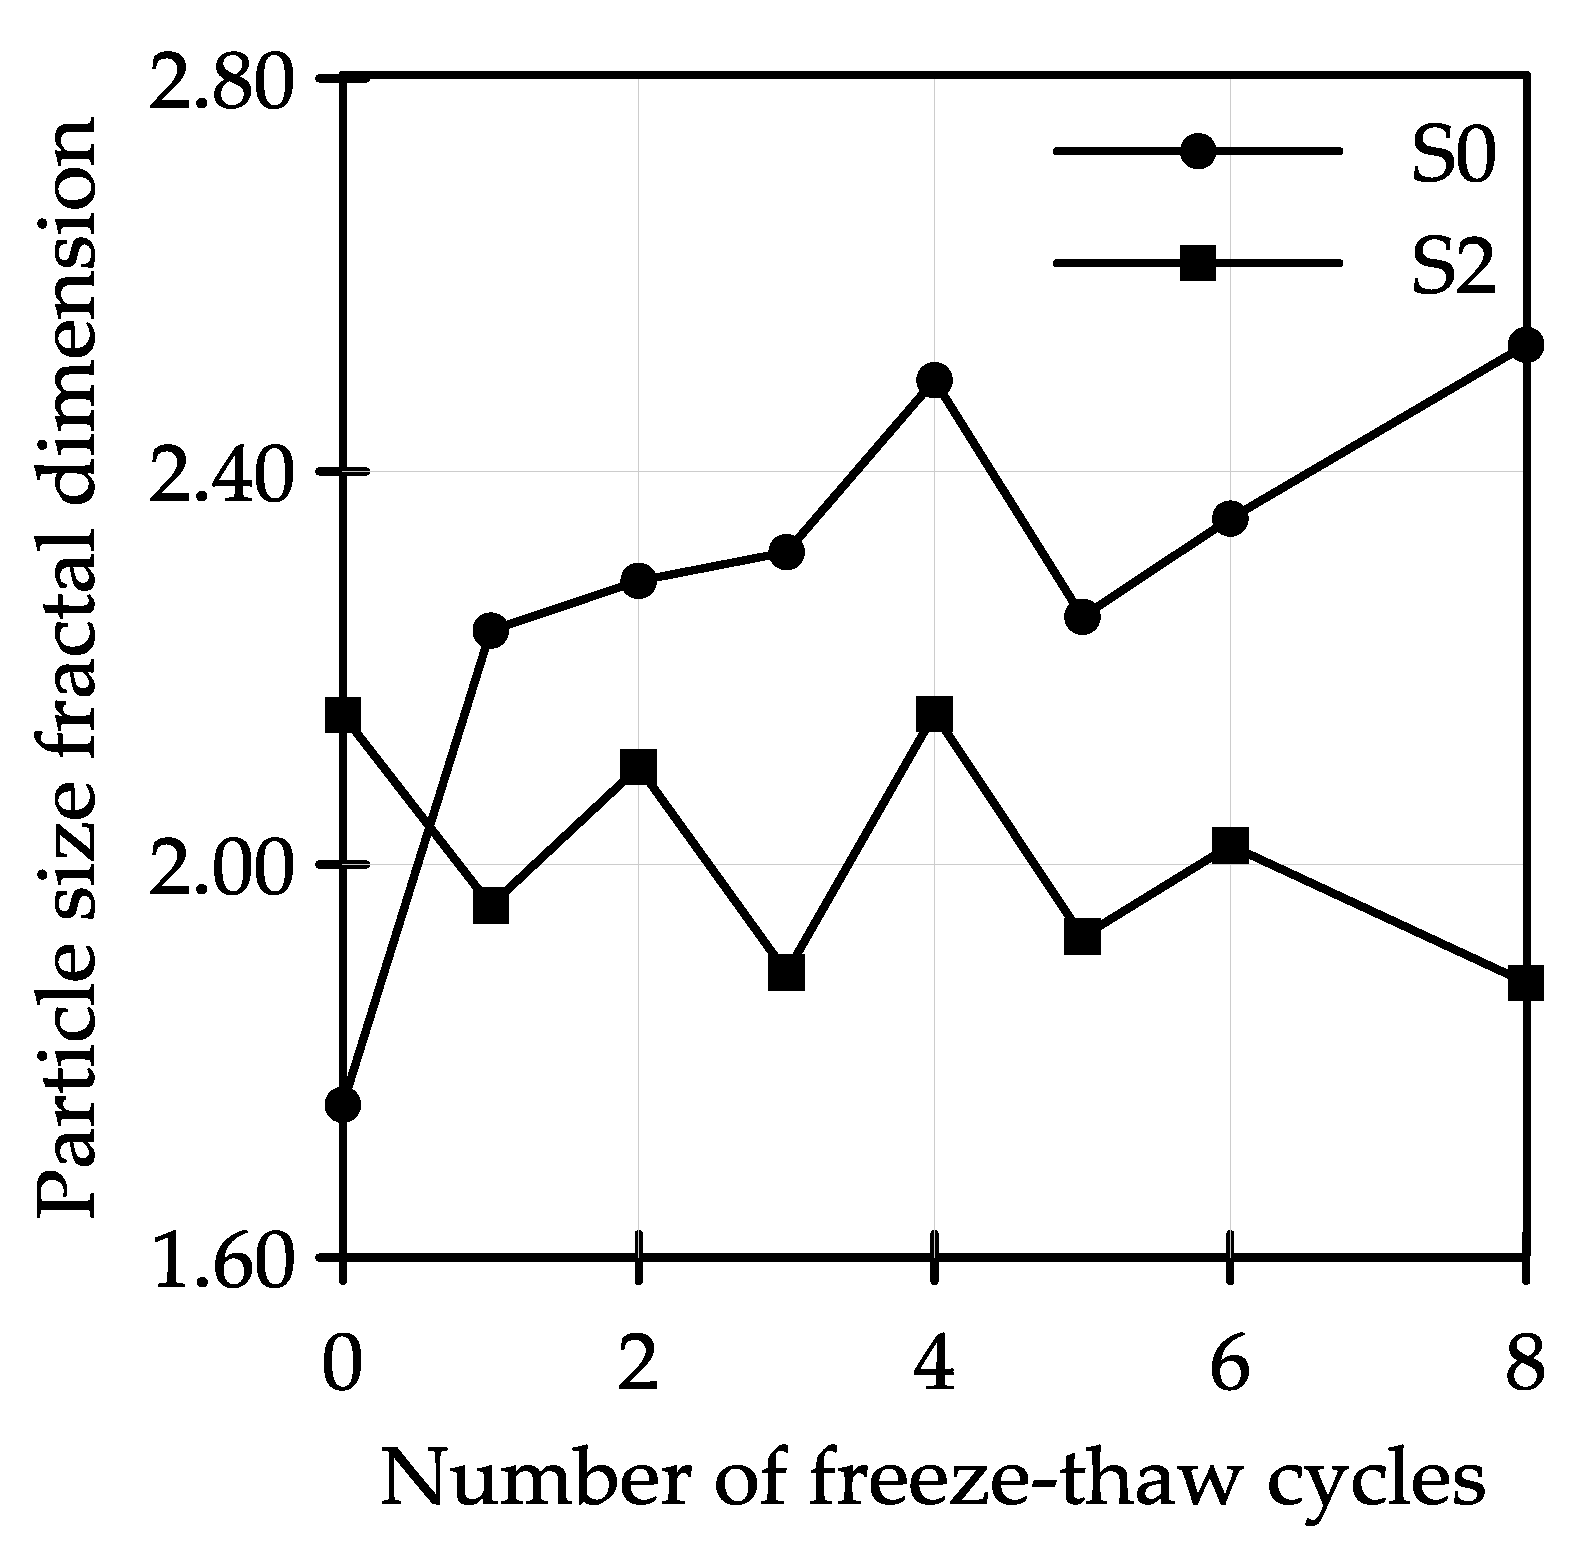
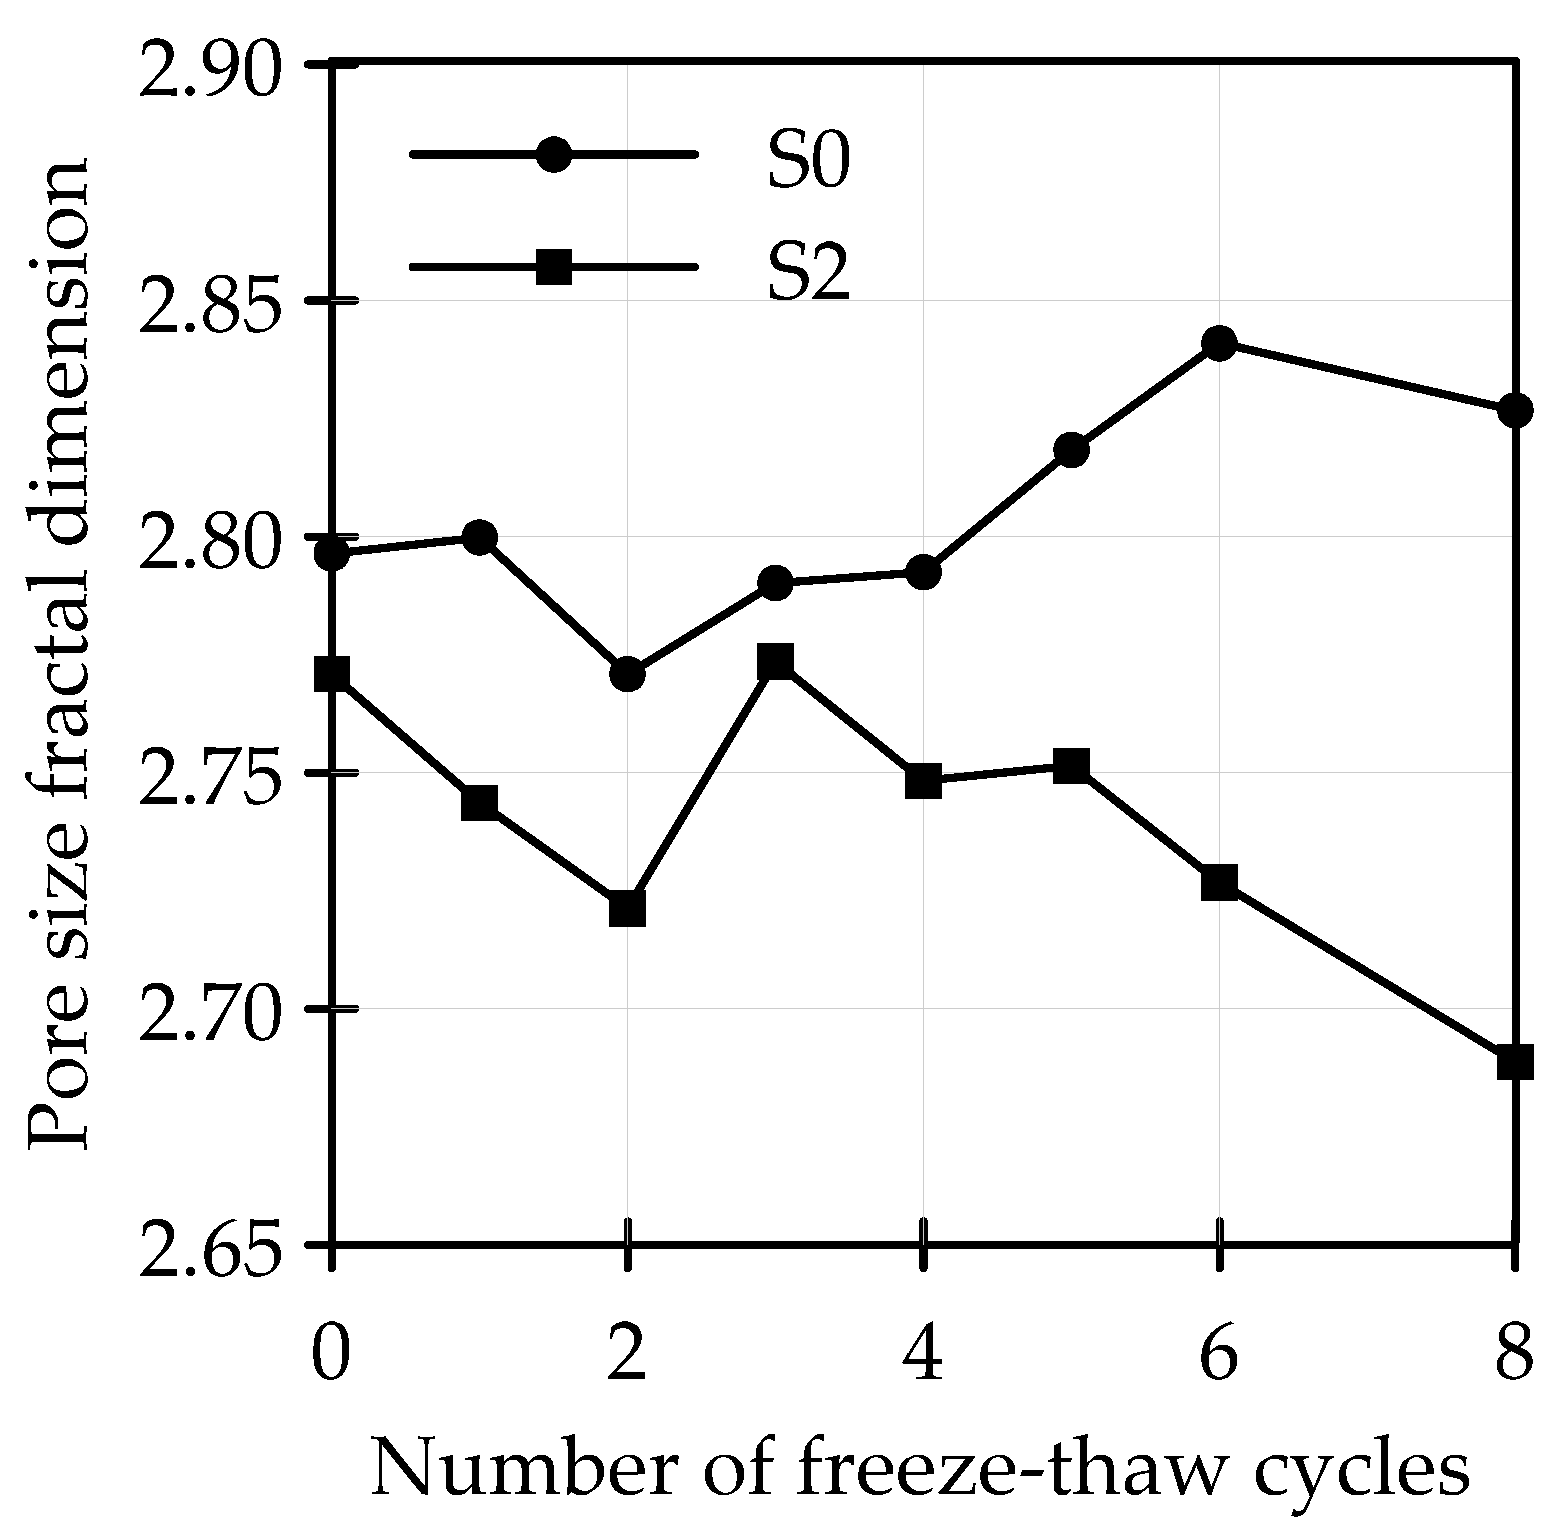
25]. The content of the structural unit with a larger equivalent diameter of cement modified soil increased with the cement content increased, while the porosity and the fractal dimension decreased [26]. The pore size distribution and pore shape coefficient of cement reinforced clay with different cement content differed before and after loading, but the orientation of the pores was remarkable no matter what the cement content was [27]. The microscopic parameters are related to cohesion, internal friction angle, and shear strength [28]. The cement content is an important factor affected the shearing form of the modified soil. When the cement content was greater than 10%, the macroscopic failure form was dilatation damage after loading, and the pore distribution was oriented [29].
In summary, comprehensive analysis of the microstructure and the macroscopic mechanical properties under F-T cycles is necessary. The promoted microstructure can enhance the mechanical properties of subgrade silty soil to solve construction problems. Therefore, the macroscopic mechanical properties of unmodified and cement modified silty soil under F-T were studied by a static triaxial test; meanwhile, the microstructure images of those under the same conditions were obtained by SEM. The microscopic mechanism of the macroscopic mechanical properties of the cement modified silty soil was revealed with the grey relation analysis (GRA), which would provide reliable reference data for cement modified subgrade silty soil (CMSS) in seasonally frozen areas.

2. Materials and Test Programs

2.1. Materials

The subgrade silty soil modified with Portland cement (P.II 32.5) was selected as the research object, while the cement content of 0% (unmodified) and 2% (the optimum cement content) [30] was defined as sample with 0% cement content (S0) and S2, respectively. On the basis of the Chinese Specification of JTG E40-2007, Test Methods of Soils for Highway Engineering [31], the particle analysis test results (Table 1) and the basic physical properties (Table 2) of the modified silty soil were obtained.

2.2. Test Programs

2.2.1. Static Triaxial Test

First, the cylinder samples (diameter of 39.1 mm, height of 80 mm) with optimum moisture content were prepared according to the impact molding method of the Chinese specifications [31]. They were compacted at the lowest (minimum 96%) compaction standard of high-grade highway subgrade material. Each sample was tightly packaged with plastic wrap to prevent water dispersion and evaporation during the multiple F-T cycles and blocking external water sources. Then, we placed them in a curing box with a temperature of 20 ± 2 °C and a relative humidity greater than 95% for 7 days based on the Test Methods of Materials Stabilized with Inorganic Binders for Highway Engineering of China (JTG E51-2009) [32].
The researchers [33] showed that when the temperature was lower than −10 °C, the strength decreased after F-T cycles tended to be stable. Meanwhile, the temperature changes in seasonally frozen areas were taken into consideration. After the samples were cured, we placed them in a digital refrigerator with a negative constant temperature of −20 °C for 24 h. Subsequently, the samples were subjected to thawing at 20 °C for another 24 h. Due to the physical and mechanical properties of soil tending to be stable after 6~8 F-T cycles [34,35,36,37], the samples were subject to 0, 1, 2, 3, 4, 5, 6, and 8 F-T cycles, respectively. Finally, the TSZ-2S automatic triaxial instrument was used to perform the unconsolidated undrained (UU) triaxial shear tests with 20, 50, and 80 kPa confining pressure. The vertical strain shear rate was 0.8 mm/min during the test. When a shear peak occurred during the test, the shear was stopped when it exceeded 5% of the axial strain; otherwise, the shear continued to 20% of the axial strain [31].

2.2.2. SEM Test

In order to collect the microscopic data under the same conditions as the macroscopic mechanical parameters, the specifications and manufacturing methods of the micro-test samples were the same as those of the static triaxial test described above. First, the F-T samples were hand-opened to expose the fresh undisturbed surface and cut into small pieces with a certain distance from the opening surface for the SEM test. Subsequently, the cut samples had to be dried to allow them to be completely gold-plated, and the air-dried samples were adhered to the SEM observation table with conductive tape, followed by vacuuming and gold spraying. Finally, an electron microscopic was used to observe them.
Each observed sample was photographed with 3 points during the SEM test, so as to select better image extraction data to reduce the error when performing image processing later. The images, whose magnifications were selected as 25× and 50×, could only show the whole structure of the sample with the inconspicuous form of bonding between particles. When the magnifications were 200×, 500× and 1000×, the local characteristic information of the sample or a few unrepresentative particles only could be displayed. However, when 100× magnification was adopted, the particle state of the images and the microscopic feature information were more comprehensive and abundant. Therefore, 100× images were taken for the study and analysis (Figure 1).
Finally, the microscopic images should be subjected to image preprocessing, image segmentation, and image morphology processing to obtain the “particle image” and “porosity image” by the MATLAB program. Then, the microscopic data could be acquired by counting and measuring the processed images by Image Pro-Plus (IPP).

3. Effects of F-T Cycles on the Mechanical Properties and Microscopic Parameters

3.1. Effect of F-T Cycles on Shear Strength and Its Parameters

By analyzing the shear test results of samples after different confining pressures during F-T cycles on the basis of the Moore criterion, the effect of F-T cycles on the shear strength parameters and the relationship between shear strength and F-T cycles are shown in Figure 2 and Figure 3, respectively.
Figure 2a shows that the cohesion of S0 and S2 decreased with the number of freezing and thawing. The cohesion dropped sharply after the first F-T cycle and gradually became steady after the fourth F-T cycle. The cohesion of S2 was at least 3.55 times greater than that of S0, indicating that the incorporation of cement allowed the soil to maintain high cohesion after F-T and enhanced the resistance to F-T cycles of the soil. From Figure 2b, the internal friction angles of S0 and S2 had no obvious regularity with the number of F-T; however, the internal friction angle of S2 was larger than that of S0, which was contributed by the improvement of soil gradation due to the hydration reaction of cement.
From Figure 3, the shear strength of S0 and S2 decreased as the F-T cycles continued, and they both gradually stabilized after the fourth freezing and thawing. The shear strength increased with the increase of confining pressure. Comparing Figure 3a with Figure 3b, the shear strength of S2 was at least 2.79 times greater than that of S0 under F-T. This manifested that the addition of cement, which generated the skeleton structure through the hydration reaction, enhanced the cementation ability and the agglomeration force of the soil particles and could greatly improve the shear strength and enhance the frost resistance of soil.

3.2. Effect of F-T Cycles on Particle Morphological Characteristics

3.2.1. Effect of F-T Cycles on Average Particle Diameter Percentage and Average Particle Diameter

The internal structure of the soil varied due to water migration and redistribution after F-T cycles, and the particles’ reorganization directly caused the particle diameter change. Hence, the particles were divided into four sections according to different particle diameters, including < 5 μm, 5~20 μm, 20~50 μm, and >50 μm. The average particle diameter (Dp) percentage in each section was calculated and is shown in Figure 4.
Figure 4a shows the effect of F-T cycles on the Dp percentage of S0. This indicated that the largest proportion of particles was 20~50 μm, followed by 5~20 μm and >50 μm. The particles <5 μm were the least. With the increase of F-T cycles, the particles of 5~20 μm increased, while 20~50 μm and >50 μm showed a decreasing trend. The reason might be that the F-T cycles caused the large particles of the plain soil to be broken, the small particles to increase, and the particle agglomeration to lower.
Figure 4b displays that the largest proportion of S2 particles was 20~50 μm, followed by >50 μm and 5~20 μm. Comparing Figure 4a with Figure 4b, we could conclude that the change of the Dp percentage of S2 in each section was exactly contrary to that of S0. The reason was that, with the addition of cement, the small particles adhered to the surface of the skeleton structure dominated by large particles due to the F-T, leading to the rupture and reorganization of soil particles. Hence, the soils still had better agglomeration and high cohesion under F-T cycles.
To compare and analyze the effect of F-T cycles on Dp, the Dp of S0 and S2 after F-T cycles are listed in Table 3.
From Table 3, the Dp of S0 was the largest when unfrozen-thawed, it decreased sharply after the first F-T cycle and then decreased with the degree of 8.4%~25.87%. The first F-T cycle had a significant influence on unmodified soil. The Dp of S2 increased in within the whole change range from 5.5% to 17.7% and was greater than that of S0, indicating that F-T cycles caused S0 particles to shatter and recombine; the particles appeared to be in a “fragmented” state. As for S2, the small particles were filled and adhered to the large particles to form larger particles, which was called the state of “agglomeration”. Therefore, the cohesion of S2 was higher than that of S0 after F-T cycles.

3.2.2. Effect of F-T Cycles on Particle Size Fractal Dimension

Due to the irregularity and complexity of the shape dimension of things in nature, the fractal dimension (D) is used to describe the complexity of a fractal set and represents the continuous non-integer value. Generally speaking, D is mostly based on the self-similarity of the graph, so the graph can be divided into several similar parts according to the scale. D of the graph can be expressed by Equation (1).
D = lim ε 0 ln N ( ε ) ln ε
where: ε is the scale, N ( ε ) is the metric value under the scale, and D is the fractal dimension of the study object.
The particle size fractal dimension (Dps) is used to describe the degree of unevenness of the particle size (r), which is characterized by the distribution characteristic of the cumulative number N ( r ) of particles smaller than a certain particle size and expressed by the morphological characteristics of the r N ( r ) . curve. It can be known from the mass distribution feature [38] that the two have a good power function correspondence.
N ( r ) r D
N ( r ) = M N ( r )
where N ( r ) is the number of particles larger than a certain particle size and M is the total number of particles, which is a constant.
For the “particle image” where M is certain, then N ( r ) has a fixed correspondence with N ( r ) , so the following relationship can be considered.
N ( r ) r D
Equation (4) is identical in form to Equation (1), so D is defined as Dps whose meaning is equivalent to the uneven coefficient Cu of the coarse-grained soil. The larger the Dps is, the worse the degree of homogenization of particles is. The scatter plot of the two is plotted under the double logarithmic coordinates where r is the abscissa and N ( r ) is the ordinate. If the relationship between the particle size content and the particle size is linear, as well as the slope of the line is b, then Dps = 3 − b. The changes in the Dps of S0 and S2 under F-T cycles are drawn in Figure 5.
Figure 5 illustrates that the Dps of S0 increased as F-T cycles continue. The Dps of S2 was between 1.88 and 2.15. The Dps of S2 was obviously smaller than that of S0, and this demonstrated that the properties of particles were relatively stable under F-T after cement was mixed. The particles of S0 only recombined simply due to water migration after F-T, so the particles after recombination showed a non-uniform state. However, because of the existence of the skeleton structure in S2, more small particles attached to the surface of large particles through water migration to form larger particle structures, making the particles uniform, which was consistent with the result discussed above.

3.2.3. Effect of F-T Cycles on Particle Abundance Percentage and Average Particle Abundance

Particle abundance refers to the ratio of the short axis-to-the long axis of the particles, that is the ratio of the minimum diameter-to-the maximum diameter extracted by IPP, which shows the geometric shape of particles [39]. Its value is between zero and one. The particles tend to be elongated and equiaxed when the abundance value tends to zero or one, respectively. The particle abundance percentage and average particle abundance (C) versus F-T cycles are shown in Figure 6 and Table 4.
Figure 6a displays that the largest proportion of particles was that whose abundance was in the range of 0.4~0.6; the second were 0.2~0.4 and 0.6~ 0.8; the least were 0~0.2 and 0.8~1 in S0; this indicated that most of the particles tended to be equiaxed. As F-T cycles continued, the particles of S0 whose abundance was from 0.4~0.6 increased, while particles with an abundance of 0.2~0.4 and 0.6~0.8 decreased, and 0~0.2 and 0.8~1 basically remained unchanged. From Figure 6b, the particle abundance percentage change of S2 in each interval was similar to that of S0, implying that more particles tended to be equiaxed after F-T cycles. Comparing Figure 6a with Figure 6b, the particles of S2 with abundance of 0.4~0.6 were more than those of S0 in the same abundance interval, indicating that the addition of cement could multiply the number of equiaxed particles and increase the ability of soil to resist deformation under F-T cycles.
From Table 4, the C of S0 fluctuated from 0.444~0.490, while the C of S2 was from 0.478~0.516. The C of S2 was larger than that of S0, indicating that the incorporation of cement could make the soil tend to develop in an equiaxed manner. Therefore, the soil properties tended to be stable and the influence of F-T on C could be reduced.

3.2.4. Effect of F-T Cycles on Average Particle Roundness

Particle roundness (R), with the value of 0~1, denotes the degree to which particles are close to being round. The larger the value is, the closer the shape of the particles will be to round. It is defined by Equation (5).
R = P 4 π A
where R is the roundness, P is the circumference of the object, and A is the area of the object.
The average particle roundness (R) can be obtained by averaging the roundness of particles extracted by IPP, as drawn in Figure 7.
Figure 7 shows that R of S0 decreased after F-T and decreased sharply after the third F-T cycle. R of S2 showed an increasing trend, manifesting that the addition of cement effectively alleviated the instability of particles under F-T. R of S2 was larger than that of S0, indicating that S2 particles tended to be rounder, which was consistent with the change of Dp, Dps, and C after F-T. The small particles filled between the large particles due to the new skeleton structure formed by the hydration reaction of cement, which augmented the degree of particle homogenization. Therefore, the macro performance was that the cohesion of S2 was obviously greater than that of S0 after F-T cycles.

3.2.5. Effect of F-T Cycles on Particle Surface Relief Fractal Dimension

The particle surface undulation had fractal features and could be calculated by the step size method. Assume that the closed curve in Figure 8 is a particle and its trajectory coordinates are obtained by the image processing. If the length of the edge line is measured by a ruler of length εi, then the corresponding ruler number is N (εi). A series of ruler lengths ε1, ε2, ..., εn ( n ) would correspond to a series of ruler numbers N(ε1), N(ε2), ..., N(εn). The relationship between εi and N(εi) is reflected in the double logarithmic coordinates, and the connection curve of each point reflects the degree of particles fluctuating. The steeper the curve, the more significant change has happened in the length of the curve, indicating that the undulation degree of the particles is greater. Hence, the negative slope value of the linear portion about the lnε~lnN(ε) curve can be used to characterize the particle surface relief fractal dimension value (Dpr) (the same as Equation (1)). The larger the Dpr is, the higher the surface undulation will be. The effects of F-T cycles on Dpr are displayed in Figure 9.
Figure 9 displays that the Dpr of S0 fluctuated between 1.11 and 1.15 under F-T, while the Dpr of S2 decreased with the increase of F-T cycles, which was smaller than that of S0, meaning that the skeleton structure of S2 not only reduced the surface undulation of particles, but also enhanced the ability of soils to resist deformation after F-T cycles.

3.3. Effect of F-T Cycles on Particle Arrangement

3.3.1. Effect of F-T Cycles on Particle Orientation Probability Entropy

Particle orientation represents the distribution probability of the orientation angle of particles within [0,2π], which can be used to delineate the orientation strength in various directions. The orientation angle of soil particles is symmetrically distributed within [0,2π], so only calculating the distribution within [0,π] is allowed. Therefore, we divided [0,π] into 18 azimuth zones with an angular density of Δθ = 10°. The orientation intensity of the particles in each azimuth zone was separately counted and reflected by the orientation probability entropy (Hm) [40]. The formula is as follows:
H m = i = 1 n P i log n P i
where Hm is the probability entropy of the particle arrangement, n is the number of azimuth zones, and P i is the probability of the particle being in a certain azimuth zone.
Hm denotes that the particles are arranged in the same direction or not when the value tends to zero or one, respectively. The diversifications of Hm under F-T cycles are shown in Figure 10.
From Figure 10, Hm of S0 and S2 were both between 0.90 and 0.99, showing that the order of particles in each azimuth zone was poor. The Hm of S0 and S2 was relatively large after the first F-T cycle, indicating that particle arrangement was the most chaotic and the soil state was the most unstable, while macro-performance was that cohesion and shear strength sharply decreased after the first F-T cycle.

3.3.2. Nightingale Rose Diagram of the Particle Distribution under F-T cycles

To clarify the actual effect of the number of F-T on the particle arrangement, the Nightingale rose diagrams of S0 and S2 are drawn according to the distribution of particles in various zones, as Figure 11 and Figure 12 show.
Figure 11a displays that the particles of S0 showed a directional tendency after artificial compaction. With the increasing F-T cycles, the inter particle coupling force decreased due to particles’ breaking and recombination, which caused the particle orientation tendency to weaken, especially after the fourth F-T cycle (Figure 11e). It shows that F-T cycles reduced the compactness of the soil and weakened the ability of soil to withstand loads, so the cohesion decreased.
From Figure 12a, being unfrozen-unthawed, the grain orientation tendency of S2 was remarkable when subjected to manual compaction. The directional angle content of particles in the non-directional area increased with the number of F-T cycles, but the orientation trend remained significant after several F-T cycles (Figure 12c–f). It was evident that the addition of cement kept the soil at a high degree of compactness. Soils after F-T cycles still had certain bearing capacity for loads and maintained higher cohesion.

3.4. Quantitative Analysis of Pores under F-T Cycles

3.4.1. Effect of F-T Cycles on Average Pore Diameter Percentage and Average Pore Diameter

The internal water migration not only caused the change of Dp, but also of the average pore diameter (Dh) during F-T; the change of Dh caused the changing appearance of the soil. Hence, Dh was divided into three sections: small pores, medium pores, and large pores, whose diameters were <4 μm, 4~16 μm, and >16 μm, respectively. The Dh percentage in each section is shown in Figure 13, and Dh versus F-T cycles are listed in Table 5.
Figure 13a shows that the largest proportion of pores was those whose Dh were in the range of 4~16 μm and >16 μm. The pores of S0 in 4~16 μm increased as F-T cycles continued, and the pores of >16 μm decreased, indicating that F-T cycles increased the medium pores. From Figure 13b, Dh of S2 was similar to that of S0, manifesting that the soil was mainly composed of medium pores before and after being mixed with cement. With the number of F-T cycles, the variation of the Dh percentage of S2 was completely contrary to that of S0.
From Table 5, the Dh of S0 increased with F-T cycles, and that of S2 showed a similar trend with that of S0, both of them having the maximum Dh after the second F-T cycle, which meant the soil had minimum strength under the second F-T. The Dh of both increased with the increasing F-T cycles, indicating that F-T reduced the joint force between particles and caused the increase of pores, so the cohesion and the shear strength of both decreased. However, the Dh of S2 was smaller than that of S0, meaning that the addition of cement reduced the effect of F-T on the bonding force between particles. The Dh was closely related to the “fragmentation” and “agglomeration” of particles under F-T cycles.

3.4.2. Effect of F-T Cycles on Pore Size Fractal Dimension

The pore size fractal dimension (Dhs) is similar to Dps. The larger the Dhs is, the larger the difference of the pores will be. Figure 14 shows the variation of Dhs under different F-T cycles.
From Figure 14, the Dhs of S0 increased with repeated F-T cycles, while that of S2 decreased. Meanwhile, the Dhs of S0 was larger than that of S2, illustrating that the addition of cement made the particles maintain good agglomeration, so high cohesion and shear strength obtained after F-T and improved the frost heave resistance of the soil.

4. Correlation between the Microscopic Parameters and Shear Strength Parameters under F-T Cycles

The relationship between the macroscopic parameters and eight microstructure parameters were difficult to figure out on the basis of existing data. Hence, the grey system theory was adopted to study the correlation between the microscopic parameters and macroscopic parameters including cohesion and internal friction angle, so as to find the microscopic mechanism of the macroscopic mechanical properties changes under F-T cycles.

4.1. Principle of GRA

GRA judges the degree of correlation between various factors by the similarity of their geometric curves. Liu [41] systematically summarized the development of the grey relation model. To study the correlation between the microscopic parameters and the shear strength parameters, the parent sequence is defined as the cohesion or internal friction angle, the subsequence is determined as the microscopic parameter. Assume that the parent sequence is X 0 = { x 0 ( 1 ) , x 0 ( 2 ) , , x 0 ( n ) } and the subsequence is X i = { x i ( 1 ) , x i ( 2 ) , , x i ( n ) , i = 1 , 2 , , m } . The dimension of each parameter does not match the scale type, which needs to be initialized by Equation (8) to make it non-dimensional.
{ x ~ i ( k ) = x i ( k ) min ( x i ) max ( x i ) min ( x i ) + 1 x 0 ~ ( k ) = x 0 ( k ) min ( x 0 ) max ( x 0 ) min ( x 0 ) + 1
where min ( x 0 ) and max ( x 0 ) the minimum and maximum values in the parent sequence and min ( x i ) and max ( x i ) are the minimum and maximum values in the ith subsequence.
The difference between the parent sequence and subsequence is obtained by Equation (8), and then, the minimum difference ∆min and the maximum difference ∆max of the proximity of the subsequence are found; hence, the ith subsequence can be calculated at the k point from Equation (9).
Δ i ( k ) = | x ~ i ( k ) - x 0 ~ ( k ) |
ξ i ( k ) = Δ min + ρ Δ max Δ i ( k ) + ρ Δ max
Finally, correlation γi can be calculated by Equation (10).
γ i = 1 n i = 1 n ξ i ( k )
It is generally believed that the parent sequence and subsequence are well correlated when   ρ = 0.5 , γ i < 0.6 , while poorly correlated when   ρ = 0.5 , γ i < 0.6 [42].

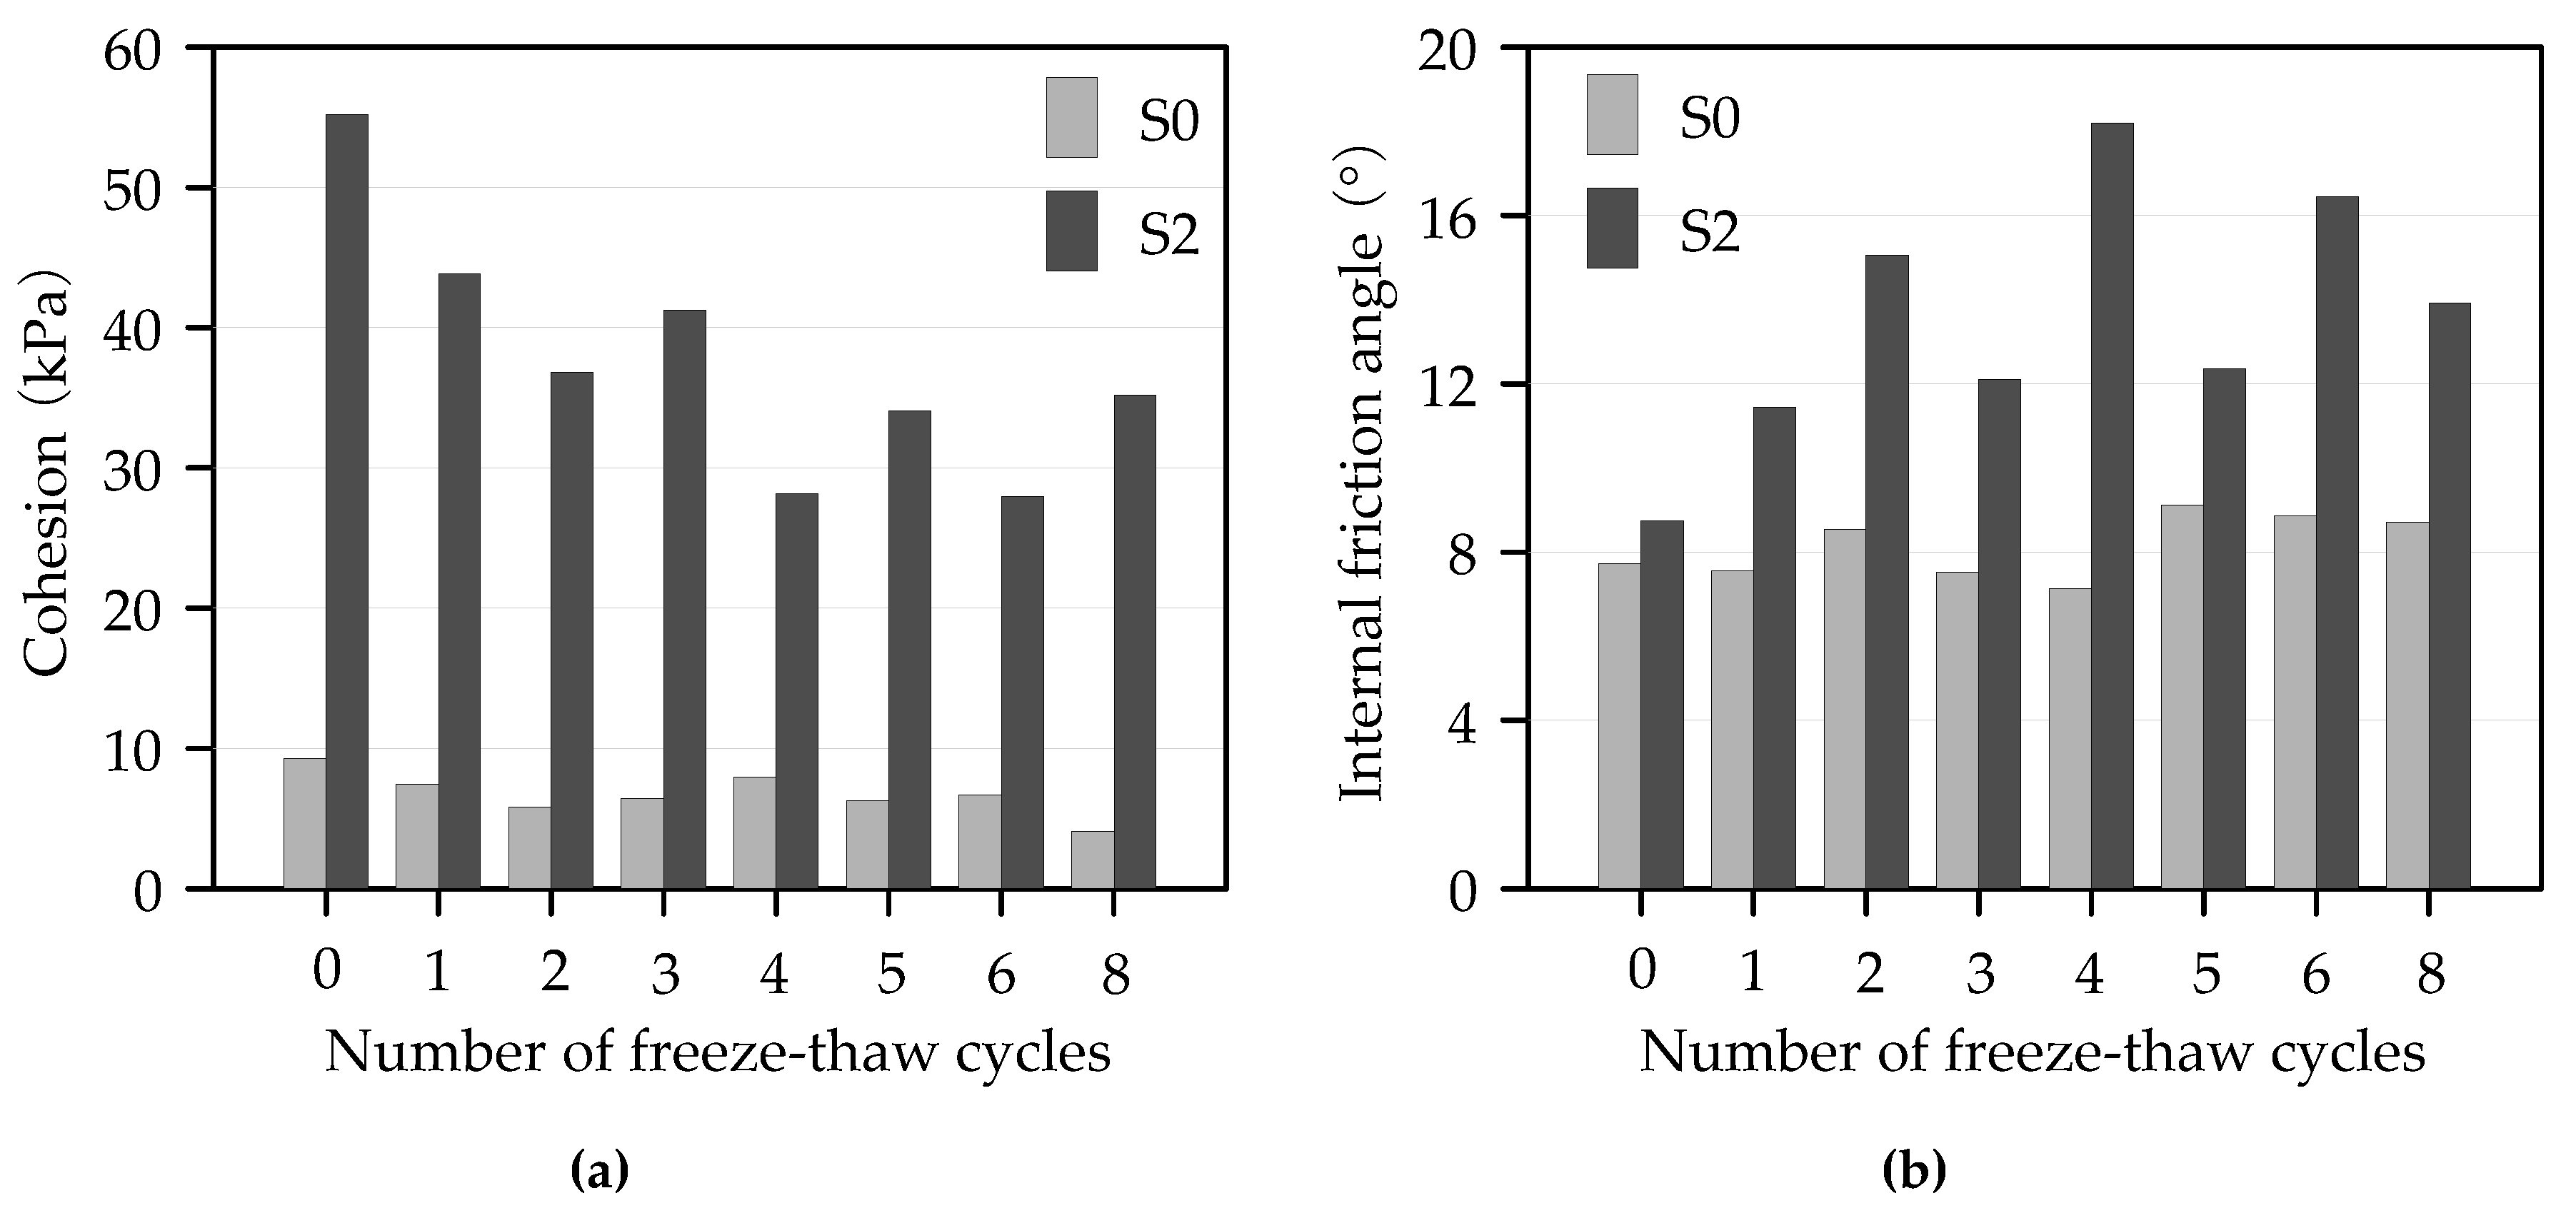
4.2. Analysis of GRA Results between Microscopic Parameters and Cohesion

The correlations between microscopic parameters and cohesion are listed in Table 6.
From Table 6, the correlation between Dp and the cohesion of S0 was 0.785, indicating that the cohesion of S0 was most sensitive to Dp. Dp characterized the overall size and the accumulation of soil particles. The agglomeration of soil without cement was mainly contributed by the accumulation of particles. The other microscopic parameters related to cohesion were R, C, Dhs, Dpr and Hm.
The correlation between Dps and the cohesion of S2 was 0.687, which was the largest and meant that Dps had the greatest influence on the cohesion of S2. The reason was that, when the cement was mixed, the main acquisition mode of the soil particles agglomeration was changed from physical action to chemical action, which weakened the effect of F-T on Dps. The other microscopic parameters related to S2 cohesion were Hm, Dhs, and C.
The correlations between microscopic parameters and the cohesion of S0 were basically larger than that of S2, indicating that the cohesion of S0 was more sensitive to microscopic parameters.

4.3. Analysis of GRA Results between Microscopic Parameters and Internal Friction Angle

To study the correlation between the above eight microscopic parameters and internal friction angle, the GRA results are shown in Table 7.
Table 7 displays that the correlations between the internal friction angle of S0 and C, Dhs, Dpr, Hm, and Dh were all higher than 0.70, representing their close relationship. C was the most essential factor affecting the internal friction angle of S0. The reason might be that the internal friction angle of S0 mainly depended on the friction between particles. C reflected the shape of soil particles as a whole, which pertained to the arrangement of the particles. Furthermore, R and Dp were associated with the internal friction angle of S0.
The correlations between microscopic parameters and the internal friction angle of S2 were about 0.65. The most relevant parameter was Dh, and it was perceived that the internal friction angle of S2 was most affected by Dh. This was mainly because the structure of soil was relatively stable with the hydration reaction of the addition of cement. Dh reflected the size of pores: the larger the pores, the smaller the internal friction angle.
Comparing Table 6 with Table 7, the correlations between microscopic parameters and internal friction angle were basically higher than those with cohesion, demonstrating that the decrease of shear strength after F-T cycles was mainly caused by the change of internal friction angle. Therefore, the frictional strength was the main parameter, which played a dominate role in the shear strength.
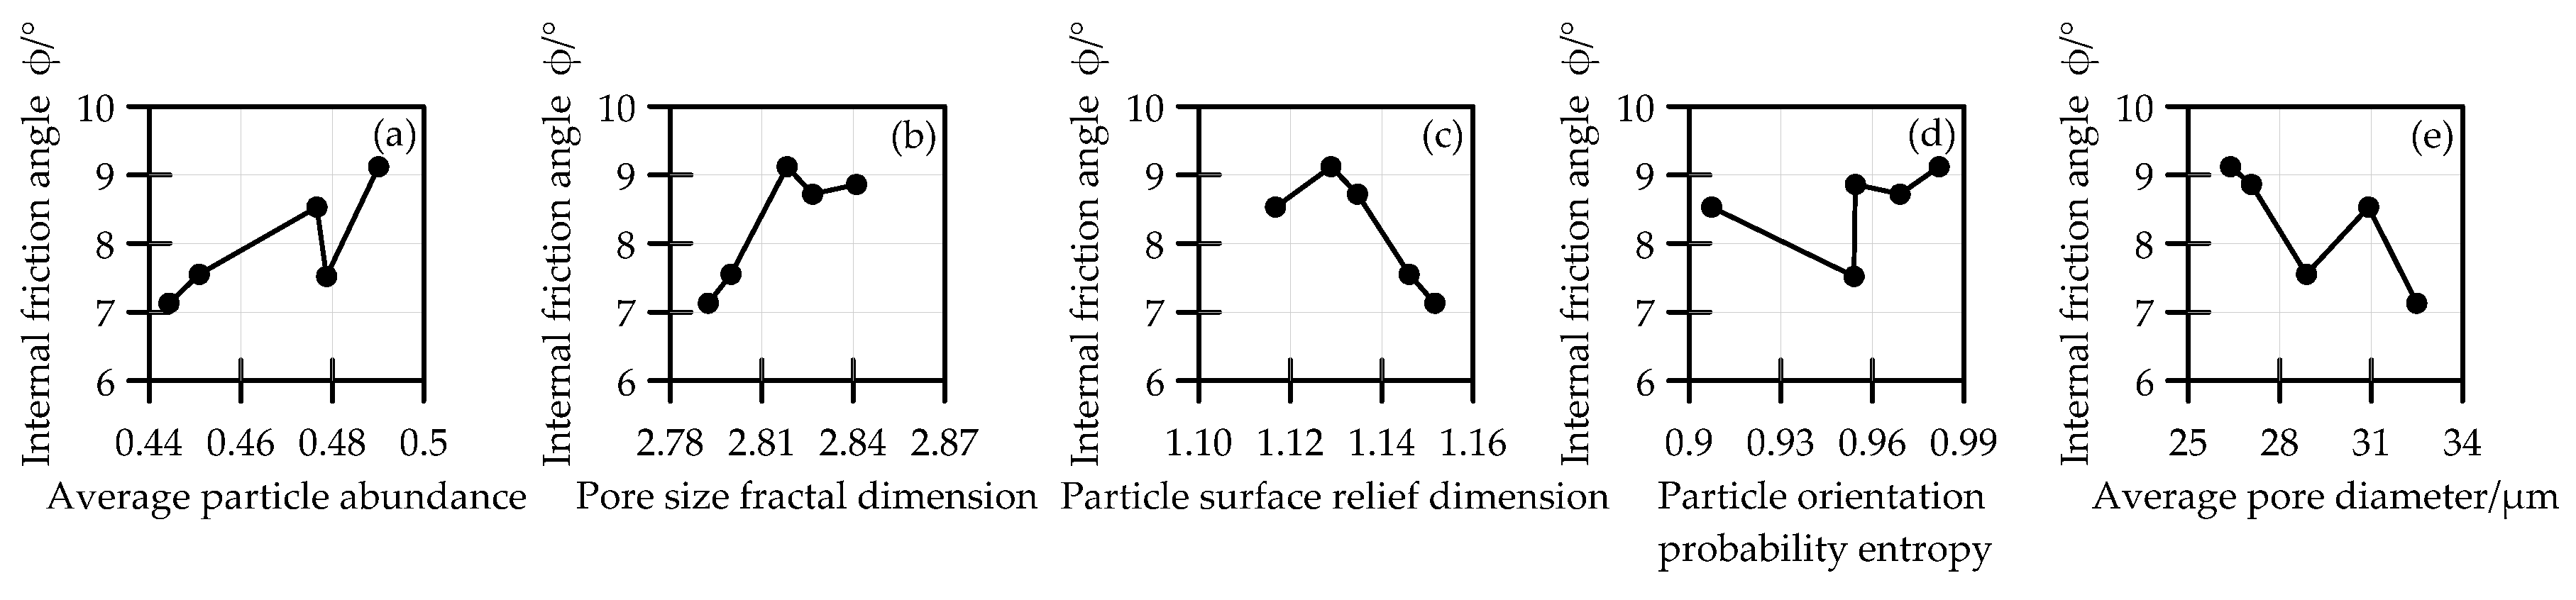
In order to visualize the effect of the micro parameters on the internal friction angle of S0 and S2, the variation of which with the five most relevant microscopic parameters was revealed after F-T cycles, this is shown in Figure 15 and Figure 16, respectively. The degree of microscopic parameters associated with the internal friction angle is arranged from large to small based on the analysis of the GRA results.
From Figure 15, the internal friction angle of S0 increased with the increase of C, Dhs, and Hm, and decreased as Dpr and Dh increased. The method of improving C, Dhs, and Hm and reducing Dpr and Dh could increase the internal friction angle of unmodified soil after F-T, and the frictional strength could be effectively enhanced, thereby achieving the aim of improving the shear strength and frost heave resistance of soil.
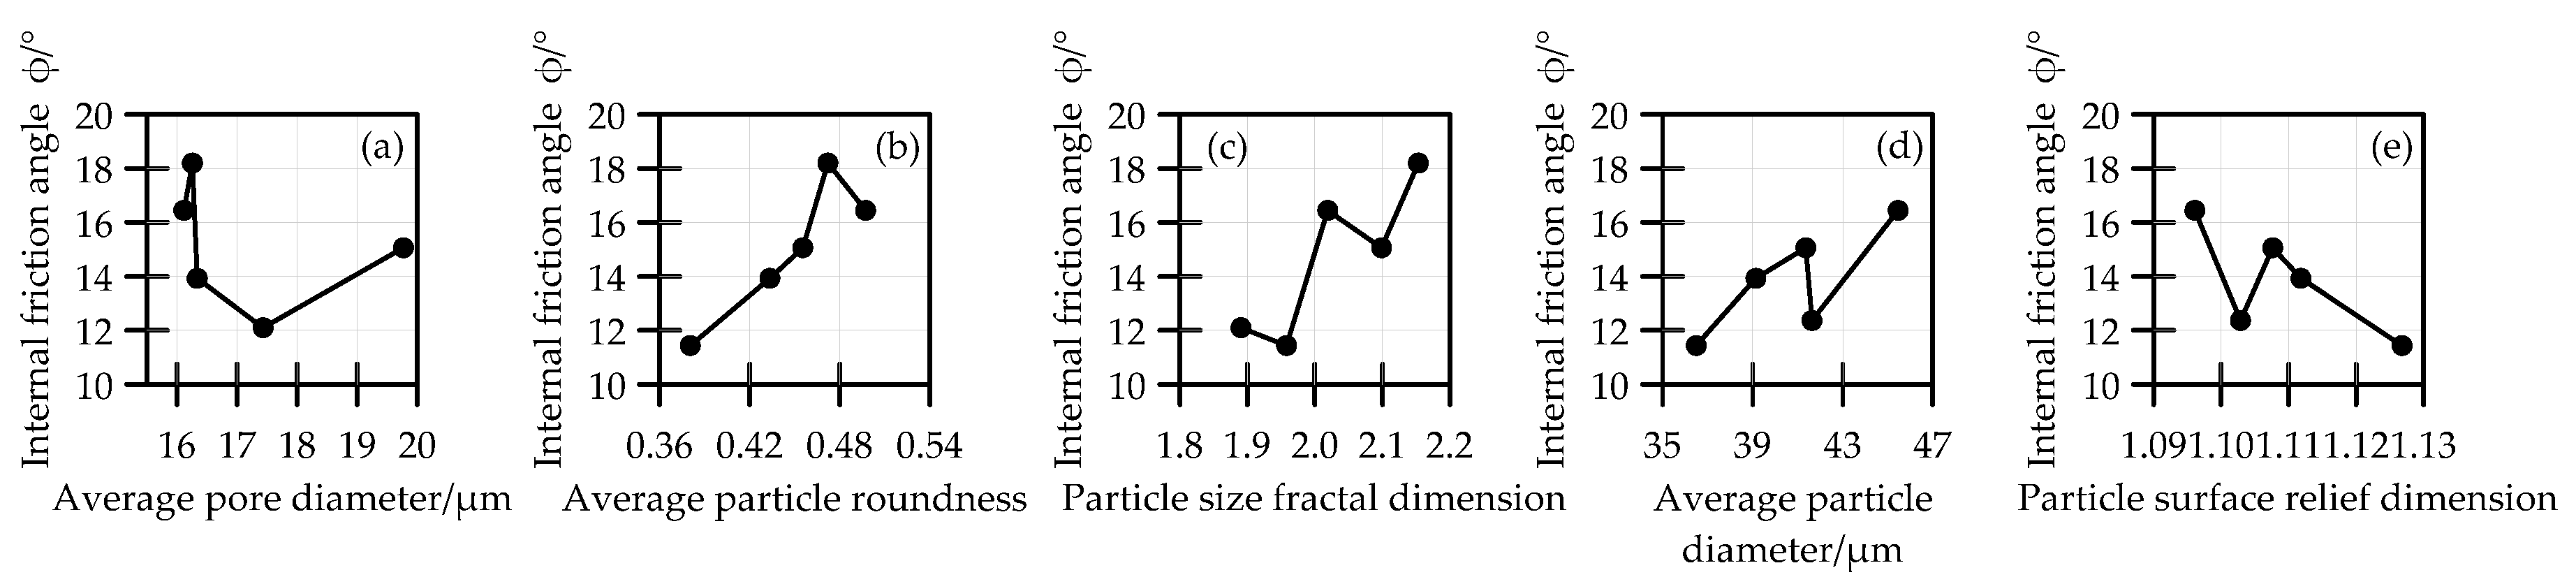
Figure 16 shows that the internal friction angle of S2 decreased with the increasing Dh and Dpr and increased as R, Dps, and Dp increased. Comparing with Figure 15 and according to the results of 3.2.5 and 3.4.1, we could conclude that the principle of cement improvement was mainly to decrease the Dpr and Dh of the unmodified soil under F-T cycles; F-T cycles weakened the soil strength mainly by increasing Dh. Hence, the use of modifiers to reduce Dh could most effectively increase the shear strength after F-T cycles, reducing maintenance costs and prolonging the service life of the subgrade material.

5. Conclusions

The static triaxial test, SEM test, and GRA under F-T cycles were conducted, and the following conclusions can be drawn.
(1)
The shear strength and its parameters of CMSS after F-T cycles were obtained through the static triaxial test. The results showed that the cohesion and shear strength of S0 and S2 decreased as F-T cycles continued, the internal friction angle not being obvious. The shear strength of both increased with the increasing confining pressure. The increase of the cohesion, the internal friction angle, and the shear strength of S2 doubled compared to that of S0.
(2)
The microscopic parameters Dp, Dps, C, R, Dpr, Hm, Dh, and Dhs of S0 and S2 at optimum moisture content after F-T cycles were studied and analyzed by SEM and IPP. With the increase of F-T cycles, the Dps, Dh, and Dhs of S0 increased, the Dp and R decreased, while the C, Dpr, and Hm had no obvious variations. As F-T cycles continued, the Dp, R, and Dh of S2 increased and the Dpr and Dhs decreased. The Dps, C, and Hm fluctuated in a certain range.
(3)
The correlations between microscopic parameters and macroscopic parameters were calculated on the basis of GRA. The results manifested that the most important factor affecting the cohesion of S0 was Dp, while the cohesion of S2 was more sensitive to Dps. Concerning the internal friction angle, C was the most important for that of S0, and Dh was primarily related to that of S2. The use of modifiers to reduce Dh could most effectively increase the shear strength of soil after F-T cycles.
(4)
The samples under different moisture contents should be analyzed by SEM to study the effect of moisture content on the microstructure parameters of CMSS under F-T cycles. Meanwhile, more research should be carried out on the fractal dimension of soil.

Author Contributions

Conceptualization, S.S.; methodology, Y.Z.; software, J.W.; validation, H.L., Y.Z. and L.W.; formal analysis, J.W.; investigation, S.S.; resources, H.L.; data curation, S.S.; writing—original draft preparation, S.S., H.L., G.L. and L.H.; writing—review and editing, S.S. and H.L.; visualization, J.W.; supervision, L.W.; project administration, H.L.; funding acquisition, Y.Z. and J.W. All authors have read and agreed to the published version of the manuscript

Funding

This research was funded by National Natural Science Foundation of China, grant number 51308256.

Acknowledgments

The authors express their appreciation for the financial support of the National Natural Science Foundation of China, grant number 51308256. Thanks to reviewers for their valuable comments.

Conflicts of Interest

The authors declare no conflict of interest.

References

  1. Chen, X.; Liu, J.; Liu, H.; Wang, Y. Freezing Action of Soil and Foundation; Science Press: Beijing, China, 2011; pp. 10–15. [Google Scholar]
  2. Xu, X.; Wang, J.; Zhang, L. Physics of Frozen Soil, 2nd ed.; Science Press: Beijing, China, 2010; pp. 75–82. [Google Scholar]
  3. Mohseni, S.; Payan, M.; Chenari, R.J. Soil–structure interaction analysis in natural heterogeneous deposits using random field theory. Innov. Infrastruct. Solut. 2018, 3, 62. [Google Scholar] [CrossRef]
  4. Wang, F.; Cheng, P.; Wang, L.; Wang, X. Study on engineering properties of silt sand and construction technology of subgrade. J. Chin. Foreign Highw. 2010, 30, 42–45. [Google Scholar]
  5. Hossain, K.M.A.; Lachemi, M.; Easa, S. Stabilized soils for construction applications incorporating natural resources of Papua New Guinea. Conserv. Recy. 2007, 51, 711–731. [Google Scholar] [CrossRef]
  6. Hossain, K.M.A.; Mol, L. Some engineering properties of stabilized clayey soils incorporating natural pozzolans and industrial wastes. Constr. Build. Mater. 2011, 25, 3495–3501. [Google Scholar] [CrossRef]
  7. Anupam, A.; Kumar, P. Use of various agricultural and industrial waste materials in road construction. Procedia Soc. Behav. Sci. 2013, 104, 264–273. [Google Scholar] [CrossRef] [Green Version]
  8. Cai, Y.; Zheng, Y.; Liu, Z.; Wang, C. Study of dynamic response of silty sand subgrade loaded by airplane. Rock Soil Mech. 2012, 33, 193–198. [Google Scholar]
  9. Cheng, P.; Yu, D.; Fan, Y. Monitoring and analysis of moisture and temperature of silty soil subgrade in seasonally frozen region. Highway 2011, 10, 192–197. [Google Scholar]
  10. Chen, Y. Experimental Study on Road Performance of Reinforced Soil with Bessel Curing Agent; Jilin University: Changchun, China, 2007. [Google Scholar]
  11. Wang, T.; Liu, J.; Tian, Y. Static properties of cement- and lime-modified soil subjected to freeze-thaw cycles. Rock Soil Mech. 2011, 31, 2863–2868. [Google Scholar]
  12. Wang, F.; Cheng, P. Application of compactness detector in compaction test of silty sand subgrade. J. Chin. Foreign Highw. 2015, 35, 18–22. [Google Scholar]
  13. Ma, W.; Xu, X.; Zhang, L. Influence of frost and thaw cycles on shear strength of lime silt. Chin. J. Geotech. Eng. 1999, 21, 158–160. [Google Scholar]
  14. Wang, H.; Yin, Z.; Yu, X. CBR test study of silt embankment filler. Subgrade Eng. 2006, 1, 56–58. [Google Scholar]
  15. Osula, D.A. Lime stabilization of clay minerals and soils. Eng. Geol. 1996, 42, 71–80. [Google Scholar] [CrossRef]
  16. Wang, J.; Peng, L.; Zhang, Z.; Abdulali, A. Experimental study on road performance of Libyan silty soil. J. Chin. Foreign Highw. 2015, 35, 314–317. [Google Scholar]
  17. Song, A.; Zhang, Y. Strength characteristics of cement soil and fly ash cement soil under freeze-thaw cycles. J. Chin. Foreign Highw. 2017, 37, 221–223. [Google Scholar]
  18. Yan, C.; Tang, H.; Sun, Y. Study on the soil of slipping zone in landslides and its significance by scanning electron microscope and X-ray diffractometer. Geol. Sci. Technol. Inform. 2001, 20, 89–92. [Google Scholar]
  19. Zhang, X.; Shi, B. SEM analysis of micro-structure of the particle clusters in lime-treated expansive soils. J. Eng. Geol. 2007, 15, 654–660. [Google Scholar]
  20. Wang, B.; Zhang, M.; Shi, B. Quantitative analysis of orientation distribution of soil grains based on slop-aspect theory. Chin. J. Rock Mech. Eng. 2010, 29, 2951–2957. [Google Scholar]
  21. Cuisinier, O.; Aurio, J.C.; Borgne, T.L.; Deneele, D. Microstructure and hydraulic conductivity of a compacted lime-treated soil. Eng. Geo. 2011, 123, 187–193. [Google Scholar] [CrossRef]
  22. Chen, F.H. Foundations on Expansive Soils, 2nd revised ed.; Elsevier Science Ltd.: Amsterdam, The Netherlands, 2015; pp. 9–58. [Google Scholar]
  23. Otálvaro, I.F.; Neto, M.P.C.; Caicedo, B. Compressibility and microstructure of compacted laterites. Transp. Geotech. 2015, 5, 20–34. [Google Scholar] [CrossRef]
  24. Choobbasti, A.J.; Kutanaei, S.S. Microstructure characteristics of cement-stabilized sandy soil using nanosilica. J. Rock Mech. Geotech. Eng. 2017, 9, 981–988. [Google Scholar] [CrossRef]
  25. Cordão Neto, M.P.; Hernández, O.; Reinaldo, R.L.; Borges, C.; Caicedo, B. Study of the relationship between the hydromechanical soil behavior and microstructure of a structured soil. Earth Sci. Res. J. 2018, 22, 91–101. [Google Scholar] [CrossRef]
  26. Zhang, Q.; Wang, J.; Liu, B.; Zeng, Y. Quantitative research on microstructure of modified soil with cement. Hydrogeol. Eng. Geo. 2015, 42, 92–96. [Google Scholar]
  27. Liao, Y.; Zhang, Z.; Xiao, S.; Liu, K.; Yang, X. Microstructure research on cement stabilized clays. Chin. J. Rock Mech. Eng. 2016, 35, 4318–4327. [Google Scholar]
  28. Wang, J.; Zhou, L.; Zhong, C.; Zhang, Y. Study on the influence of microstructure change of silty sand on macroscopic mechanical parameters under freeze-thaw cycles. Highway 2017, 10, 22–29. [Google Scholar]
  29. Xiao, S.; Liao, Y.; Zhang, Z.; Liu, K.; Yang, X. Microstructure research on cement stabilized sandy soils. Chin. J. Undergr. Space Eng. 2018, 14, 43–50. [Google Scholar]
  30. Sun, S. Study on Mechanical Properties of Subgrade Cement Modified Silty Soil in Seasonally Frozen Area; Jilin Jianzhu University: Changchun, China, 2019. [Google Scholar]
  31. (JTG E40-2007). Test Methods of Soils for Highway Engineering; Renmin Communication Press: Beijing, China, 2010. [Google Scholar]
  32. (JTG E51-2009). Test Methods of Materials Stabilized with Inorganic Binders for Highway Engineering; Renmin Communication Press: Beijing, China, 2010. [Google Scholar]
  33. Bing, W. Freezing Damage and Prevention; Harbin Institute of Technology Press: Harbin, China, 1991. [Google Scholar]
  34. He, Y. Dynamic and Static Mechanical Properties Study on Polypropylene Fiber Improving Fly Ash Soil; Jilin University: Changchun, China, 2010. [Google Scholar]
  35. Zaman, M.M.; Naji, K.N. Effect of freeze-thaw cycles on class C fly ash stabilized aggregate base. In Proceedings of the 82nd Annual Meeting: Transportation Research Board, Washington, DC, USA, 12–16 January 2003. [Google Scholar]
  36. Yu, L.; Xu, X.; Qiu, M.; Li, P.; Yan, Z. Influence of freeze-thaw on shear strength properties of saturated silty clay. Rock Soil Mech. 2010, 31, 2448–2452. [Google Scholar]
  37. Chang, D.; Liu, J.; Li, X.; Yu, Q. Experiment study of effects of freezing-thawing cycles on mechanical properties of Qinghat-Tibet silty sand. Chin. J. Rock Mech. Eng. 2014, 33, 1496–1502. [Google Scholar]
  38. Liu, S.; Fang, L.; Chen, H. Argument on the fractal structure of special soil particle size distribution. Chin. J. Geotech. Eng. 1993, 15, 23–30. [Google Scholar]
  39. Li, X.; Hu, R.; Zhang, L. Microstructural changes in soft soil consolidation. Earth Geosci. Front. 2000, 7, 147–152. [Google Scholar]
  40. Shi, B. Quantitative evaluation of microstructure during compaction of cohesive soil. Chin. J. Geotech. Eng. 1996, 18, 60–65. [Google Scholar]
  41. Liu, S.; Cai, H.; Yang, Y. Research progress on grey relational analysis model. Sys. Eng. Theory Pract. 2013, 33, 2041–2046. [Google Scholar]
  42. Lin, W. Correlation analysis of physical and mechanical properties of geotechnical materials. Chin. Rural Water Hydropower. 2007, 27–32. [Google Scholar]
Figure 1. Magnification 100× microscopic images (a) S0 and (b) S2.
Applsci 10 02182 g001
Figure 2. The effect of freeze-thaw (F-T) cycles on (a) cohesion and (b) internal friction angle.
Applsci 10 02182 g002
Figure 3. The relationship curve of F-T cycles and shear strength: (a) S0 and (b) S2.
Applsci 10 02182 g003
Figure 4. Average particle diameter percentage under F-T cycles: (a) S0 and (b) S2.
Applsci 10 02182 g004
Figure 5. The curve of Dps and F-T cycles.
Applsci 10 02182 g005
Figure 6. Particle abundance percentage under F-T cycles: (a) S0 and (b) S2.
Applsci 10 02182 g006
Figure 7. The curve of R and F-T cycles.
Applsci 10 02182 g007
Figure 8. Schematic diagram of the Dpr algorithm.
Applsci 10 02182 g008
Figure 9. The curve of Dpr versus F-T cycles.
Applsci 10 02182 g009
Figure 10. The curve of Hm and F-T cycles.
Applsci 10 02182 g010
Figure 11. Nightingale rose chart of S0 after (a) 0, (b) 1, (c) 2, (d) 3, (e) 4, (f) 5, (g) 6, and (h) 8 F-T cycles.
Applsci 10 02182 g011
Figure 12. Nightingale rose chart of S2 after (a) 0, (b) 1, (c) 2, (d) 3, (e) 4, (f) 5, (g) 6, and (h) 8 F-T cycles.
Applsci 10 02182 g012
Figure 13. Percentage of Dh under F-T cycles: (a) S0 and (b) S2.
Applsci 10 02182 g013
Figure 14. The curve of Dhs and F-T cycles.
Applsci 10 02182 g014
Figure 15. The curve of the internal friction angle of S0 versus the five most relevant microscopic parameters after F-T cycles: (a) C, (b) Dhs, (c) Dpr, (d) Hm, and (e) Dh.
Applsci 10 02182 g015
Figure 16. The curve of the internal friction angle of S2 versus the five most relevant microscopic parameters after F-T cycles: (a) Dh, (b) R, (c) Dps, (d) Dp, and (e) Dpr.
Applsci 10 02182 g016
Table 1. Particle analysis test results of silty soil.
Particle Diameter (mm)5.02.01.00.50.250.0750.010.0050.0020.001
The percentage of soil particles smaller than the particle size to the total mass of the soil (%)10099.6999.3698.7998.4997.0635.3818.175.902.95
Table 2. The basic physical properties of silty soil. S0, sample with 0% cement content.
SampleCement Content (%)Natural Moisture Content w (%)Liquid Limit wL (%)Plastic Limit wP (%)Plasticity Index IPOptimum Moisture Content wopt (%)Maximum Dry Density ρd(g/cm3)
S005.4722.414.18.38.532.030
S225.4726.617.68.99.692.042
Note: the cement content measured by the percentage of cement in the mass of the soil.
Table 3. Dp under F-T cycles (μm).
SampleF-T Cycles
01234568
S035.5928.8832.6032.4826.3830.9127.0732.61
S238.6136.4941.3645.2038.6441.6445.4639.15
Table 4. C under F-T cycles.
SampleF-T cycles
01234568
S00.4860.4510.4770.4790.4440.4900.4520.475
S20.5110.4980.5020.5150.5160.4780.5140.516
Table 5. Dh under F-T cycles (μm).
SampleF-T cycles
01234568
S016.1117.5620.3619.8319.4418.5718.2818.84
S216.0117.4319.7717.4316.2517.1616.1116.34
Table 6. Correlation between microscopic parameters and cohesion.
SampleMicroscopic Parameters
DpDpsCRDprHmDhDhs
S00.7850.5100.7100.7160.6710.6710.5750.673
S20.5510.6870.6020.5650.5820.6060.5450.606
Table 7. Correlation between microscopic parameters and internal friction angle.
SampleMicroscopic Parameters
DpDpsCRDprHmDhDhs
S00.6140.5600.7740.6730.7650.7560.7460.773
S20.6790.6830.6480.6860.6670.6640.6870.658

