Article

New Ternary Compounds of the Composition Cu2SnTi3 and Their Crystal Structures

1
Department of Mechanical Engineering, China University of Science and Technology, Taipei 115, Taiwan
2
Graduate Institute of Precision Engineering, National Chung Hsing University, Taichung 402, Taiwan
*
Author to whom correspondence should be addressed.
Appl. Sci. 2020, 10(24), 8776; https://doi.org/10.3390/app10248776
Submission received: 5 November 2020 / Revised: 2 December 2020 / Accepted: 5 December 2020 / Published: 8 December 2020
(This article belongs to the Special Issue Selected Papers from ISET 2020 and ISPE 2020)

Abstract

:

Featured Application

This work confirms the crystal structures of the ternary compound Cu2SnTi3.

Abstract

A new ternary compound Cu2SnTi3 has been synthesized by vacuum sintering at 900 °C. The atomic structures of CaCu5- and InNi2-like Cu2SnTi3 are calculated using density functional theory methods. The X-ray diffraction (XRD) analysis and selected area diffraction (SAD) patterns of the new ternary compound Cu2SnTi3 are considered to verify the atomic structures of CaCu5- and InNi2-like Cu2SnTi3. The results reveal that the InNi2-like Cu2SnTi3 model has the lowest total energy of −35.239 eV, representing the trigonal crystal structure. The orthorhombic crystal structure of the CaCu5-like Cu2SnTi3 model has the second lowest total energy of −33.926 eV. Our theoretical X-ray diffraction peak profiles of InNi2-like (CaCu5-like) Cu2SnTi3 are nearly identical to experimental one, leading to an error below 2.0% (3.0%). In addition, the hexagonal crystal structure of the CaCu5-like Cu2SnTi3 model has the highest total energy of −33.094 eV. The stability of the Cu2SnTi3 in terms of energy follows the order: the trigonal, orthorhombic, and hexagonal crystal structure.

1. Introduction

Cu–Sn–Ti alloys are commonly used as brazing alloys for diamond [1,2,3,4,5,6]. The composition of the microstructure of Cu–Sn–Ti alloys can be easily determined. However, the crystal structures of Cu–Sn–Ti alloys, especially those related to ternary intermetallic compounds, have not been thoroughly studied. For example, Cu-15 wt.%Ti-10–wt.%Sn alloys have various binary intermetallic compounds with different morphologies, such as Cu–Sn, Cu–Ti, and Sn–Ti intermetallic compounds, and unidentified phase domains obtained based on compositional analysis [4]. Cu2SnTi was the first found for the ternary intermetallic compound and other ternary alloys have not yet been discovered in the Cu–Sn–Ti alloy [7]. X-ray diffraction (XRD) patterns of unidentified phase can be determined but not be found in JCPDS (Joint Committee on Powder Diffraction Standards) cards. The ternary intermetallic compound of CuSnTi (Phase H) was identified using the XRD patterns [8]. In addition, the ternary intermetallic compound of CuSn3Ti5 (Phase B) and its crystal structure were resolved by the XRD patterns [9,10,11]. Furthermore, the ternary intermetallic compound of CuSnTi3 (Phase E) and its crystal structure were resolved by the XRD patterns and the selected area diffraction (SAD) patterns generated by transmission electron microscope (TEM), which matches bulklike InNi2 structure (space group: 194 P63/mmc) [12]. Recently, the Cu–Sn–Ti diffusion-triple annealed at 823 K for 60 min was extended to demonstrate that CuSnTi is in equilibrium with the stable binary compounds of Sn5Ti6, Sn3Ti2, Cu3Sn, Cu4Ti3, Cu41Sn11, and Cu4Ti [13]. More recently, a new approach based on the Monte Carlo simulation has been extensively used to demonstrate the processes of the sintering/coalescence of Cu–Ni nanoparticles [14]. This technique enables the development of a new generation of polymetallic nanomaterials for catalysts, sensors, and other applications. As of now, ternary intermetallic compounds Cu2SnTi, CuSnTi, CuSn3Ti5, and CuSnTi3 as well as binary intermetallic compounds, such as Cu–Sn, Cu–Ti, and Sn–Ti [15], are currently known crystal structures. We believe that other ternary intermetallic compounds copper, tin and titanium should still exist. Therefore, the purpose of this study is to study new ternary intermetallic compounds in Cu–Sn–Ti alloys.

2. Experimental Procedures

Cu (Cerao, 99.9% purity, average particle size: 10 μm), Sn (Cerao, 99.5% purity, average particle size: 50 μm), and TiH2 (Cerao, 99.5% purity, average particle size: 5 μm) powders were used as starting materials in this study. The powders were mixed to have a composition of 60 at.% Cu, 23 at.% Ti, and 17 at.% Sn (Cu–23Ti–17Sn). The powder was wet-milled by zirconia balls for 48 h and then dried in air. The milled powder was put into a vacuum furnace under high vacuum pressure less than 5 × 10⁻⁵ torr. The Cu–23Ti–17Sn was heated at the rate of 15 °C/min from room temperature to 650 °C keeping for 30 min, and then heated at the rate of 10 °C/min to 950 °C. Furthermore, the Cu–23Ti–17Sn was cooled by water quenching or furnace cooling. The morphology and composition of Cu–23Ti–17Sn was studied using a scanning electron microscope (SEM) and an electron probe microanalysis (EPMA), respectively. The crystal structure of Cu–23Ti–17Sn was characterized by XRD with Cu Kα radiation. The microstructure and composition of Cu–23Ti–17Sn was investigated by TEM, SAD patterns, and an energy dispersive spectrometer (EDS).

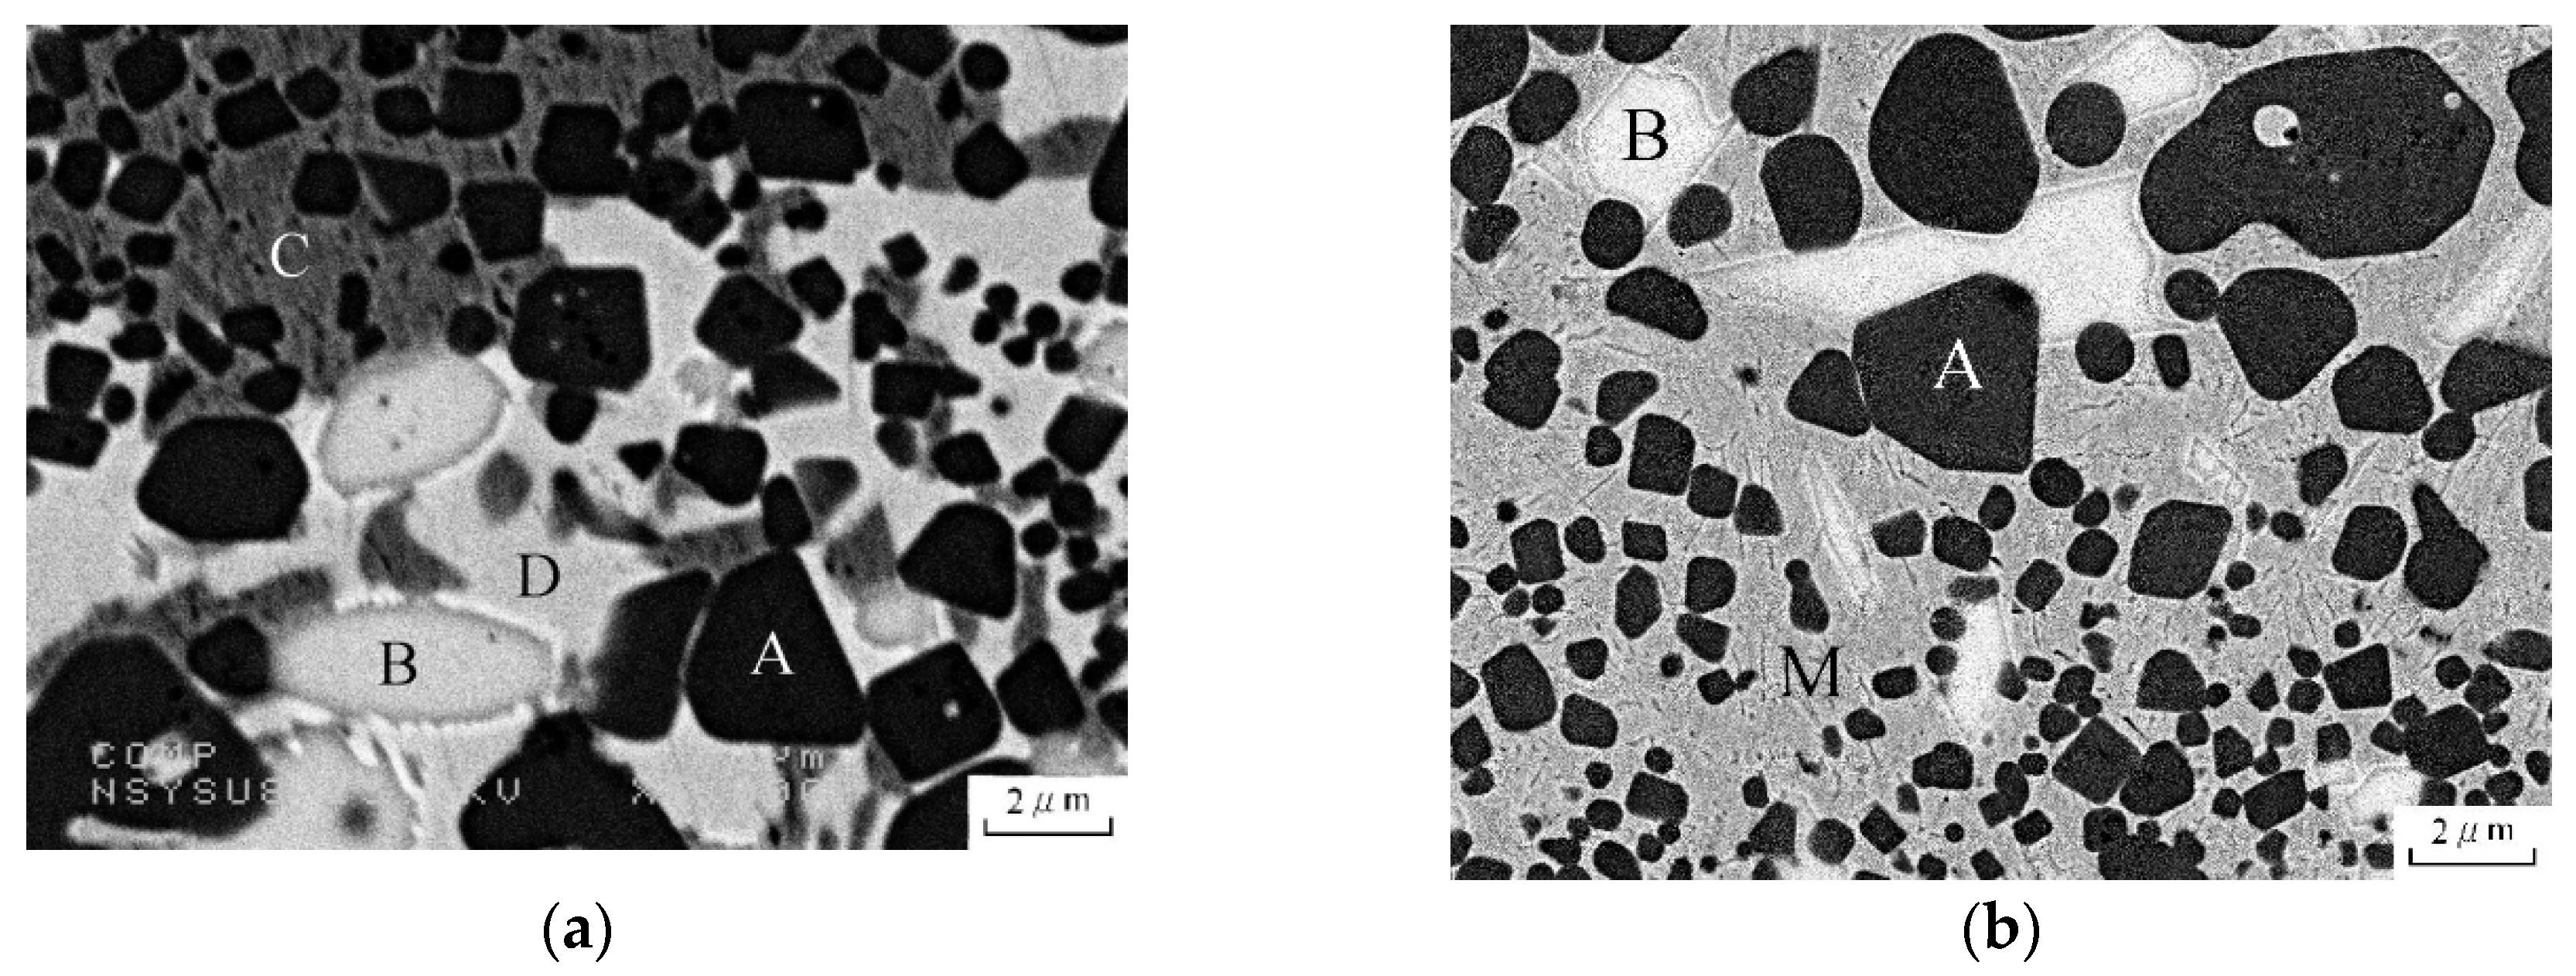
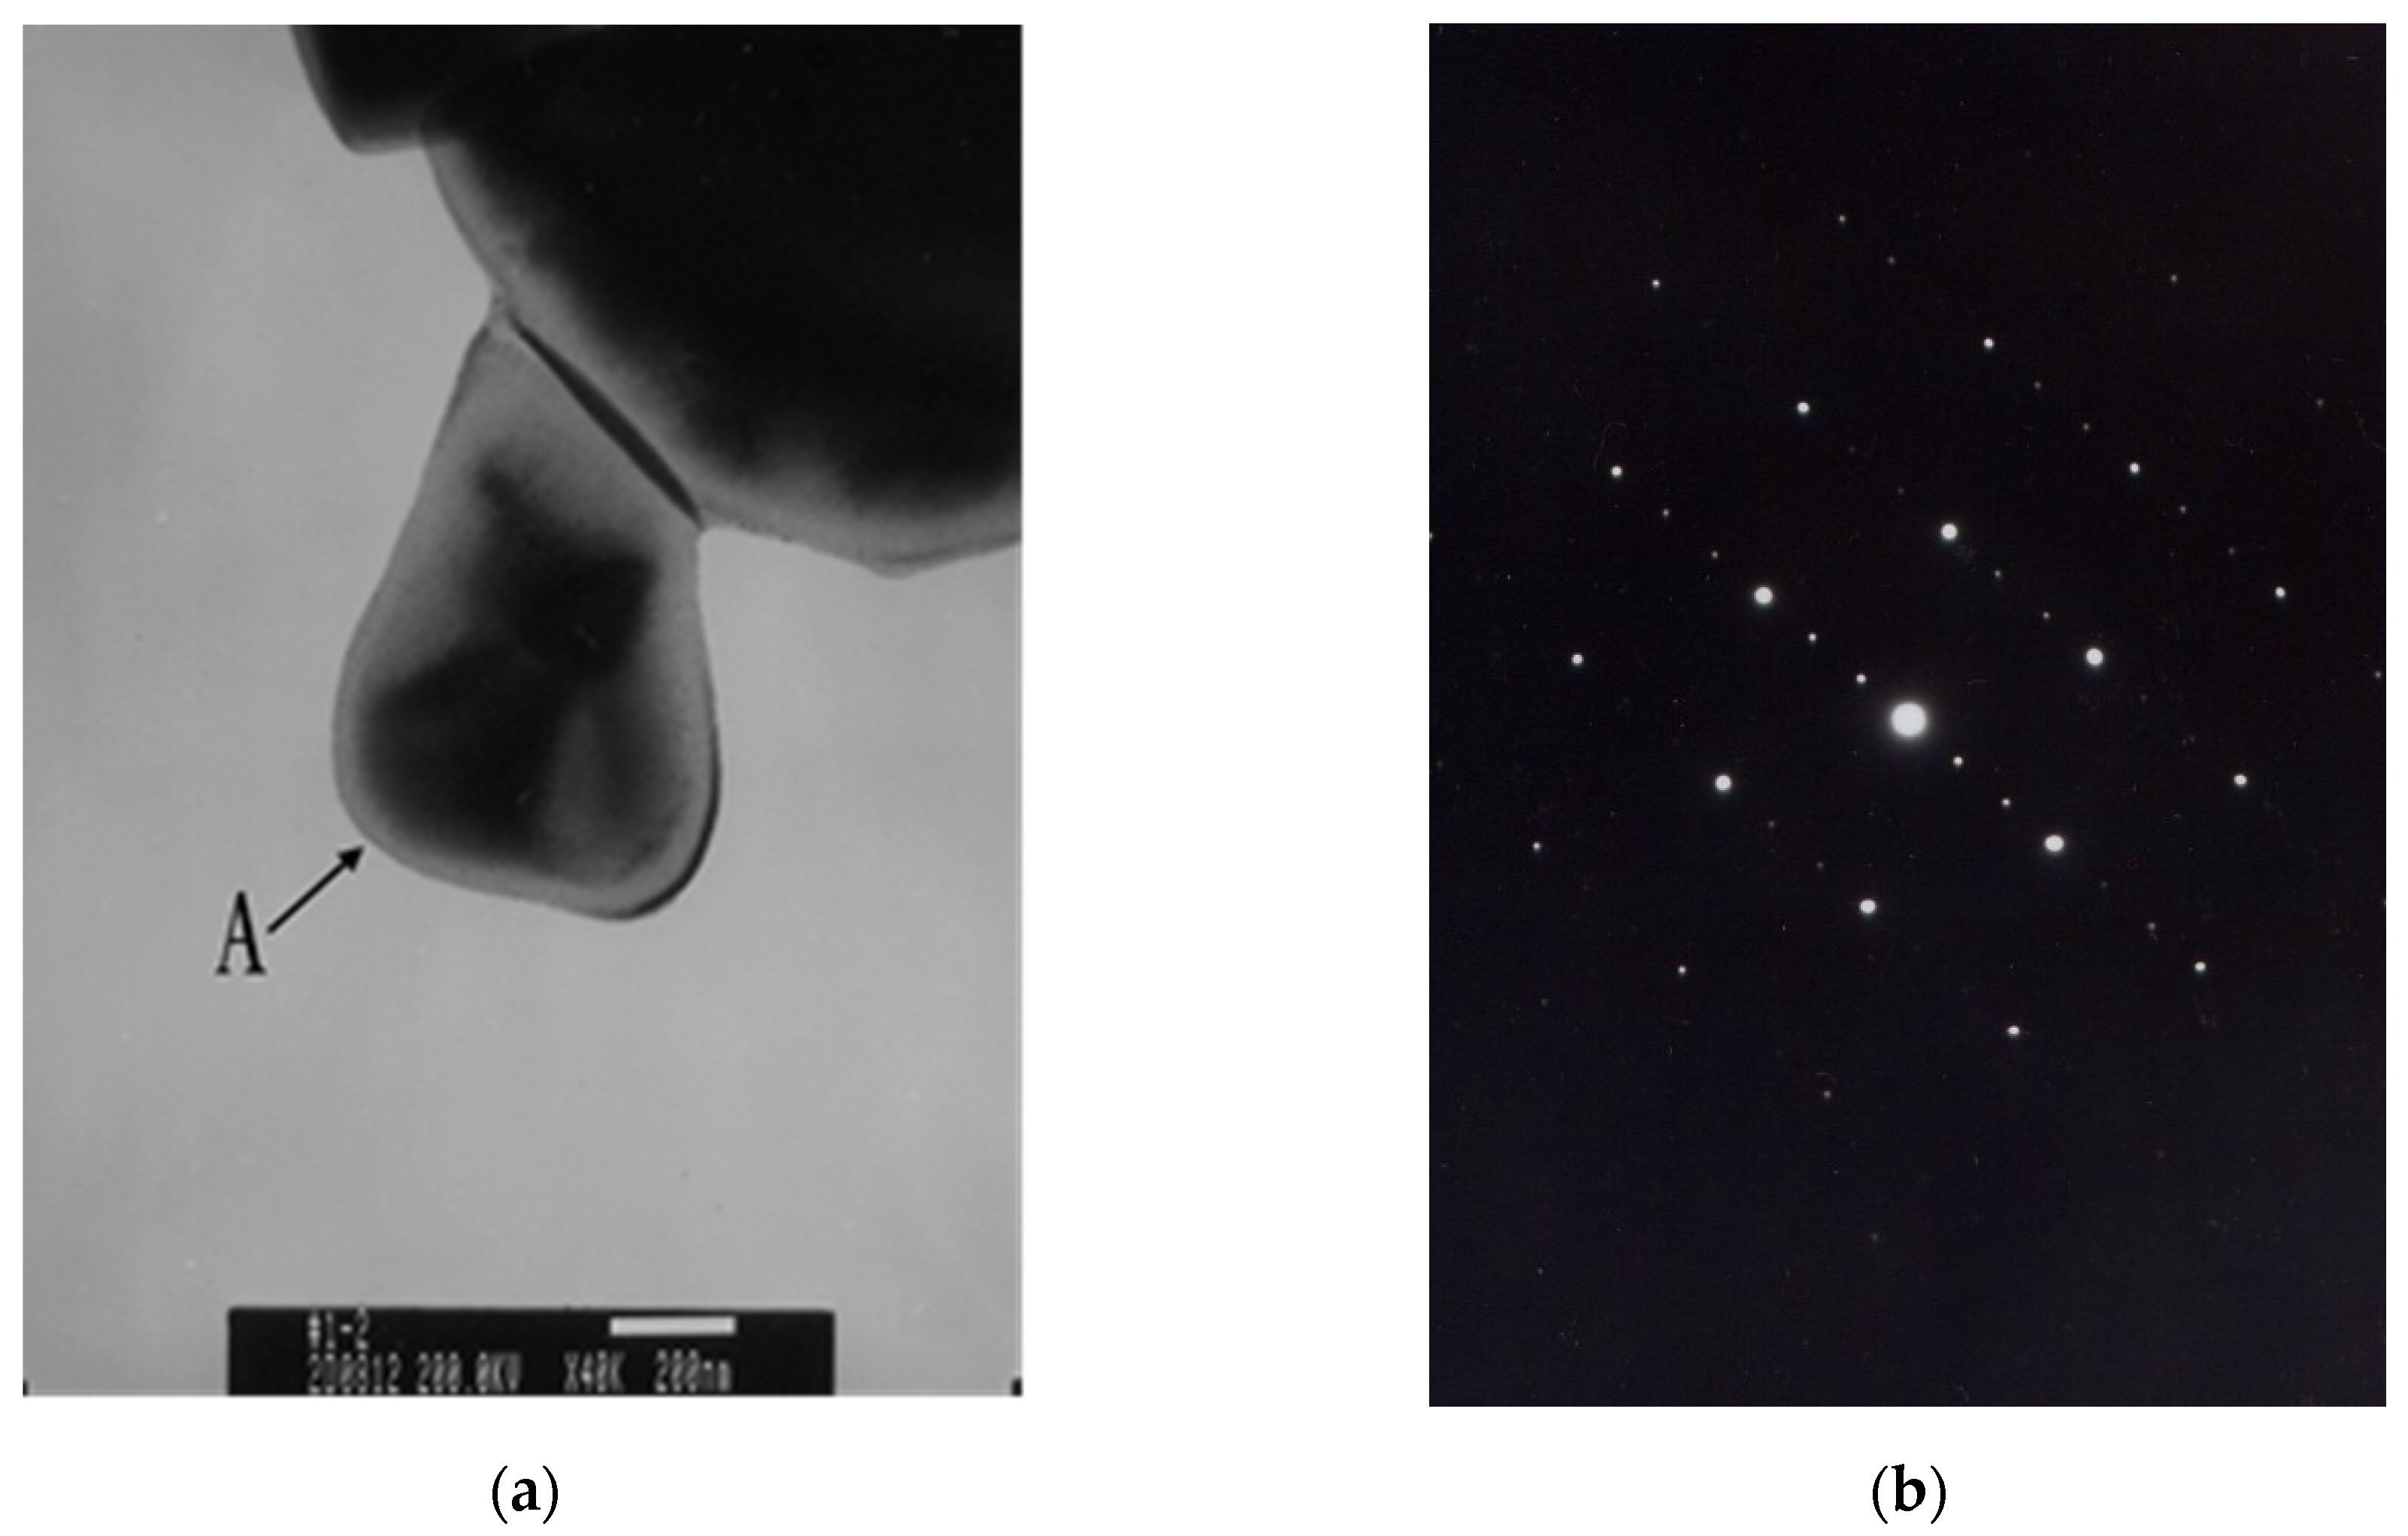
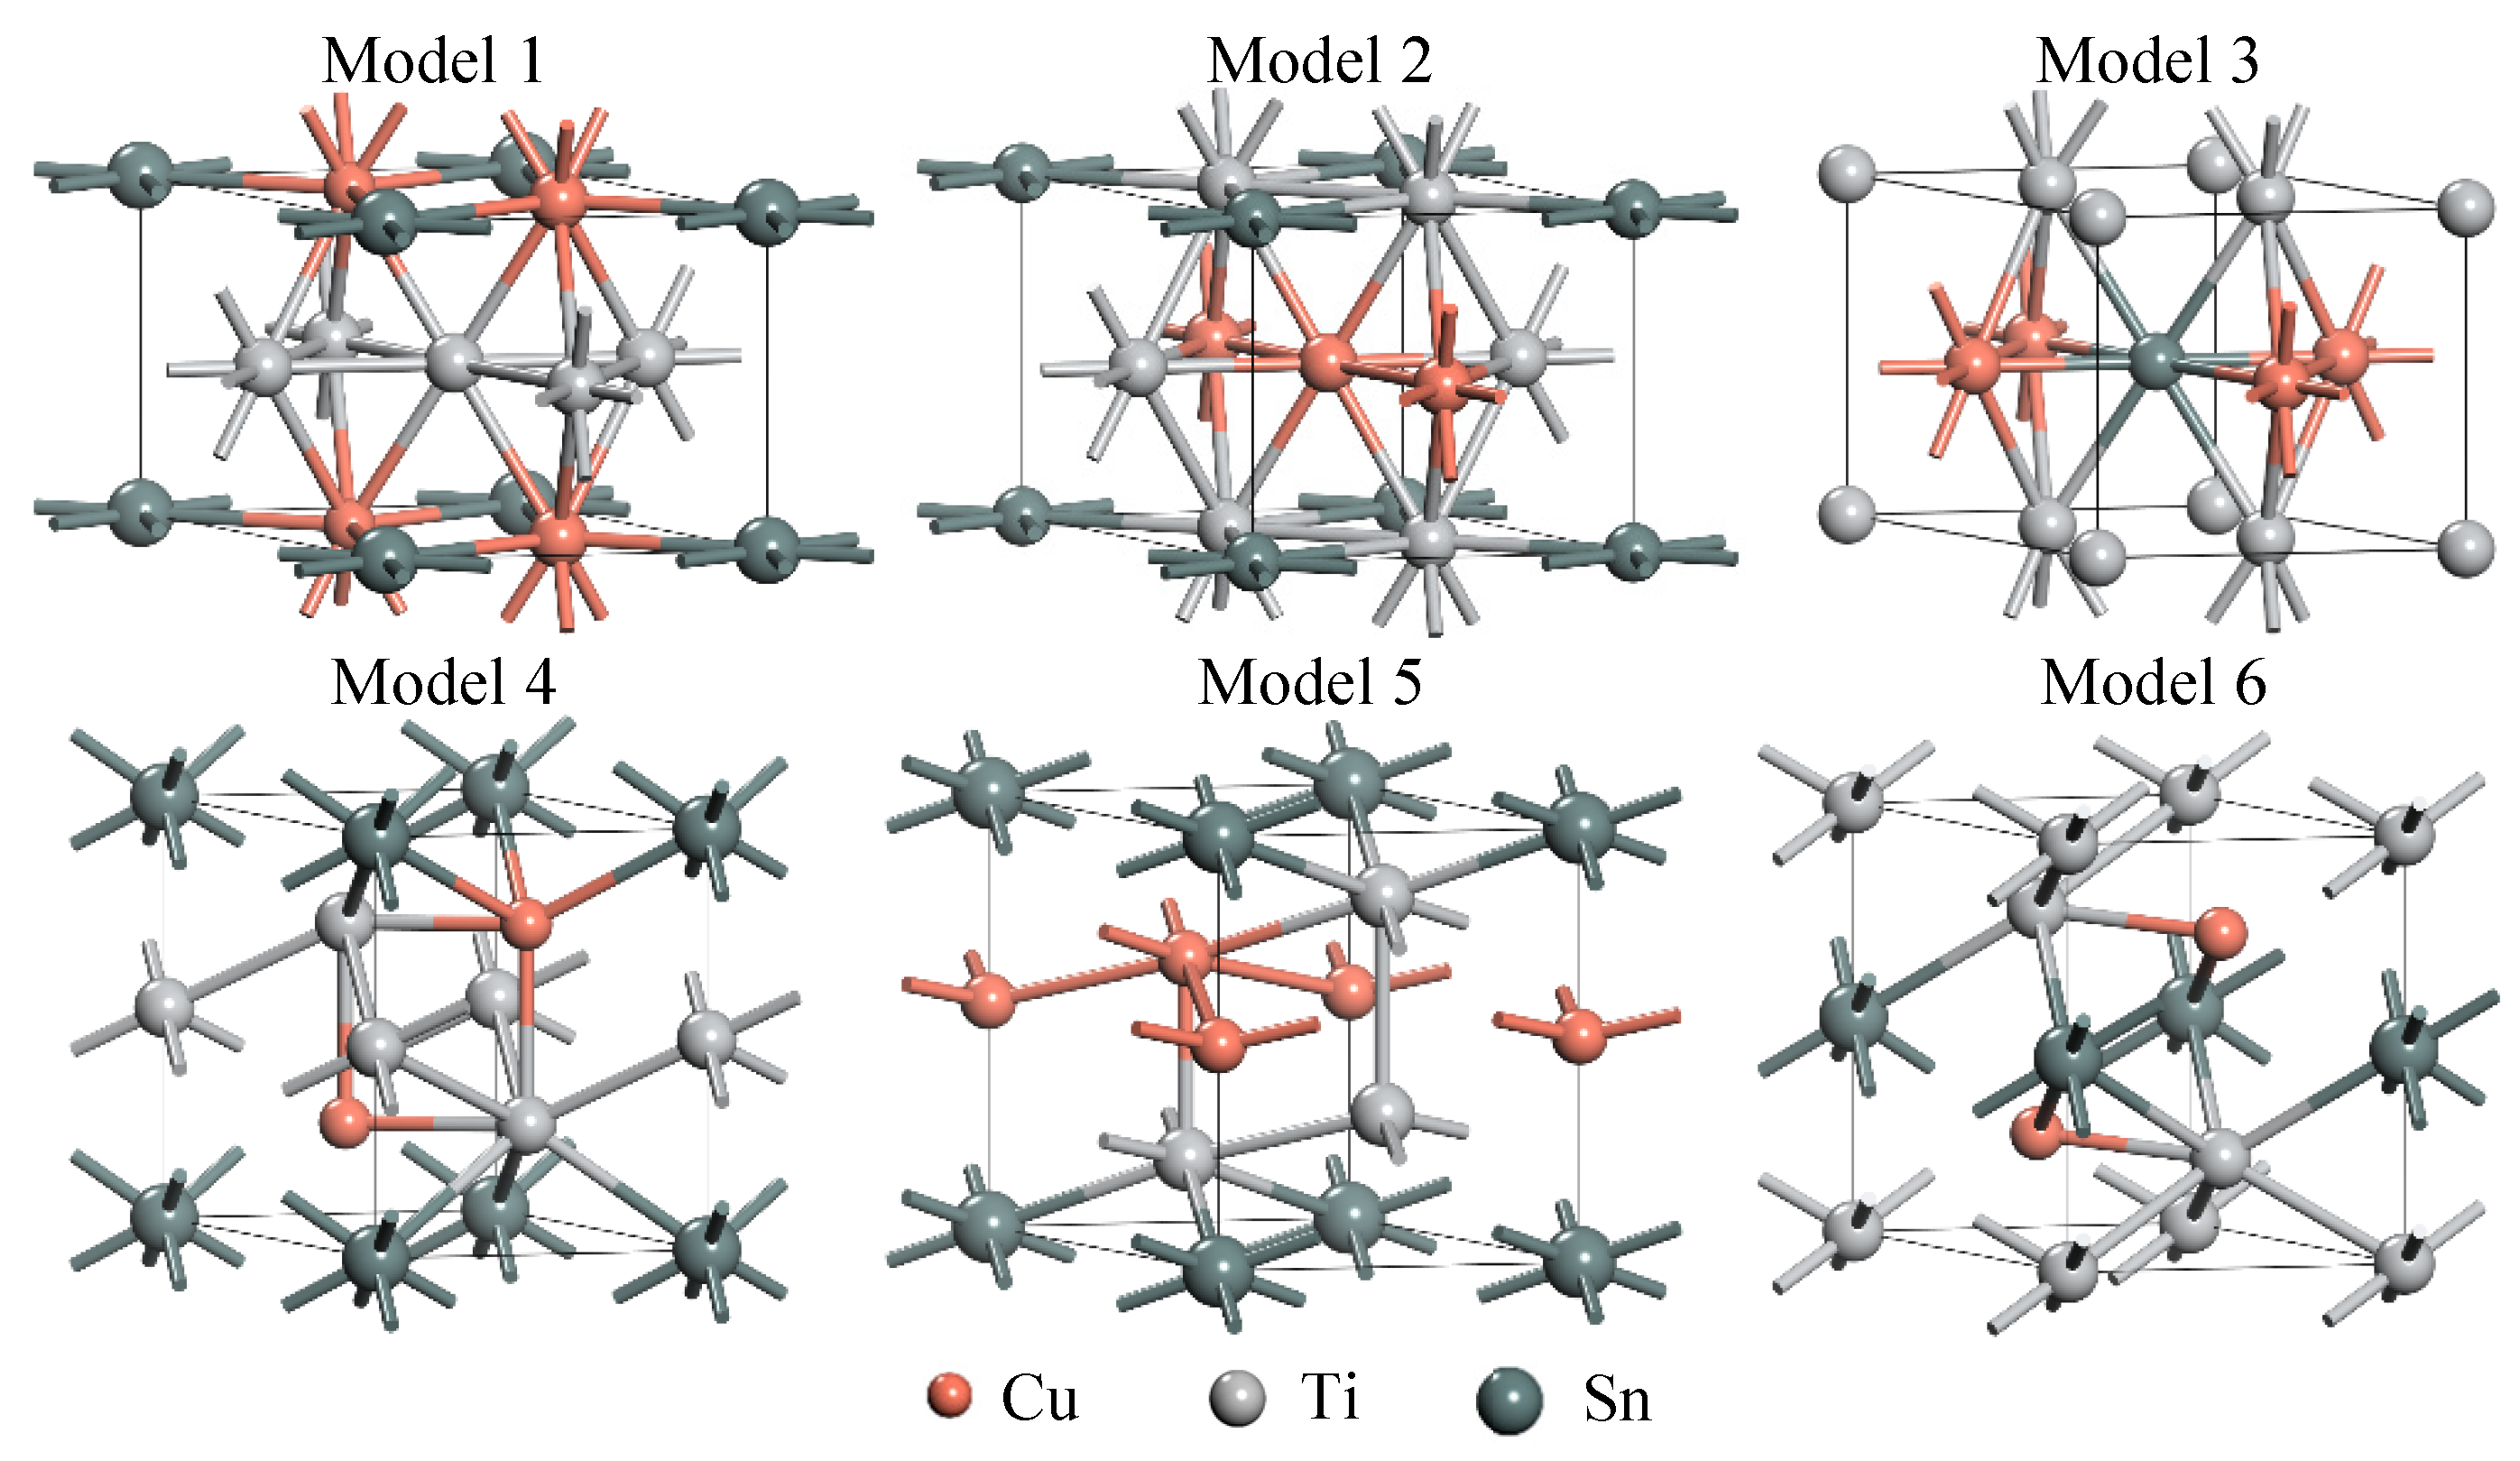
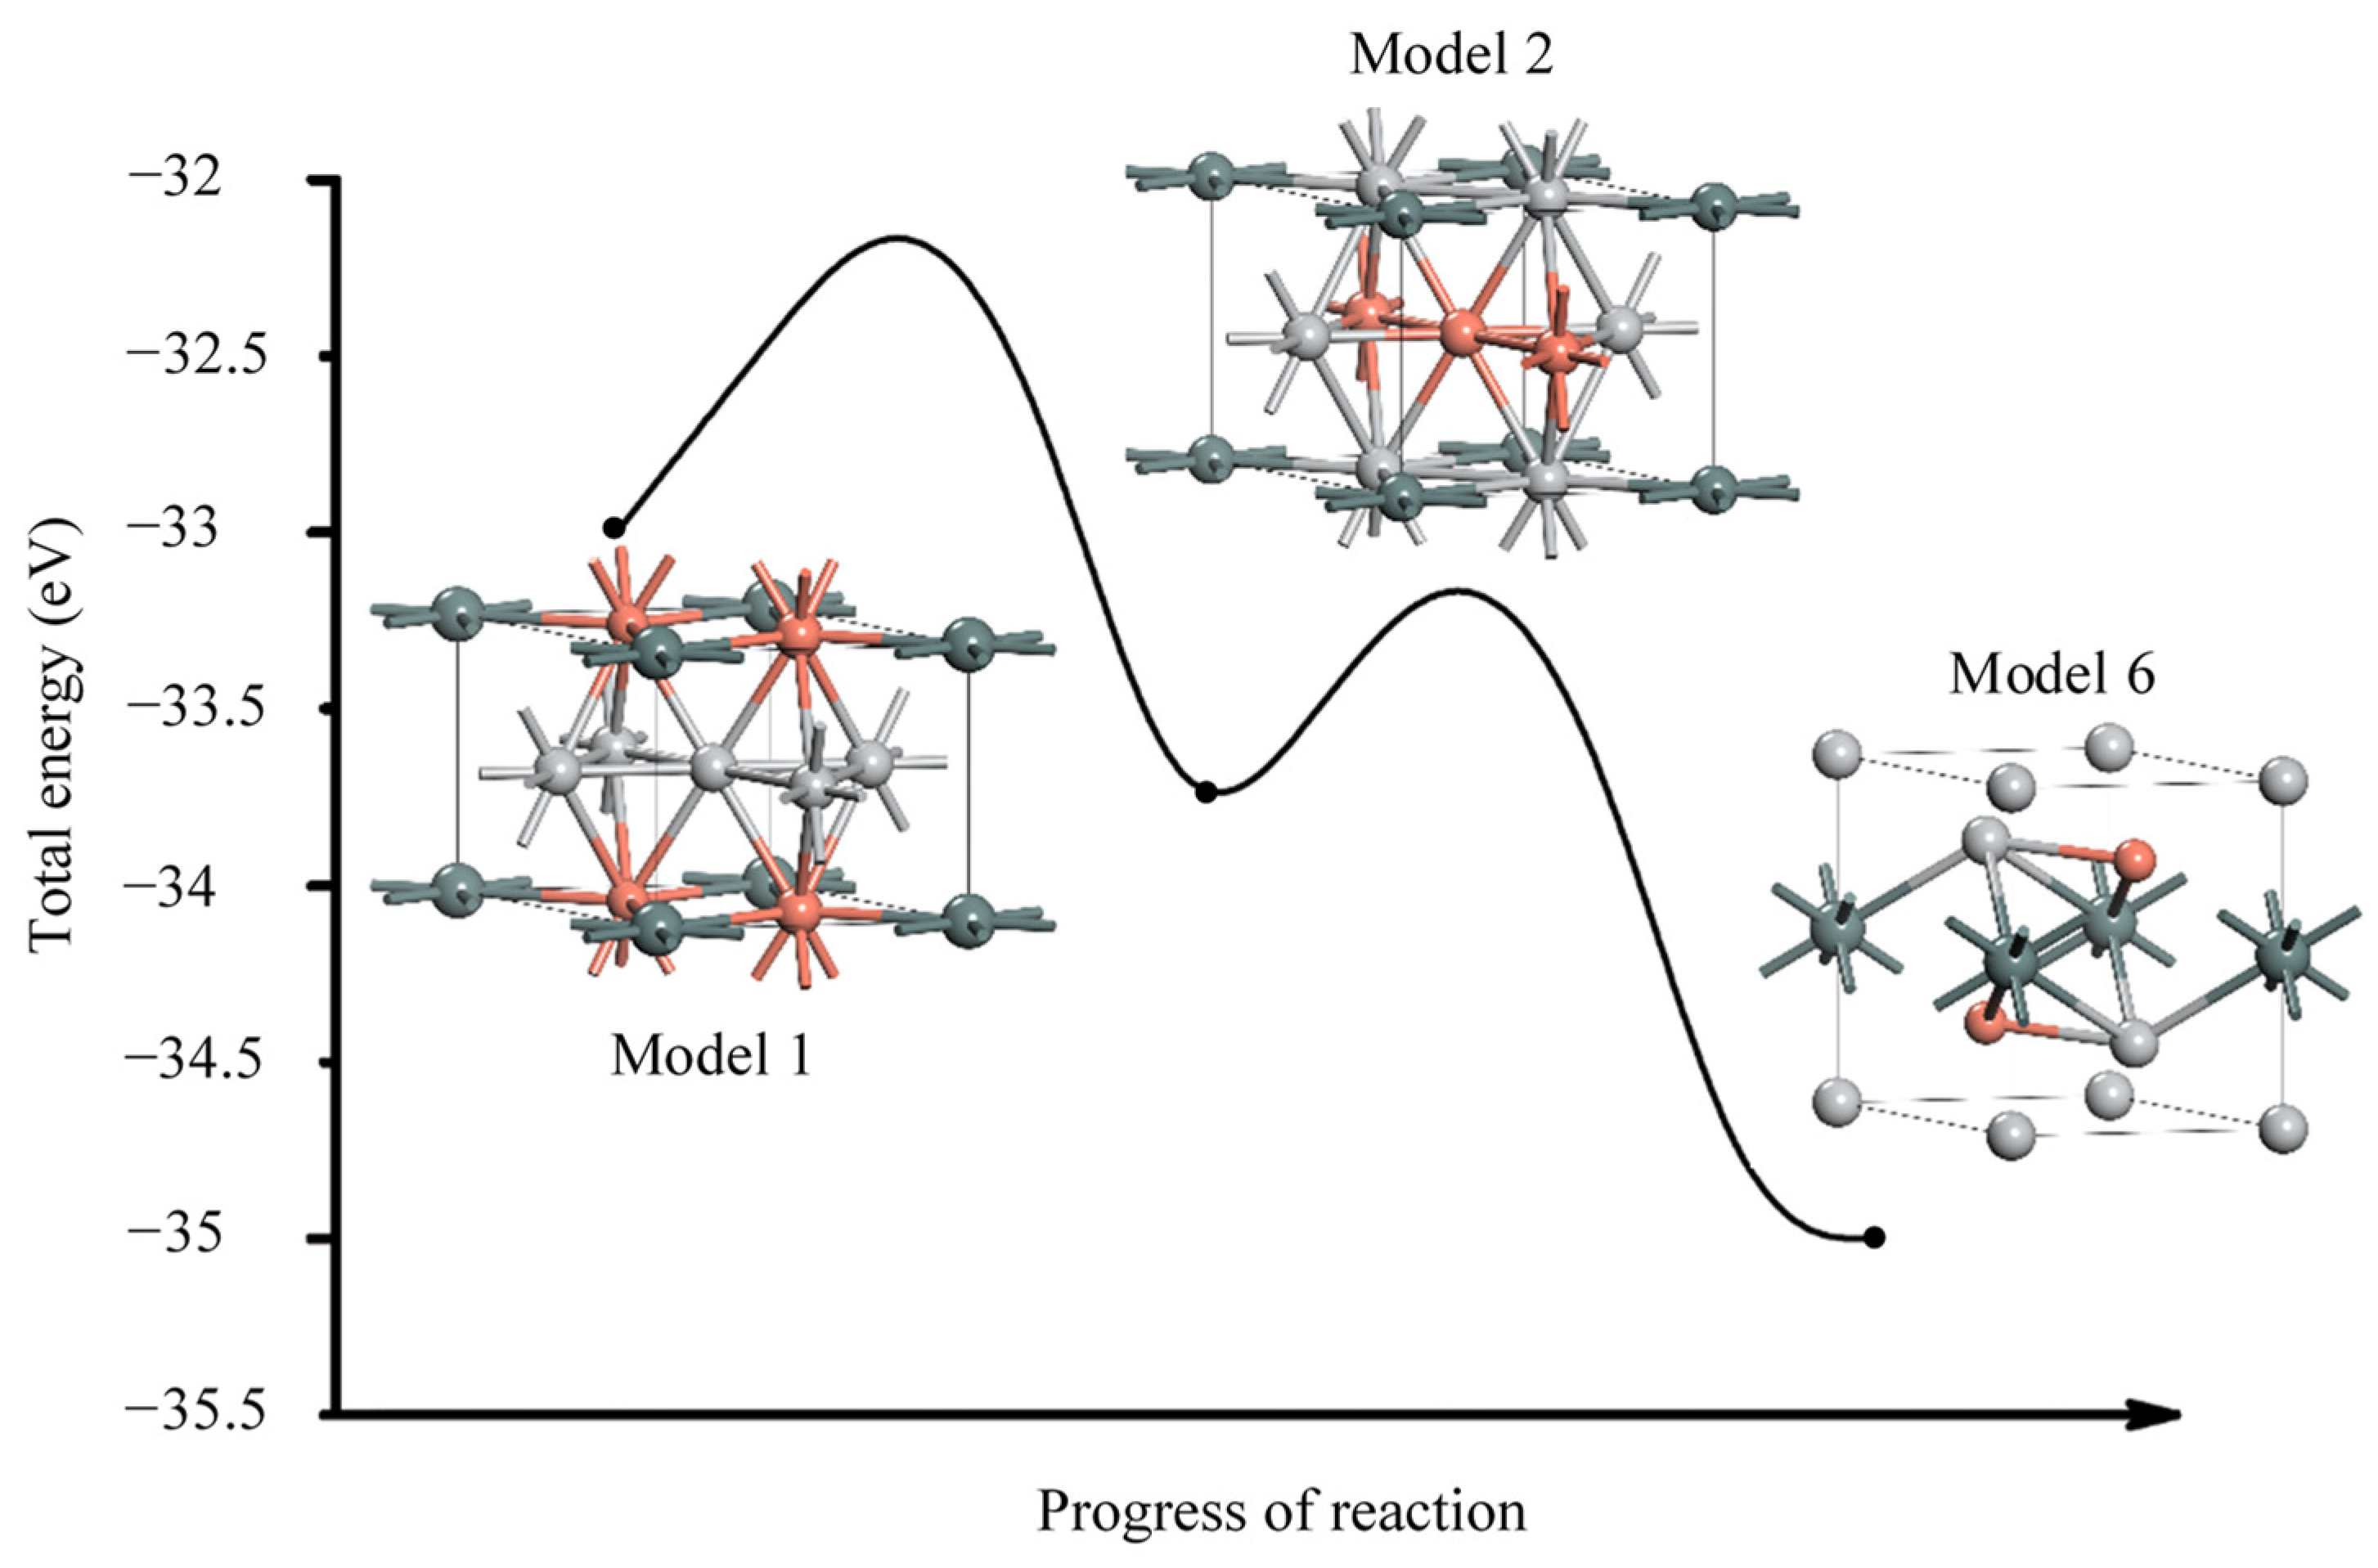
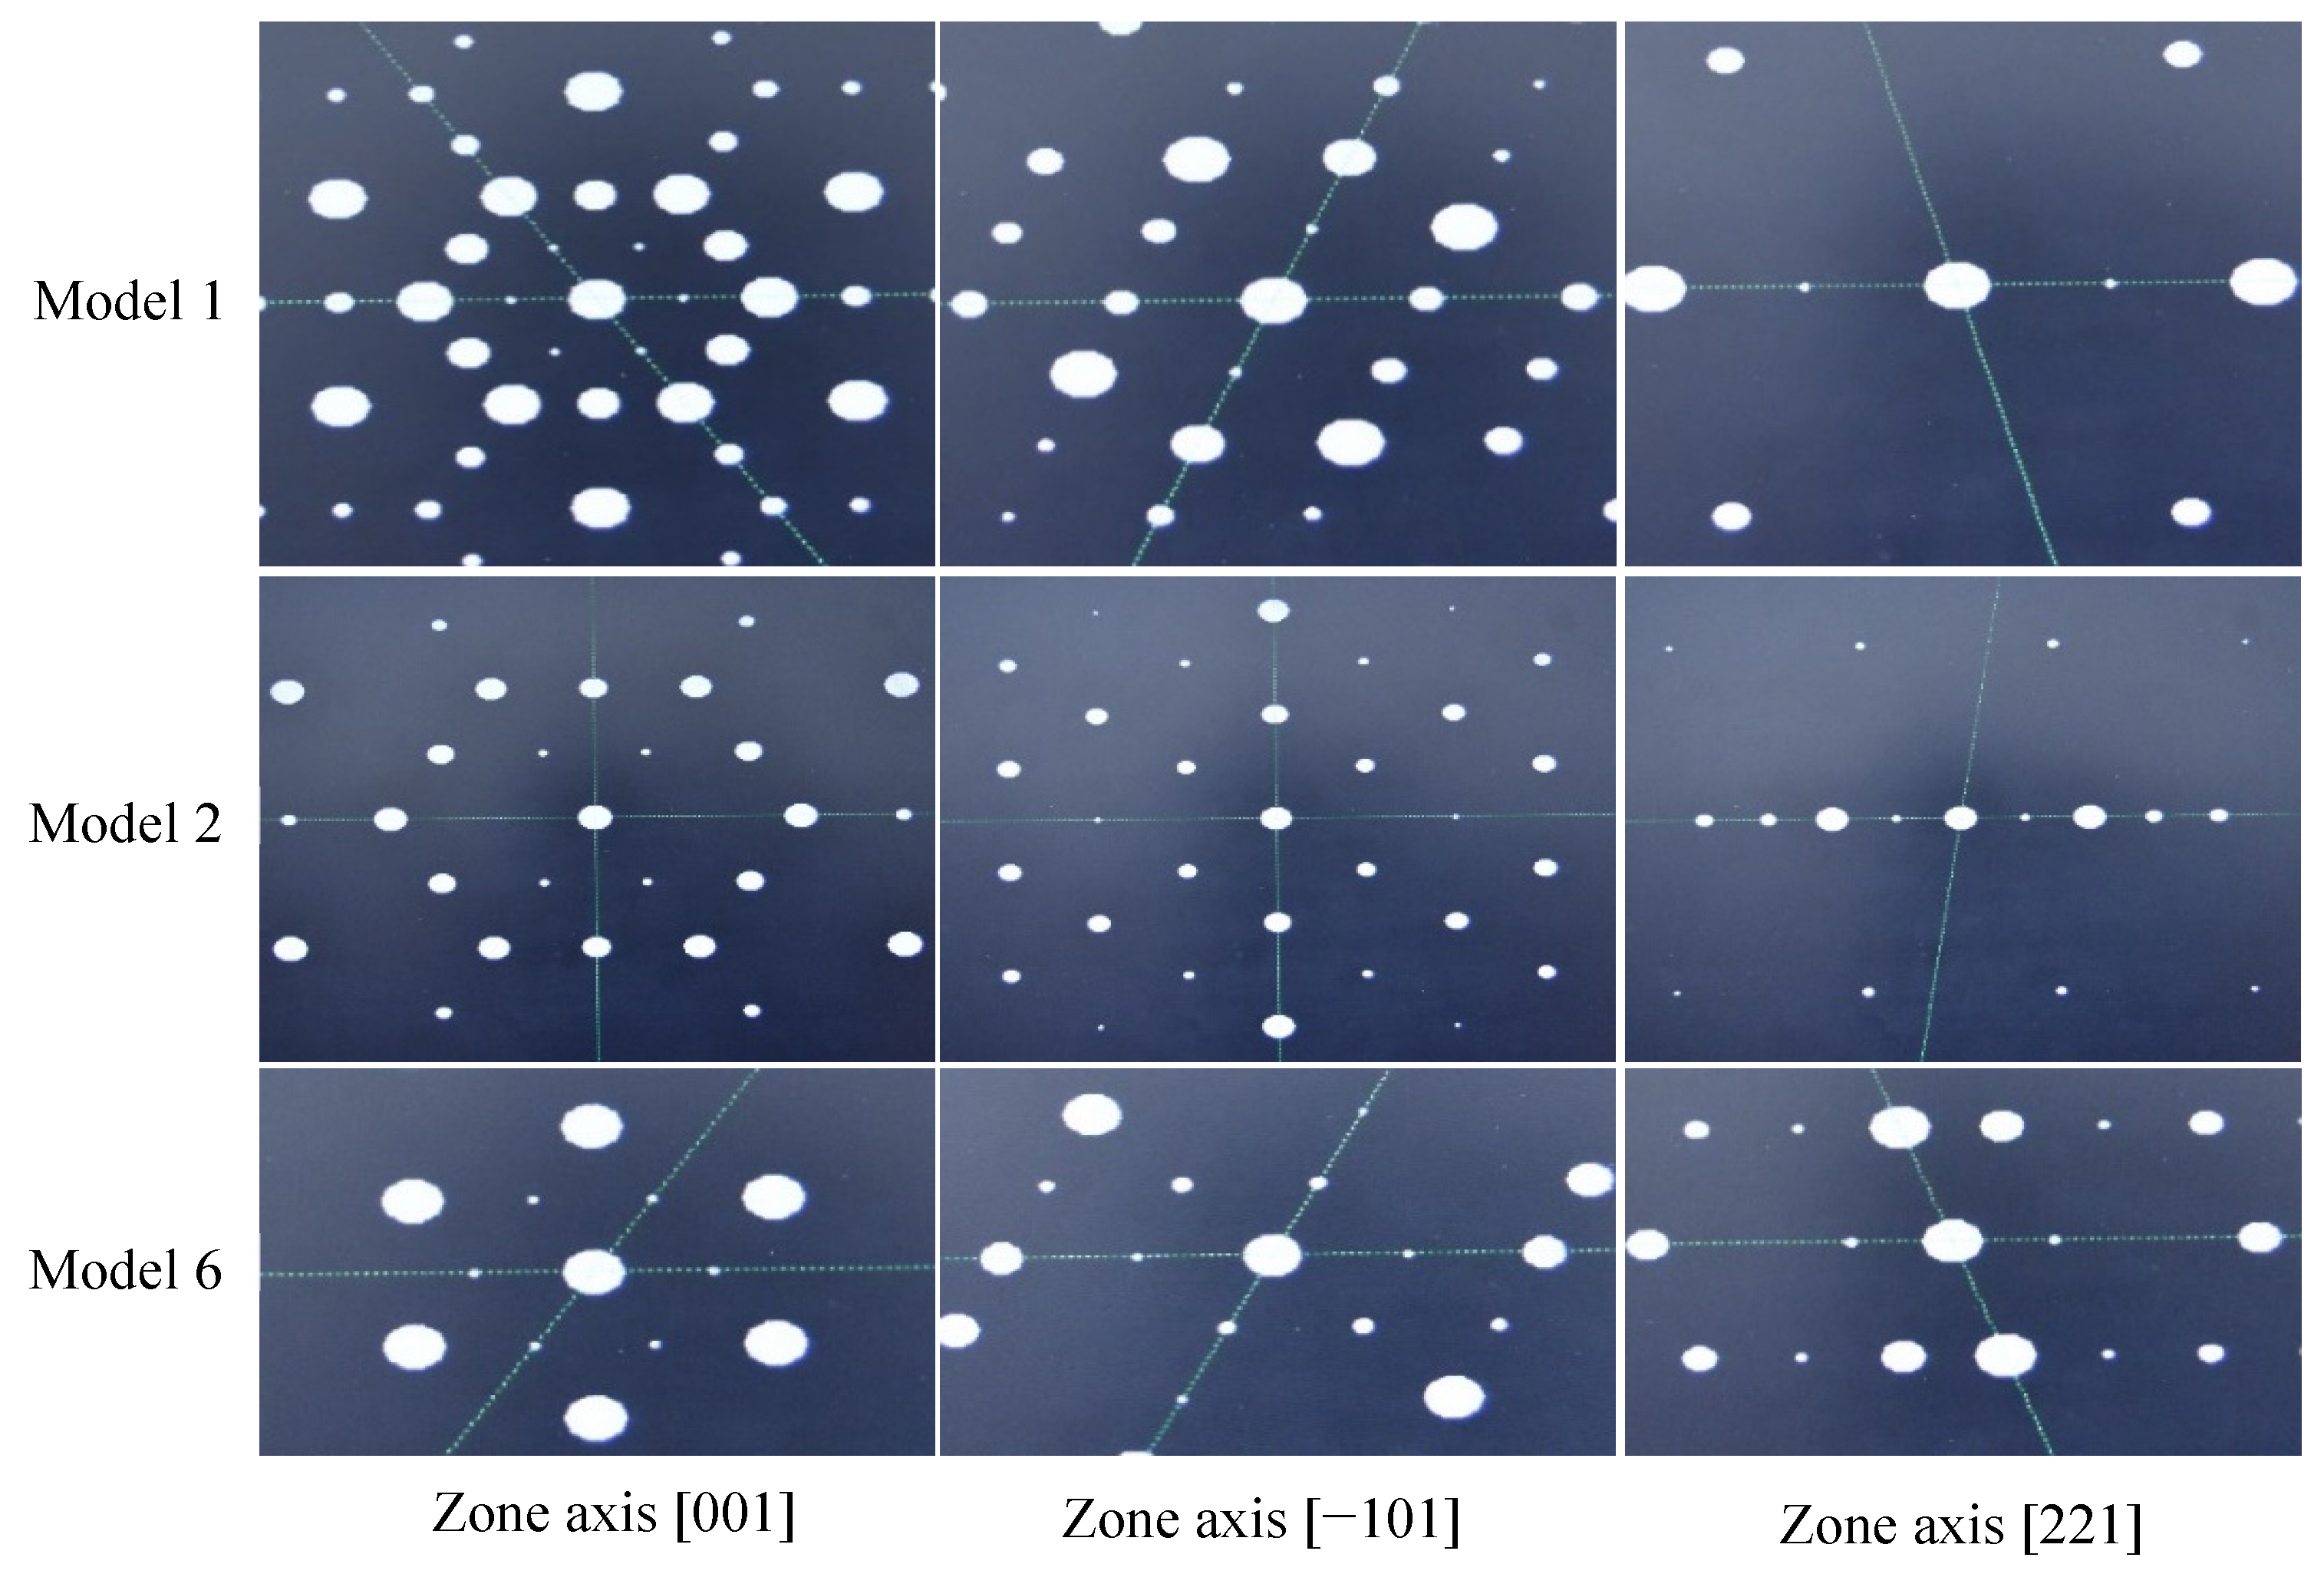
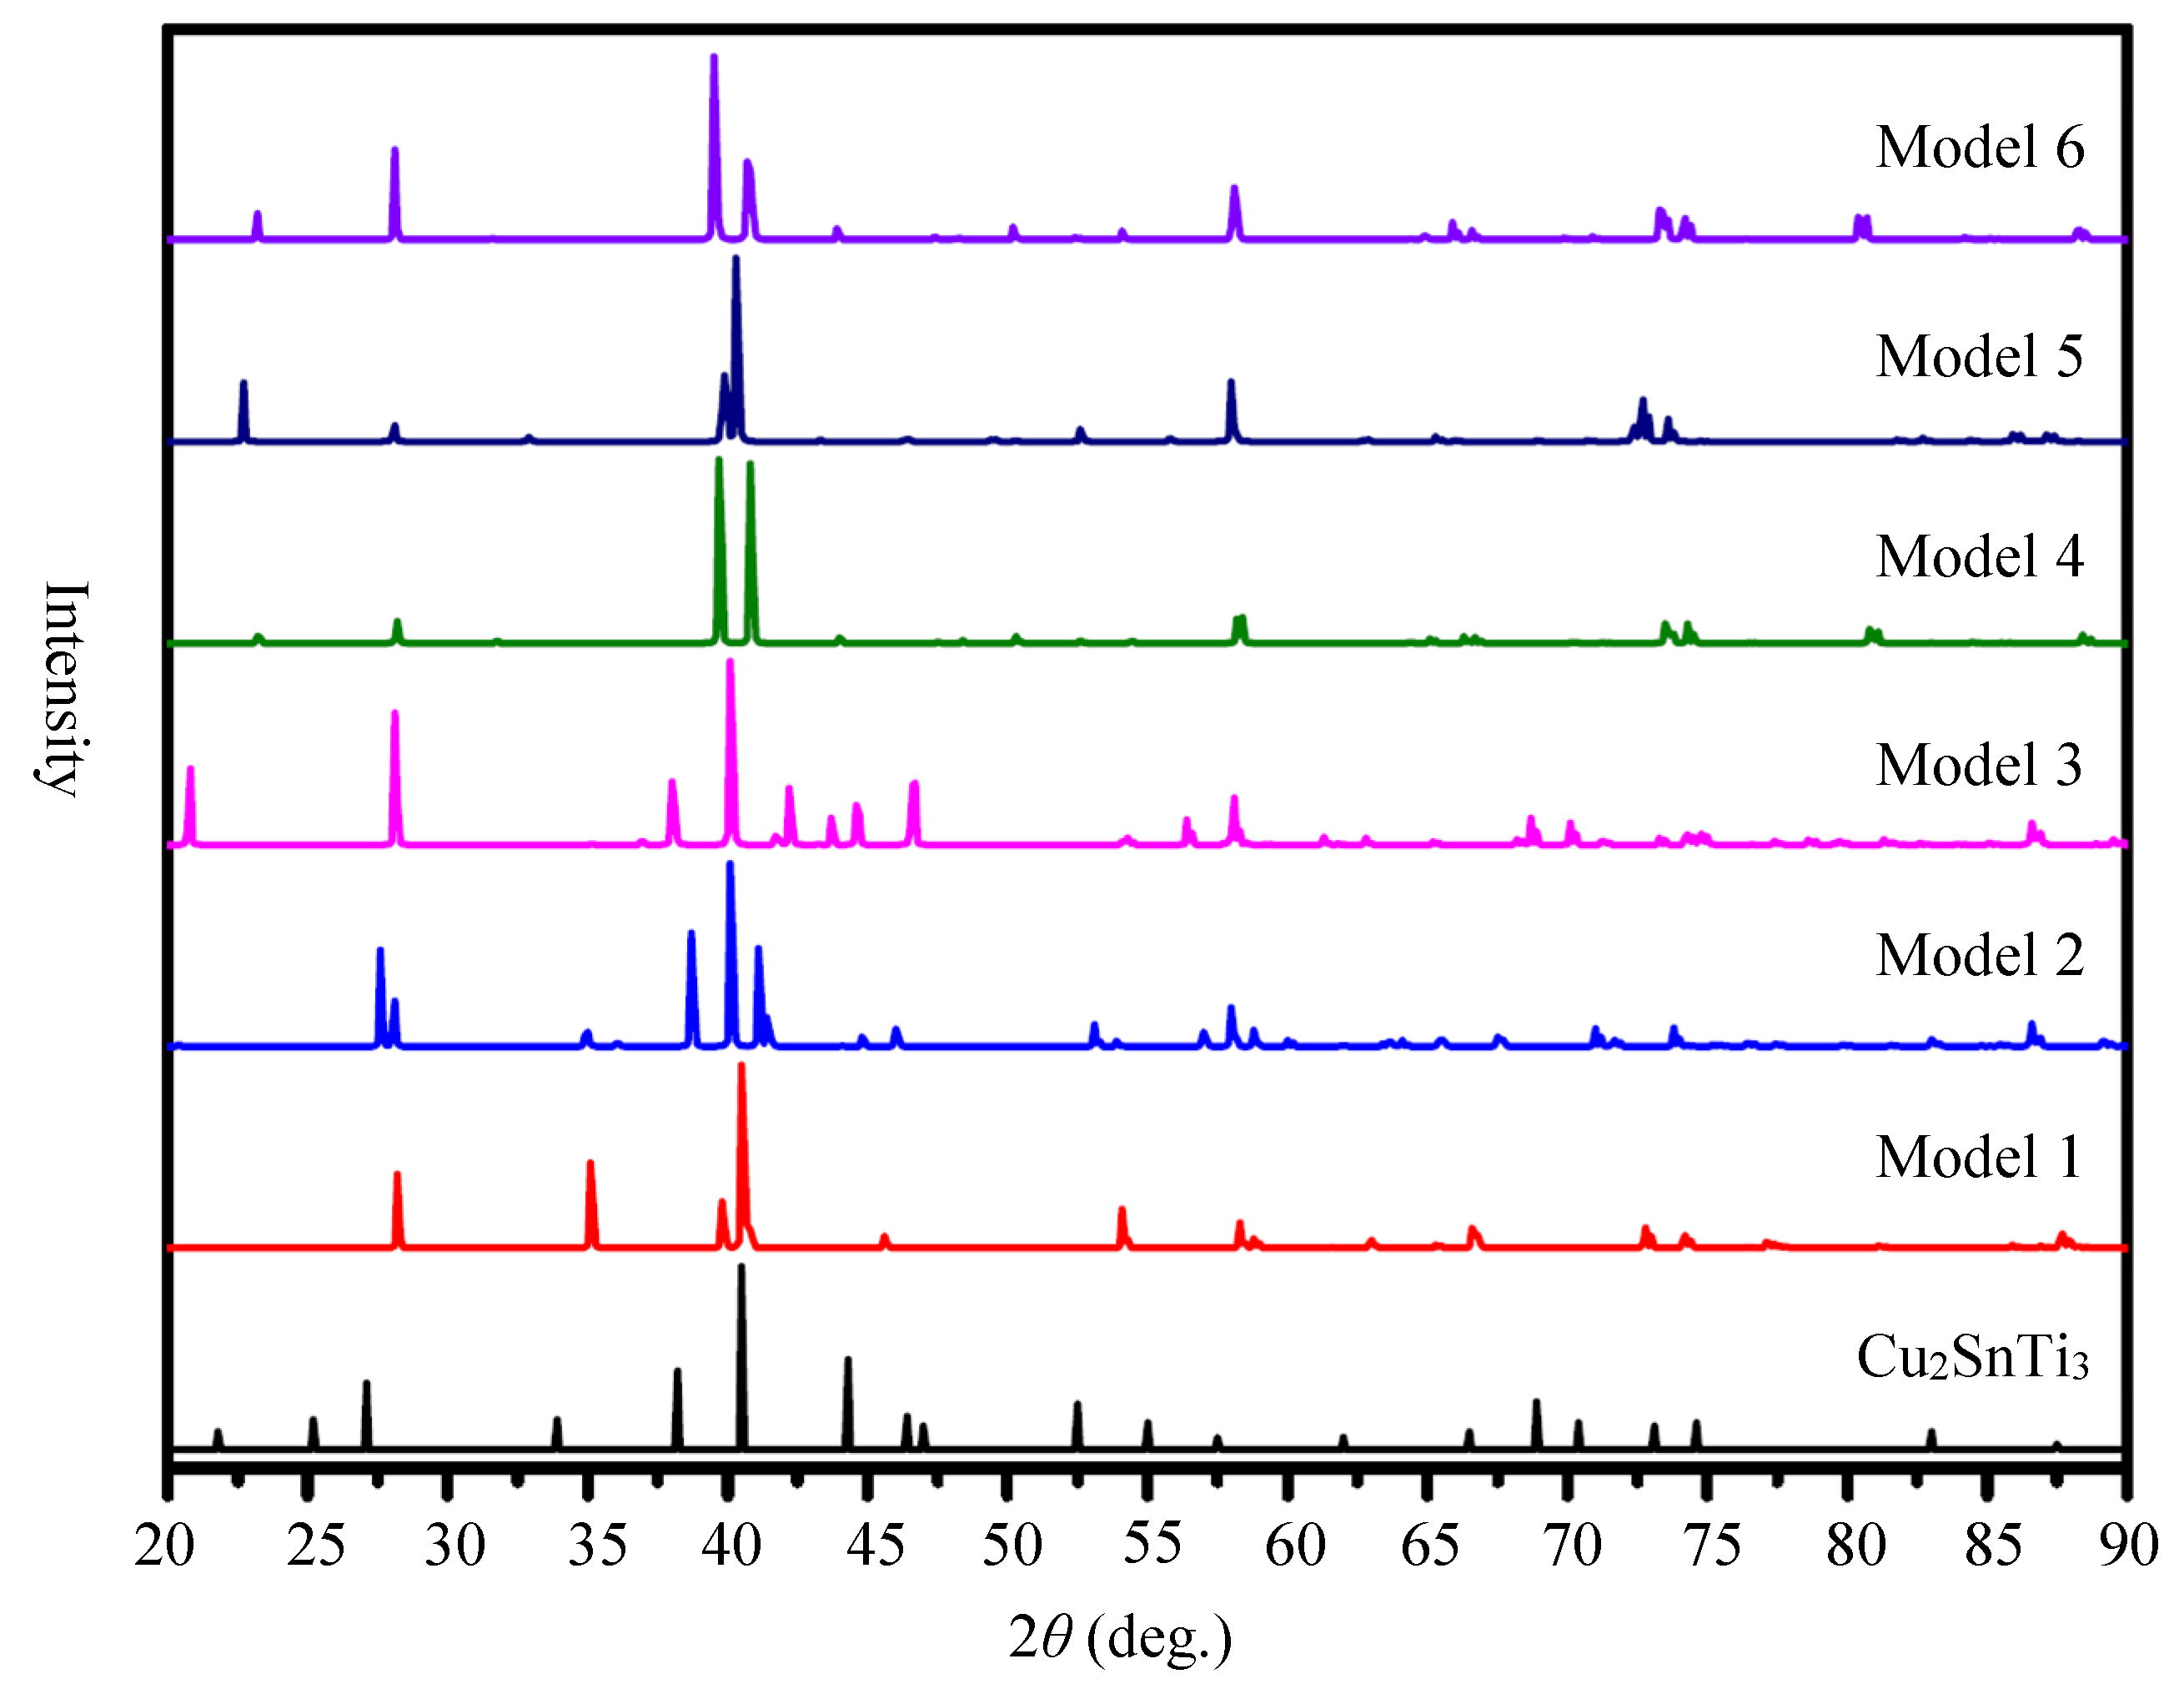
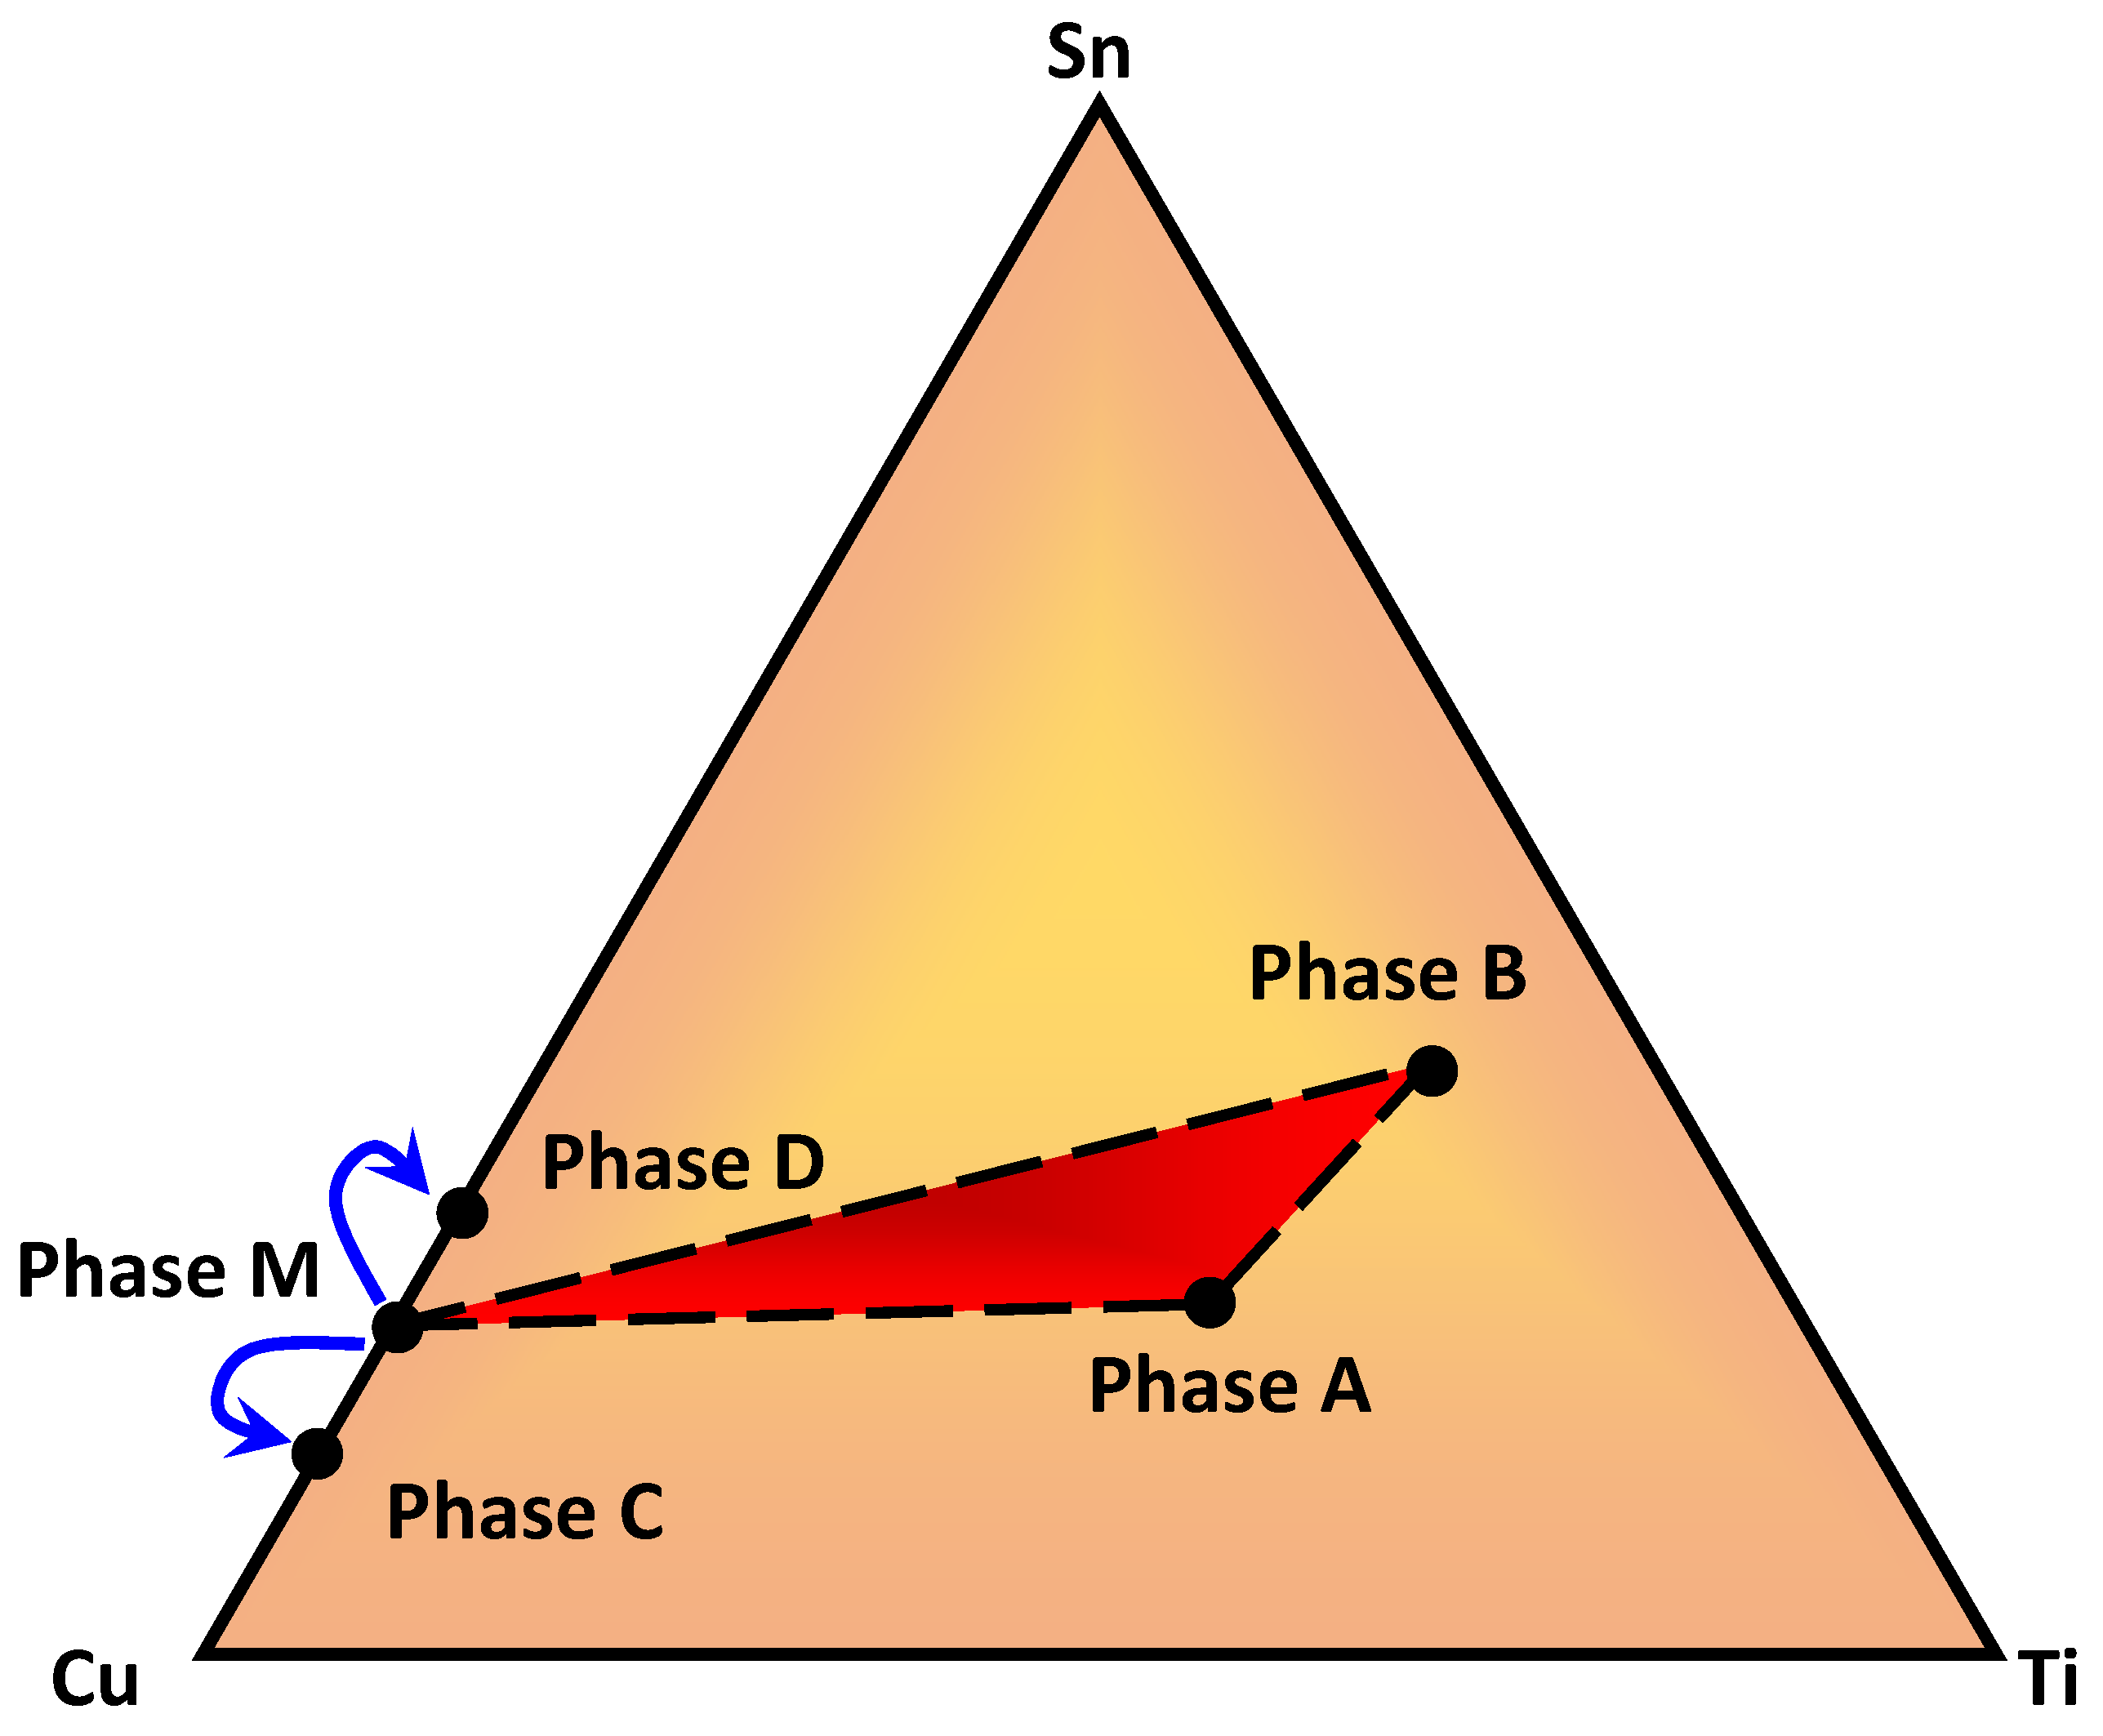
3. Results and Discussion

Figure 1a shows the backscattered electron imaging (BEI) of the furnace-cooled Cu–23Ti–17Sn specimens, which include Cu2SnTi3 (Phase A), Phase B, Cu-9 at. %Sn (Phase C), and Cu41Sn11 (Phase D) identified using the XRD patterns. The compositions and average atomic mass of Phases A, B, C, and D are presented in Table 1. Figure 1b shows the BEI of the water-quenched Cu–23Ti–17Sn specimens, which include Phase A, Phase B, and Cu-14 at. %Sn (Phase M) for which the composition and average atomic mass of Phase M are listed in Table 1. Our results show that when the Cu–23Ti–17Sn alloy is heated to 900 °C and the base phase of the alloy is a solid solution phase of Cu-Sn. The phase separation occurs to form two phases with different tin contents, namely the C phase and the D phase, because the solubility of tin in solid solution is temperature-dependent and the tin atoms have enough time to diffuse in the furnace-cooled Cu–23Ti–17Sn sample. In contrast, when cooling at a very fast rate (water quenching), no phase separation occurs, and only a single solid solution phase, Phase M, is formed. We noted that Cu2SnTi3, Phase A, is a new phase and has never been reported before.
To further analyze the structures of the ternary intermetallic phases, the sample was immersed in a solution of 20 vol. % sulfuric acid and connected to the positive pole of the DC power supply, resulting in the remaining Cu2SnTi3 and CuSn3Ti5. The XRD plot contains two sets of peaks corresponding to Cu2SnTi3 and CuSn3Ti5. The crystal structure of CuSn3Ti5 has been identified and found in JCPDS [10,16], while Cu2SnTi3 has not been reported yet. We use the regression to estimate the unknown Cu2SnTi3, showing that Cu2SnTi3 could be a hexagonal structure with a = 4.708 Å and c = 6.756 Å, which in turn determines the diffraction angle of hexagonal Cu2SnTi3 and matches bulklike CaCu5 structure (space group: 191 P6/mmm) [12]. Table 2 compares the measured and regression diffraction angles of Cu2SnTi3, and the relative intensity of each individual peak in the measured XRD pattern. The measured and regressed diffraction angles of the crystal plane of (002) are 27.08° and 26.36°, respectively, showing the largest uncertainty.
Figure 2 shows a TEM bright image of Cu2SnTi3 and its corresponding SAD patterns. The composition analysis based on EDS in TEM shows that this domain is composed of Cu of 32.1~34.7 at. %, Sn of 15.2~17.1 at. %, and Ti of 49.3~52.6 at. %, which the stoichiometry of the domain is approximately Cu2SnTi3, in agreement with results of the EPMA measurement in SEM. To expand our insight into the new ternary compounds Cu2SnTi3 for determining the crystalline structure, we carried out a brief comparative study of the structural, electronic, and energetic properties in the CaCu5-like and InNi2-like Cu2SnTi3. Six Cu2SnTi3 models denoted by model number m (wherem = 1–6) with specific Wyckoff positions of the Cu, Sn, and Ti. Models 1, 2, and 3 are close to CaCu5-like Cu2SnTi3. In Model 1, Cu, Sn, and Ti were assigned to the atomic positions of 2c (x = 1/3, y = 2/3, z = 0), 1a (x = 0, y = 0, z = 0), and 3g (x = 1/2, y = 0, z = 1/2), respectively. In Model 2, two Cu, one Sn, and three Ti were assigned to the atomic positions of (x = 1/2, y = 1/2, z = 1/2), (x = 1/2, y = 0, z = 1/2), 1a (x = 0, y = 0, z = 0), (x = 1/3, y = 2/3, z = 0), (x = 2/3, y = 1/3, z = 0), and (x = 0, y = 1/2, z = 1/2), respectively. In Model 3, two Cu, one Sn, and three Ti were assigned to the atomic positions of (x = 1/2, y = 0, z = 1/2), (x = 0, y = 1/2, z = 1/2), (x = 1/2, y = 1/2, z = 1/2), (x = 1/3, y = 2/3, z = 0), (x = 2/3, y = 1/3, z = 0), and (x = 0, y = 0, z = 0), respectively. Models 4, 5, and 6 are similar to InNi2-like Cu2SnTi3. In Model 4, two Cu, one Sn, and three Ti were assigned to the atomic positions of (x = 1/3, y = 2/3, z = 3/4), (x = 2/3, y = 1/3, z = 1/4), 1a (x = 0, y = 0, z = 0), (x = 0, y = 0, z = 1/2), (x = 2/3, y = 1/3, z = 3/4), and (x = 1/3, y = 2/3, z = 1/4), respectively. In Model 5, two Cu, one Sn, and three Ti were assigned to the atomic positions of (x = 0, y = 0, z = 1/2), (x = 2/3, y = 1/3, z = 3/4), 1a (x = 0, y = 0, z = 0), (x = 2/3, y = 1/3, z = 1/4), (x = 1/3, y = 2/3, z = 1/4), and (x = 1/3, y = 2/3, z = 3/4), respectively. In Model 6, two Cu, one Sn, and three Ti were assigned to the atomic positions of (x = 2/3, y = 1/3, z = 1/4), (x = 1/3, y = 2/3, z = 3/4), (x = 0, y = 0, z = 1/2), (x = 0, y = 0, z = 0), (x = 2/3, y = 1/3, z = 3/4), and (x = 1/3, y = 2/3, z = 1/4), respectively. We conduct first-principles density functional theory (DFT) calculations based on the generalized gradient approximation (GGA) using the Vienna Ab Initio Simulation Package (VASP) [17,18,19]. A plane wave cutoff of 355 eV (350 eV) was used in conjunction with a 7 × 7 × 7(7 × 7 × 8) Gamma centered grid to achieve a force accuracy of 0.01 eV/Å for CaCu5-like (InNi2-like) Cu2SnTi3. Under these conditions, the atomic coordinates were completely relaxed to their zero-force positions, resulting in the optimized six structures shown in Figure 3.
Table 3 shows the space groups, lattice constants, and total energies of Models 1–6. Model 6 has the lowest total energy of −35.239 eV for InNi2-like Cu2SnTi3 and Model 2 has the lowest total energy of −33.926 eV for CaCu5-like Cu2SnTi3. Model 1 follows closely the model proposed by the literature [12] and has the highest total energy of −33.094 eV. We have plotted the three plausible models describing the transformation path for ternary intermetallic phases of Cu2SnTi3 shown in Figure 4. It can be clearly seen that the hexagonal Cu2SnTi3 (space group: 191 P6/mmm) is metastable phase. The hexagonal Cu2SnTi3 tends to a more stable phase or transition phase of the orthorhombic structure.
Cu2SnTi3 (space group: 65 Cmmm) with an energy gain of 0.832 eV from a metastable state. The transition phase of the orthorhombic Cu2SnTi3 finally becomes the most stable phase of the trigonal structure Cu2SnTi3 (space group: 164 P-3m1), and the energy gain obtained from the transition state is 1.313 eV. Note that the energy barrier of the Cu2SnTi3 phase transition is ignored and only a schematic diagram is drawn.
A simulated SAD of Cu2SnTi3 along the [001], [−101], and [221] in Figure 5 using the optimized parameters and atomic structures of Models 1, 2, and 6 (see Figure 3) shows that the simulated SAD pattern along the [221] zone axes is very similar to the experimental SAD pattern (see Figure 2b), which represents orthorhombic Cu2SnTi3. This finding is remarkably similar to that predicted by our detailed simulations as shown in the energy diagram in Figure 4.
In order to understand the XRD analysis of the CaCu5-like (InNi2-like) Cu2SnTi3 models, we simulate XRD curves of Models 1–6 to compare the experimental one as shown in Figure 6. The main diffraction peaks at 40.10 (40.70) degrees 2θ of Model 2 (Model 6) and 40.52 degrees 2θ of experimental XRD have only a slight error of 1.03% (0.44%). To compare the experimental XRD depicted in Figure 6, the diffraction peaks at 34.90 (58.10) degrees 2θ of Model 2 (Model 6) has a maximum error of 3.0% (2.0%), and the other characteristic peak errors are less than 1.5%. In view of the fact that hexagonal, orthorhombic, and trigonal structure Cu2SnTi3 all have a relatively small difference in XRD, it is perhaps not surprising that all three phases exist. Figure 7 shows the ternary Cu–Sn–Ti phase diagram, including Phases A, B, C, D, and M. Three phases of Cu–23Ti–17Sn, Phases A, B, and M, exist in equilibrium with each other at the temperature of 900 °C. Phase M decomposes into Phases C and D under slow cooling conditions. The composition triangle becomes a quadrangle under the furnace cooling conditions, i.e., Phases A, B, C, and D.

4. Conclusions

We have described crystal structures of the new ternary compound of Cu2SnTi3. Our results indicate that three possible crystal structures are hexagonal (space group: 191 P6/mmm), orthorhombic (space group: 65 Cmmm), or trigonal (space group: 164 P-3m1) structure of Cu2SnTi3. Our calculations show that trigonal Cu2SnTi3 is more favorable than hexagonal and orthorhombic ones. From a synthetic perspective, these approaches based on identifying Cu2SnTi3 compounds are very promising for exploring the brazing characteristics of Cu2SnTi3.

Author Contributions

Conceptualization, S.-F.H. and P.-L.L.; methodology, S.-F.H. and Y.-C.C.; validation, S.-F.H. and Y.-C.C.; formal analysis, S.-F.H., Y.-C.C., and P.-L.L.; investigation, S.-F.H. and Y.-C.C.; writing—original draft preparation, S.-F.H. and P.-L.L.; writing—review and editing, S.-F.H. and P.-L.L.; supervision, P.-L.L. All authors have read and agreed to the published version of the manuscript.

Funding

This research was funded by Ministry of Science and Technology (MOST), Taiwan, grant numbers 109-2221-E-005-042- and 108-2221-E-005-001-.

Acknowledgments

Computational studies were performed using the resources of the National Center for High Performance Computing, Taiwan. This manuscript was edited by Wallace Academic Editing.

Conflicts of Interest

The authors declare no conflict of interest.

References

  1. Standing, R.; Nicholas, M. The wetting of alumina and vitreous carbon by copper-tin-titanium alloys. J. Mater. Sci. 1978, 13, 1509. [Google Scholar] [CrossRef]
  2. Hsieh, Y.Z.; Chen, J.F.; Lin, S.T. Pressureless sintering of metal-bonded diamond particle composite blocks. J. Mater. Sci. 2000, 35, 5383. [Google Scholar] [CrossRef]
  3. Dezellus, O.; Hoda, F.J.; Andreas, M.; Nicolas, E. Diffusion-limited reactive wetting: Spreading of Cu-Sn-Ti alloys on vitreous carbon. Scr. Mater. 2001, 44, 2543. [Google Scholar] [CrossRef] [Green Version]
  4. Li, W.C.; Lin, S.T.; Liang, C. Interfacial segregation of Ti in the brazing of diamond grits onto a steel substrate using a Cu-Sn-Ti brazing alloy. Metall. Mater. Trans. A 2002, 33, 2163. [Google Scholar] [CrossRef]
  5. Li, W.C.; Liang, C.; Lin, S.T. Epitaxial interface of nanocrystalline TiC formed between Cu-10Sn-15Ti alloy and diamond. Diam. Relat. Mater. 2002, 11, 1336. [Google Scholar] [CrossRef]
  6. Gummeson, D.A.; Gustafson, P.U. Modern Developments in Powder Metallurgy; Metal Powder Industries Federation Press: Princeton, NJ, USA, 1988; Volume 3, p. 443. [Google Scholar]
  7. Villars, P.; Prince, A.; Okamoto, H. Handbook of Ternary Alloy Phase Diagrams; ASM International, Metals Park Press: Novelty, OH, USA, 1995; Volume 8, p. 10083. [Google Scholar]
  8. Weitzer, F.; Perring, L.; Shibayanagi, T.; Naka, M.; Schuster, J.C. Determination of the crystal structure of CuSnTi by full profile Rietveld analysis. Powder Diffr. 2000, 15, 91–93. [Google Scholar] [CrossRef]
  9. Hamar-Thibault, S.; Allibert, C.H. New phases in the ternary Cu–Ti–Sn system. J. Alloy. Compd. 2001, 363, 317. [Google Scholar] [CrossRef]
  10. Schuster, J.C.; Naka, M.; Shibayanagi, T. Crystal structure of CuSn3Ti5 and related phases. J. Alloy. Compd. 2000, 305, L1. [Google Scholar] [CrossRef]
  11. Naka, M.; Schuster, J.C.; Nakade, I.; Urai, S. Determination of the Liquidus of the Ternary System Cu-Sn-Ti. J. Phase Equilibria 2001, 22, 352–356. [Google Scholar] [CrossRef]
  12. Huang, S.F.; Tsai, H.L.; Lin, S.T. Crystal structure and X-ray diffraction pattern of CuSnTi3 intermetallic phase. Intermetallic 2005, 13, 87–92. [Google Scholar] [CrossRef]
  13. Zhou, G.-J.; Zhou, Y.; Luo, Y. Phase equilibria of the Cu-Sn-Ti ternary system at 823K. AIP Adv. 2017, 7, 025118. [Google Scholar] [CrossRef]
  14. Sdobnyakov, N.; Khort, A.; Myasnichenko, V.; Podbolotov, K.; Romanovskaia, E.; Kolosov, A.; Sokolov, D.; Romanovski, V. Solution combustion synthesis and Monte Carlo simulation of the formation of CuNi integrated nanoparticles. Comput. Mater. Sci. 2020, 184, 109936. [Google Scholar] [CrossRef]
  15. Massalski, T.B.; Okamoto, H.; Subramanian, P.R.; Kacprzak, L. Binary Alloy Phase Diagram, 2nd ed.; ASM International, Metals Park Press: Novelty, OH, USA, 1990; pp. 1482, 1495, 3406. [Google Scholar]
  16. Joint Committee on Powder Diraction Standards (JCPDS). Powder Diffraction Files V.2.3; International Centre for Diffraction Data (ICDD): Newton Square, PA, USA, 2002. [Google Scholar]
  17. Kresse, G.; Furthmuller, G. Efficient iterative schemes for ab initio total-energy calculations using a plane-wave basis set. Phys. Rev. B 1996, 54, 11169. [Google Scholar] [CrossRef] [PubMed]
  18. Kresse, G.; Furthmuller, J. Efficiency of ab-initio total energy calculations for metals and semiconductors using a plane-wave basis set. Mater. Sci. 1996, 6, 15–50. [Google Scholar] [CrossRef]
  19. Kresse, G.; Hafner, J. Norm-conserving and ultrasoft pseudopotentials for first-row and transition elements. J. Phys. Condens. Matter. 1994, 6, 8245. [Google Scholar] [CrossRef]
Figure 1. Microstructures of the Cu-23 at. %Ti–17 at. %Sn alloy under (a) furnace-cooled and (b) water-quenched.
Applsci 10 08776 g001
Figure 2. Transmission electron microscope (TEM) bright field image (a) and its corresponding selected area diffraction (SAD) pattern (b) of Phase A.
Applsci 10 08776 g002
Figure 3. Models 1–6 showing the most favorable atomic structures. Red, gray, and dark green spheres represent Cu, Ti, and Sn atoms, respectively.
Applsci 10 08776 g003
Figure 4. Energy profile of Models 1, 2, and 6. Red, gray, and dark green spheres represent the atoms Cu, Ti, and Sn, respectively.
Applsci 10 08776 g004
Figure 5. Density functional theory (DFT) simulated SAD of Models 1, 2, and 6 along the [001], [−101], and [221].
Applsci 10 08776 g005
Figure 6. Comparison of XRD of Cu2SnTi3 and DFT simulated XRD of Models 1–6.
Applsci 10 08776 g006
Figure 7. Phases A, B, C, D, and M in the ternary Cu–Sn–Ti phase diagram. The dashed triangle indicates a three-phase equilibrium of Cu–23Ti–17Sn at 900 °C. The arrows show phase separation occurs at temperatures below 900 °C.
Applsci 10 08776 g007
Table 1. The chemical formula and composition of the Phases A, B, C, D, and M in the Cu-23 at. %Ti–17 at. %Sn alloy.
PhaseChemical FormulaComposition (at. %)Average Atomic Mass
CuSnTi
ACu2SnTi332.9215.9551.1364.34
BCuSn3Ti512.1532.2555.6072.63
CCu-9 at. %Sn90.958.840.2168.39
DCu41Sn1179.6820.020.3074.54
MCu-14 at. %Sn85.3514.380.2771.10
Table 2. The X-ray diffraction (XRD) data of Cu2SnTi3 using Cu Kα radiation (λ = 0.1541 nm).
Diffraction Angles 2θ (deg.)h  k  lIntensity
I/I0 (%)
MeasuredRegressiveError (%)
21.8021.780.11  0  012
25.1825.501.21  0  116
27.0826.362.70  0  236
33.8634.451.91  0  220
38.2038.2101  1  045
40.5240.550.11  1  1100
44.3444.410.22  0  050
46.4446.500.12  0  125
47.0247.020.01  1  218
52.4452.380.12  0  227
54.9054.271.20  0  421
56.7056.510.31  1  310
59.3459.160.31  0  410
61.4861.290.32  0  313
66.1066.660.82  1  212
68.9069.060.23  0  035
70.4470.650.33  0  121
72.8072.640.22  0  417
73.1273.821.01  0  518
74.6074.560.12  1  318
75.2075.320.23  0  216
82.9682.910.13  0  313
85.2885.170.12  1  411
87.5687.750.22  2  214
Table 3. Space groups, lattice constants, and total energies of Models 1–6, showing Model 6 is preferred.
ModelSpace GroupLattice Constants (Å)Angle (˚)Total Energy
(eV)
abcαβγ
Model 1P6/mmm5.1105.1104.52390.0090.00120.05−33.094
Model 2Cmmm5.1344.9804.65090.0090.00119.01−33.926
Model 3Cmmm5.1135.1134.72890.0090.00123.22−33.909
Model 4P-3m14.4194.4195.63690.0090.00120.00−35.232
Model 5P3m14.5204.5205.44590.0090.00120.00−34.730
Model 6P-3m14.4254.4255.66590.0090.00120.00−35.239
Publisher’s Note: MDPI stays neutral with regard to jurisdictional claims in published maps and institutional affiliations.

