Numerical Analysis-Based Blast Resistance Performance Assessment of Cable-Stayed Bridge Components Subjected to Blast Loads


Abstract
1. Introduction
2. Target Structure and Numerical Modeling
2.1. Target Structure
2.2. Finite Element Model Development
2.3. Material Model
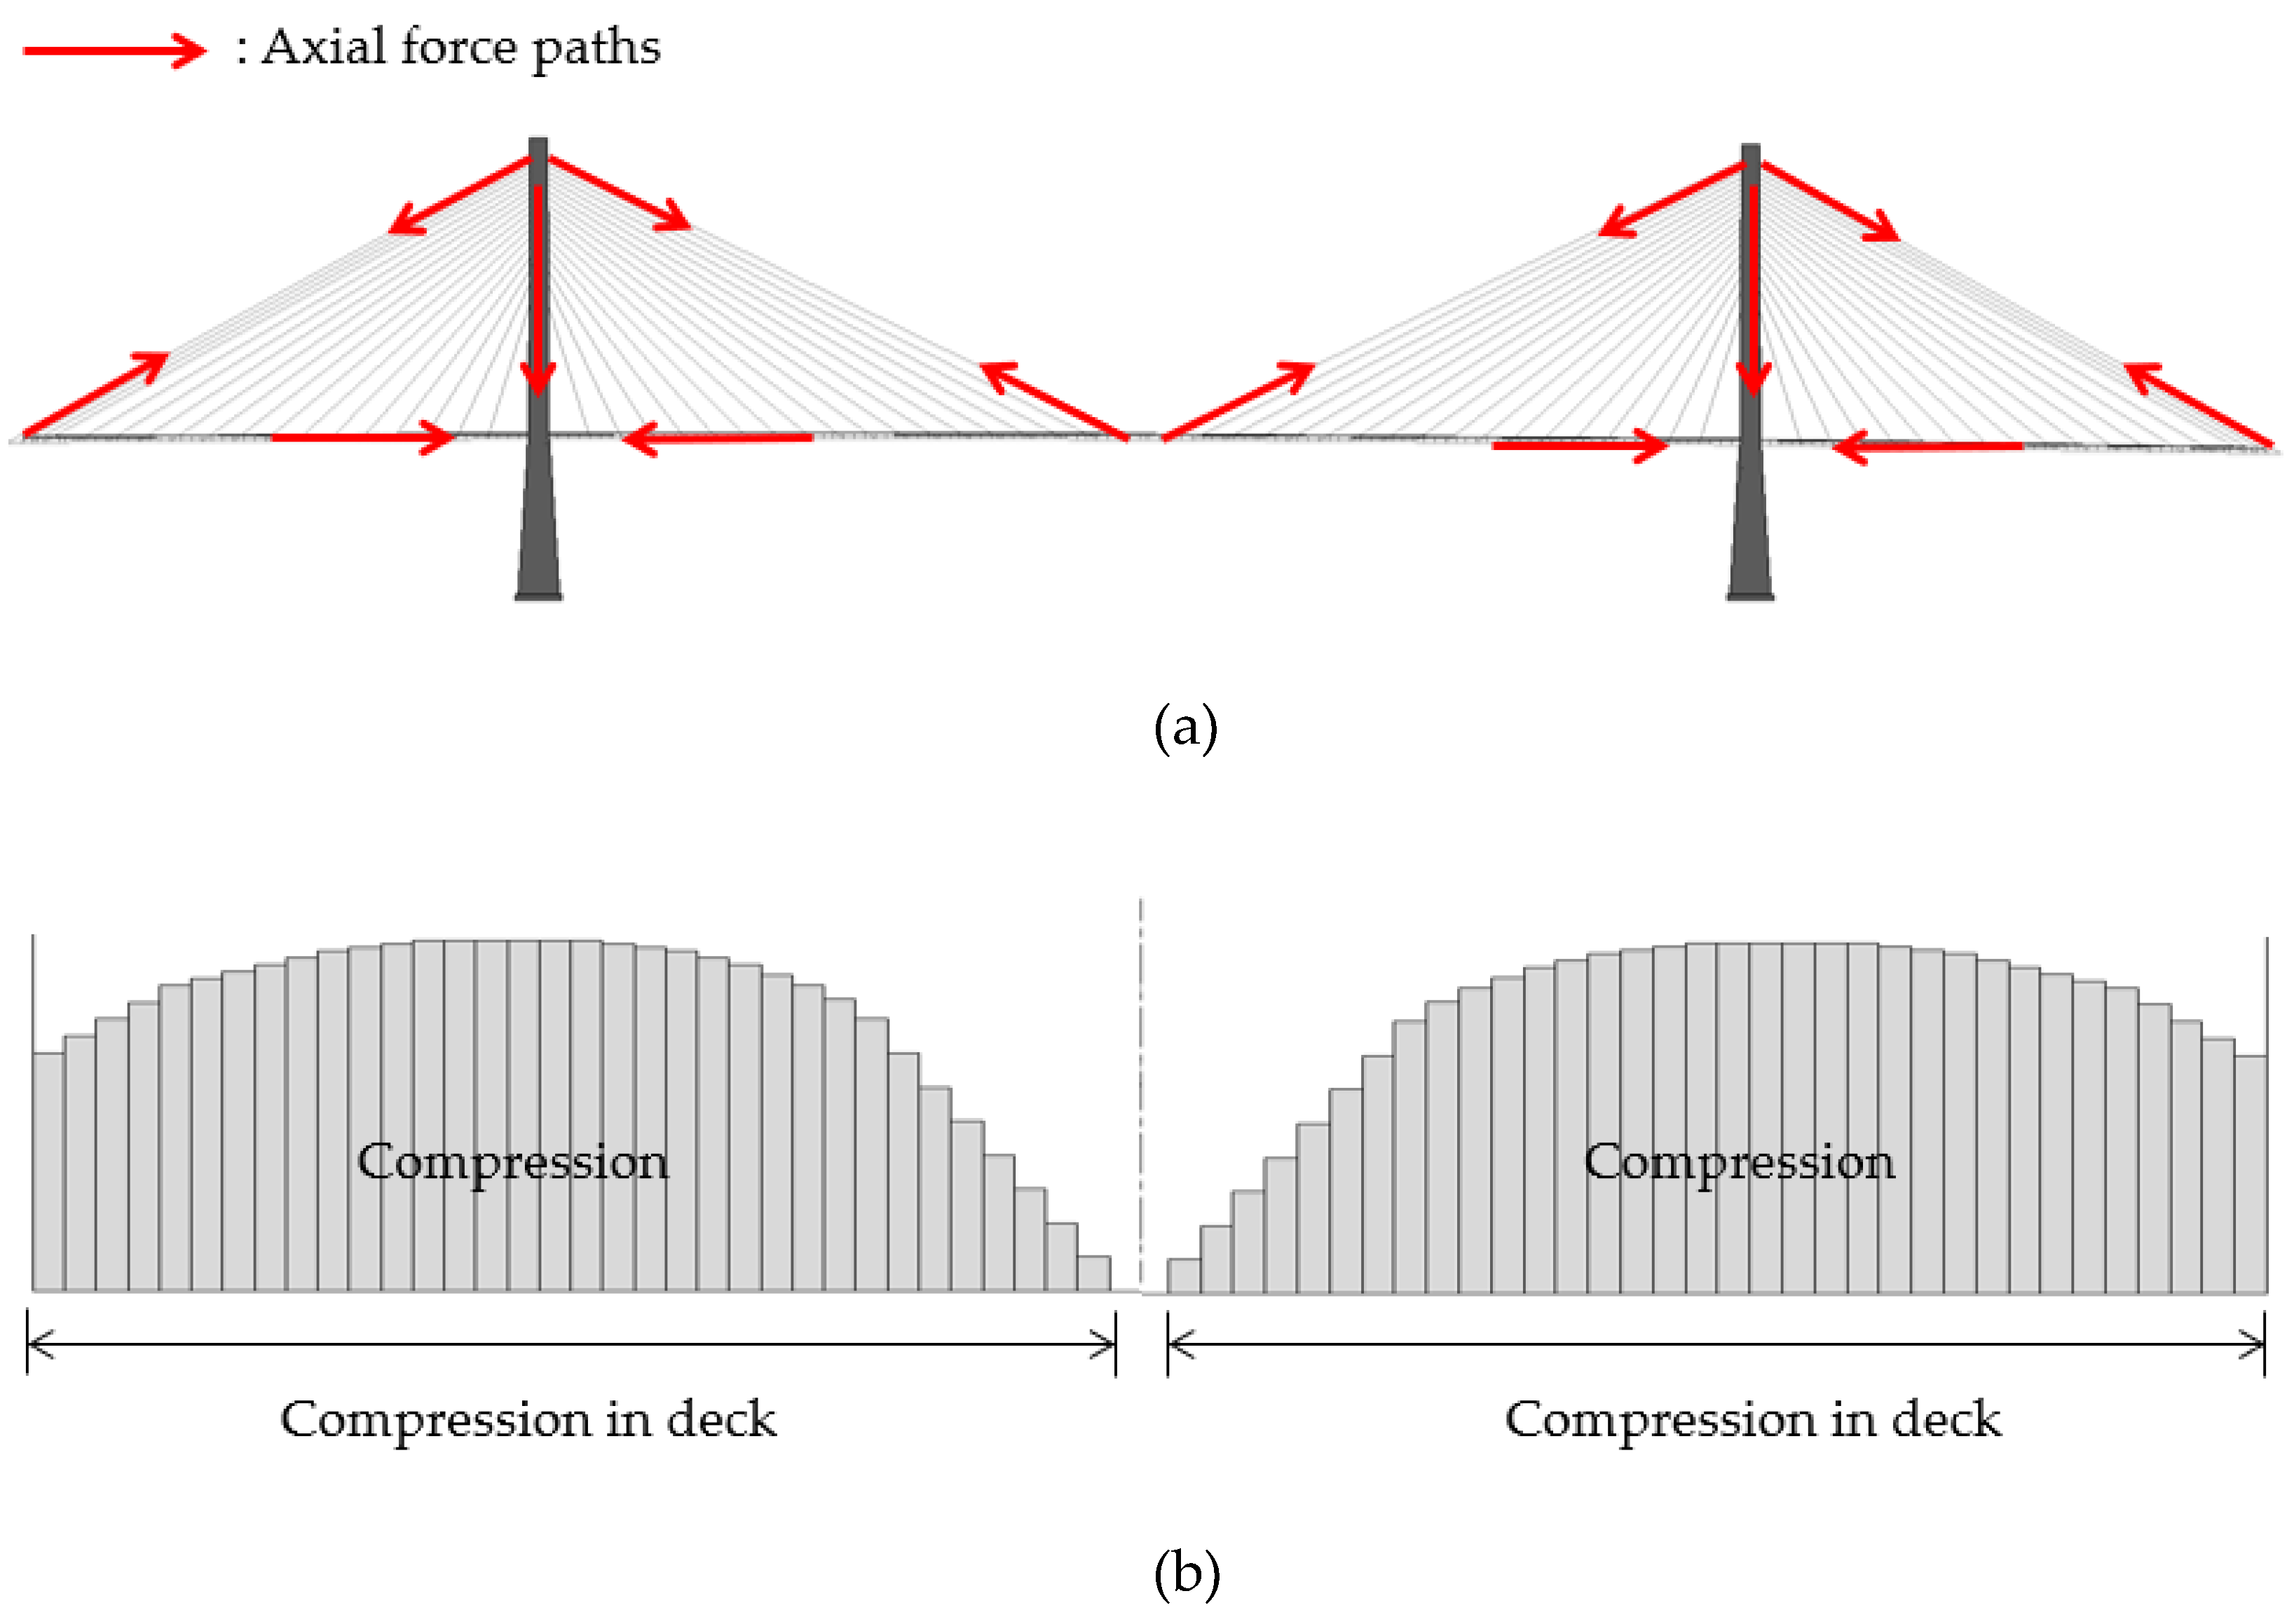
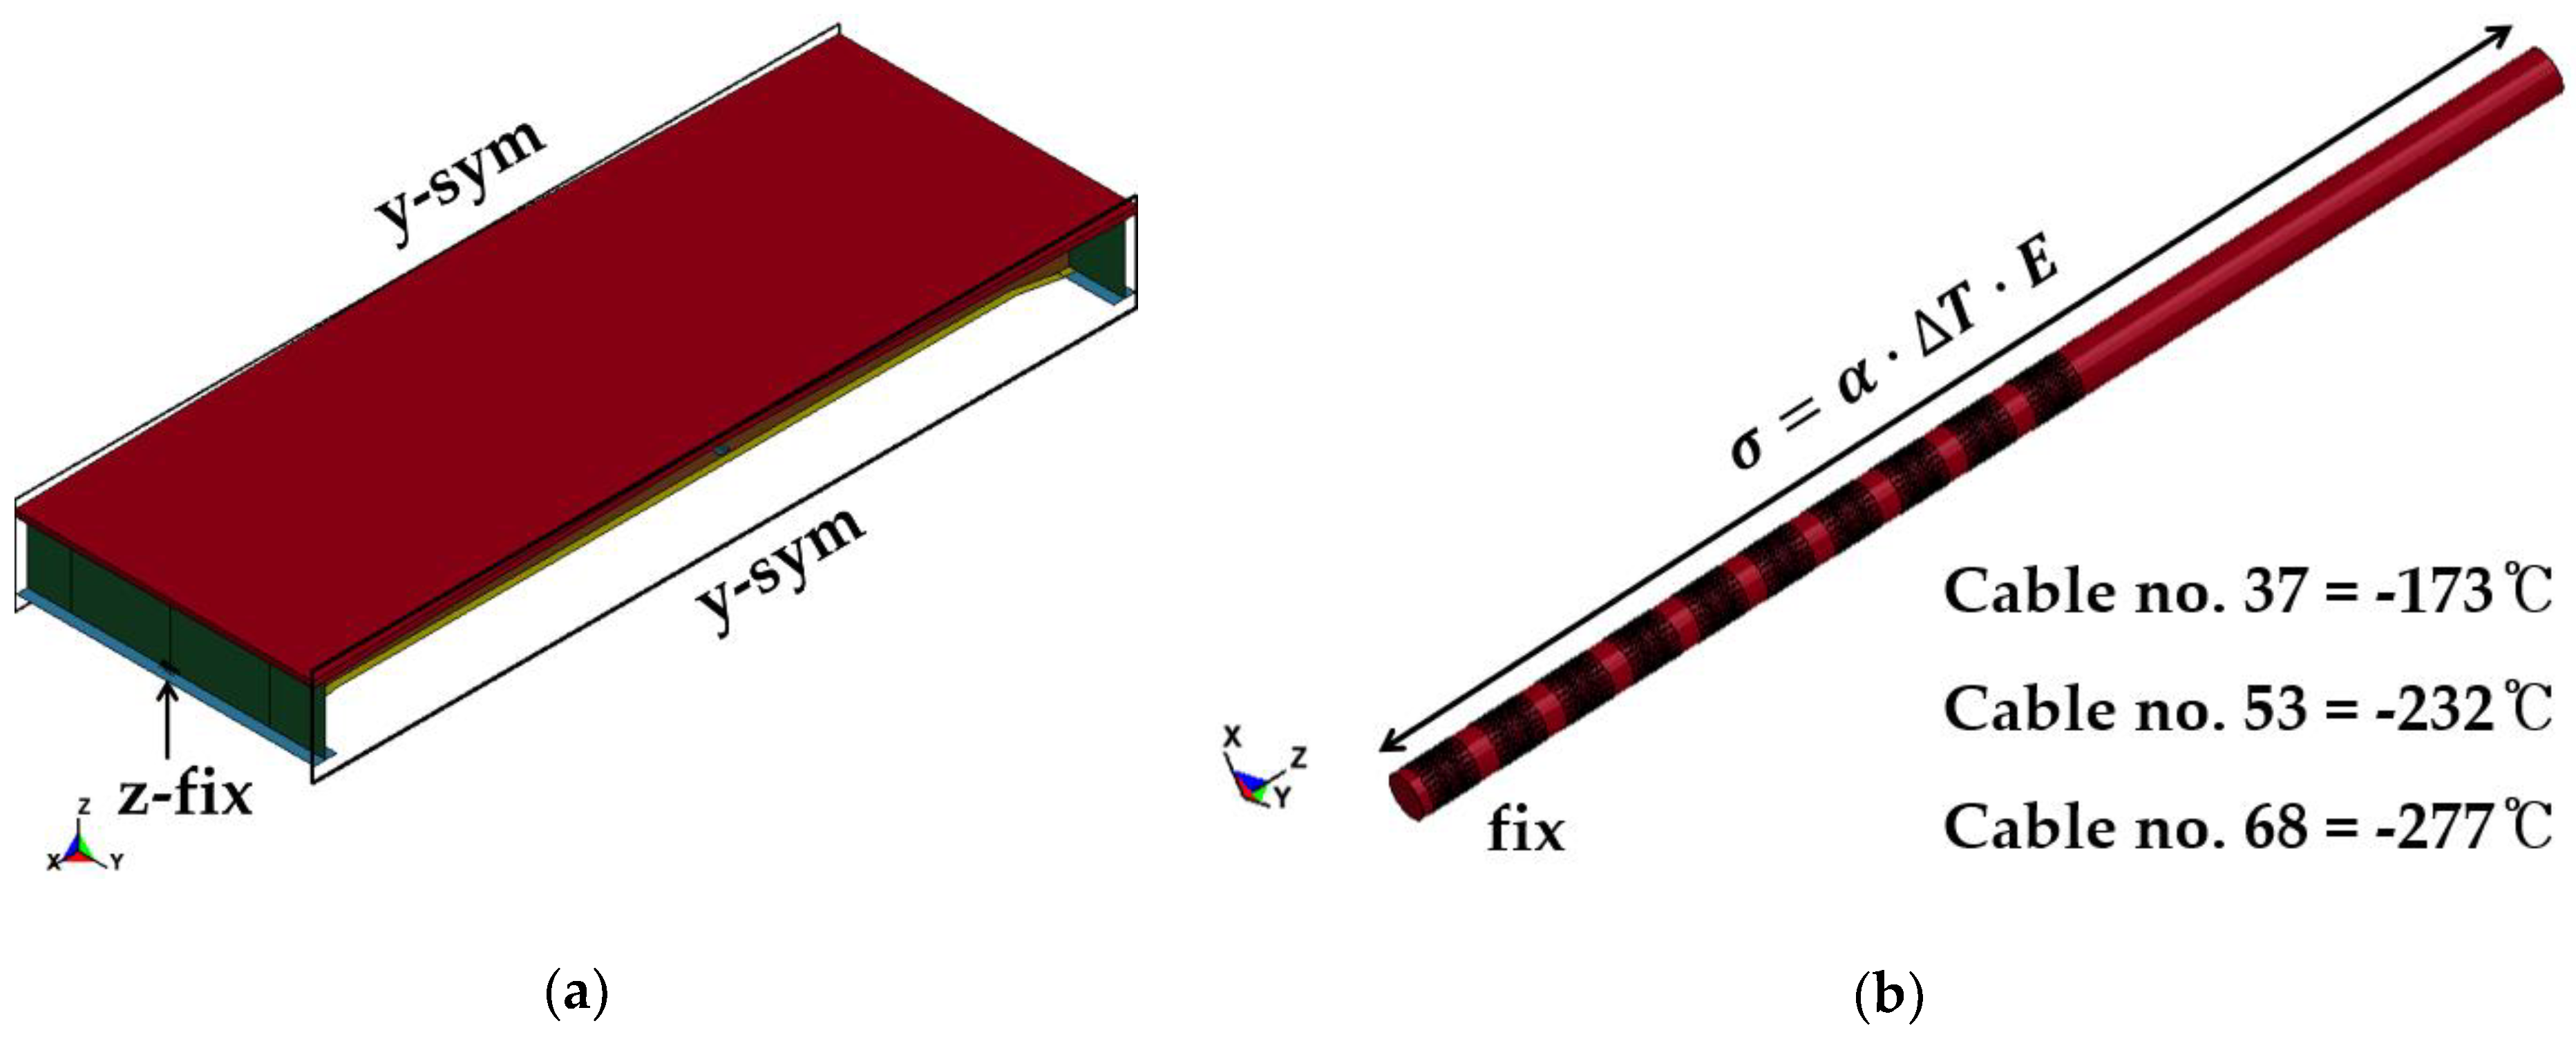
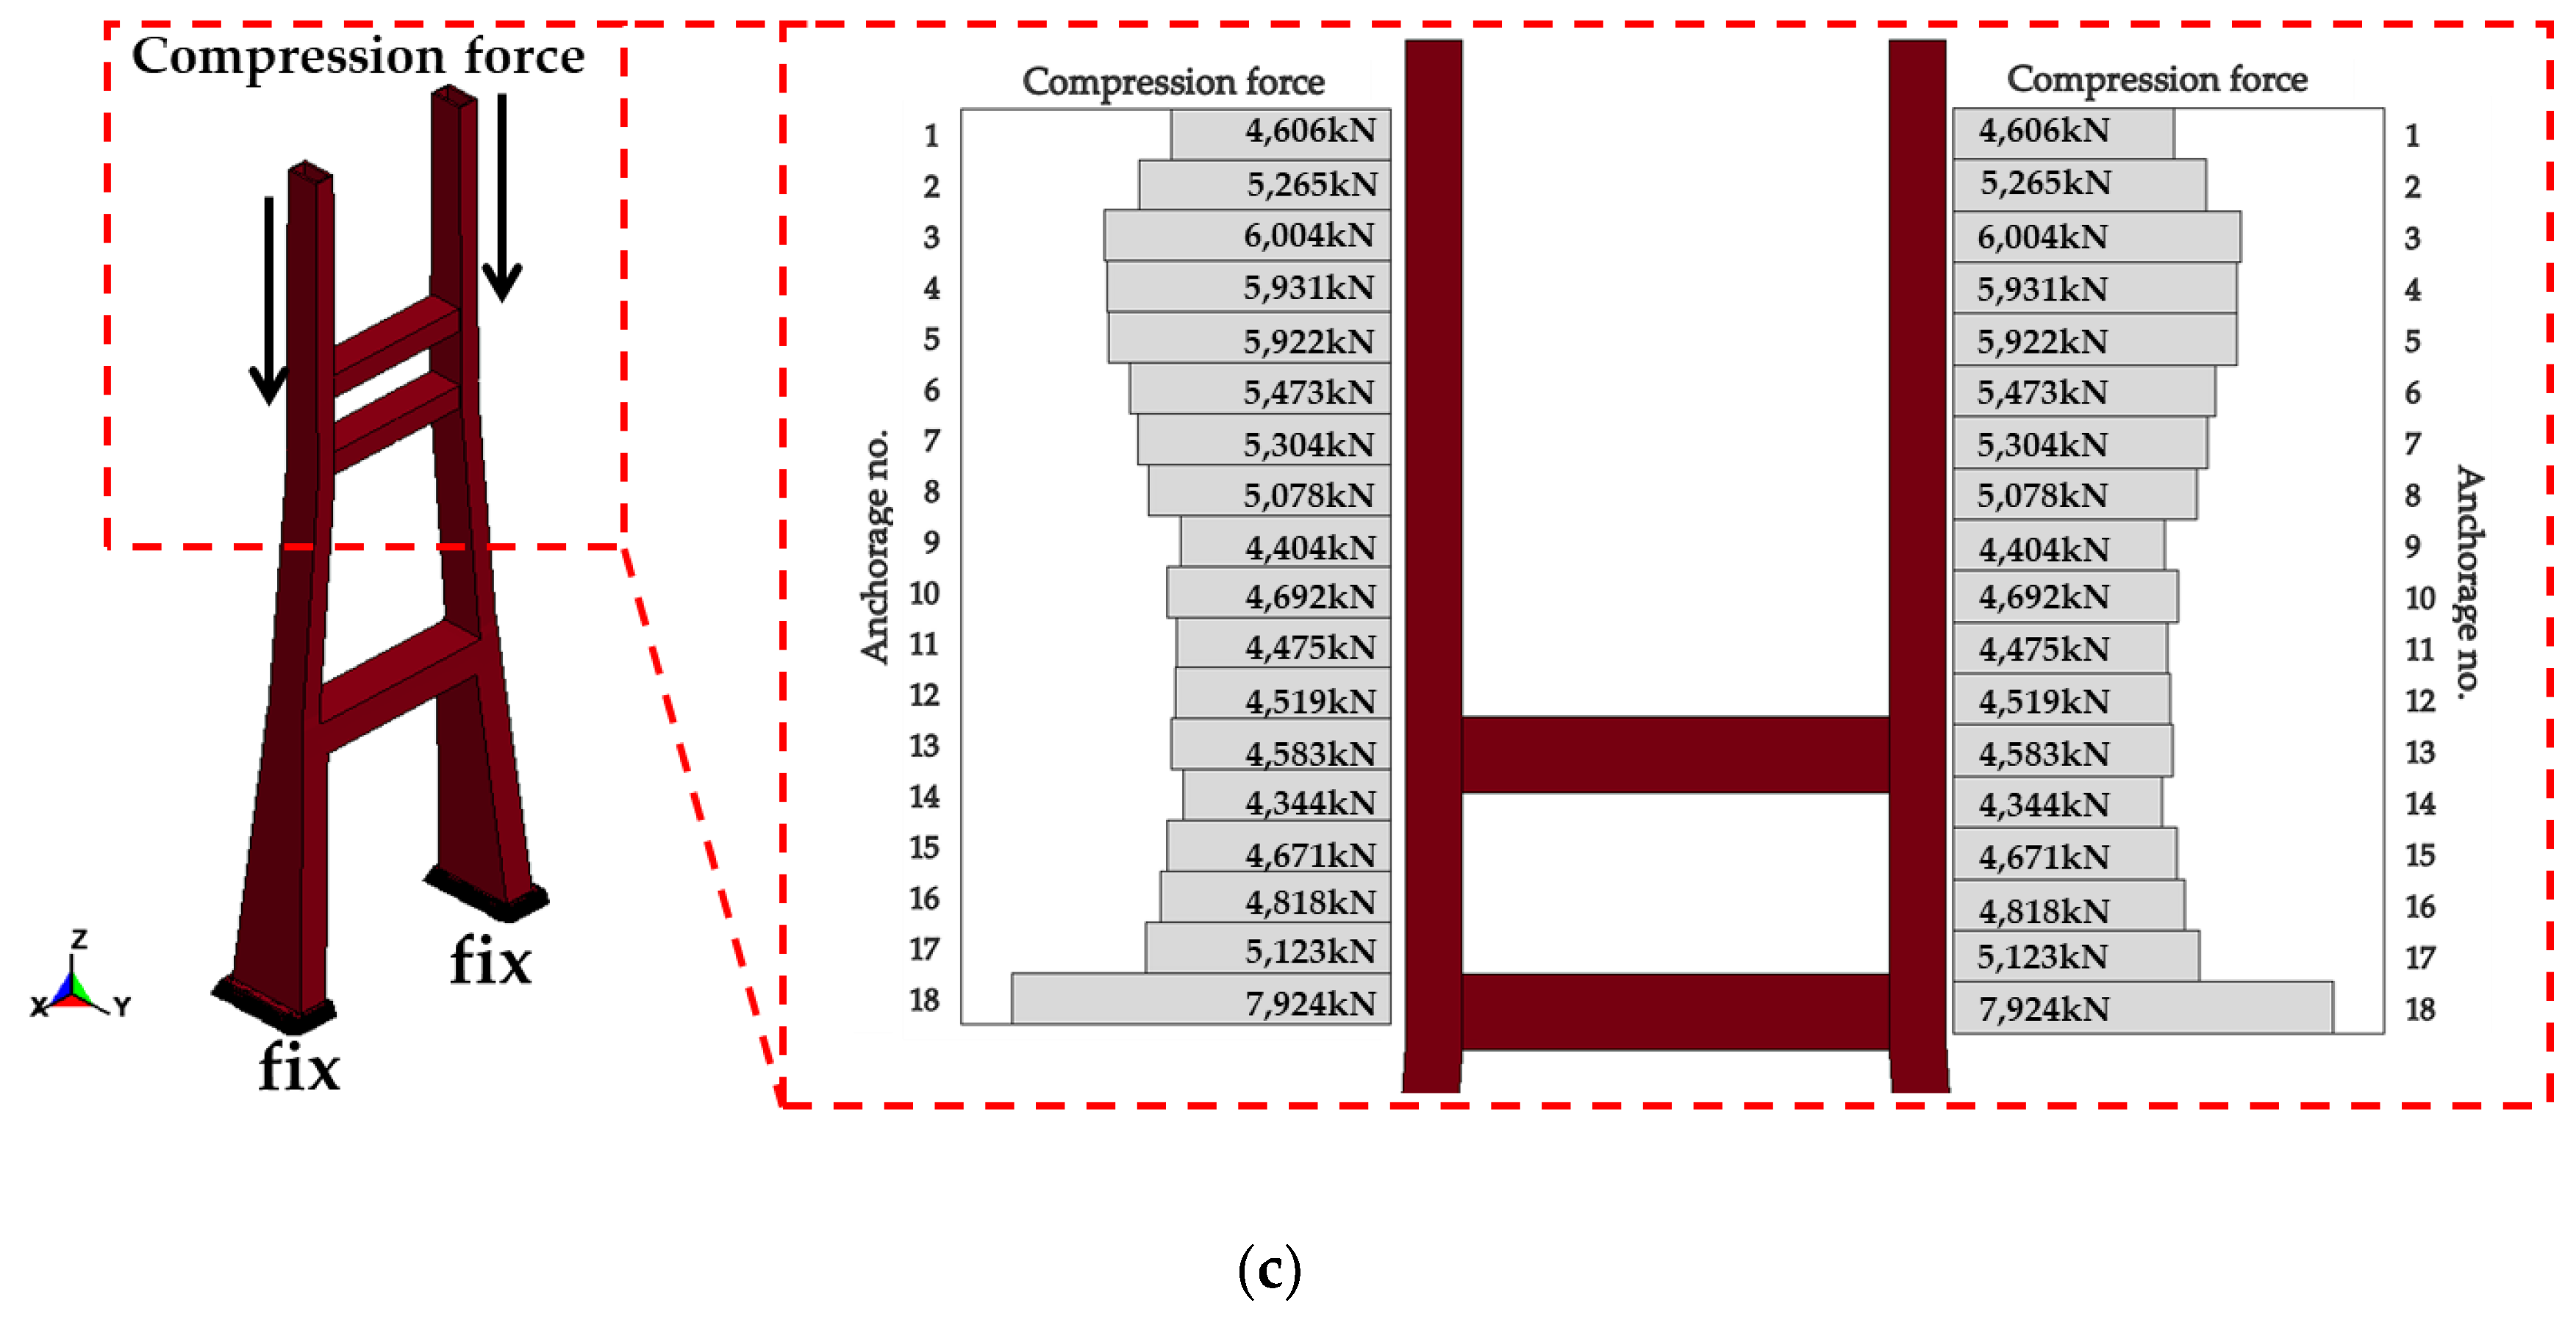
2.4. Initial Load and Boundary Conditions
3. Blast Scenario and Load Cases
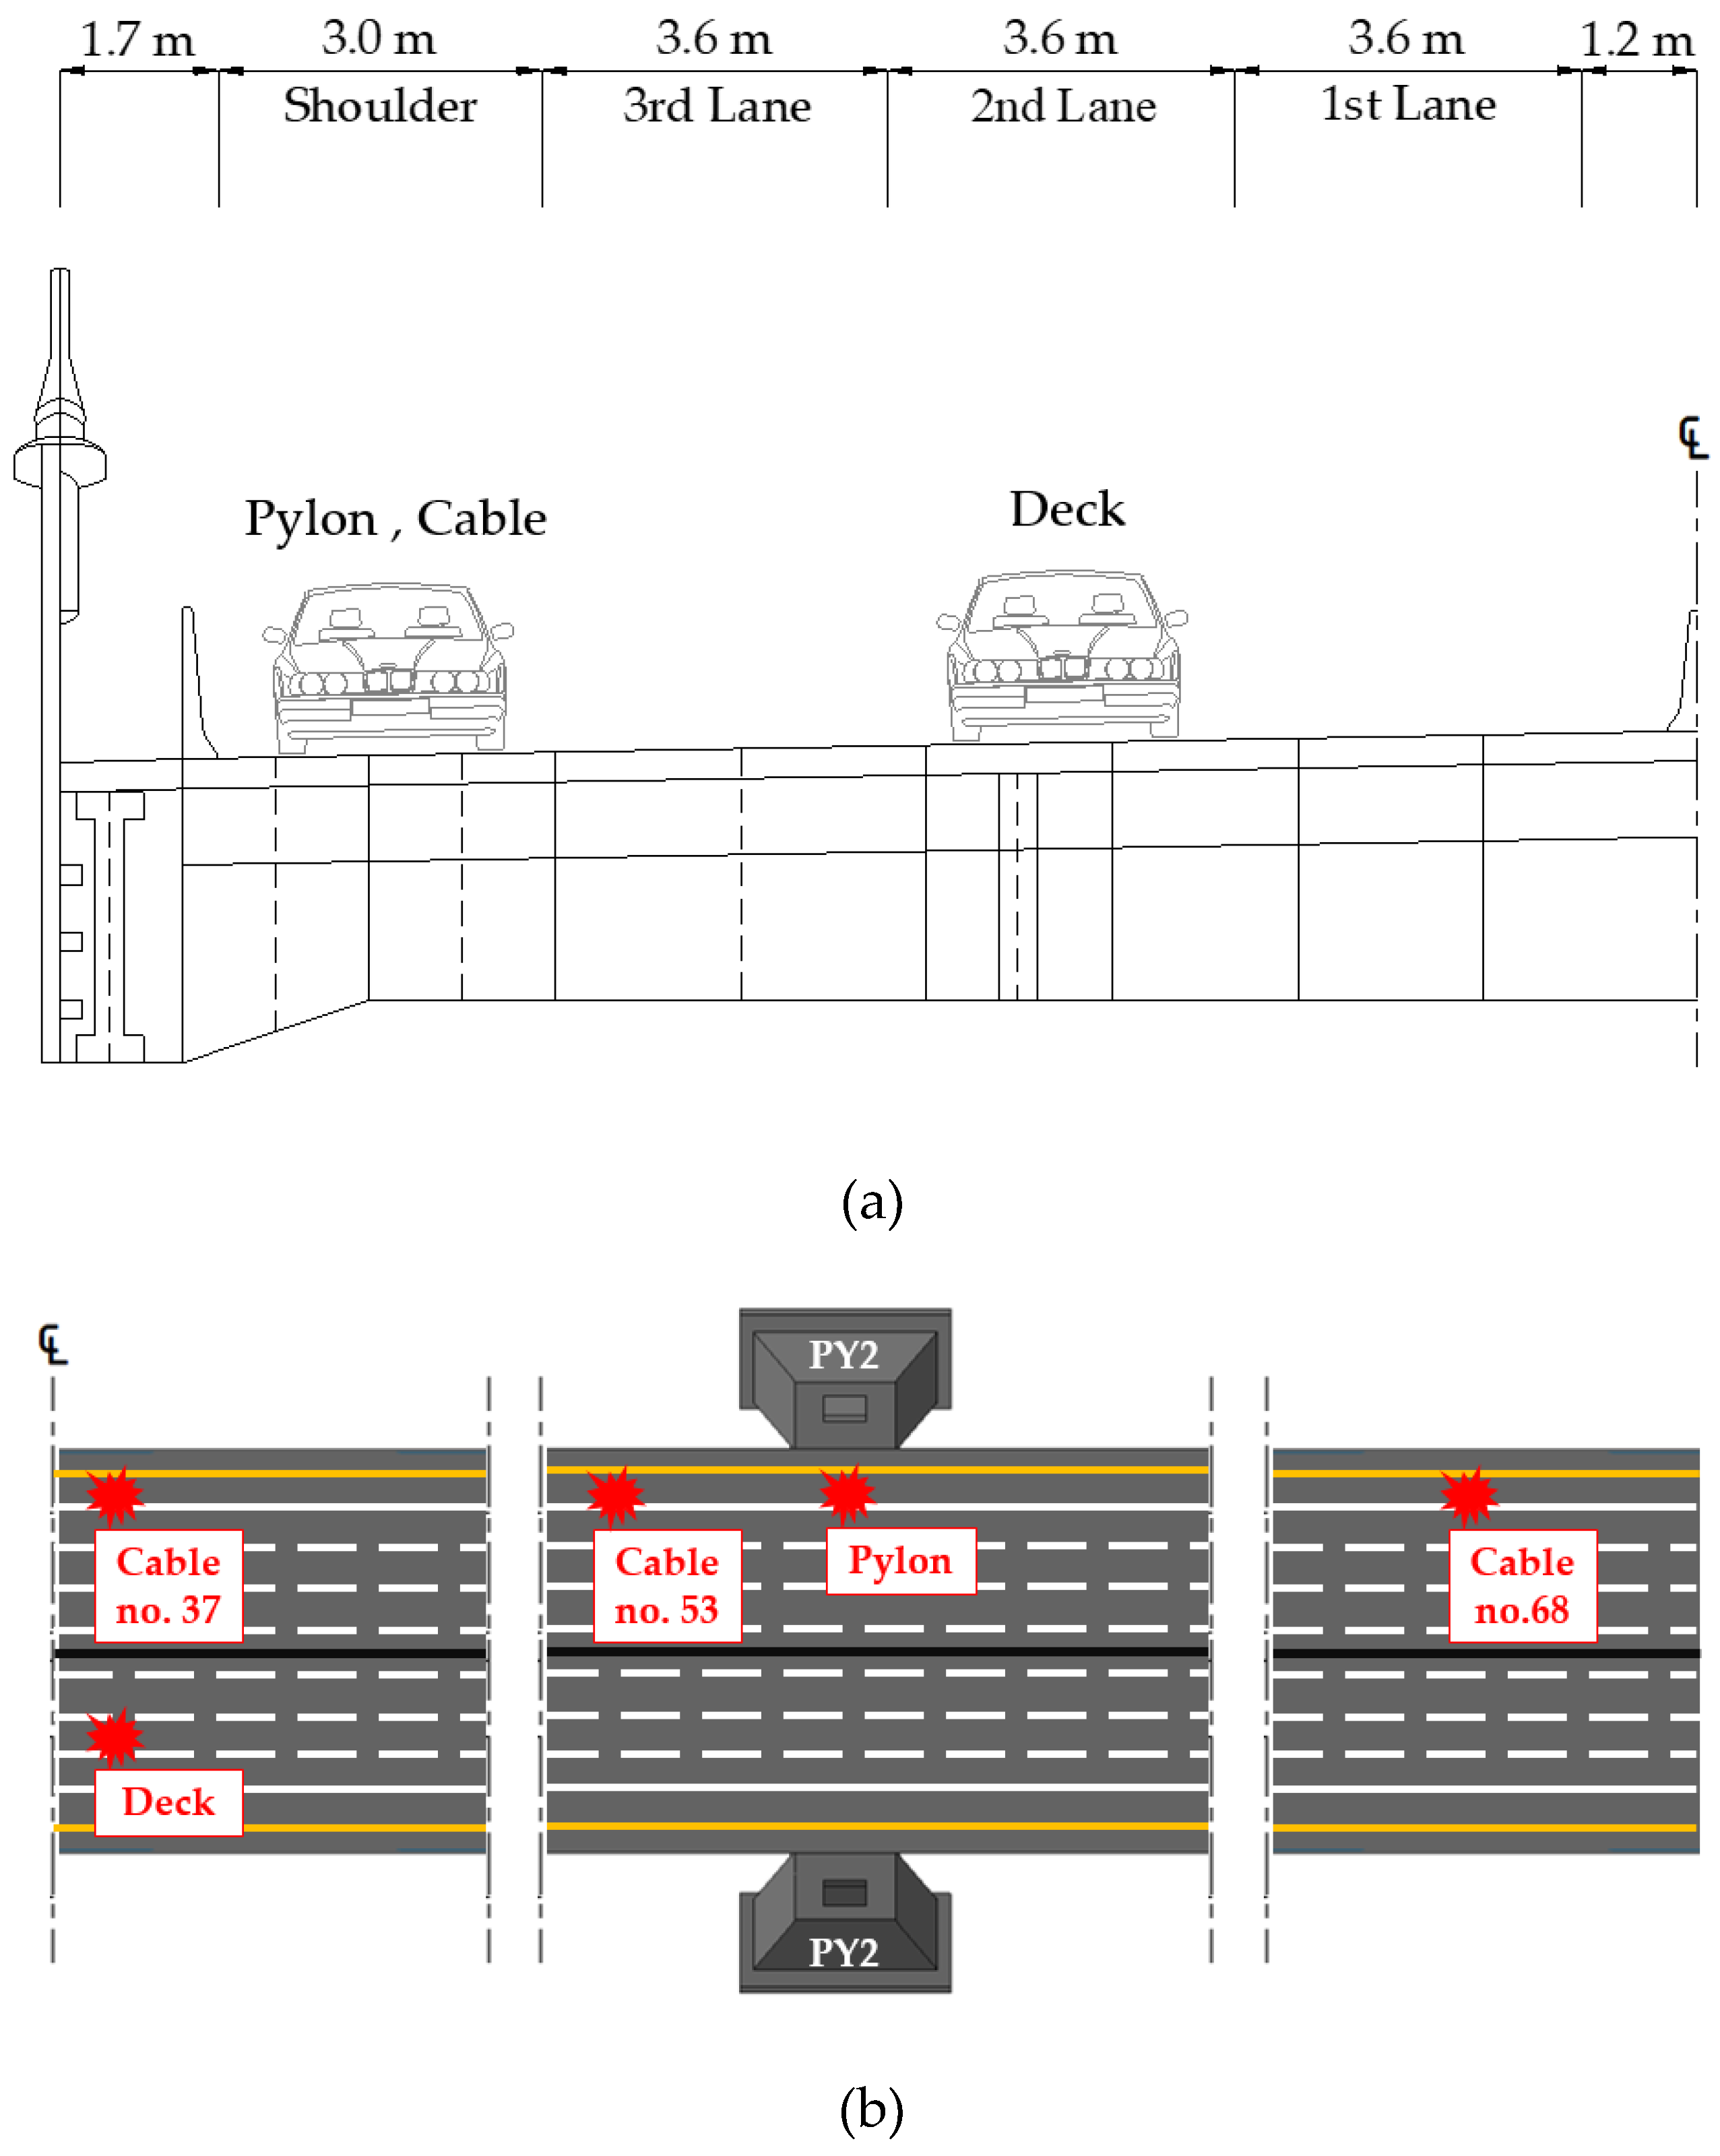
3.1. Blast Scenario
3.2. Blast Load Cases
4. Blast Analysis Results
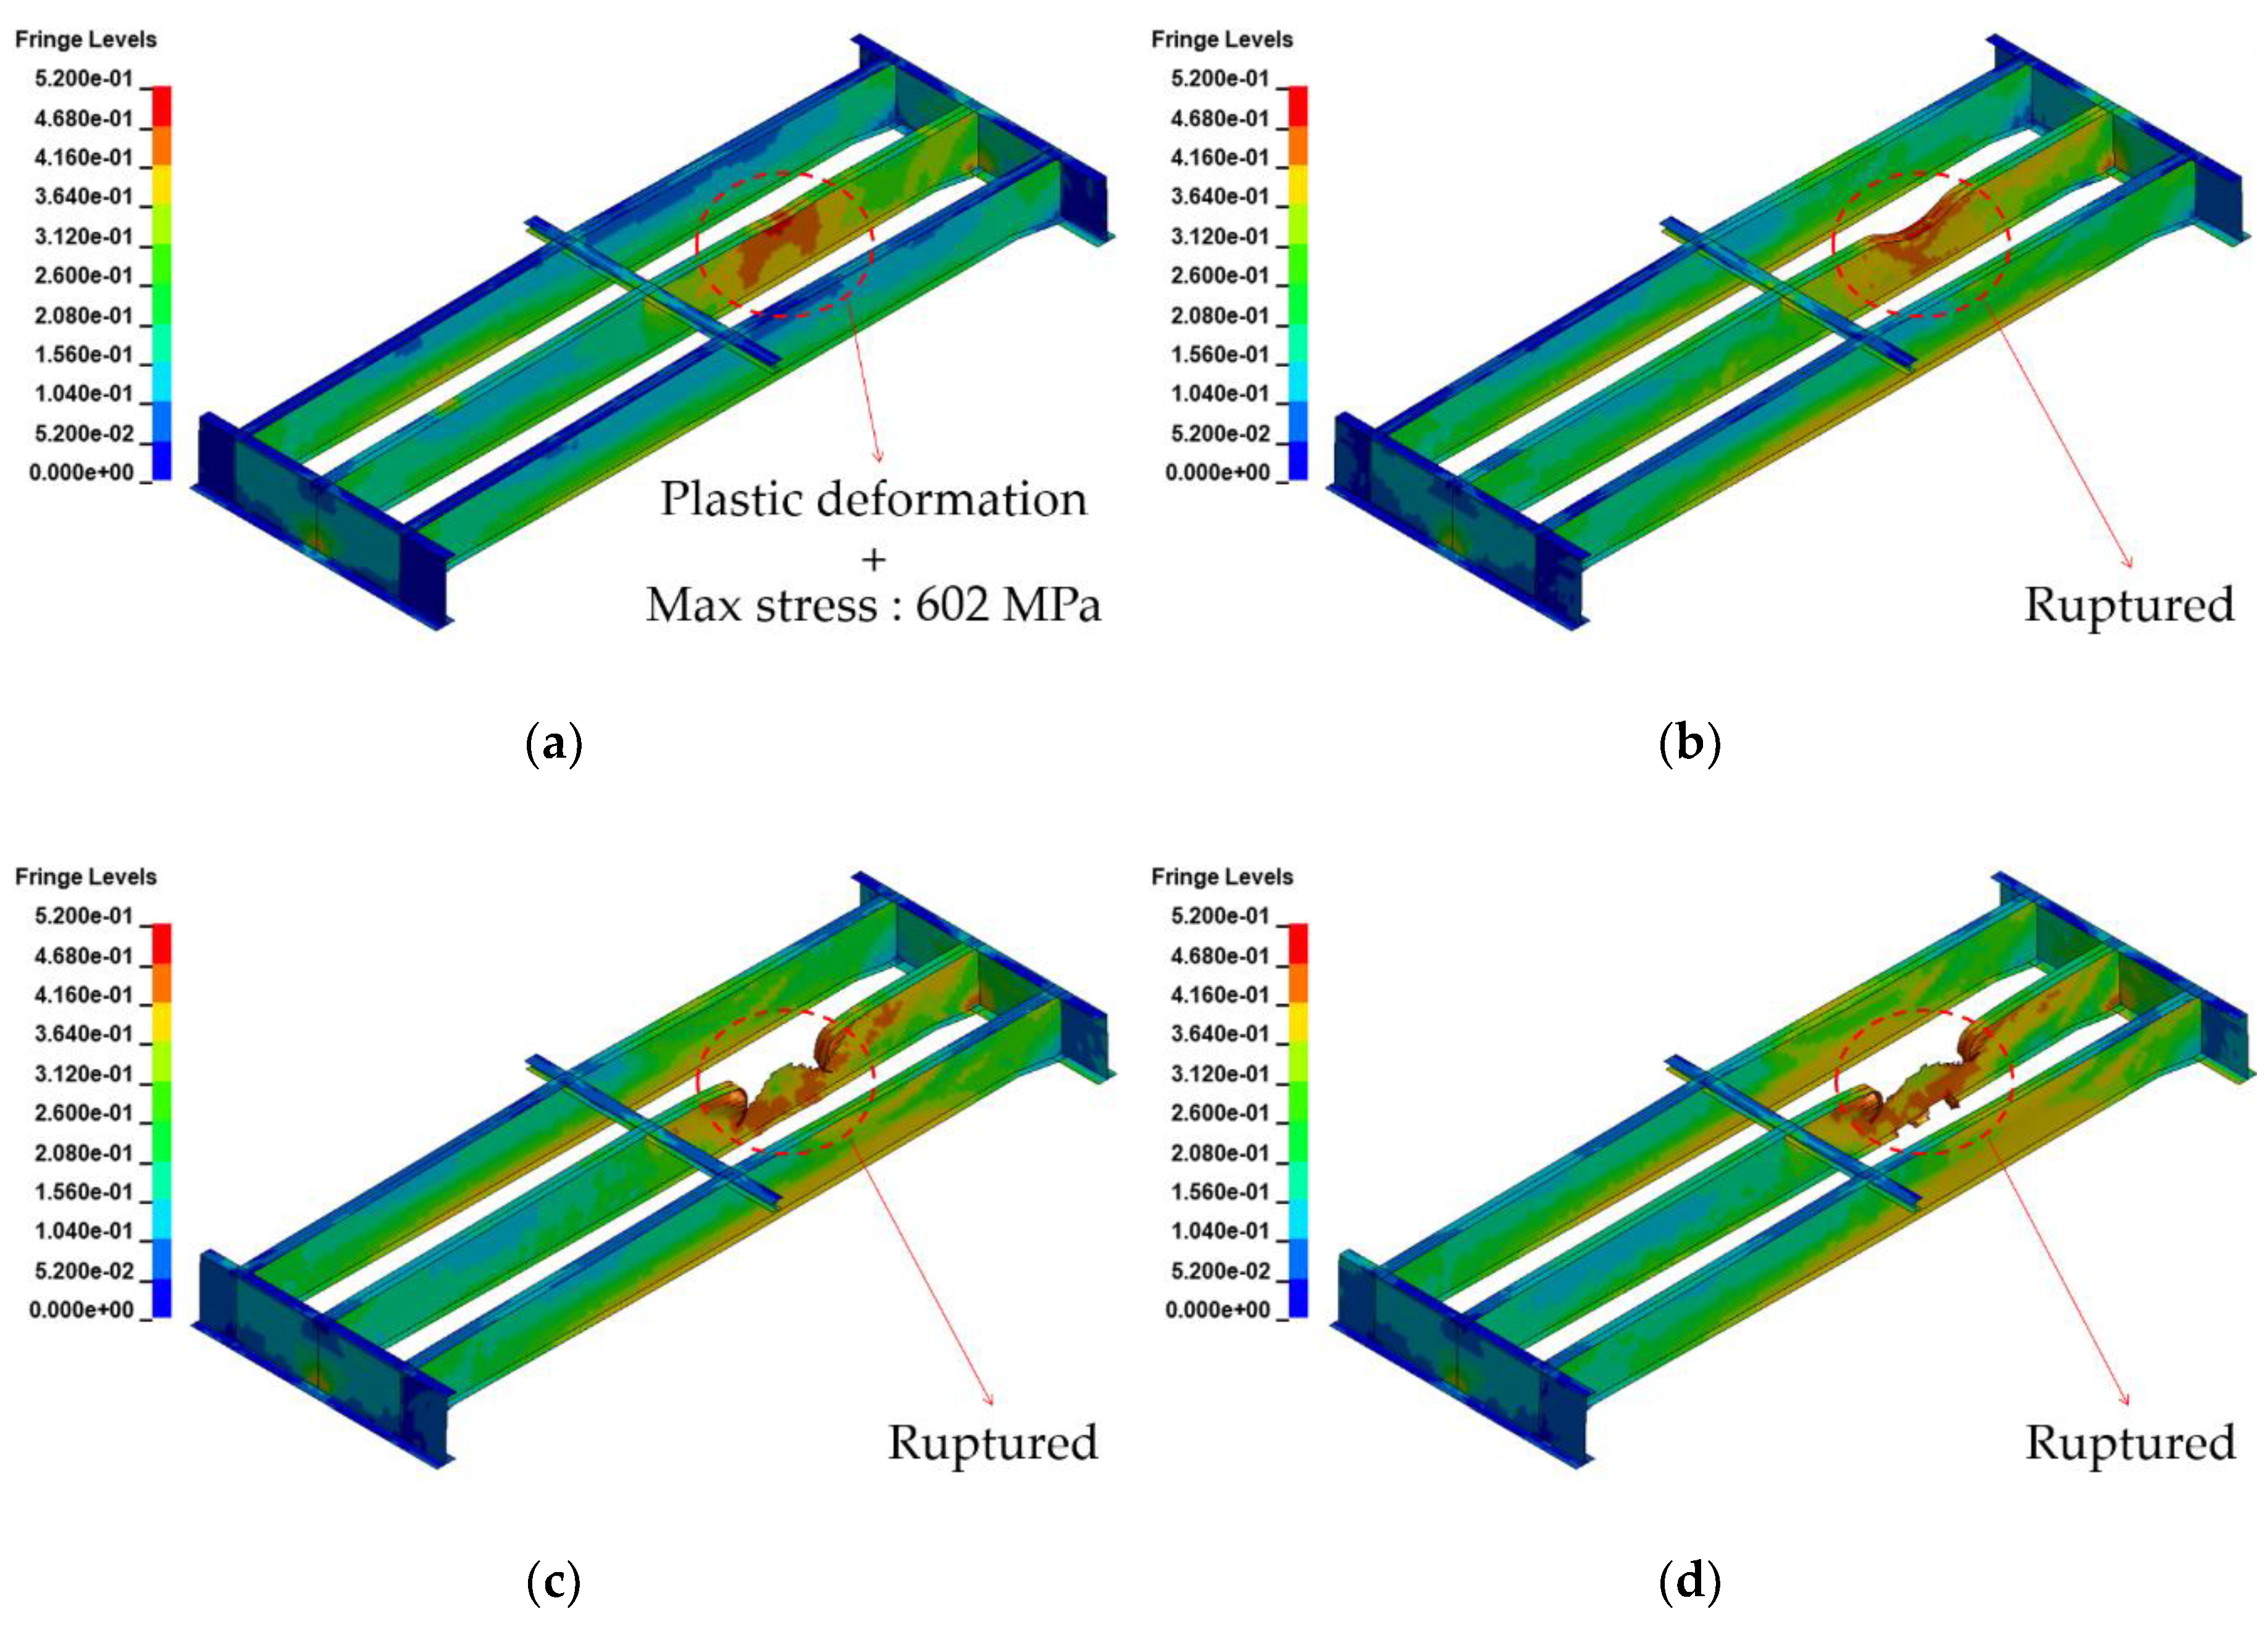
4.1. Deck
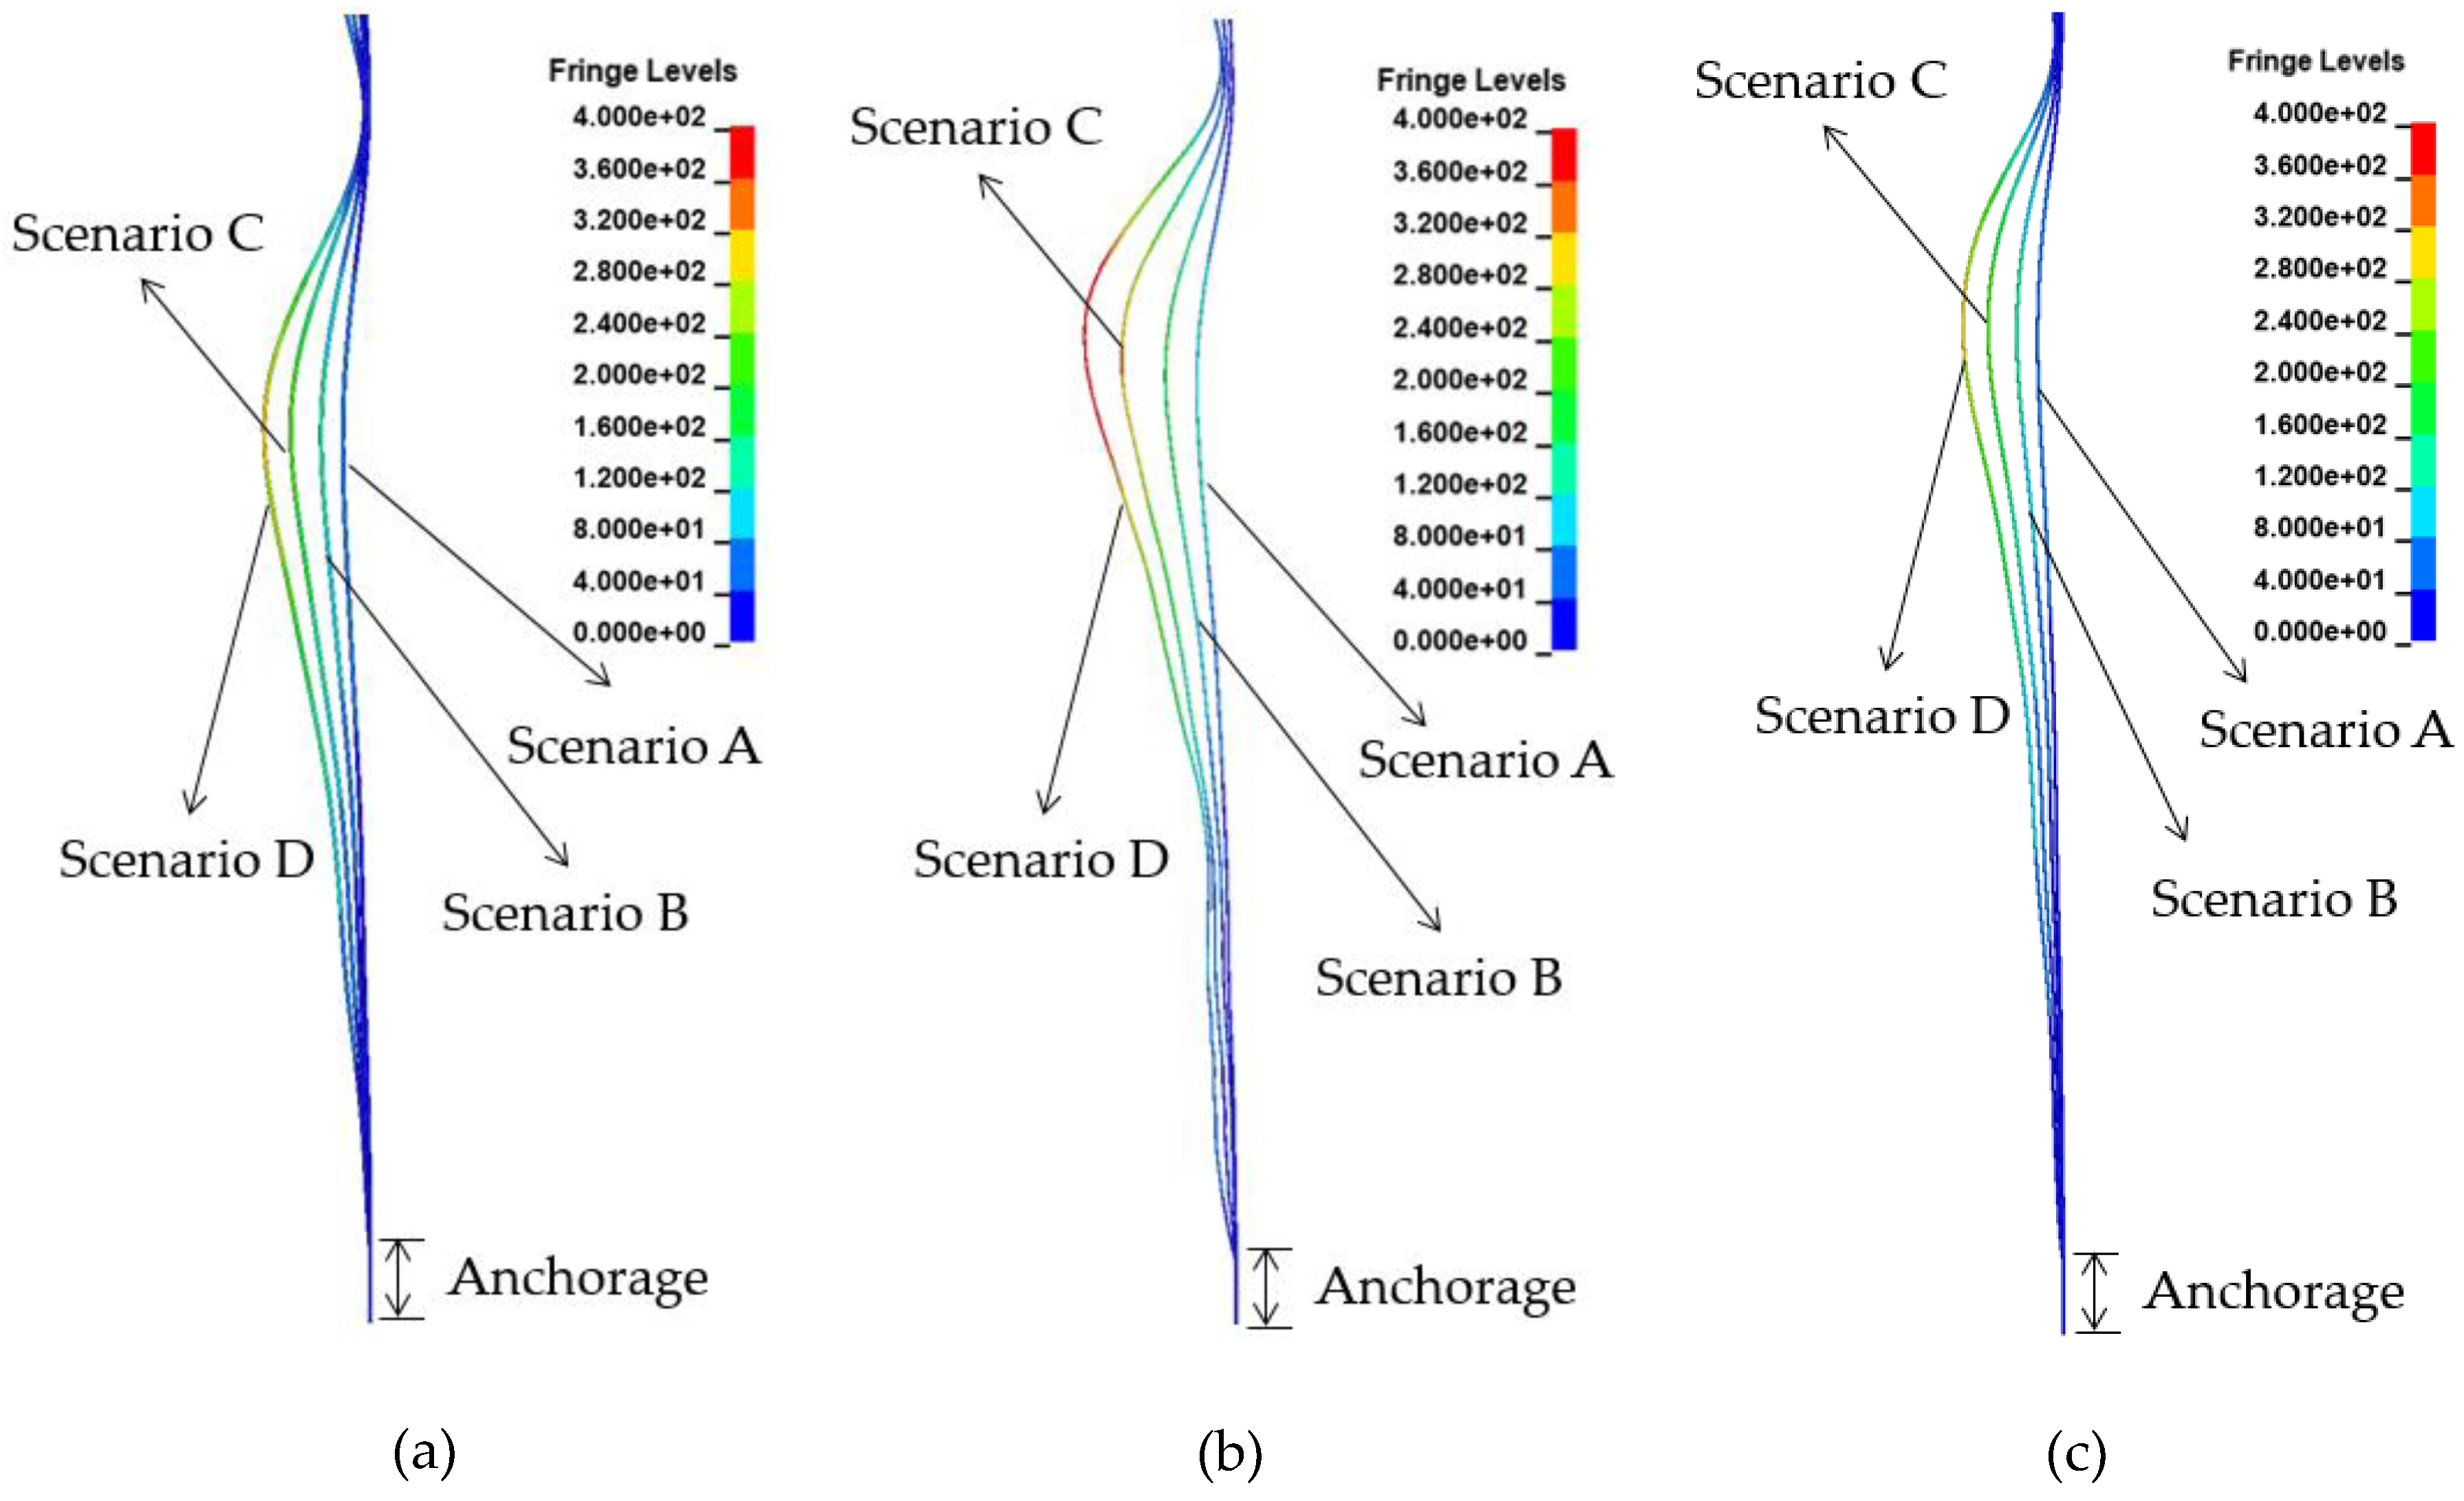
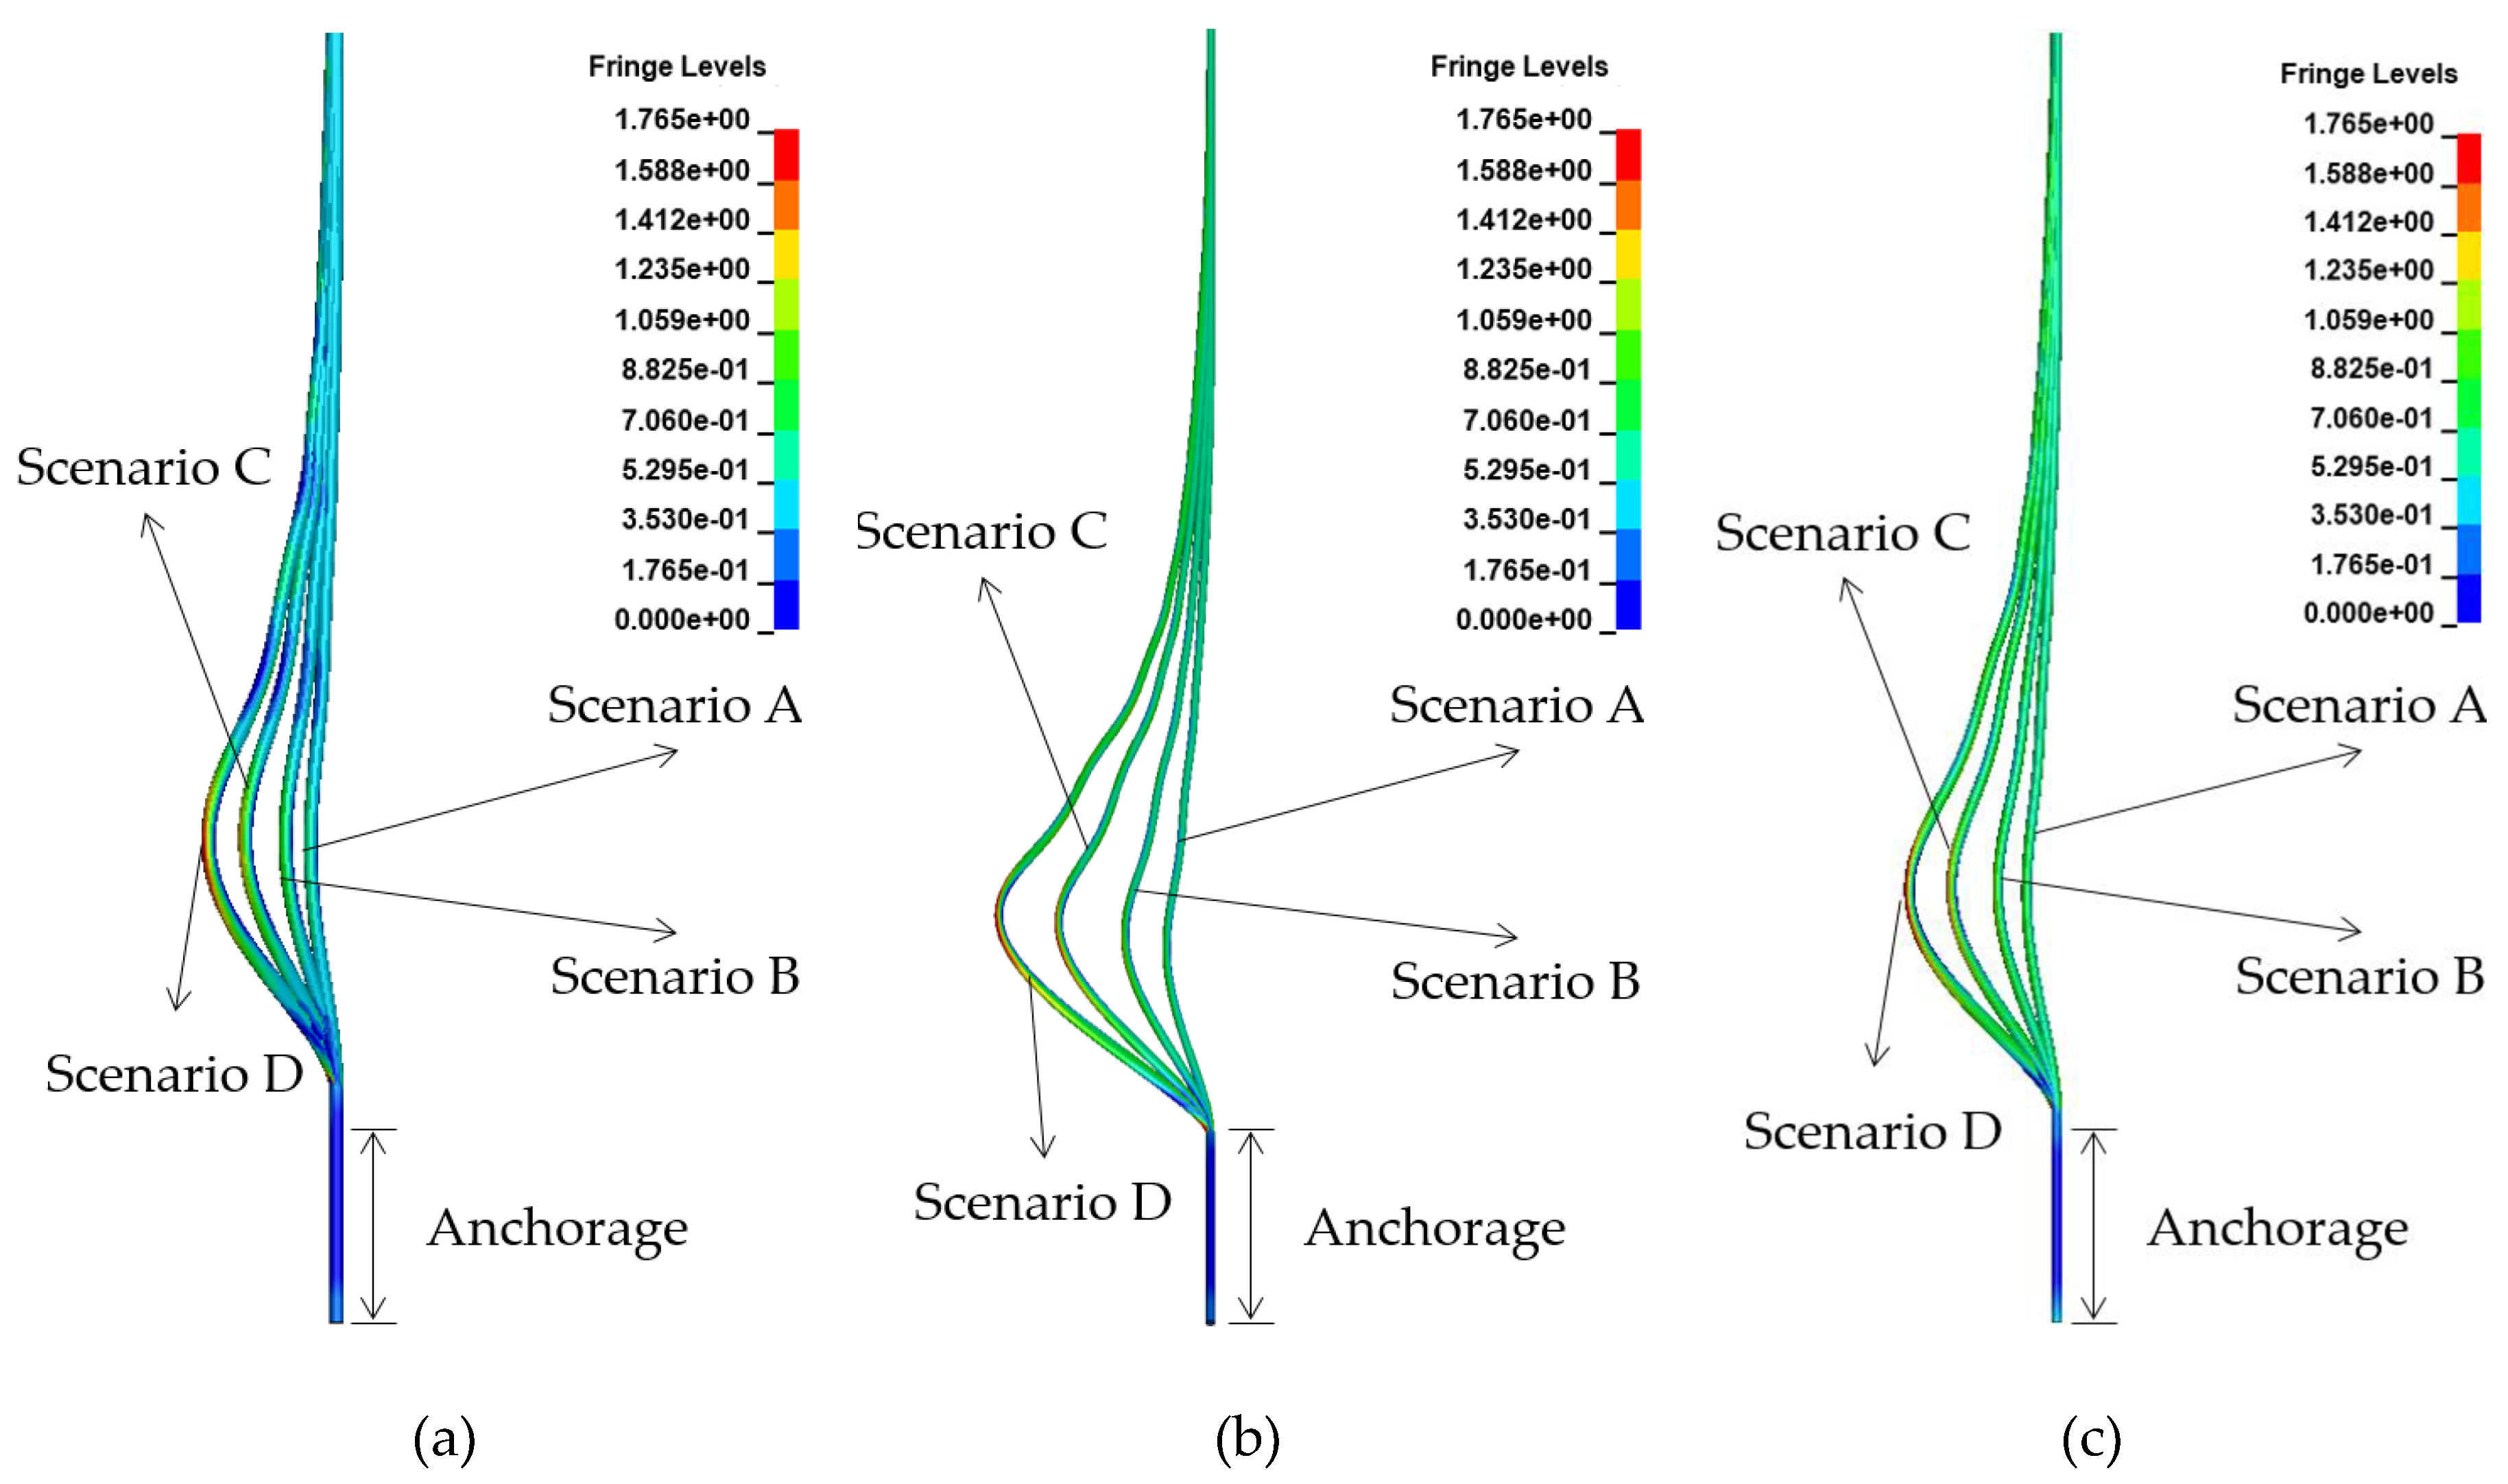
4.2. Cable
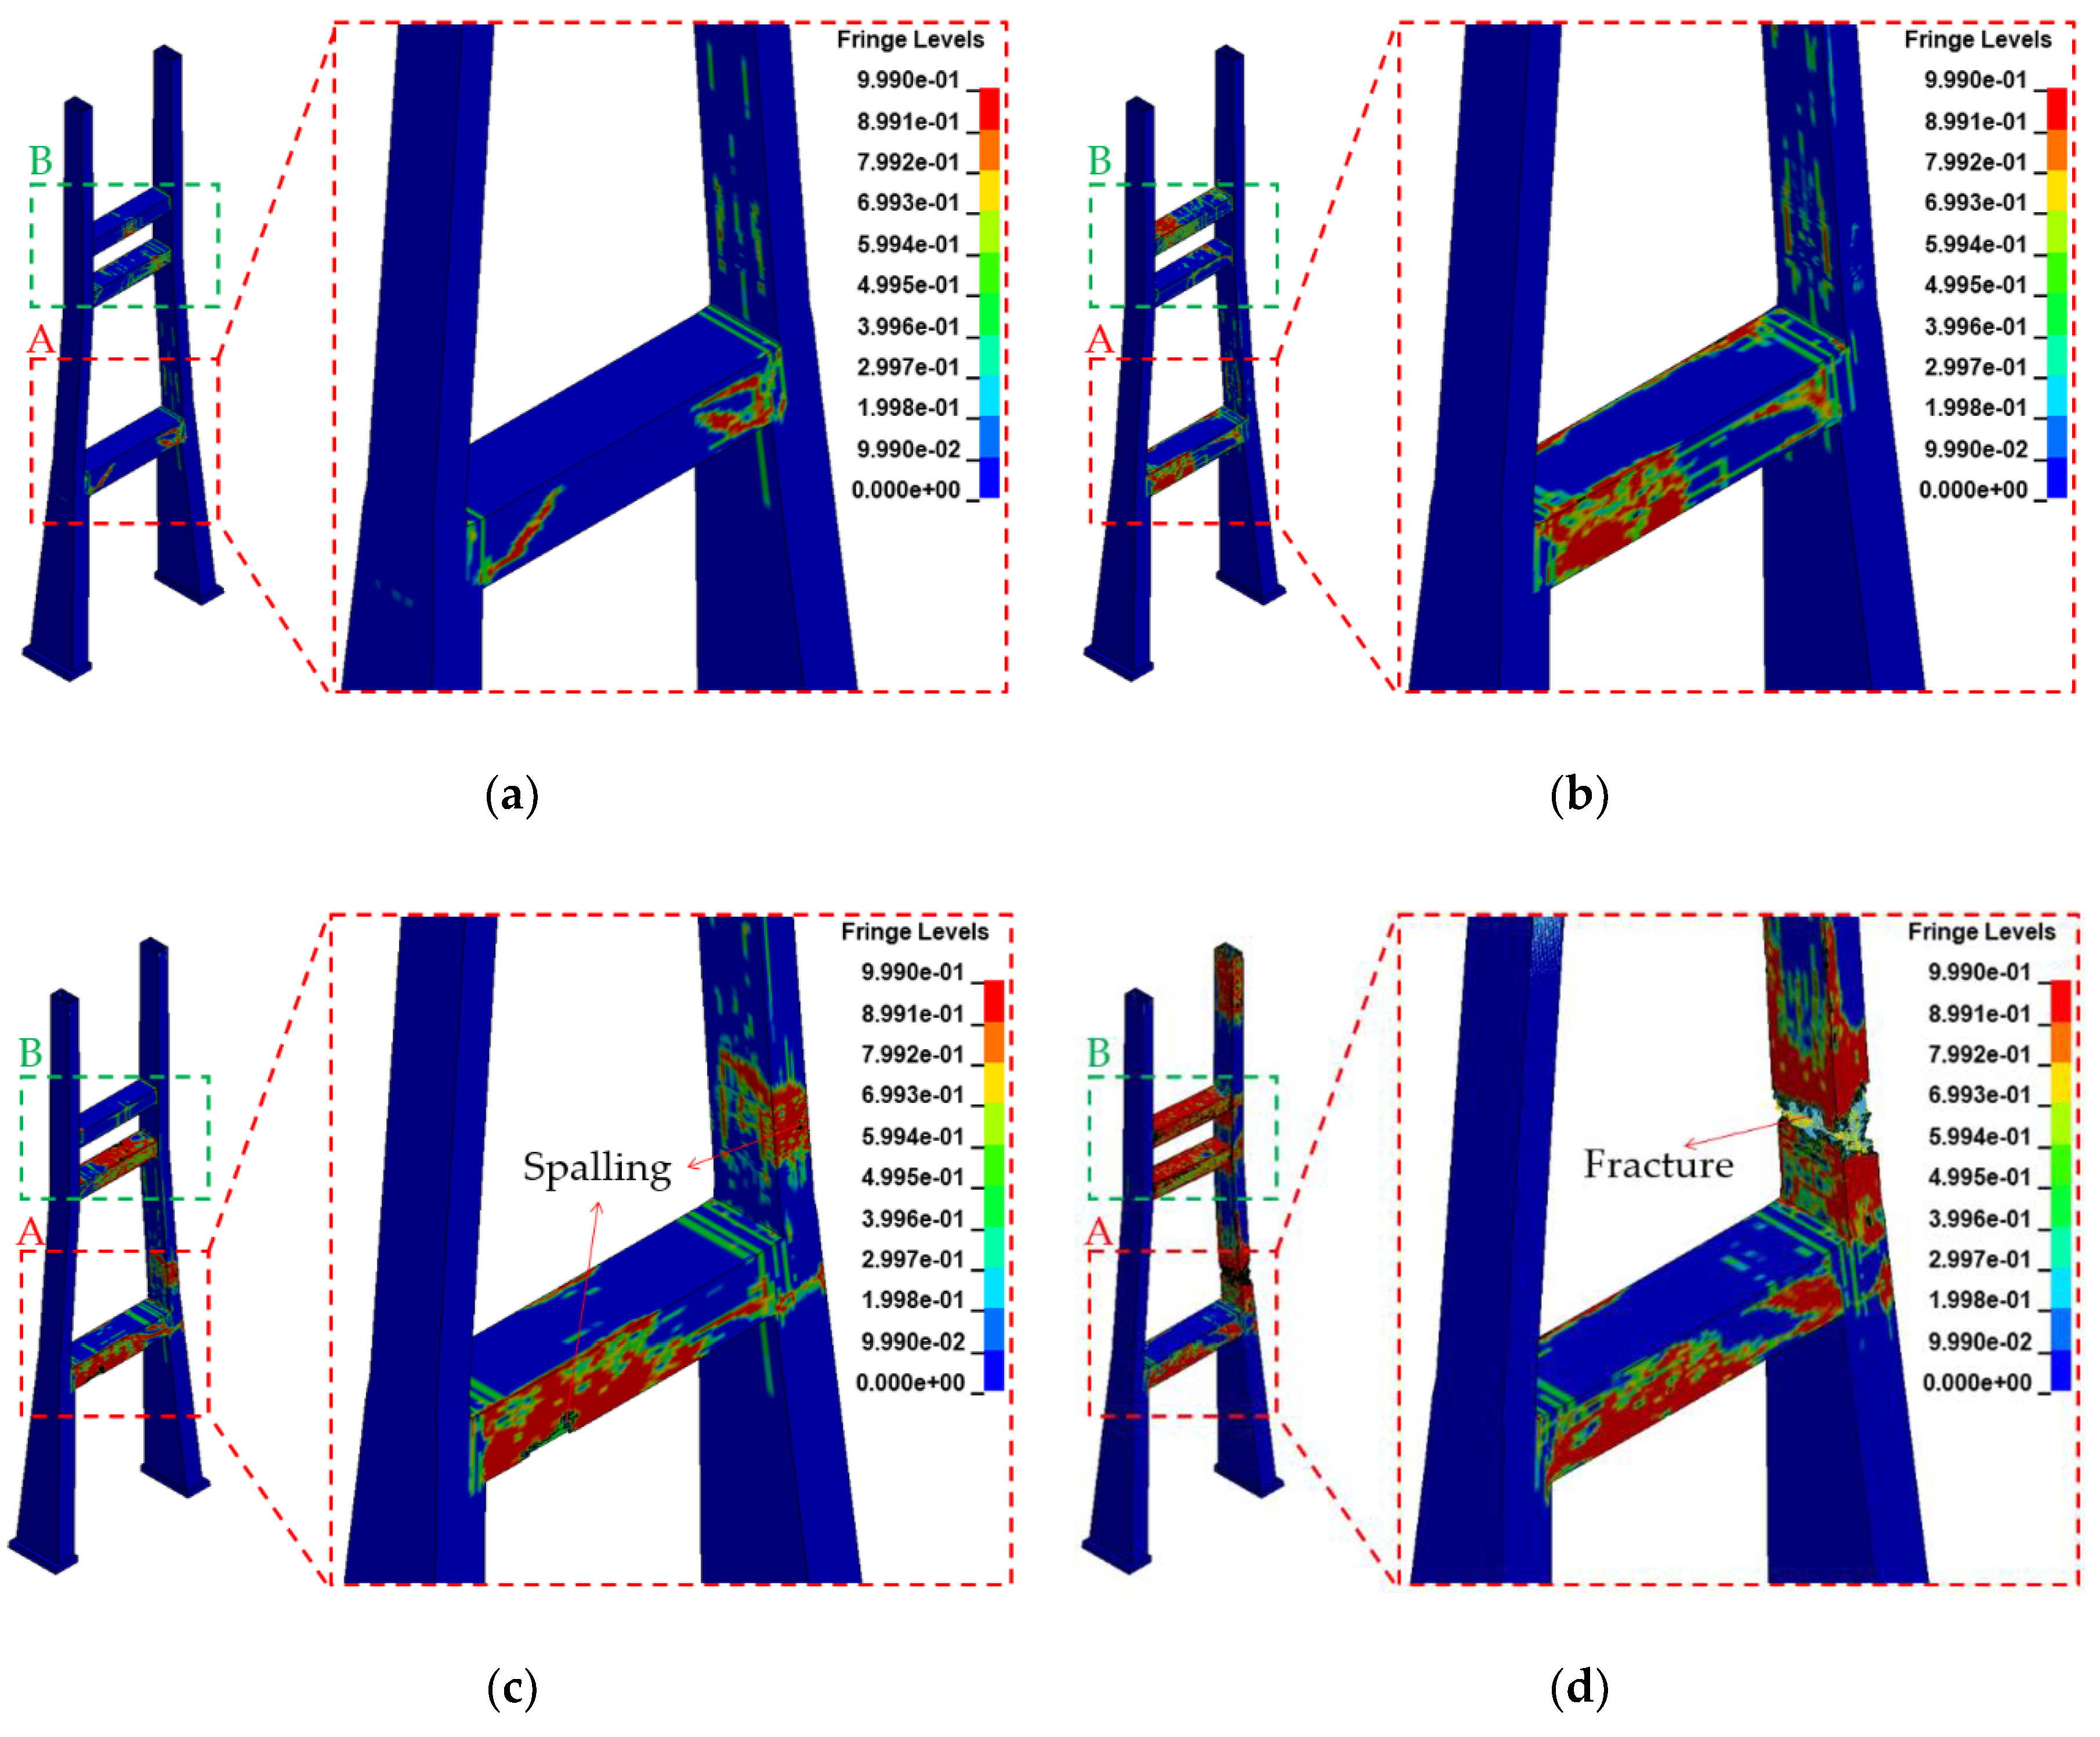
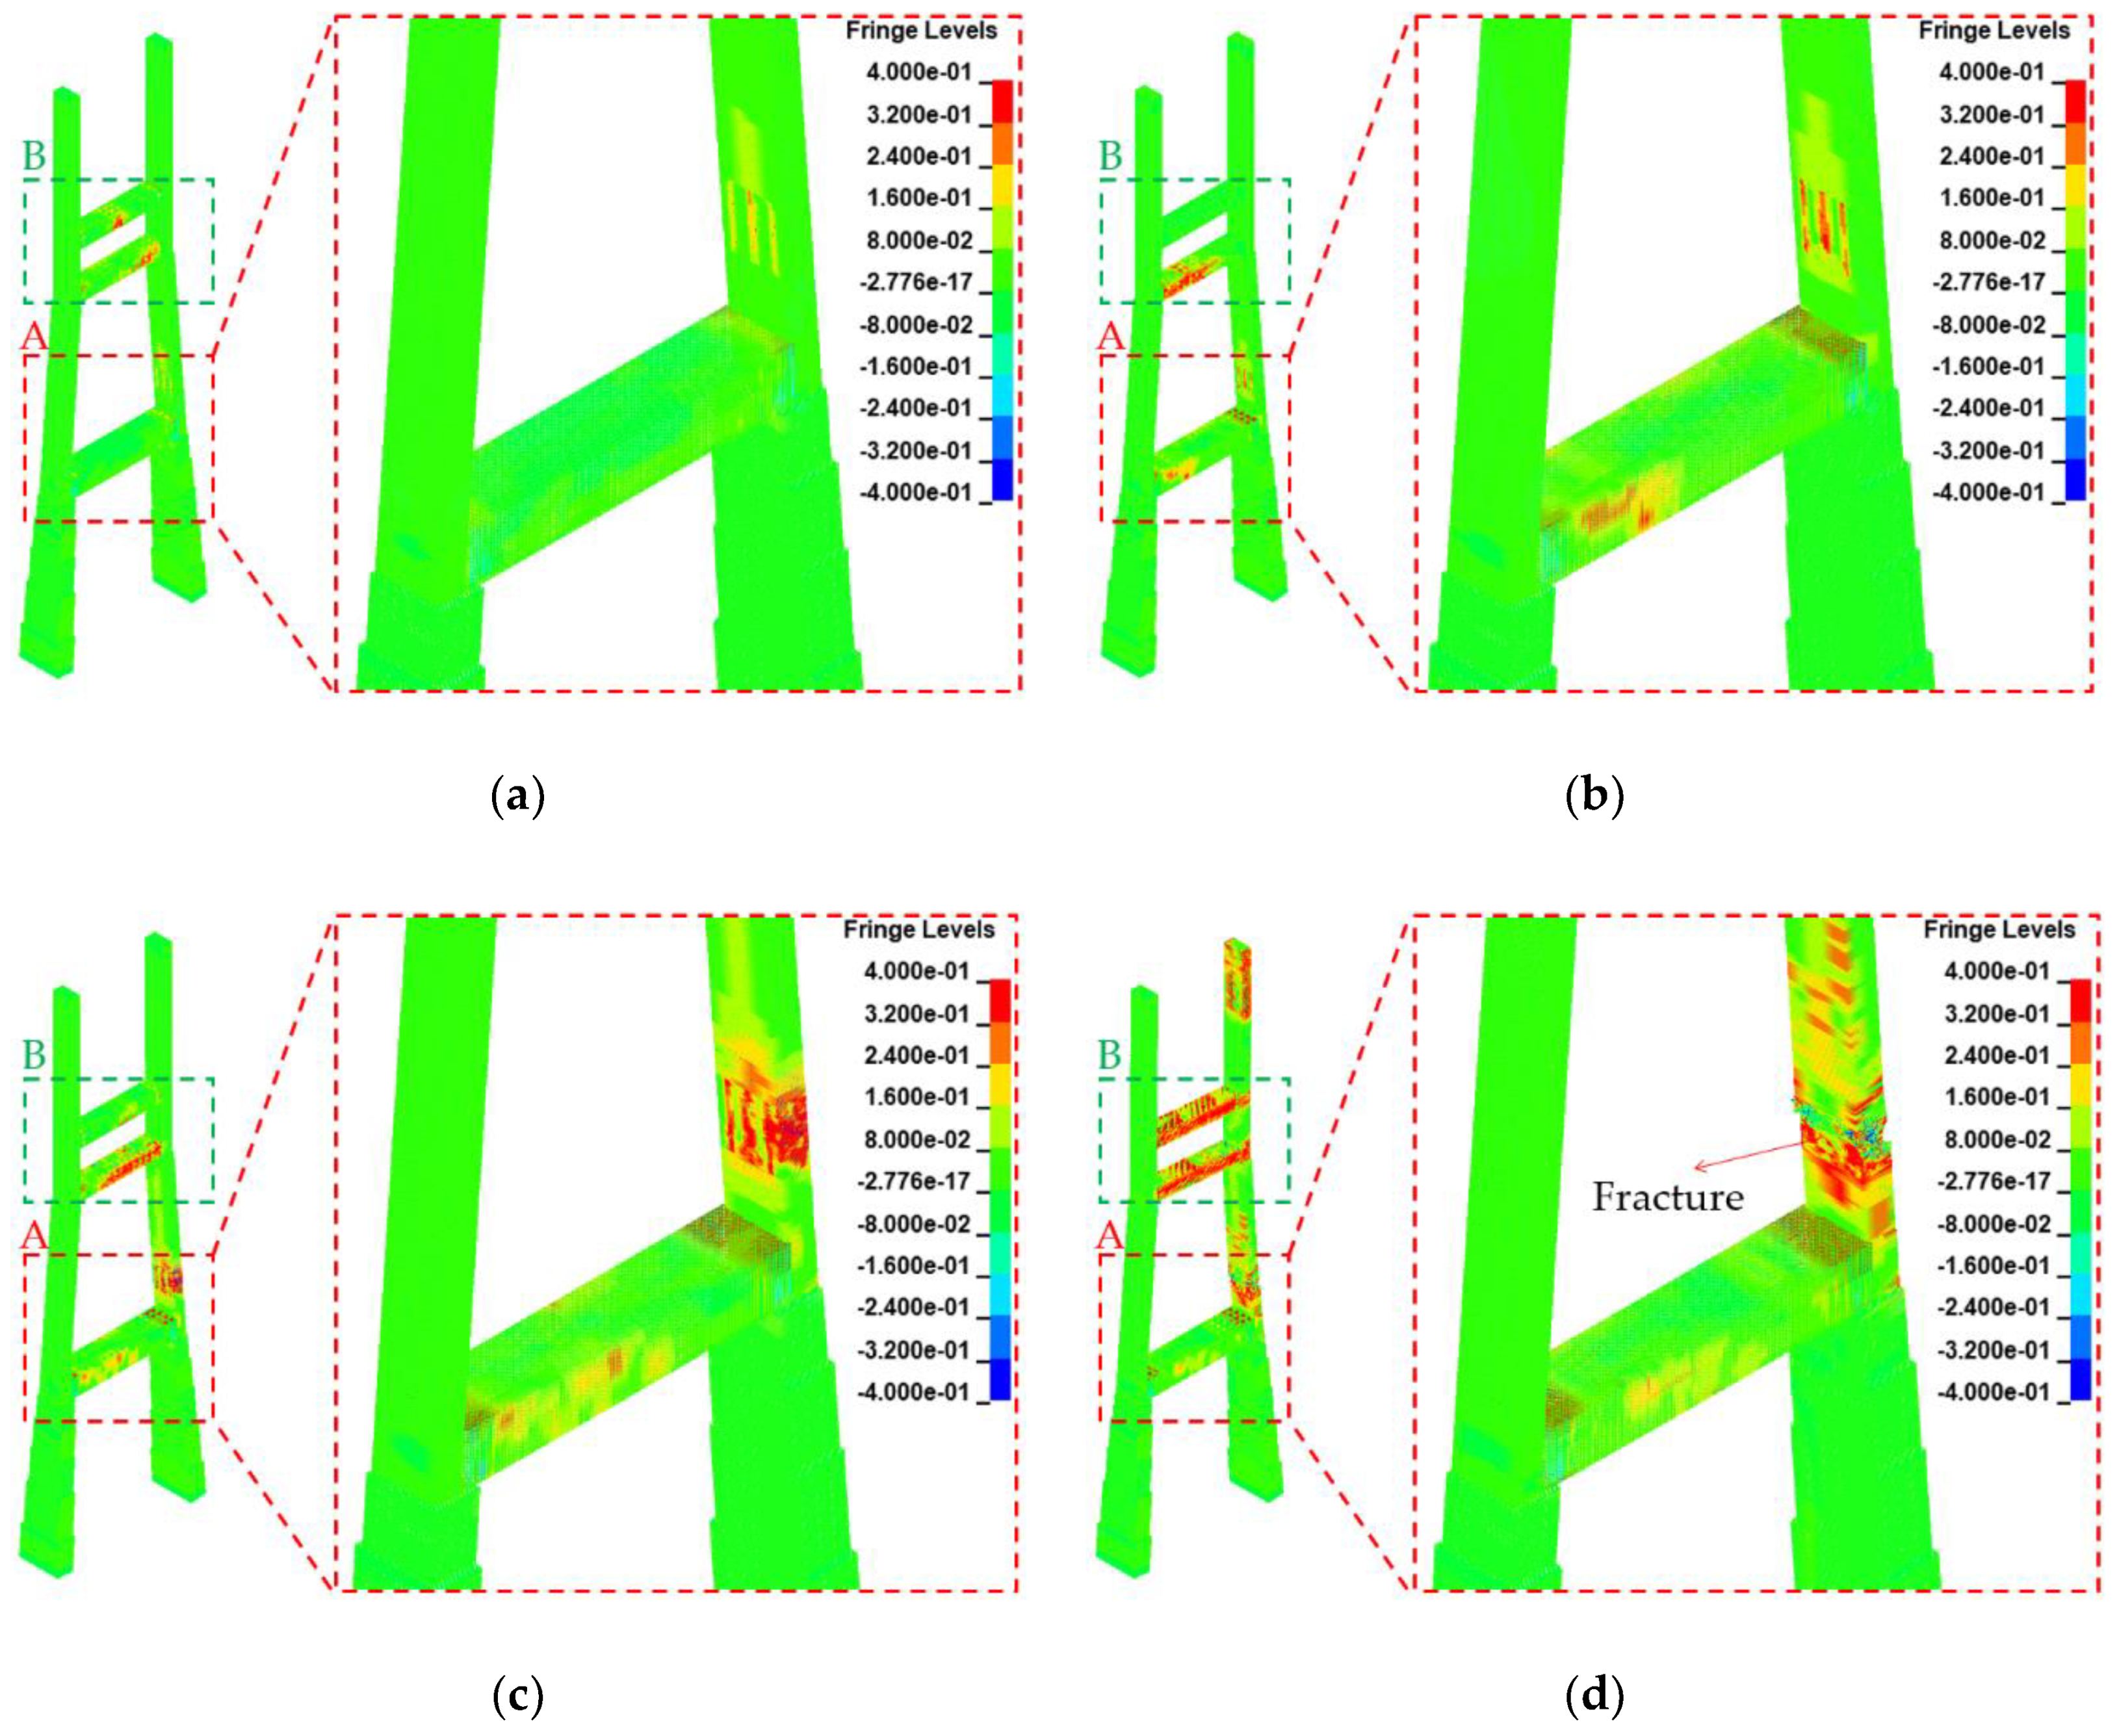
4.3. Pylon
5. Conclusions
- The study introduced an appropriate blast scenario setting method to facilitate the performance evaluations of the main components of a cable-stayed bridge under a blast load. Furthermore, a method for modeling these components was proposed, which was sensitive to the structural characteristics of such bridges.
- A superstructure blast analysis was conducted in each scenario according to the blast position, and the results were examined. The results showed that the damage range of the components increased with the blast load. The damage types observed included the scabbing and perforation of the slab, as well as the deformation and fracture of the steel girder. Furthermore, the superstructure was more vulnerable to a blast above the crossbeams than between them.
- A blast analysis was conducted in each scenario for cables of different diameters, lengths, and design stresses. The results showed that the maximum displacement and effective stress in each cable increased with the blast load, and no cable fractures occurred in all scenarios. The increase in effective stress (relative to the initial stress of the cable) generated by the blast load was approximately 531–1292 MPa for Cable no. 37 (which had the maximum diameter), 824–1258 MPa for Cable no. 53 (which had the minimum diameter) and 646–1095 MPa for Cable no. 68 (which had the maximum design stress). As such, the maximum stress variation was observed on Cable no. 37. However, the maximum displacement and effective stress occurred on Cable no. 53, which had a minimum cable diameter. Therefore, in the case of cables, a blast near the cable with a small diameter tends to have a large impact on the behavior of the cable-stayed bridge.
- For evaluating pylon characteristics, the case wherein a blast occurred on the hard shoulder was examined. The results show that the damage range of the pylon increased with the blast load, and the concrete and rebars were fractured in some scenarios. The damage and rebar yield occurred primarily in the pylon column and the upper cross beams, wherein the applied blast load was largest. The significant damage in the upper crossbeams was considered to be due to the continuous compression of the pylon. Furthermore, the maximum transverse displacement caused by the blast load was examined, and it was found to have an impact on the local behavior of the pylon for Scenarios A–C; however, for Scenario D, it was found to affect the overall behavior of the pylon, with displacements of 636.6 and 649.7 mm being observed at the top of the pylon and at the deck height in the column, respectively. Therefore, the pylon may be severely damaged under Scenario D.
Author Contributions
Funding
Conflicts of Interest
References
- Jenkins, B.M. Protecting Surface Transportation System and Patrons from Terrorist Activities; Mineta Transportation Institute, San José State University: San Jose, CA, USA, 1997. [Google Scholar]
- Ray, J.C. Validation of numerical modeling and analysis of steel bridge towers subjected to blast loadings. In Proceedings of the Structures Congress: Structural Engineering and Public Safety, St. Louis, MO, USA, 18–21 May 2006. [Google Scholar]
- Fujikura, S.; Bruneau, M.; Lopez-Garcia, D. Experimental Investigation of multihazard resistant bridge piers having concrete-filled steel tube under blast loading. J. Bridge Eng. 2008, 13, 586–594. [Google Scholar] [CrossRef]
- Fujikura, S.; Bruneau, M. Experimental Investigation of seismically resistant bridge piers under blast loading. J. Bridge Eng. 2011, 16, 63–71. [Google Scholar] [CrossRef]
- Williams, E.B.; Bayrak, O.; Davis, C.; Williams, G.D. Performance of bridge columns subjected to blast loads. I: Experimental program. J. Bridge Eng. 2011, 16, 693–702. [Google Scholar] [CrossRef]
- Foglar, M.; Kovar, M. Conclusions from experimental testing of blast resistance of FRC and RC bridge decks. Int. J. Impact Eng. 2013, 59, 18–28. [Google Scholar] [CrossRef]
- Hajek, R.; Fladr, J.; Pachman, J.; Stoller, J.; Foglar, M. An experimental evaluation of the blast resistance of heterogeneous concrete-based composite bridge decks. Eng. Struct. 2019, 179, 204–210. [Google Scholar] [CrossRef]
- Williams, E.B.; Bayrak, O.; Davis, C.; Williams, G.D. Performance of bridge columns subjected to blast loads. II: Results and recommendations. J. Bridge Eng. 2011, 16, 703–710. [Google Scholar] [CrossRef]
- Williams, G.D.; Williams, E.B. Response of reinforced concrete bridge columns subjected to blast loads. J. Struct. Eng. 2011, 137, 903–913. [Google Scholar] [CrossRef]
- Winget, D.G.; Marchand, K.A.; Williamson, E.B. Analysis and design of critical bridges subjected to blast loads. J. Struct. Eng. 2005, 131, 1243–1255. [Google Scholar] [CrossRef]
- Anwarul Islam, A.K.M.; Yazdani, N. Performance of AASHTO girder bridges under blast loading. Eng. Struct. 2008, 30, 1922–1937. [Google Scholar] [CrossRef]
- Pan, Y.; Chan, B.Y.B.; Cheung, M.M.S. Blast loading effects on an RC slab-on-girder bridge superstructure using the multi-euler domain method. J. Bridge Eng. 2013, 18, 1152–1163. [Google Scholar] [CrossRef]
- Andreou, M.; Kotsoglou, A.; Pantazopoulou, S. Modeling blast effects on a reinforced concrete bridge. Adv. Civ. Eng. 2016, 4167329, 1–11. [Google Scholar]
- Deng, R.-B.; Jin, X.-L. Numerical simulation of bridge damage under blast loads. WSEAS Trans. Comput. 2009, 8, 1564–1574. [Google Scholar]
- Tang, E.K.C.; Hao, H. Numerical simulation of a cable-stayed bridge response to blast loads, part I: Model development and response calculations. Eng. Struct. 2010, 32, 3180–3192. [Google Scholar] [CrossRef]
- Hao, H.; Tang, E.K.C. Numerical simulation of a cable-stayed bridge response to blast loads, part II: Damage prediction and FRP strengthening. Eng. Struct. 2010, 32, 3193–3205. [Google Scholar] [CrossRef]
- Son, J.; Lee, H.-J. Performance of cable-stayed bridge pylons subjected to blast loading. Eng. Struct. 2011, 33, 1133–1148. [Google Scholar] [CrossRef]
- Bojanowski, C.; Balcerzak, M. Response of a large span stay cable bridge to blast loading. In Proceedings of the 13th International LS-DYNA Users Conference, Dearborn, MI, USA, 8–10 June 2014. [Google Scholar]
- Hashemi, S.K.; Bradford, M.A.; Valipour, H.R. Dynamic response of cable-stayed bridge under blast load. Eng. Struct. 2016, 127, 719–736. [Google Scholar] [CrossRef]
- Hashemi, S.K.; Bradford, M.A.; Valipour, H.R. Dynamic response and performance of cable-stayed bridge under blast load: Effect of pylon geometry. Eng. Struct. 2017, 137, 50–66. [Google Scholar] [CrossRef]
- Pan, Y.; Ventura, C.E.; Cheung, M.M.S. Performance of highway bridges subjected to blast loads. Eng. Struct. 2017, 151, 788–801. [Google Scholar] [CrossRef]
- Farahmand-Tabar, S.; Barghian, M.; Vahabzadeh, M. Investigation of the progressive collapse in a suspension bridge under the explosive load. Int. J. Steel Struct. 2019, 19, 2039–2050. [Google Scholar] [CrossRef]
- Korea Expressway Corporation. Practical applications of Long-termly Measured Data on Cable-supported Bridges; Korea Expressway Corporation: Gimcheon, Korea, 2007. [Google Scholar]
- LSTC (Livermore Software Technology Corporation). LS-DYNA Keyword User’s Manual; Livermore Software Technology Corporation: Livermore, CA, USA, 2018. [Google Scholar]
- Murray, Y.D. User Manual for LS-DYNA Concrete Material Model 159; Report No, FHWA-HRT-05-062; Federal Highway Administration: Olympia, WA, USA, 2007.
- Murray, Y.D. User Manual for LS-DYNA Concrete Material Model 159; Report No, FHWA-HRT-05-063; Federal Highway Administration: Olympia, WA, USA, 2007.
- Choung, J.M.; Shim, C.S.; Kim, K.S. Plasticity and fracture behavior of marine structural steel, part I: Theoretical background of strain hardening and rate hardening. J. Ocean. Eng. Technol. 2011, 25, 134–144. [Google Scholar] [CrossRef]
- Gimsing, N.J.; Georgakis, C.T. Cable Supported Bridges: Concept and Design, 3rd ed.; John Wiley & Sons: Hoboken, NY, USA, 2012. [Google Scholar]
- Krauthammer, T. Modern Protective Structures; CRC Press: Boca Raton, FL, USA, 2008. [Google Scholar]
- Orbovic, N.; Grimes, J.; El-Domiaty, K.; Florek, J. ASME blast test on pre-stressed concrete slabs. In Proceedings of the 24th Conference on Structural Mechanics in Reactor Technology, Busan, Korea, 20–25 August 2017; BEXCO: Busan, Korea, 2017. [Google Scholar]


| Part | Thickness (mm) | |
|---|---|---|
| Edge Girder | Upper flange | 50 |
| Lower flange | 50 | |
| Web | 22 | |
| Center Stringer | Upper flange | 30 |
| Lower flange | 20 | |
| Web | 12 | |
| Crossbeam | Upper flange | 30 |
| Lower flange | 30 | |
| Web | 14 | |
| Part | Vertical Rebar Diameter and Spacing (mm) | Lateral Rebar Diameter and Spacing (mm) |
|---|---|---|
| Deck | H19@150 | H16@150 |
| Pylon (CB1) | H35@125 | H22@100, H19@250 |
| Pylon (CB2, CB3) | H29@125 | H22@100 |
| Part | Category | Input Parameter |
|---|---|---|
| Concrete | Deck, Pylon | fck = 39.23 MPa, E = 33.107 GPa, ρ = 2,300 kg/m3, ERODE = 1.05 |
| Steel plate | Girder (Thickness 0–16 mm) | fy = 365 MPa, fu = 520 MPa, E = 210 GPa, ρ = 7850 kg/m3, εfail = 0.15, C = 5.67 × 10⁴ s−1, p = 5 |
| Girder (Thickness 17–40 mm) | fy = 355 MPa, fu = 520 MPa, E = 210 GPa, ρ = 7850 kg/m3, εfail = 0.19, C = 4.99 × 10⁴ s−1, p = 5 | |
| Girder (Thickness 41–75 mm) | fy = 335 MPa, fu = 520 MPa, E = 210 GPa, ρ = 7850 kg/m3, εfail = 0.21, C = 3.69 × 10⁴ s−1, p = 5 | |
| Rebar | Deck, Pylon | fy = 400 MPa, fu = 560 MPa, E = 200 GPa, ρ = 7850 kg/m3, εfail = 0.16, C = 8.21 × 10⁴ s−1, p = 5 |
| Cable (BS-5896 Super Grade) | Stay Cable | fy = 1569 MPa, fu = 1765 MPa, E = 200 GPa, ρ = 7850 kg/m3, εfail = 0.035, C = 6.65 × 10⁶ s−1, p = 5 |
| Blast Scenario. | Vehicle Type | Ground Clearance (mm) | Maximum Load (kg) | TNT Load (kg) |
|---|---|---|---|---|
| Scenario A | Passenger car | 700 | 226.8 | 226.8 |
| Scenario B | Truck | 800 | 1500 | 500 |
| Scenario C | Truck | 800 | 1500 | 1000 |
| Scenario D | Truck | 800 | 1500 | 1500 |
| Blast Scenario | Component | TNT (kg) | Z (Scaled Distance, m/kg1/3) |
|---|---|---|---|
| Scenario A | Deck | 226.8 | 0.115 |
| Scenario B | 500 | 0.101 | |
| Scenario C | 1000 | 0.080 | |
| Scenario D | 1500 | 0.070 | |
| Scenario A | Cable | 226.8 | 0.525 |
| Scenario B | 500 | 0.403 | |
| Scenario C | 1000 | 0.320 | |
| Scenario D | 1500 | 0.279 | |
| Scenario A | Pylon | 226.8 | 1.181 |
| Scenario B | 500 | 0.907 | |
| Scenario C | 1000 | 0.720 | |
| Scenario D | 1500 | 0.629 |
| Model | Number of Elements | Time Step Size (10−6 s) | CPU Time (s) |
|---|---|---|---|
| Deck | 198,550 | 4.826–4.943 | 49,670–50,568 |
| Cable no. 37 | 77,868 | 0.861–0.868 | 54,115–56,275 |
| Cable no. 53 | 35,316 | 0.545–0.554 | 37,015–40,345 |
| Cable no. 68 | 65,232 | 0.735–0.745 | 52,948–54,090 |
| Pylon | 917,438 | 7.257–11.092 | 87,009–95,547 |
| Blast Scenario | Blast Position | Damage Type of Slab | Steel Girder | |
|---|---|---|---|---|
| Maximum Stress | Damage Type | |||
| Scenario A | 2nd lane/ Between crossbeams | Scabbing | 434 MPa | Plastic deformation |
| Scenario B | Perforation | 452 MPa | ||
| Scenario C | 479 MPa | |||
| Scenario D | 509 MPa | |||
| Scenario A | 2nd lane/ Above crossbeam | Scabbing | 602 MPa | Plastic deformation |
| Scenario B | Perforation | - | Ruptured | |
| Scenario C | - | |||
| Scenario D | - | |||
| Blast Scenario | Blast Position | Maximum Displacement | Maximum Stress |
|---|---|---|---|
| Scenario A | Shoulder/ Cable no. 37 | 74.65 mm | 946 MPa |
| Scenario B | 133.81 mm | 1395 MPa | |
| Scenario C | 216.94 mm | 1663 MPa | |
| Scenario D | 289.89 mm | 1707 MPa | |
| Scenario A | Shoulder/ Cable no. 53 | 111.33 mm | 1380 MPa |
| Scenario B | 199.62 mm | 1656 MPa | |
| Scenario C | 321.73 mm | 1730 MPa | |
| Scenario D | 428.15 mm | 1814 MPa | |
| Scenario A | Shoulder/ Cable no. 68 | 74.94 mm | 1311 MPa |
| Scenario B | 134.96 mm | 1641 MPa | |
| Scenario C | 220.02 mm | 1703 MPa | |
| Scenario D | 294.46 mm | 1760 MPa |
| Blast Scenario | Blast Position | Damage Type | Maximum Transverse Displacement | |||
|---|---|---|---|---|---|---|
| Concrete | Rebar | |||||
| A Zone | B Zone | Upper Part | Road Surface | |||
| Scenario A | Shoulder | - | Yield | Yield | 9.2 mm (←) | 18.7 mm (→) |
| Scenario B | - | Yield | Yield | 19.1 mm (←) | 32.8 mm (→) | |
| Scenario C | Spalling | Yield | Yield | 59.1 mm (←) | 78.6 mm (→) | |
| Scenario D | Fracture | Fracture | Yield | 636.6 mm (→) | 649.7 mm (←) | |
Publisher’s Note: MDPI stays neutral with regard to jurisdictional claims in published maps and institutional affiliations. |
© 2020 by the authors. Licensee MDPI, Basel, Switzerland. This article is an open access article distributed under the terms and conditions of the Creative Commons Attribution (CC BY) license (http://creativecommons.org/licenses/by/4.0/).
Share and Cite
Lee, J.; Choi, K.; Chung, C. Numerical Analysis-Based Blast Resistance Performance Assessment of Cable-Stayed Bridge Components Subjected to Blast Loads. Appl. Sci. 2020, 10, 8511. https://doi.org/10.3390/app10238511
Lee J, Choi K, Chung C. Numerical Analysis-Based Blast Resistance Performance Assessment of Cable-Stayed Bridge Components Subjected to Blast Loads. Applied Sciences. 2020; 10(23):8511. https://doi.org/10.3390/app10238511
Chicago/Turabian StyleLee, Jungwhee, Keunki Choi, and Chulhun Chung. 2020. "Numerical Analysis-Based Blast Resistance Performance Assessment of Cable-Stayed Bridge Components Subjected to Blast Loads" Applied Sciences 10, no. 23: 8511. https://doi.org/10.3390/app10238511
APA StyleLee, J., Choi, K., & Chung, C. (2020). Numerical Analysis-Based Blast Resistance Performance Assessment of Cable-Stayed Bridge Components Subjected to Blast Loads. Applied Sciences, 10(23), 8511. https://doi.org/10.3390/app10238511