Abstract
This paper refers to cyclic shear strains (γc) and permanent shear strains (γp) of a soft cohesive soil, when both monotonic shear stresses (τo) and cyclic shear stresses (τc) are applied. The research is backed by an extensive experimental program with 139 cyclic simple shear tests that included identification and classification tests. These cyclic simple shear tests were conducted under different levels of stresses, τo, before the cyclic phase. Laboratory tests were carried out on undisturbed samples from the Port of Barcelona, located in Spain on the Mediterranean coast, and characterized by a monotonic strength (τmax) approximately equal to 30% of the initial effective vertical stress (σ′ov). The samples were taken at depths between 29 and 52 m and correspond to an initial effective vertical stress between 277 and 413 kPa, respectively. In general, the results indicate that: (a) the combination of τo and τc controls the generation of γc and γp, (b) it is not always true that when τo/σ′ov + τc/σ′ov ≈ τmax/σ′ov, the soil reaches failure cyclically, and (c) empirical relations useful for design can be established between γc, γp, and the number of cycles (N), for different relationships varying (τo/σ′ov) between 0% and 25%.
1. Introduction
Granular media in a loose state is a high-risk condition and has been studied extensively by researchers throughout the world. This cannot be said of research into soft cohesive soils that are subjected to cyclic loading.
The paper presented here is part of a research program related to the behavior of soft cohesive soils [1,2]. The scope of the present study is the influence of the combination of monotonic and dynamic shear stresses in the deformations that develop a soft cohesive soil when dynamically required under a structure with complex stress distribution. Figure 1 shows an idealization of some stress conditions that can be simulated in the laboratory by cyclic simple shear tests or cyclic triaxial tests for both compression and extension cases.
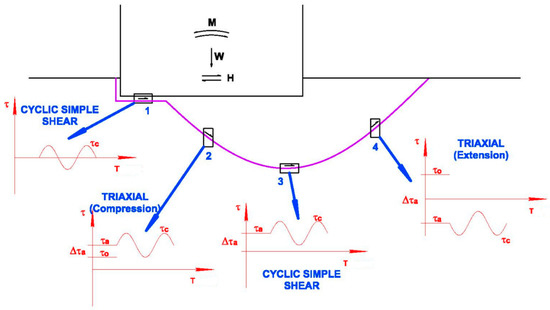
Figure 1.
Scheme that idealizes the stress conditions that occur along a hypothetical failure surface and that can be simulated by simple cyclic shear tests and triaxial tests.
Only the influence of the combination of monotonic and cyclic shear stresses on the development of cyclic and permanent strains are investigated in the present paper, but only for the combinations numbered 1 and 3 in Figure 1; these conditions are idealized by the cyclic simple shear test.
The deformations of a cohesive soil are studied when the soil is subjected to stress combinations, but focusing on the possible combinations of monotonic shear stresses (τo) and cyclic shear stresses (τc), such that the sum (τo + τc) is less or equal to the shear strength evaluated by monotonic simple shear tests (τmax).
The strength of clays under earthquake loading conditions was investigated by Seed and Chan [3]; they found that, at the same magnitude of cyclic shear stress, when the magnitude of the monotonic static shear stress is increased, the number of cycles necessary to generate failure is significantly reduced. According to Hardin and Black [4], the dynamic shear modulus (G) depends on the initial effective normal stress, void ratio, history of vibrations, degree of saturation, initial shear stress, grain characteristics, amplitude of the cyclic loading, vibration frequency, and soil structure. Andersen [5] found that the level of effective stresses controls the behavior of the clays loaded cyclically and may be related to the generation of the pore water pressure, the development of cyclic deformations, and the number of cycles needed to reach failure. The strength of clays under earthquake loading conditions was studied by Idriss et al. [6], Koufsoftas [7], Koufsoftas, and Fischer [8]. The behavior of clays under cyclic loading was also investigated by Matsui et al. [9], Kokusho et al. [10], Ansal, and Erken [11]. The influence of the static stress history on the behavior of the cohesive soils was studied by Atkinson et al. [12], Andersen and Hoeg [13], and Finno and Chung [14]. Hyodo et al. [15] and Andersen and Hoeg [13] investigated the effect of a combination of static stress and cyclic stress on the behavior of clays. Jovicic and Coop [16] and Lings [17] investigated the influence of anisotropy on the stiffness of clays. The strength of a marine clay was the object of study by Moses and Rao [18]. Boulanger and Idriss [19] focused on the evaluation of the liquefaction potential of silt and clays and proposed an estimate of the equivalent number of uniform cycles that produce softening as a function of the seismic magnitude (Mw). They argued that from a practical point of view, for a magnitude equal to 7.5, the equivalent number of uniform cycles could be taken as equal to 30. Boulanger and Idriss [20] proposed a criterion based on the location of the soil in the Casagrande plasticity chart. In addition, they provided a practical scheme that enables us to predict whether a silty or clayey soil is susceptible to being affected by liquefaction or by cyclic softening. Boulanger and Idriss [21] developed a procedure to evaluate the potential for cyclic softening in clay-like fine-grained soils during earthquakes. Their methodology uses a stress-based approach comparable to the process used in semi-empirical development; the procedure is to assess the factor of safety in saturated silts and clays during earthquakes. Soroush and Soltani-Jigheh [22] suggested that the post-cyclic undrained shear strength and secant deformation modulus of the specimens of mixed clayey soils were comparatively reduced from the pre-cyclic behavior; the reduction level depends on the granular material content, cyclic shear strain level, and effective confining pressure. Patiño [23] investigated the influence of a preexisting stress state on the response of a cohesive soft soil due to cyclic loads. Subramaniam and Banerjee [24], based on experimental results, propose a shear modulus degradation model for cohesive soils as a function of number of loading cycles, plasticity index, cyclic shear strain, over-consolidation ratio, and loading frequency. Tsai et al. [25] proposed a simplified procedure to evaluate cyclic softening that may be expected in saturated clays during earthquakes. Ali et al. [26] investigated the cyclic resistance of silt and sandy silt soils; they found that the loss of shear resistance and the liquefaction occurred at excess pore water pressure ratios (ru) between 0.6 and 0.7 associated with cumulative cyclic shear strains of 4% to 7%. Ukgie et al. [27], through a series of undrained cyclic triaxial tests performed on sand-clay mixtures, studied the influence of the content of fines on the undrained cyclic shear strength of sand-clay mixtures; the authors observed a unique correlation between the cyclic shear strength and global void ratio for different contents of fines. Gu et al. [28] found from the results of unidirectional cyclic triaxials carried out with clay samples from the city of Wenzhou, China, that cyclically confined pressure significantly promotes the accumulation of permanent volumetric deformations. In addition, they observed that the increase in OCR significantly reduces the generation of permanent axial deformations. Hu et al. [29] investigated the effect of the bidirectional shear stress frequency on the undrained clay response from Wenzhou, China, subjected to multidirectional cyclic shear stress tests. Based on laboratory tests, these authors proposed an empirical relation that correlates the shear stress frequency with the number of cycles needed to reach failure. Cheng et al. [30], based on a series of cyclic triaxial tests, investigated the undrained cyclic behavior of peaty organic soil in the long term. The results of the investigation indicated that this type of soil slightly affects the development of permanent axial deformations, which is due to the highly decomposed and often amorphous organic components in the peaty organic soil. Wang et al. [31] carried out a series of dynamic triaxial tests with silty clay from the Port of Yantai in China to study the post-cyclic shear behavior of reconstituted marine silty clay with different degrees of reconsolidation. The authors found that after the cyclic phase, the full reconsolidation enhanced the post-cyclic shear strength. Qian et al. [32] studied the effects of OCR on monotonic and cyclic behavior of reconstituted Shanghai silty clay based on the results of a series of monotonic and cyclic undrained triaxial tests. The authors found that as the degree of over-consolidation increased, the cyclic permanent deformations decreased. Finally, it is worth highlighting the need for exhaustive laboratory tests to obtain stress-strain response; thus, triaxial test results from the Asian Institute of Technology and cyclic undrained triaxial data from Chulalongkorn University were employed to establish the soil parameters for an approximation of the incremental stress-strain response of a model for Bangkok Clay [33].
Except for some research, there are very few cases in the specialized literature in which the dynamic behavior of cohesive soils subjected to the combinations of stresses was studied. In other words, only laboratory tests were carried out without initial shear stress.
The objective of this paper is to analyze the shear strains of a soft cohesive soil subjected to cyclic shear loading under different initial load conditions. The research includes an extensive experimental program with 139 cyclic simple shear tests and the methodology for obtaining empirical relations to estimate the cyclic and permanent shear strains.
2. Description of the Soil Tested
The test samples used during the experimental phase of this research were extracted from near the mouth of the Llobregat River on the Mediterranean Coast. The deposit is part of the Llobregat Delta (Figure 2) that has an alluvial origin from the recent Quaternary and more precisely from the Holocenic era.
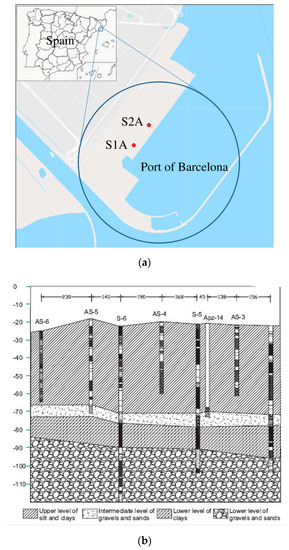
Figure 2.
(a) Geographic location of the deposit where the samples were extracted and location of borings S1A and S2A drilled from the deck of Prat quay; (b) stratigraphic profile.
In general, the Llobregat delta consists of intercalations of clays, silts, sandy silts, and fine sands that are on top of a stratum of gravel and sands with a variable thickness between 5 and 10 m.
According to Alonso et al. [34], the stratigraphic profile of an area near the Prat pier is as follows:
- Stratum 1. Silt and clays of variable color between brown and gray, with dark tones when the content of organic matter is in higher levels. At the top of the stratum are intercalations of sands and sandy silt. The thickness of this stratum is close to 50 m.
- Stratum 2. Gravel and sands with some presence of silt. The thickness of this stratum is about 7 m.
- Stratum 3. Clays with properties similar to those of stratum 1 but with higher density. The maximum thickness of this stratum is 14 m.
- Stratum 4. Gravel and sands with clay inter-stratifications. Its thickness exceeds 40 m.
3. Description of the Equipment Used
The tests were carried out on the cyclic simple shear equipment manufactured by the Wykeham Farrance Company of England, which is doubly servo-controlled; full description can be found in [35]. Figure 3 shows a line drawing of the application mechanism of the axial and tangential loads.
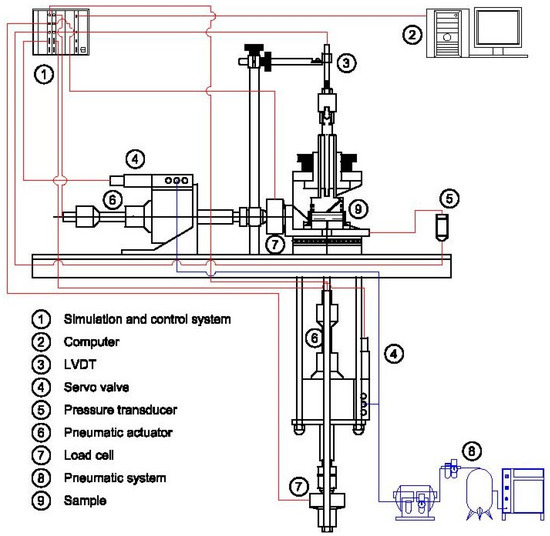
Figure 3.
Scheme of the mechanism for the application of axial and tangential loads.
A brief description of the cyclic simple shear equipment used is as follows:
- The equipment functions with pneumatic action and requires an air supply system that guarantees at least a working pressure equal to 800 kPa.
- The application of axial and tangential loads is carried out by two actuators and two digitally controlled servo-valves. The capacity of the actuators is 5 kN and the maximum working frequency of the servo-valves is equal to 70 Hz.
- To measure axial and tangential loads, device is equipped with two load cells of 5 kN capacity and 1.2 N precision. For the control and registration of axial and tangential deformations, the equipment has three linear variable differential transformers (LVDTs); two interiors, installed inside the actuators and one outside, located above the axial load frame.
- The simulation, control, and capture of data are done by a panel connected to a computer via USB. The data capture module has 13 input 10 V channels with an acquisition resolution equal to 20 bits and a speed of 5 kHz. The control module has two channels: one for the vertical load actuator and the other for the tangential load actuator.
- The control panel computer assembly controls the servo valves that apply the load with the preset speed, magnitude, and wave type and simultaneously captures the information supplied by the load cells and LVDTs.
- The equipment can test under undrained conditions (constant volume) and drained conditions (constant axial load).
- The dimensions of the samples are 70 mm in diameter and 19 mm in height. To keep the diameter of the specimen constant during testing, it is confined by a series of sliding rings.
4. Experimental Program
All the tests were carried out with samples from the subsoil of the Port of Barcelona, in particular with those obtained from the S1A and S2A boring locations as indicated in Figure 2. These borings were drilled at the Port of Barcelona from the deck of Prat quay.
The experimental phase was directed, among other aspects, to study the deformations of a cohesive soil subjected to the stress combinations indicated in Table 1, which contains the number of tests carried out for each combination. In Table 1, (τo) corresponds to the shear stress that is applied statically, prior to the cyclic simple shear stage, (σ′ov) to the effective consolidation stress, and (τc) to the cyclical stress.

Table 1.
Number of tests for each combinations of stresses with which the cyclic simple shear tests were performed.
In Table 1, the column with τo/σ′ov = 0 corresponds to the stress states indicated with No. 1 in Figure 1; that is, they are cases in which prior to the dynamic request (τc), the monotonic shear stress (τo) is null. The remaining columns correspond to the stress states indicated with No. 3 in Figure 1.
The investigation focused on the evaluation of the deformations of a soft cohesive soil subjected to combinations of monotonic and cyclic shear stresses close to static failure. For this, as can be seen in Table 1, tests were carried out with 15 different stress configurations.
4.1. Sample Handling
A total of 29 undisturbed samples taken with a “Shelby” tube were sent to the Geotechnical Laboratory of the Escuela de Ingenieros de Caminos, Canales y Puertos, de la Universidad Politécnica de Madrid. They were stored in a temperature- and humidity-controlled chamber.
Although commercial extractors are usually used to extract the samples from the “Shelby” tubes, in this particular case, this type of equipment was not used, because the pressure applied during the extraction process compresses the samples significantly and consequently alters them.
To avoid the alteration caused by the traditional process of extracting the samples from the “Shelby” tubes, a pipe cutter and a pipe press were used. This means that samples can be cut to the necessary height depending on the type of test.
4.2. Identification and Classification Tests
The type and number of identification and classification tests carried out during the course of this research are as follows: (a) natural unit weight (154), (b) natural moisture (154), (c) content of fines D < 80 μ (154), (d) content of fines D < 2 μ (14), (e) consistency limits (39), and specific gravity (36). In addition, 13 tests are carried out to establish the mineralogical content of the samples.
4.3. Monotonic Simple Shear
In the investigation carried out by Patiño [23], a total of 20 monotonic simple shear tests were carried out. It is pointed at the empirical relation τmax ≈ 0.3∙σ′ov proposed by Martínez et al. [2] that relates to the monotonic strength (τmax) and the effective consolidation stress “in situ” (σ′ov).
4.4. Cyclic Simple Shear
Ideally, the same number of tests should have been carried out for each of the combinations given in Table 1. This was not possible because the number of specimens that could be tested depends on the length of the recovered sample, which is normal in any exploration campaign, as it is not constant and the recovery percentage is not always equal to 100%. Finally, the number of tests made for each of the combinations are given in Table 1.
4.5. General Conditions of the Tests
To remove any factors that might have additional influence on the combination of static and cyclic stresses in the behavior of the soil, the following conditions were set for all the tests:
- Undisturbed samples.
- Specimens with 7 cm diameter and 1.91 cm height.
- Consolidation stress equal to the effective consolidation stress “in situ” (σ′ov). Since the samples tested were extracted by drilling on the port caissons of the Prat dock, the effective consolidation stress, applied on the samples, was estimated by the following expression:where σ′ovz is the effective consolidation stress “in situ” by own soil weight, Δσ′z is the increase in effective stress for port caisson action, and z the depth at which the sample was taken.
- Undrained conditions and evaluation of the generated pore water pressure. According to the criteria of Bjerrum and Landva [36], simple shear tests at constant volume are equivalent to undrained tests, and the change in vertical stress applied to the sample is equivalent to the change in pore water pressure, which would be generated within a sample subjected to simple shear test with restricted drainage and constant axial stress. This was verified by Bjerrum and Landva [35] by a really undrained test in which they measured the pore water pressure generated at the base of the specimen.
- End of the test for permanent shear strain (γp) equal to 15%, or cyclic shear strain (γc) equal to 15%, or number of cycles (N) equal to 1300, or evaluated pore pressure equal to 95% of the effective consolidation stress.
- Sinusoidal wave with amplitude equal to the cyclic stress (+/− τc) and period equal to 10 s. A period equal to 10 s was chosen so that the results of this investigation could eventually be used in design previous stages related to port structures in areas near the site where the samples were extracted, that is, near the Prat pier.
- Controlled deformation during the monotonic stage. The tangential deformation rate was equal to 0.015 mm per minute, or equal to 4% per hour.
5. Interpretation of Results
The evaluation and interpretation of the information was based on the results obtained through classification tests and cyclic simple shear tests.
All tests were carried out with samples of soft cohesive deposit, extracted from the subsoil of the Port of Barcelona.
5.1. Deposit Identification and Classification
The samples used for the experiments were collected between 30 and 53 m below sea level. They were constituted by very thin intercalation of clayey silt clays of medium to soft consistency and somewhat organics. These samples had a variable color between dark brown and gray. Some were intercalations of fine sand, with varying thicknesses between 5 and 10 cm in a micaceous environment.
Given the placement of the samples in the plasticity chart (Figure 4), these can be considered as silty clays with low plasticity.
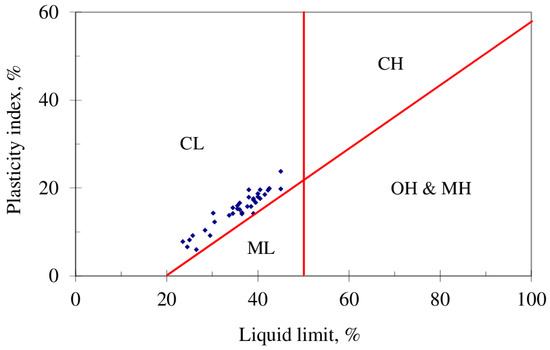
Figure 4.
Location of the limits of consistency in the plasticity chart.
Natural unit weight, natural moisture, and the percentage of fines relative to depth do not have a clear trend of variation, since their distribution is erratic. However, as can be seen in Table 2, the values are within very narrow ranges.

Table 2.
Summary of index properties.
The index properties of the samples tested are included in Table 2.
The mineralogical content evaluated by 13 tests is given in Table 3.

Table 3.
Summary of mineralogical content.
5.2. Monotonic Simple Shear
Figure 5 shows an example of the typical behavior of all the samples tested (20). The shear stress reaches a peak with very large shear strain that varies from 12% to 22%.
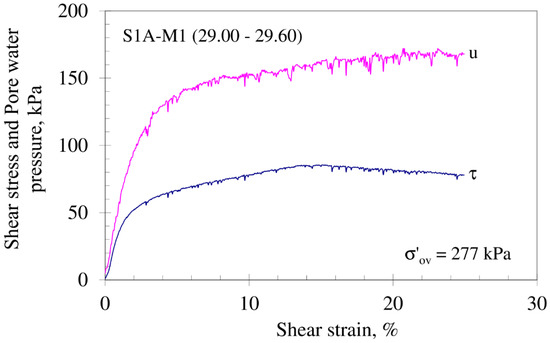
Figure 5.
Variation of the shear stress (τ) and pore water pressure (u), as a function of the monotonic shear strain (γm).
The stress-strain behavior is typically plastic. The pore water pressure generated during failure stage was, in all cases, positive. This indicates a contractive behavior that demonstrates the presence of a deposit with a low degree of preconsolidation or normally consolidated.
For the case of the cohesive soil studied, the maximum stress develops for very large strains; therefore, this value could be inadmissible for a certain type of structure. It is usual to approximate the maximum shear stress of soils using expressions such as the following:
where τmax is the monotonic strength developed, σ′ov is the in situ effective vertical stress, and T is an empirical constant. In this case, the variation trend of T as a function of the monotonic shear strain (γm) is shown in Figure 6 and therefore, the following expression can be obtained:
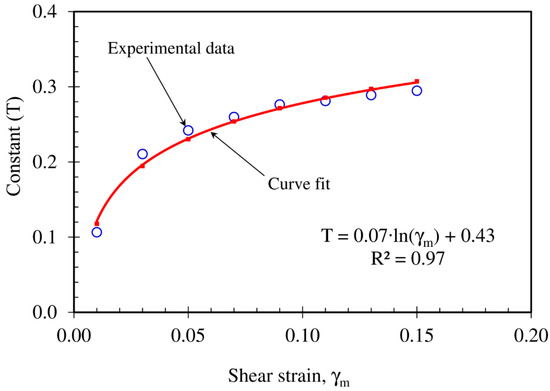
Figure 6.
Variation trend of T as a function of the monotonic shear strain (γm).
In the case of cohesive soils, it may be on the side of insecurity to define the resistance parameters c′ and ϕ corresponding to the maximum shear stress developed; therefore, it would be more convenient to evaluate them using expressions such as those included in Figure 7, which, from a practical point of view, can be incorporated into the numerical simulation codes.
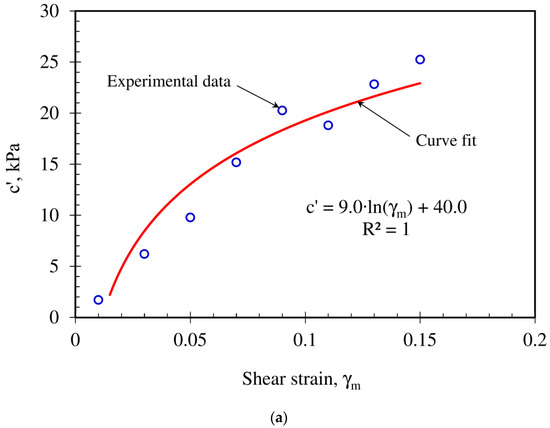
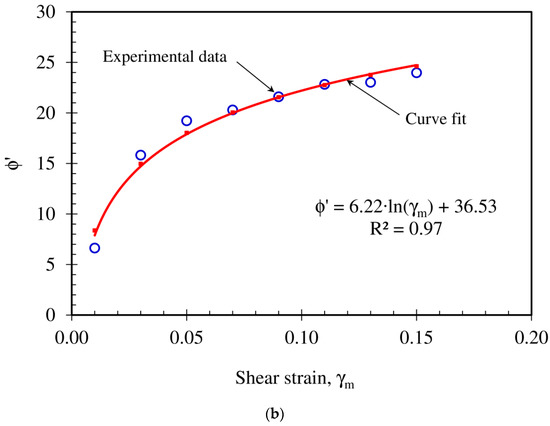
Figure 7.
(a) Variation trend of c′, as a function of the monotonic shear strain (γm); (b) variation trend of ϕ′, as a function of the monotonic shear strain (γm).
5.3. Cyclic Simple Shear
The information included in the present paper is part of the information collected through an investigation carried out by Patiño [23]. Thus, the influence of the combination of monotonic (τo) and cyclic (τc) shear stresses in the evaluation of dynamic parameters of a cohesive soil, such as the stiffness modulus, damping, cyclic strains (γc), permanent strains (γp), and pore water pressure generation, was studied.
Taking into account the above, the evaluation and interpretation of the results obtained by means of the cyclic simple shear tests focused on the cyclic and permanent strains that a soft cohesive soil develop when subjected to monotonic and cyclic stresses.
5.4. Cyclic and Permanent Strain
5.4.1. Definition of Terms
Some terms used in the present paper are given in Figure 8 and described below:
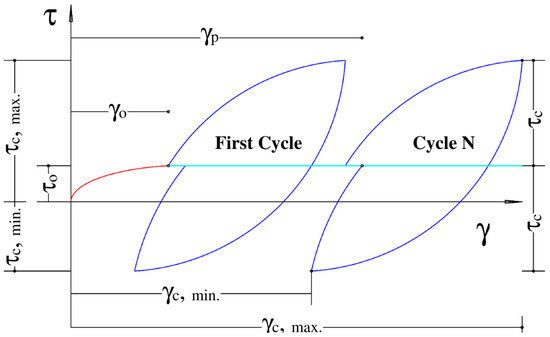
Figure 8.
Stress-strain definitions.
- Shear strain (γ) is the unit angular deformation.
- Permanent shear strain (γp) is the accumulated unit angular deformation at the end of each cycle.
- Monotonic shear strain (γ0) is the unit angular deformation at the end of the phase of monotonic simple shear, before the phase of dynamic simple shear.
- Monotonic shear stress (τo) is the shear stress at the end of a monotonic simple shear test.
- Cyclic strain (γc) is the “amplitude” of the unit angular deformation in a cycle: (γc,max–γc,min)/2; with γc,max as the maximum cyclic strain and γc,min as the minimum cyclic strain of the cycle.
- (τc) is the cyclic shear, so that τc,max = τo + τc, which is the maximum shear stress, and τc,min = τo − τc is the minimum shear stress.
5.4.2. Qualitative Evaluation
The qualitative analysis of the results is carried out based on the information included in Figure 9, focusing on the stress-strain behavior, cyclic strains and number of cycles, permanent strains and number of cycles, and the influence of the monotonic shear stress (τo) applied previously to the cyclic shear stress (τc) in the generation of cyclic (γc) and permanent strains (γp). Table 1 is represented within this Figure 9, indicating with a letter from A to L the different types of stress-strain curve obtained in the tests for each combination of static and cyclic shear stress. Each of the different curves is presented on the outside of the Table.
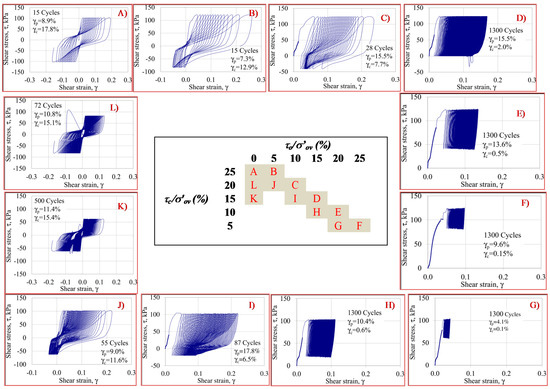
Figure 9.
Comparison of typical stress-strain behavior for different combinations of normalized initial monotonic shear stress and different normalized cyclic shear stress. The results correspond to the tests performed with sample S1A-10 indicated in Table 1. (A) τo/σ′ov = 0% and τc/σ′ov = 25%; (B) τo/σ′ov = 5% and τc/σ′ov = 25%; (C) τo/σ′ov = 10% and τc/σ′ov = 20%; (D) τo/σ′ov = 15% and τc/σ′ov = 15%; (E) τo/σ′ov = 20% and τc/σ′ov = 10%; (F) τo/σ′ov = 25% and τc/σ′ov = 5%; (G) τo/σ′ov = 20% and τc/σ′ov = 5%; (H) τo/σ′ov = 15% and τc/σ′ov = 10%; (I) τo/σ′ov = 10% and τc/σ′ov = 15%; (J) τo/σ′ov = 5% and τc/σ′ov = 20%; (K) τo/σ′ov = 0% and τc/σ′ov = 15%; (L) τo/σ′ov = 0% and τc/σ′ov = 20%.
The analysis was performed by comparing the behavior of the samples that meet the following conditions:
- Same normalized initial monotonic shear stress (τo/σ′ov) and different normalized cyclic stress (τc/τ′ov).
- Same normalized cyclic stress (τc/σ′ov) and different initial normalized monotonic shear stress (τo/σ′ov).
- Same sum of the normalized initial monotonic shear stress (τo/σ′ov) plus the normalized cyclic shear stress (τc/σ′ov). In particular, for cases where the sum is equal to 25% and 30%. The sum equal to 30% corresponds approximately to the monotonic tests in which τo/σ′ov = τmax/σ′ov ≈ 30%.
From the information included in Figure 9, related to the stress-strain behavior, the following considerations were deduced:
- For a constant value of τo/σ′ov and of the number of cycles and a different τc/σ′ov, the cyclic (γc) and permanent (γp) strains increase as τc/σ′ov is higher.
- For a constant value of τo/σ′ov and γc, and with a different τc/σ′ov, the number of cycles decreases as τc/σ′ov increases.
- For a constant value of τc/σ′ov and a different τo/σ′ov, the loops of the cycles gradually change their geometry formed by “s” and “s inverted”, for values of τo/σ′ov lower than 10%, to a geometry formed by a concave and a convex curve, for values of τo/σ′ov greater than 10%.
- For a constant value of τc/σ′ov and a different τo/σ′ov, the symmetry of the loops with respect to the origin of the vertical axis is broken; this occurs to the extent that τo/σ′ov increases.
- For a constant value of τc/σ′ov and τo/σ′ov + τc/σ′ov, and a different τc/σ′ov, the relationship between permanent and cyclic strains increased significantly as τo/σ′ov increased. For example, for τo/σ′ov = 5% and τc/σ′ov = 25%, γp/γc = 0.57; while, for τo/σ′ov = 25% and τc/σ′ov = 5%, γp/γc = 64.
- In all cases, when τo/σ′ov = 0 and τo/σ′ov = 5%, at the same number of cycles, cyclic strains are greater than permanent strains.
- According to experimental evidence, there is a threshold value of τo/σ′ov between 5% and 10% for which cyclic strains begin to be less than permanent ones.
- When τc/σ′ov > 5%, at the same sum of τc/σ′ov + τo/σ′ov and with different values of τc/σ′ov and τo/σ′ov, both the cyclic and permanent strains tend to decrease as τo/σ′ov increases.
- Experimental evidence, at least with this particular soil, show that with the sum of τc/σ′ov + τo/σ′ov and with different combinations of τc/σ′ov and τo/σ′ov, the stress-strain behavior changes radically. If the combination (((τo/σ′ov = 5%) + τc/σ′ov = 25%) = 30%) is compared with the combination ((τo/σ′ov = 25%) + (τc/σ′ov = 5%) = 30%). In the first case, 15 cycles are required for the soil to develop large cyclic strains γc = 13% and permanent strains γp = 7% and therefore “sudden failure” occurs, Martínez et al. [2]. In the second case, after 1300 cycles, the cyclic strains γc were barely equal to 0.15% and the permanent strains γp = 9.6%.
5.4.3. Quantitative Evaluation
Below is included a detailed analysis of the trends of variation of cyclic strains as a function of permanent strains and the number of cycles. The information related to the strains γo, γp, and γc and N, at the end of each and every one of the 139 tests carried out, is included in Table 4, Table 5, Table 6, Table 7, Table 8 and Table 9.

Table 4.
Results of cyclic simple shear test with τo/σ′ov = 0.

Table 5.
Results of cyclic simple shear test with τo/σ′ov = 5%.

Table 6.
Results of cyclic simple shear test with τo/σ′ov = 10%.

Table 7.
Results of cyclic simple shear test with τo/σ′ov = 15%.

Table 8.
Results of cyclic simple shear test with τo/σ′ov = 20%.

Table 9.
Results of cyclic simple shear test with τo/σ′ov = 25%.
Figure 10 contains the results of the cyclic simple shear tests in which τo/σ′ov = 0%, and τc/σ′ov are variable between 15% and 25%, which are presented in the Table 10. Figure 10 also shows that both cyclic and permanent strains are of comparable magnitudes. However, for cyclic strains less than 10%, these are somewhat larger than permanent strains, and for cyclic strains greater than 10%, these are somewhat smaller than permanent.
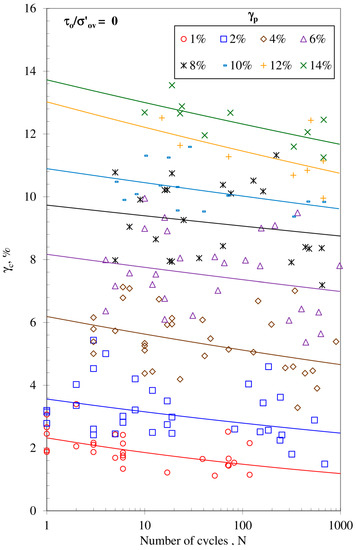
Figure 10.
Variation of the cyclic shear strain as a function of the number of cycles and of the permanent shear strain corresponding to τo/σ′ov = 0.

Table 10.
Values of γp and γc as a function of N and τo/σ′ov.
Figure 11 was obtained by plotting vertical sections in Figure 10 through abscissa N = 1, 10, 100, and 1000. For modeling purposes, Figure 11 shows the cyclic and permanent strains for each number of cycles (N) and can be approximately correlated by means of a power function type (4).
where: γc, cyclic strain (%), γp, permanent strain (%).
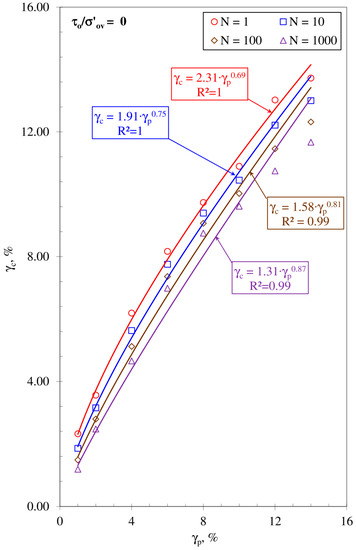
Figure 11.
Vertical section in the graph of Figure 10 for values of N equal to 1, 10, 100, and 1000, corresponding to τo/σ′ov = 0.
The constants A and B can be expressed in terms of N by a power function (5) and a logarithmic function (6), as shown in Figure 12.
where D, E, F, and H are empirical constants.
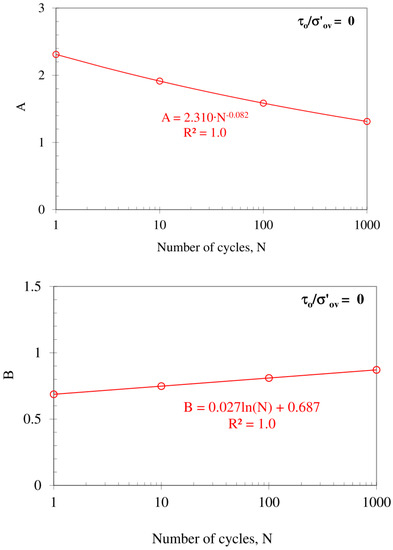
Figure 12.
(A) Empirical constant A as a function of the cycle’s number, for τo/σ′ov = 0; (B) empirical constant B as a function of the cycle’s number, for τo/σ′ov = 0.
The empirical relation (7) is obtained by replacing (5) and (6) in (4), which expresses the cyclic strains γc as a function of the permanent strains γp and the number of cycles N.
The empirical constants D, E, F, and H of function (7), see Table 11, were obtained in a similar way with the results of the cyclic simple shear tests in which τo/σ′ov are equal to 5%, 10%, 15%, and 20% and τc/σ′ov are variable between 10% and 25%, see Table 4.

Table 11.
Values of the constants D, E, F, and H of the empirical relation (7) for different normalized monotonic stress τo/σ′ov in the particular case of this investigation.
In Figure 13a for τo/σ′ov = 0, and in Figure 13b for τo/σ′ov = 5%, it can be seen that the empirical relation (7), with the constants of Table 11, reproduces very well the experimental data obtained from cyclic simple shear tests done for the present research.
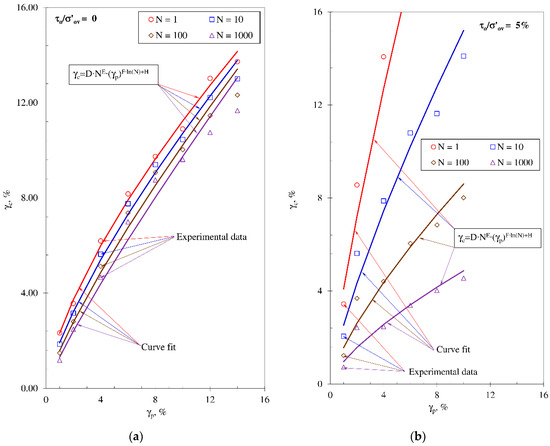
Figure 13.
Comparison between experimental results and adjustments obtained by empirical relation (7). Variation of the cyclic shear strain as a function of the permanent shear strain and of the number of cycles corresponding to τo/σ′ov = 0 (a) and τo/σ′ov = 5% (b).
6. Conclusions
The conclusions are based on the results obtained with characterization tests and 139 cyclic simple shear tests. All the tests were carried out with samples obtained from the Port of Barcelona area. The results are, therefore, indicative of the behavior of cohesive soils located in other geotechnical or geographical environments. Based on the analysis of the results, the main conclusions are the following:
- Given the placing of the consistency limits of all the samples on the plasticity chart, the deposit was classified as silty clays of low plasticity and low compressibility. From the results of the sedimentation tests (content of fines), it would be equally valid to classify the deposit as clayey silt.
- Both static and cyclic shear stress independently affect the behavior of soils, but even more so the combination of both factors.
- The monotonic shear stresses (τo) applied before cyclic stresses (τc), control the generation of cyclic strains (γc) and permanent strains (γp).
- When τo/σ′ov ≤ 5%, at the same number of cycles, cyclic strains are greater than permanent strains.
- There is a threshold value of τo/σ′ov between 5% and 10% for which the cyclic strains begin to be smaller than the permanent ones.
- Reports in the literature suggest that if the sum of τo plus τc is close to the static strength τmax., the strains will increase cycle by cycle until there is a sudden failure due to cyclic loading, which is characterized by large strains. In the particular case of the present investigation, there was the case when although τo/σ′ov + τc/σ′ov ≈ τmax/σ′ov, sudden failure did not occur and the deformations after 1300 cycles were γp = 3.9% and γc = 0.1%.
- It can, therefore, be claimed that regardless of the magnitude of τo/σ′ov, it is the magnitude of τc/σ′ov that is responsible for “sudden failure”, Martínez et al. [2]; with a small number of cycles (N < 5), large cyclic and permanent strains are thus developed (γc and/or γp > 15%).
- For modeling purposes and for the soil studied in the present research, it is possible to obtain simple empirical relations that approximately enable cyclic strains γc to be correlated with the permanent strains γp and the number of cycles N. In general, for other types of soil, the proposed methodology is applicable, although new adjustment constants are necessary.
Author Contributions
Conceptualization, H.P.; methodology, H.P.; validation, R.G.; writing—original draft preparation, H.P.; writing—review and editing, H.P., R.G.; supervision, C.O.M. All authors have read and agreed to the published version of the manuscript.
Funding
This research was funded by Universidad Politécnica de Madrid.
Acknowledgments
The research described in this paper was financially supported by the Universidad Politécnica de Madrid from the grant with reference VMENTORUPM20RAGA of the university’s own program to carry out research and innovation projects. In addition, the authors want to acknowledge the José Entrecanales Ibarra Foundation, for the donation of the necessary equipment to carry out this investigation, mainly by the cyclic simple shear equipment; to Ports of the State of Spain, for the supply of all the samples used to carry out the laboratory tests and to Antonio Soriano Peña (R.I.P.) for his unconditional support for research at the UPM.
Conflicts of Interest
The authors declare no conflict of interest.
References
- Patiño, H.; Soriano, A.; González, J. Failure of a soft cohesive soil subjected to combined static and cyclic loading. Soils Found. 2013, 53, 910–922. [Google Scholar] [CrossRef]
- Martínez, E.; Patiño, H.; Galindo, R. Evaluation of the risk of sudden failure of a cohesive soil subjected to cyclic loading. Soil Dyn. Earthq. Eng. 2017, 92, 419–432. [Google Scholar] [CrossRef]
- Seed, H.B.; Chan, C.K. Clay strength under earthquake loading conditions. J. Soil Mech. Found. 1966, 92, 53–78. [Google Scholar]
- Hardin, B.O.; Black, W.L. Vibration modulus of normally consolidated clay. J. Soil Mech. Found. Div. ASCE. 1968, 94, 353–369. [Google Scholar]
- Andersen, K.H. Repeated loading on clay. Summary and interpretation of test results. Res. Proj. NGI. 1975. Internal Report 74037-9. [Google Scholar]
- Idriss, I.M.; Dobry, R.; Singh, R.D. Nonlinear behaviour of soft clays during cyclic loading. J. Geotech. Eng. ASCE 1978, 104, 1427–1447. [Google Scholar]
- Koutsoftas, D.C. Effect of cyclic loads on undrained strength of two marine Clays. J. Geotech. Eng. ASCE 1978, 104, 609–620. [Google Scholar]
- Koutsoftas, D.C.; Fisher, J.A. Dynamic properties of two marine clays. J. Geotech. Eng. ASCE 1980, 106, 645–657. [Google Scholar] [CrossRef]
- Matsui, T.; Ohara, H.; Ito, T. Cyclic Stress-Strain History and Shear Characteristics of Clay. J. Geotech. Eng. Div. ASCE. 1980, 104, 1101–1120. [Google Scholar]
- Kokusho, T.; Yoshida, Y.; Esashi, Y. Dynamic Properties of Soft Clay for Wide Strain range. Soil Found. 1982, 22, 1–18. [Google Scholar] [CrossRef]
- Ansal, A.; Erken, A. Undrained behavior of clay under cyclic shear stresses. J. Geotech. Eng. 1989, 115, 968–983. [Google Scholar] [CrossRef]
- Atkinson, J.H.; Richardson, D.; Stallebrass, S.E. Effect of recent stress history on the stiffness of overconsolidated soil. Geotechnique 1990, 40, 531–540. [Google Scholar] [CrossRef]
- Andersen, K.H.; Hoeg, K. Deformation of Soils and Displacements of Structures subjected to combined static and cyclic loads. In Proceedings of the X ECSMFE, Firenze, Italy, 26–30 May 1991; pp. 1147–1158. [Google Scholar]
- Finno, R.J.; Chung, C.K. Stress-strain strength responses of compressible Chicago glacial clays. J. Geotech. Eng. 1992, 118, 1607–1625. [Google Scholar] [CrossRef]
- Hyodo, M.; Yamamoto, Y.; Sugiyama, M. Undrained cyclic shear behavior of normally consolidated clay subjected to initial static shear stress. Soils Found. 1994, 34, 1–11. [Google Scholar] [CrossRef]
- Jovicic, V.; Coop, M.R. The measurement of stiffness anisotropy in clays with bender element tests in the triaxial apparatus. Geotech. Test. J. 1998, 21, 3–10. [Google Scholar]
- Lings, M.L.; Pennington, D.S.; Nash, D.F.T. Anisotropic stiffness parameters and their measurement in a stiff natural clay. Geotechnique 2000, 50, 109–125. [Google Scholar] [CrossRef]
- Moses, G.G.; Rao, S.N. Degradation in cemented marine clay subjected to cyclic compressive loading. Mar. Georesour. Geotechnol. 2003, 21, 37–62. [Google Scholar] [CrossRef]
- Boulanger, R.W.; Idriss, I.M. Evaluating the Potential for Liquefaction or Cyclic Failure of Silt Sand Clays; University of California: Davis, CA, USA, 2004; p. 131. [Google Scholar]
- Boulanger, R.W.; Idriss, I.M. Liquefaction susceptibility criteria for silts and clay. J. Geotech. Geoenviron. Eng. 2006, 132, 1413–1425. [Google Scholar] [CrossRef]
- Boulanger, R.W.; Idriss, I.M. Evaluation of cyclic softening in silts and clays. J. Geotech. Geoenviron. Eng. 2007, 133, 641–652. [Google Scholar] [CrossRef]
- Soroush, A.; Soltani-Jigheh, H. Pre- and post-cyclic behavior of mixed clayey soils. Can. Geotech. J. 2009, 46, 115–128. [Google Scholar] [CrossRef]
- Patiño, H. Influencia de la Combinación de Tensiones Tangenciales Estáticas y Cíclicas en la Evaluación de Parámetros Dinámicos de un Suelo Cohesivo. Ph.D. Thesis, Universidad Politécnica de Madrid, Madrid, Spain, 2009. [Google Scholar]
- Subramaniam, P.; Banerjee, S. Shear modulus degradation model for cohesive soils. Soil Dyn. Earthq. Eng. 2013, 53, 210–216. [Google Scholar] [CrossRef]
- Tsai, C.; Mejia, L.H.; Meymand, P. A strain-based procedure to estimate strength softening in saturated clays during earthquakes. Soil Dyn. Earthq. Eng. 2014, 66, 191–198. [Google Scholar] [CrossRef]
- El Takch, A.; Sadrekarimi, A.; El Naggar, H. Cyclic resistance and liquefaction behavior of silt and sandy silt soils. Soil Dyn. Earthq. Eng. 2016, 83, 98–109. [Google Scholar] [CrossRef]
- Ukgie, K.; Dongwook, K.; Zhuang, L. Influence of fines content on the undrained cyclic shear strength of sand–clay mixtures. Soil Dyn. Earthq. Eng. 2016, 83, 124–134. [Google Scholar]
- Gu, C.; Wang, J.; Cai, Y.; Sun, L.; Wang, P.; Dong, Q.Y. Deformation characteristics of overconsolidated clay sheared under constant and variable confining pressure. Soils Found. 2016, 56, 427–439. [Google Scholar] [CrossRef]
- Hu, X.; Zhang, Y.; Guo, L.; Wang, J.; Cai, Y.; Fu, H. Cyclic behavior of saturated soft clay under stress path with bidirectional shear stresses. Soil Dyn. Earthq. Eng. 2018, 104, 319–328. [Google Scholar] [CrossRef]
- Cheng, C.; Zhou, Z.; Kong, L.; Zhang, X.; Yin, S. Undrained dynamic behaviour of peaty organic soil under long-term cyclic loading, Part I: Experimental investigation. Soil Dyn. Earthq. Eng. 2018, 107, 279–291. [Google Scholar] [CrossRef]
- Wang, Y.; Lei, J.; Wang, Y.; Lia, S. Post-cyclic shear behavior of reconstituted marine silty clay with different degrees of reconsolidation. Soil Dyn. Earthq. Eng. 2019, 116, 530–540. [Google Scholar] [CrossRef]
- Qian, J.; Li, S.; Zhang, J.; Jiang, J.; Wang, Q. Effects of OCR on monotonic and cyclic behavior of reconstituted Shanghai silty clay. Soil Dyn. Earthq. Eng. 2019, 118, 111–119. [Google Scholar] [CrossRef]
- Likitlersuang, S.; Houlsby, G.T. Predictions of a continuous hyperplasticity model for Bangkok Clay. Geomech. Geoeng. 2007, 2, 147–157. [Google Scholar] [CrossRef]
- Alonso, E.; Gens, A.; Madrid, R. The soft foundation soils of new breakwaters at the Port of Barcelona. In Proceedings of the 14th European Conference on Soil Mechanics and Geotechnical Engineering, Madrid, Spain, 24–27 September 2007. [Google Scholar]
- Controls-group.com. 2020. Available online: http://www.controls-group.com/eng/soil-mechanics-testing-equipment/cyclic-simple-shear.php (accessed on 20 November 2020).
- Bjerrum, L.; Landva, A. Direct Simple-Shear Test on a Norwegian Quick Clay. Géotechnique 1966, 16, 1–20. [Google Scholar] [CrossRef]
Publisher’s Note: MDPI stays neutral with regard to jurisdictional claims in published maps and institutional affiliations. |
© 2020 by the authors. Licensee MDPI, Basel, Switzerland. This article is an open access article distributed under the terms and conditions of the Creative Commons Attribution (CC BY) license (http://creativecommons.org/licenses/by/4.0/).