Abstract
As the demand for electrical energy increases worldwide, the amounts of harmful gases in the atmosphere, such as carbon dioxide released by burning fossil fuel, are continuously increasing. As a result, the interest in renewable energy resources has been growing. However, renewable energies have fluctuating output characteristics according to local conditions such as the natural environment and geographical characteristics, which is a major factor deteriorating output quality. Recently, energy storage systems (ESSs) have been actively studied as a solution to this problem. A redox flow battery (RFB) is a system in which an active material dissolved in an electrolyte is oxidized/reduced to charge/discharge. A RFB mainly consists of an electrolyte tank, which determines the capacity, and a cell stack, which determines the output. As these components can be independently controlled, a RFB provides the advantages of a large capacity and a long lifespan. In this study, a new flow channel was designed to maximize the reaction area and reduce the pump loss to improve RFB performance. Computational fluid dynamics (CFD) and visualization experiments were used to analyze the internal flow characteristics of vanadium redox flow battery (VRFB). Additionally, we used the variability range coefficient and maximum velocity deviation to check if the flow discharged to the electrode was uniform. In the conventional flow frame, the flow discharged to the electrode has a non-uniformity distribution in the left and right, due to the S-shaped path of the inlet channel. In addition, it was confirmed that the outlet area into the electrode was reduced to 50%, resulting in a high pressure drop. To address this problem, we proposed a design that simplified the flow channel, which significantly improved flow uniformity parameters. The maximum velocity deviations for the existing and new flow channels were 11.89% and 54.16%, respectively. In addition, in the entire flow frame for the new flow channel, the pressure drop decreased by 44% as compared with the existing flow channel.
1. Introduction
As the demand for electric energy is rising worldwide, the amounts of harmful gases, such as carbon dioxide, generated from fossil fuels are increasing. Accordingly, the interest in various new and renewable energy sources is growing [1]. The output characteristics of new and renewable energy fluctuate according to location conditions, such as the natural environment and geographic characteristics, which mainly affect the output quality [2]. To solve this problem, energy storage systems (ESSs), which are one of the technologies for storing and supplying new and renewable energy, have attracted considerable attention. ESSs are a stand-alone system that produces, stores, and supplies electricity at the kWh scale. An ESS is divided into mechanical and electrochemical energy storage devices according to the configuration type. An example of a mechanical energy storage device is a non-battery type device that uses pumping-up power generation and compressed air energy storage. In addition, lead-acid batteries, NaS batteries, lithium batteries, and redox flow batteries (RFBs) are a few examples of electrochemical energy storage devices [3,4]. A long cycle life, energy efficiency, and low construction cost are required to build a large capacity ESS using a chemical energy storage device. RFBs are attracting considerable attention as the most suitable devices for this purpose [5]. One of the main characteristics of the RFBs is that they can be used in large-capacity storage devices. In terms of power and energy, the system has a wide operating range, which is suitable for stationary applications where a large amount of stored energy is required [6], for example, energy can be stored during periods of low energy demand and used for periods of high energy demand, regardless of weather conditions [7].
A RFB is a representative ESS that generates or stores energy using the oxidation/reduction reaction between the active materials that constitute the anode and cathode electrolyte, and its output characteristics are determined accordingly. RFBs can be designed for the specific applications because the size of the stack that determines the output and the size of the electrolyte tank that determines the capacity are controlled independently of each other [8]. As the RFB supplies the stored electrolyte through a pump, the shape of the flow channel can affect the system efficiency [9]. Flow channel design is a critical part of the flow battery system development process, and there are two aspects that can be considered to improve the power and efficiency of the RFB.
First, the overall efficiency of the RFB decreases when the electrolyte enters the electrode at an extremely low velocity or when there is reverse flow [10]. This can be solved by maximizing the reaction area by making the flow of the electrolyte uniform through an appropriate flow channel design, thereby improving the output. Second, the power consumption of the pump can be reduced by minimizing the pressure drop using a simplified flow channel [11].
Currently, many chemical species, such as zinc bromine, iron-chromium, bromine polysulfide, and vanadium are employed as RFB redox couples in ESSs [12]. Among them, vanadium with an electromotive force of 1.4 V, provides the advantages of a relatively high energy efficiency and relatively low ion crossover.
Studies for improving the system efficiency of the RFB are as follows: Chen et al. [13] confirmed the flow field of the parallel structure of the flow battery through computational fluid dynamics (CFD) and experiments, and the flow battery performance was calculated according to the flow of the electrolyte. Escudero-González et al. [14,15] defined a formula for evaluating the non-uniformity of electrolyte and proposed a cell design that minimized the non-uniformity by using a commercial code verified by the experimental pressure drop data. Ma et al. [16] analyzed the battery capacity and system efficiency characteristics according to the electrolyte flow rate of a vanadium redox flow battery. Zhu et al. [17] investigated the effect of electrolyte concentration distribution, electrolyte flow rate, electrode compression, and electrode temperature on performance through the COMSOL program. Moreover, Messaggi et al. [18] analyzed the electrolyte distribution in the porous electrode of a vanadium redox flow battery (VRFB) through tests and numerical analysis. Bortolin et al. [19] proposed various performance indicators for the flow distribution and pressure drop of a membrane electrode assembly through computational fluid dynamics (CFD) analysis. However, studies on the improvement of the efficiency of RFBs based on the flow uniformity and pressure drop of the electrolyte in the flow frame are insufficient. In addition, the analysis of internal flow characteristics through experiments and numerical analysis according to the channel type of flow battery is also insufficient.
In this study, the flow characteristics inside the VFRB unit cell were analyzed through flow visualization experiments and CFD. Additionally, the flow characteristics were analyzed for various flow channel shapes to maximize the reaction area and improve the efficiency of the VRFB. The relationship between battery performance and uniformity was analyzed by evaluating the uniformity of internal flow based on a flow uniformity evaluation variable. For this purpose, the commercial code ANSYS fluent was used, and the velocity and pressure fields for the model were calculated and compared.
2. Problem Formulation
2.1. Computational Domain and Boundary Conditions
This study used an existing flow frame, which was composed of vertically symmetric flow channels and electrodes, as shown in Figure 1. Only one side of the unit cell was considered, the size of the unit cell was 392 × 382 × 5 mm, and the size of the electrode was 362 × 260 × 5 mm, which accounted for approximately 63% of the total computational domain. The inlet channel of the flow frame acted as the flow path through which the electrolyte from the manifold was sent to the electrode. The inlet channel was S-shaped, and it contained 90 outlets and guides located at equal intervals to uniformly distribute the electrolyte to the electrode. In terms of the flow direction, the electrolyte entered the electrode through the inlet channel at the bottom and was discharged through the outlet channel at the top, after oxidation and reduction. The outlet channel contained 90 inlets and guides.
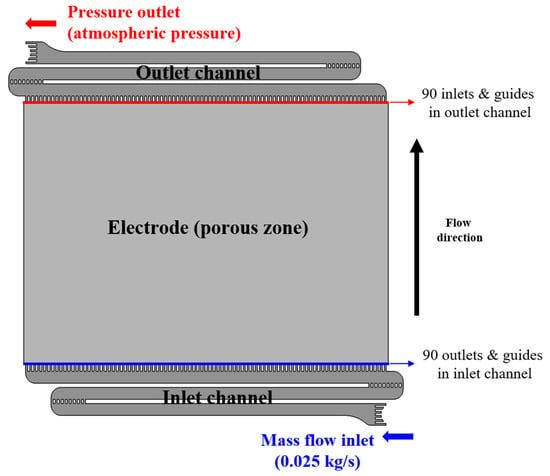
Figure 1.
Computational domain for flow frame of vanadium redox flow battery.
For flow analysis, ANSYS Fluent, a commercial code, was used and the three-dimensional incompressible flow was considered throughout the whole region. In addition, as shown in Figure 2, the Reynolds number was calculated at three locations in the inlet channel, and laminar flow (Re < 2300) was considered based on a Reynold’s number of 537 (the highest value), as shown in Table 1. Since the operating flow rate through the VRFB was 60 L/min for a total of 60 cells, the electrolyte of 1 L/min based on the single cell was used as inlet condition, as shown in Table 2. For the outlet, we used the atmospheric absolute pressure condition. In addition, the non-slip condition was used as the wall condition.

Figure 2.
Locations for Reynolds number calculation.

Table 1.
Reynolds numbers at different locations.

Table 2.
Boundary conditions for numerical analysis.
The flow channel and electrodes were composed of a tetrahedral and hexahedral grid, respectively, based on a hybrid unstructured grid system. As shown in Figure 3 of the grid independence study result, the difference in pressure drop decreases as the cell average size decreases. When the cell average size is less than 0.1, the pressure drop converges to 0.32 bar. Therefore, the analysis was performed based on the average cell size of 0.1 (Figure 4). The number of grids for each channel is 1,677,450.
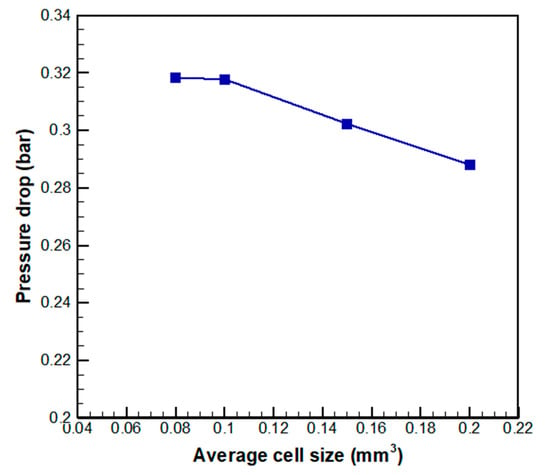
Figure 3.
Grid dependency result for average cell size.

Figure 4.
Grid system according to average mesh volume (at size 0.1 ).
2.2. Model for the Numerical Analysis
The continuity equation and the Navier–Stokes equation were shown in the following Equations (1) and (2):
Here, is density, v is velocity, is static pressure, and is the stress tensor which written as Equation (3) as follows:
Here is the dynamic viscosity coefficient, and is the unit tensor.
The electrode in the VRFB was simulated using the porous media model, as shown in Equation (4) [20]:
The porous media model can be obtained by adding an extinction coefficient () to the existing Navier–Stokes equation. The first term is defined by Darcy’s law, and the second term is the loss of inertia, which represents the pressure drop along the flow direction. Here, is the permeability of the fluid and is the resistance to the loss of inertia in all directions.
In addition, a volume of fluid (VOF) multiphase flow model, which is a type of numerical analysis model, was used to compare the flow characteristics with the results of a flow visualization experiment. The VOF model predicts the behavior of a fluid by tracking the interface of two or more immiscible fluids, and it is given by Equation (5) [21]:
where and are the mass flow rates transferred from phase q to p and phase p to q, respectively. In this model, the equation for the primary phase is not solved, and Equation (6) is established.
2.3. Porous Modeling of the Electrode
The electrode of the VRFB was fabricated from carbon felt material. It can be applied through a porous medium in numerical analysis. Porous media properties can be calculated through pressure drop tests on carbon felt. In order to simplify the electrode, we assume the carbon felt as a porous medium that has the viscosity resistance 1/α and the inertial resistance. Three velocities of the electrolyte (0.05, 0.15, and 0.25 m/s) were used in the experiment. The variation in the pressure drop with velocity is shown in Figure 5. The porous medium permeability and the inertia factor are derived from Equation (7) [20], as shown in Table 3.
where is the viscosity coefficient, is density, and is the thickness of the electrode in the y direction.

Figure 5.
Pressure drop in electrode at various velocities.

Table 3.
Porous medium factors (viscous and inertial resistance).
2.4. Evaluation Variable for Flow Uniformity
The flow uniformity in the electrode is evaluated by using the variability range coefficient (), and maximum velocity deviation () as shown in Equations (8) and (9):
where is the area of the outlets of the inlet channel, is the vertical cross-sectional area of the electrode, and v is the velocity within the electrode or the velocity entering the electrode. The variability range coefficient () is the calculated as the difference between the maximum and minimum velocity of the electrode. It can be seen that the larger the value is, the greater the non-uniformity of the electrolyte discharged into the electrode. The maximum velocity deviation () represents the velocity ratio across the 90 electrode inlets of the flow frame channel.
2.5. Experimental Setup
Flow characteristics were analyzed through a flow visualization experiment and compared with numerical analysis results. A simple experimental device was constructed to observe the flow characteristics, and only the flow rate was measured through a flow meter. For the flow visualization experiment, a single cell was configured with only the symmetry channels and electrode, and the change in flow according to the injection of the electrolyte was observed. In the experimental method, electrolyte was supplied from the tank to the unit cell through a pump, and a flow meter was installed between the pump and the unit cell to fix the flow rate at 1 L/min. The experimental setup was constructed as shown in Figure 6, and the specifications of the devices used for the experiment are listed in Table 4. The density and viscosity of the vanadium solution were 1500 kg/m3 and 0.007 kg/m·s, respectively. In addition, to verify the numerical analysis code for the experiment, flow analysis was performed using the VOF multiphase [21], under the same conditions as those used in the experiment.

Figure 6.
Setup of flow visualization experiment.

Table 4.
Instruments used for the experiment.
3. Results and Discussion
3.1. Flow Characteristics through Flow Visualization Experiment and Numerical Analysis
Figure 7 shows the flow of the electrolyte in the flow visualization experiment. The electrolyte passed through the flow channel, and it was first discharged from the outlets on the right owing to the shape of the flow channel, as shown in Figure 7a. Subsequently, as more electrolyte was added, it was discharged from the outlets on the left and the flow was spread throughout the area, as shown in Figure 7b.

Figure 7.
Results of flow visualization experiment. (a) Flow time t = 3 s; (b) Flow time t = 4 s.
The flow characteristics obtained through numerical analysis are shown in Figure 8. The results of the experiment and numerical analysis were in good agreement. In particular, the flow in the electrode, which was not visualized in the experiment, was initially concentrated at the outlets on the right. The distribution of the electrolyte throughout the electrode became uniform over time (Figure 8a,b).
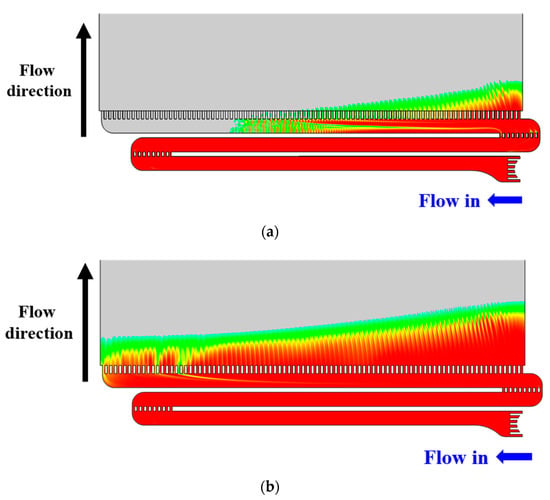
Figure 8.
Volume fraction of vanadium solution (computational fluid dynamics (CFD) results). (a) Flow time t = 3 s; (b) Flow time t = 4 s.
The results of the flow visualization experiment and numerical analysis show that the vertical guides before the final outlets create vertical flow and induce the electrolyte to enter the electrode from the right. As a result, flow may be non-uniform from right to left.
3.2. Internal Flow Characteristics of Conventional VRFB (Numerical Analysis)
For analysis of flow characteristics inside the unit cell, we proceeded with laminar steady-state analysis. In the case of the VOF model, transient analysis was performed to observe the change over time. However, in the case of flow uniformity, steady-state analysis was applied to observe the characteristics after the electrolyte was filled. The internal flow characteristics of the conventional VRFB were analyzed, as shown in Figure 9. The velocity distribution in the entire VRFB is as shown in Figure 9a. The maximum velocity in the channel was 2.3 m/s, and the electrode average velocity was 0.035 m/s. In addition, there were dead zones, where flow was stagnant, close to the curved part of the flow channel, as shown in Figure 9b.

Figure 9.
Velocity distribution in the basic configuration of vanadium redox flow battery. (a) Flow distribution; (b) Velocity vectors in the curved section of the S-shaped inlet channel.
Dead zones were formed at each outlet as flow changed from horizontal to vertical, as shown in Figure 10a. In addition, dead zones were formed owing to vena contracta [22] as the flow in the channel changes vertically. The vena contracta is the reduction in the area/diameter of a fluid jet after it emerges from a circular aperture in a pressurized reservoir. The reason for this phenomenon is that fluid streamlines cannot abruptly change direction. When the electrolyte exited the electrode, dead zones were not formed at the beginning of the outlet channel but at its end, as shown in Figure 10b. Such dead zones interfere with flow and increase the pressure drop.

Figure 10.
Velocity contours in the (a) inlet channel and (b) outlet channel of the electrode.
To analyze the flow rate of the electrolyte discharged from the inlet channel outlet to the electrode, the average velocity distribution was determined at three locations, as shown in Figure 11. Calculate location A was the starting point of the electrode, where the characteristics of the flow discharged from the inlet channel to the electrode were observed. Location B was located at the distance of 10 mm from the start of the electrode, where the change in flow owing to the porosity of the electrode was observed. Finally, Location C was located at the center of the electrode, where the average flow characteristics in the electrode were analyzed as the electrolyte flowed upward.
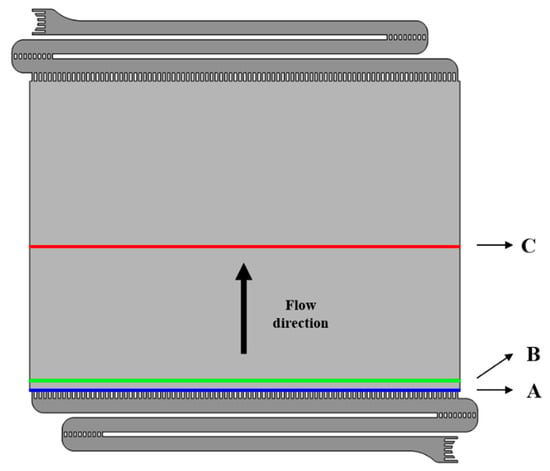
Figure 11.
Locations for calculation velocity in electrode of vanadium redox flow battery.
Figure 12 shows the profiles of the average y-velocity at the three locations. The maximum velocity was at the outlet on the right at location A, where the channel and electrode were connected, and the velocity distribution was uniform toward the left, as shown in Figure 12. This indicates that the flow in the final part of the curved path was deflected to the right because of the square vane located in the curved path and the shape of the flow channel, as shown through the preceding flow visualization. The average velocity at location A was higher than that at locations B and C. This was because the total area of the outlets was approximately 50% of the area of the electrode, and the average velocity increased owing to the reduction in area at the same flow rate. In addition, the uniformity of flow significantly increased from location A to C owing to the characteristics of the porous medium in the electrode.
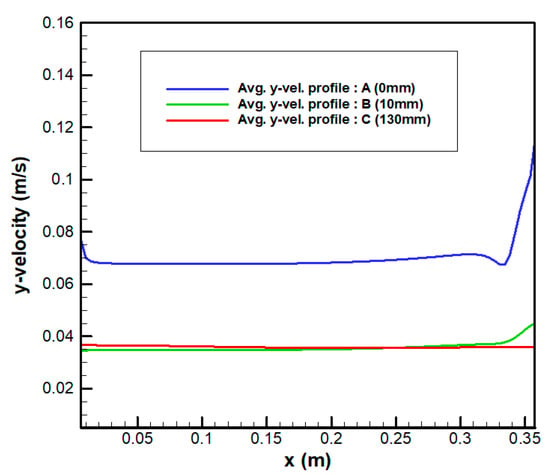
Figure 12.
Velocity profile according to electrode position.
Flow uniformity was evaluated based on the variability range coefficient () and maximum velocity deviation () given by Equations (8) and (9) through the discharge flow rates at 90 outlets of the inlet channel. When the variability range coefficient () was calculated for electrode, the position A exhibited the highest value of 0.072 m/s. The maximum velocity deviation () was 11.89%, which indicated low uniformity. The maximum velocity into the electrode was 0.15 m/s at the first outlet on the right, and the area of the outlets was 50% of the area of the electrode.
The pressure drop in the electrode was approximately twice as high as that in the inlet and outlet channels, as shown in Table 5. It was inferred that the pressure drop increased, because of the square vane in the middle of the inlet and outlet channels and because the guides of the outlets blocked 50% of the total area of the outlets.

Table 5.
Pressure drop in inlet and outlet channels, electrode, and entire flow frame.
3.3. Shape Configuration for Analysis of Various VRFB Flow Frames
The conventional VRFB flow frame, the maximum velocity deviation () of the electrolyte entering the electrode reached 11.89%. It means very low non-uniformity. Owing to the S-shaped flow channel of the existing VRFB, the flow velocity of the electrolyte entering the electrode from the inlet channel was the highest at the outlet on the right, and the difference between the velocities decreased toward the left. Because each channel and the electrode were directly attached to 90 outlets and guides, the pressure drop increased, owing to the decrease in the area of the flow channel. As stated earlier, the maximum velocity deviation () in the existing VRFB flow frame indicated low uniformity. To address this problem, a flow analysis was conducted for various flow frames and the changes in flow uniformity and the pressure drop were analyzed.
Two cases were considered to improve the shape of the flow frame, as shown in Figure 13. In CASE 1, the shape of outlets was the same as that in the existing flow frame, as shown in Figure 13a. However, the number of outlets was reduced to 45 and the area per outlet was increased to decrease the pressure drop. In addition, to eliminate the stagnation points close to the curved parts of the flow channel, a 1/4 elliptical shape was applied to enable the electrolyte to flow smoothly. The lengths of the outlets were gradually decreased from the right to left to change the flow channel resistance depending on the locations of the outlets.

Figure 13.
Two improved models of flow frame of vanadium redox flow battery. (a) CASE 1; (b) CASE 2.
In CASE 2, the initial inlet was divided into five sections, as shown in Figure 13b. The flow rate was the same for each section. A mixing zone with the characteristics of a porous medium and high resistance was installed to combine the flow of the electrolyte from each section. In particular, an elliptical structure was installed in the first section to prevent the flow from being discharged vertically and spread it to the left and right. The size of the ellipse is 4 mm in width and 2 mm in length.
3.4. Flow Characteristics of Various VRFB Flow Frames
Figure 14 shows the flow distribution for CASE 1. The maximum velocity in the channel was 1.449 m/s. In particular, the flow from the channel inlet did not move upward owing to the influence of the first outlet guide and moved toward the left. Figure 15 shows the velocity distribution at position A for CASE 1. The velocity was the highest at the first outlet of the inlet channel and the lowest at the second outlet because the electrolyte was not discharged smoothly owing to the influence of the first outlet guide; this was in agreement with the previously observed flow characteristics. The maximum velocity into the electrode was 0.091 m/s, and the total area of the outlets was 1/2 of the electrode area. According to this, the variability range coefficient () decreased from 0.072 to 0.030 m/s at position A. The maximum velocity deviation () was 19.27%, which was increase as compared with the previous value of 11.89%. This was an improvement over the existing result; however, flow uniformity was still low. Nevertheless, the flow path in the channel was simplified as compared with the existing shape, and the area per channel outlet was doubled, indicating a decrease in the overall pressure drop. However, there was still a problem with an increase in pressure drop due to vena contracta. Table 6 shows the pressure drop in each section. In the electrode, the pressure drop did not change significantly. However, in the channels, the pressure drop decreased up to 93.02% and, in the entire flow frame, the pressure drop decreased 44.89%.

Figure 14.
Flow distribution for CASE 1.
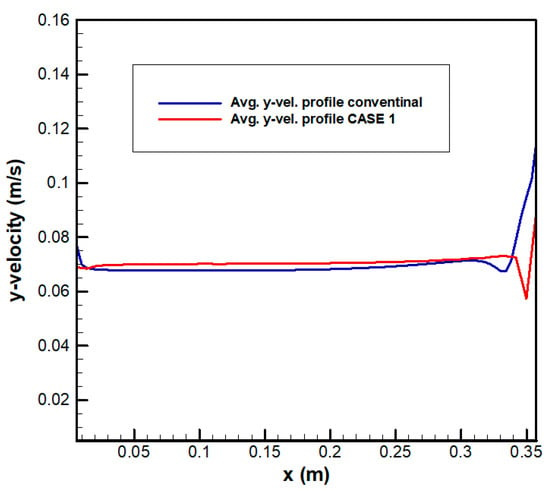
Figure 15.
Velocity distribution at the electrode inlet for CASE 1 (location A).

Table 6.
The difference in pressure drop between conventional design and CASE 1.
Figure 16 shows the flow distribution for CASE 2. The maximum velocity of the channel is 2.289 m/s in the entrance area located at the bottom. In the top section, the flow at the inlet was vertically discharged and distributed to the left and right owing to the elliptical structure. Figure 17 shows the velocity distribution at the position A for CASE 2. The deviation in the flow velocity was significantly reduced as compared with the conventional design. The maximum velocity into the electrode was 0.0508 m/s, and the total area of the outlets was the same as the area of the electrode. According to this, the variability range coefficient () significantly decreased from 0.072 to 0.0073 m/s at the position A. The maximum velocity deviation () was 54.16%, which was an increase as compared with the previous value of 11.89%, which was significantly improved as compared with the existing flow frame. Table 7 shows the pressure drop. The electrolyte from the five inlet sections was evenly distributed throughout the channel. In the channels, the pressure drop decreased up to 92.8% as compared with the existing design, and the pressure drop in the entire flow frame decreased by 44%. As described above, flow uniformity increases and the pressure drop decreases depending on the flow frame configuration. In addition, the overall system efficiency can be increased owing to an improvement in the output and the resulting reduction in pump energy loss.

Figure 16.
Flow distribution for CASE 2.
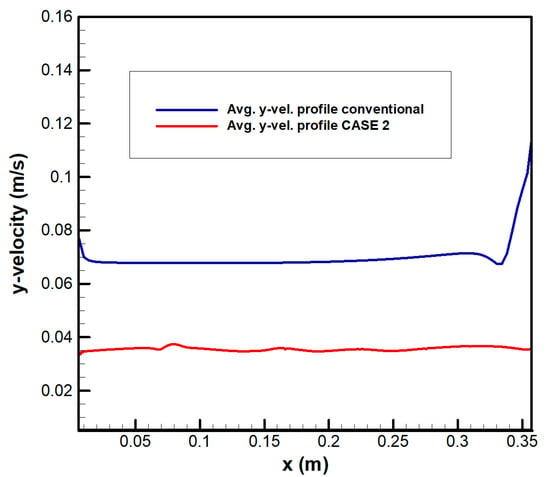
Figure 17.
Velocity distribution at the electrode inlet for CASE 2 (location A).

Table 7.
The difference in pressure drop between conventional design and CASE 2.
4. Conclusions
The flow characteristics of VRFBs were analyzed, and flow channel shapes were proposed to enhance the system efficiency. The shapes were examined to quantify the flow non-uniformity of the electrolyte discharged to the electrode. Numerical analysis showed that uniformity was improved by the proposed flow channel shapes. Thus, the pressure drop was decreased. This reduced pump energy consumption and increased the overall system efficiency.
The visualization experiment and CFD analysis of a conventional VRFB indicates that the flow path causes the unbalanced problem, which reduces the active surface area of the electrode. According to the analysis of the conventional design problems in the existing S-shaped flow channel, dead zones were formed and the electrolyte flow to the electrode was concentrated at the outlets on one side. In addition, there was an increase in the pressure drop because the electrolyte was discharged to the electrode via 90 outlets. To resolve these problems, the initial inlet of the flow channel was divided into five sections and an elliptical guide was installed the first section.
The maximum velocity deviations for the existing and proposed shapes were 11.89% and 54.16%, respectively. This indicated that the proposed shape increased flow uniformity. In addition, the pressure drop in the entire flow frame was reduced by 44% for the proposed shape as compared with the existing shape. The aforementioned results show that the overall efficiency of the RFB can be increased by increasing the maximum active surface area and the pump efficiency can be increased by understanding the flow characteristics of the flow channel and modifying its shape. However, as the factors that affect the actual battery system performance vary, it is considered that additional charging/discharging experiments must be performed according to flow uniformity. In addition, it is necessary to verify the system performance of the VRFB according to the flow uniformity through charging and discharging experiments on the unit cell and stack configuration.
Author Contributions
Conceptualization, Y.-H.C. and J.-Y.P.; methodology, J.-Y.P. and D.-Y.S.; software, J.-Y.P.; formal analysis, J.-Y.P. and Y.-H.C.; supervision, Y.-H.C.; project administration, J.-Y.P., D.-Y.S., and Y.-H.C. All authors have read and agreed to the published version of the manuscript.
Funding
This research received no external funding.
Conflicts of Interest
The authors declare no conflict of interest.
References
- Dunn, B.; Kamath, H.; Tarascon, J.M. Electrical energy storage for the grid: A battery of choices. Science 2011, 334, 928–935. [Google Scholar] [CrossRef] [PubMed]
- Joerissen, L.; Garche, J.; Fabjan, C.; Tomazic, G. Possible use of vanadium redox-flow batteries for energy storage in small grids and stand-alone photovoltaic systems. J. Power Sources 2004, 127, 98–104. [Google Scholar] [CrossRef]
- Reddy, T. Linden’s Handbook of Batteries; McGraw-Hill Education: New York, NY, USA, 2010. [Google Scholar]
- Sim, S.; Kang, J.; An, D.; Kim, S.; Kim, J.; Choi, J. Remaining useful life prediction of Li-ion battery based on charge voltage characteristics. Trans. Korean Soc. Mech. Eng. B 2013, 37, 313–322. [Google Scholar] [CrossRef]
- Khazaeli, A.; Vatani, A.; Tahouni, N.; Panjeshahi, M.H. Numerical investigation and thermodynamic analysis of the effect of electrolyte flow rate on performance of all vanadium redox flow batteries. J. Power Sources 2015, 293, 599–612. [Google Scholar] [CrossRef]
- Clemente, A.; Costa-Castelló, R. Redox flow batteries: A literature review oriented to automatic control. Energies 2020, 13, 4514. [Google Scholar] [CrossRef]
- Service, R.F. Advances in flow batteries promise cheap backup power. Science 2018, 362, 508–509. [Google Scholar] [CrossRef] [PubMed]
- Thaller, L.-H. Electrically rechargeable redox flow cells. In Proceedings of the 9th Intersociety Energy Conversion Engineering Conference, San Francisco, CA, USA, 26–30 August 1974; pp. 924–928. [Google Scholar]
- Ke, X.; Prahl, J.M.; Alexander, J.I.D.; Wainright, J.S.; Zawodzinski, T.A.; Savinell, R.F. Rechargeable redox flow batteries: Flow fields, stacks and design considerations. Chem. Soc. Rev. 2018, 47, 8721–8743. [Google Scholar] [CrossRef] [PubMed]
- Bengoa, C.; Montillet, A.; Legentilhomme, P.; Legrand, J. Flow visualization and modelling of a filter-press type electrochemical reactor. J. Appl. Electrochem. 1997, 27, 1313–1322. [Google Scholar] [CrossRef]
- Xu, Q.; Zhao, T.S.; Leung, P.K. Numerical investigations of flow field designs for vanadium redox flow batteries. Appl. Energy 2013, 105, 47–56. [Google Scholar] [CrossRef]
- Nguyen, T.; Savinell, R.F. Flow batteries. Electrochem. Soc. Interface 2010, 19, 54–56. [Google Scholar] [CrossRef]
- Chen, J.Q.; Wang, B.G.; Lv, H.L. Numerical simulation and experiment on the electrolyte flow distribution for all vanadium redox flow battery. In Advanced Materials Research; Trans Tech Publications Ltd.: Baech, Switzerland, 2011. [Google Scholar] [CrossRef]
- Escudero-González, J.; López-Jiménez, P.A. Redox cell hydrodynamic modelling: Towards real improved geometry based on CFD analysis. Eng. Appl. Comput. Fluid Mech. 2014, 8, 435–446. [Google Scholar] [CrossRef][Green Version]
- Escudero-González, J.; López-Jiménez, P.A. Methodology to optimize fluid-dynamic design in a redox cell. J. Power Sources 2014, 251, 243–253. [Google Scholar] [CrossRef]
- Ma, X.; Zhang, H.; Sun, C.; Zou, Y.; Zhang, T. An optimal strategy of electrolyte flow rate for vanadium redox flow battery. J. Power Sources 2012, 203, 153–158. [Google Scholar] [CrossRef]
- Zhu, M.; Wu, Q.; Chi, X.; Luo, Y. Simulation of all-vanadium redox flow batteries based on COMSOL. In Proceedings of the 29th Chinese Control and Decision Conference (CCDC 2017), Chongqing, China, 28–30 May 2017. [Google Scholar]
- Messaggi, M.; Canzi, P.; Mereu, R.; Baricci, A.; Inzoli, F.; Casalegno, A.; Zago, M. Analysis of flow field design on vanadium redox flow battery performance: Development of 3D computational fluid dynamic model and experimental validation. Appl. Energy 2018, 228, 1057–1070. [Google Scholar] [CrossRef]
- Bortolin, S.; Toninelli, P.; Maggiolo, D.; Guarnieri, M.; Del Col, D. CFD study on electrolyte distribution in redox flow batteries. In Journal of Physics: Conference Series; IOP Publishing: Bristol, UK, 2015. [Google Scholar] [CrossRef]
- Porous Media Condition. Available online: http://www.afs.enea.it/project/neptunius/docs/fluent/html/ug/node233.htm (accessed on 22 October 2020).
- Hirt, C.W.; Nichols, B.D. Volume of fluid (VOF) method for the dynamics of free boundaries. J. Comput. Phys. 1981, 39, 201–225. [Google Scholar] [CrossRef]
- Benedict, R.P. Fundamentals of Pipe Flow; Wiley: New York, NY, USA, 1980; ISBN 0471033758. [Google Scholar]
Publisher’s Note: MDPI stays neutral with regard to jurisdictional claims in published maps and institutional affiliations. |
© 2020 by the authors. Licensee MDPI, Basel, Switzerland. This article is an open access article distributed under the terms and conditions of the Creative Commons Attribution (CC BY) license (http://creativecommons.org/licenses/by/4.0/).