Abstract
Permanent magnet synchronous machines (PMSMs) are widely used in electric vehicles due to their high power density, high efficiency, etc. Core losses account for a significant component of the total loss in PMSMs. Therefore, it is necessary to carefully consider it when designing PMSMs according to actual scientific research project applications. This paper extracts the characteristic operating points of the PMSMs under different operating conditions at different speeds. Then a harmonic analysis of air-gap flux density, phase current, core loss was completed, and detailed comparative analysis was performed. A novel method for comprehensively analyzing the stator core loss of PMSMs for vehicles is proposed, which reveals the law of the core loss of the PMSM under Maximum-Torque-Per-Ampere (MTPA) and Space Vector Pulse Width Modulation (SVPWM). The method was verified by a prototype experiment where the actual core loss of PMSMs was measured to verify the correctness of the method. This research provides a reference for accurately predicting core loss during the forward design of PMSMs and completing core loss evaluation for existing PMSMs.
1. Introduction
The stator core loss of permanent magnet synchronous machines (PMSMs) is closely related to the magnetic field in the core that changes with time and space, and it is difficult to obtain an accurate calculation process. The Bertotti loss separation model is a commonly used calculation model for stator core loss [1]. According to the physical causes of core loss, it is decomposed into hysteresis loss, eddy current loss and additional loss, and the proposed General calculation model of loss. This model is currently recognized as the more accurate loss model. Zhu Jianguo of the University of Technology Sydney and others took permanent magnet brushless DC motors as a research object and proposed accurate circular rotating magnetization loss calculation models and elliptical rotating magnetization loss calculation models suitable for iron loss calculations [2]. This calculation model requires loss coefficients under rotating magnetization and alternating magnetization. However, the loss factor under circular rotating magnetization is difficult to obtain, which restricts the application of this method. On this basis, Hu Qiansheng of Southeast University and others proposed an orthogonal decomposition loss calculation model, which equates the rotating magnetization loss as the linear superposition of two orthogonal alternating magnetization losses. This method has undergone a large number of experiments and measurements. The error of the value is kept within 10%, with high accuracy [3].
With the development of power electronic devices and high-power devices, inverter control technologies such as Pulse Width Modulation (PWM) and Space Vector Pulse Width Modulation (SVPWM) have become more widely used in motor control. The analysis of the influence of frequency and time harmonics on core loss is particularly important. Chen P. et al., based on the non-sinusoidal time harmonics generated by the PWM inverter, established an improved calculation model for the additional core loss and permanent magnet eddy current loss caused by high-frequency non-sinusoidal time harmonics. The influence of inverter parameters (switching frequency and modulation ratio) on core loss was studied [4,5,6,7]. Kowal D. et al. respectively carried out the core loss and permanent magnet eddy current loss obtained by the frequency domain loss calculation model considering only the sinusoidal distributed magnetic field, and the time domain loss calculation model considering PWM non-sinusoidal harmonics, rotating magnetization, and local hysteresis loops. The results showed that the high-order current harmonics generated by PWM greatly increase the core loss of the motor and the eddy current loss of the permanent magnet, and the segmented structure of the permanent magnet could effectively reduce the eddy current loss [8]. In [9], Zhang Yuelei and others used finite element co-simulation to simulate the core loss, copper loss, and eddy current loss of the V-type interior PMSM (IPMSM) under SVPWM control, and analyzed the influence of the SVPWM carrier ratio and modulation ratio on the motor loss. In [10,11], Xiao Chengdong et al. took a 5.5 kW motor as an example, and then established the SVPWM control model of the motor, and simulated the output voltage waveforms at different operating points of the motor, and then analyzed the different carrier frequencies and carrier frequencies of the motor using finite element simulation. The change rule of stator and rotor core flux density under modulation ratio and its influence on loss density, but the Simulink simulation model in this method does not consider the influence of the magnetic saturation effect on electromagnetic parameters. In [12,13], Sun Z.C. et al. compared the core loss of amorphous alloy PMSMs produced under different power supply modes (including sine wave power supply, direct torque control, and vector control). The study showed that compared with vector control, moment control could produce greater core loss and permanent magnet eddy current loss.
The research on stator core loss at home and abroad is mainly focused on aspects of accurate analytical calculation of core loss and optimization of core loss. In recent years, the accurate calculation method of stator core loss based on the control method has also attracted attention. Relatively speaking, the research on motor core loss under SPWM is relatively mature, while the research on motor core loss under SVPWM control is not thorough enough. It is of great significance to study the efficient calculation method of stator core loss of PMSM considering the magnetic saturation effect under SVPWM control conditions.
2. The Stator Core Loss Analytical Calculation Method
An outer rotor PMSM has been manufactured. A 1/12 2D model of the machine cross-section is shown in Figure 1, and basic machine parameters are listed in Table 1.
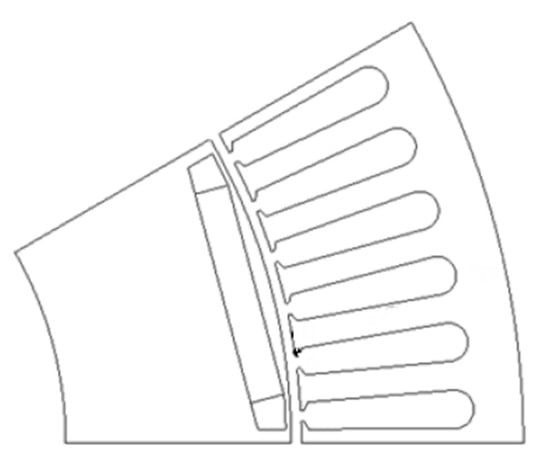
Figure 1.
1/12 2D model of an outer rotor space vector pulse width modulation (PMSM).

Table 1.
The main parameters of the outer rotor PMSM.
In the paper [14], in order to consider the influence of high frequency and high flux density on the core loss of the motor, the interval was divided according to frequency and flux density. Different additional flux density terms were used to compensate for the increased value of hysteresis and eddy current loss caused by the non-linearity of the magnetic chain of the silicon steel sheet and the higher harmonic magnetic field. The calculation model can be expressed as follows,
where, is the rotating magnetization loss coefficient, . and are the magnetic flux densities of the two axes of the elliptical rotating flux density. is the k-th flux density harmonic amplitude. is the low-order term of the additional flux density for hysteresis loss. is the high-order term of eddy current loss and flux density. are the additional loss coefficients, which can be obtained by fitting the orthogonal magnetization loss data at different frequencies measured, and the loss coefficients all change with changes in magnetic flux density and frequency.
Based on the stator loss coefficient and the flux density distribution of each internal split unit, the core loss density of each split unit of the stator was obtained. On this basis, the stator core loss obtained by the summation is,
where, is the axial length of the stator. is the density of the stator silicon steel sheet. , , are the hysteresis, eddy current, and additional loss density of the i-th stator unit, respectively. is the area of the i-th unit, and Ns is the number of split units.
3. Phase Current Analysis
Interior Permanent Magnet Synchronous Motors (IPMSMs) have a rated torque of 1134 Nm and a peak torque of 1660 Nm. Considering the motor’s speed range, control strategy (Maximum Torque Per Ampere (MTPA) or field weakening control) and magnetic saturation characteristics, four operating points (1000 rpm, 1660 Nm; 3200 rpm, 1660 Nm; 3200 rpm, 1134 Nm; 6000 rpm, 588 Nm) were selected. Their phase currents and internal magnetic fields were analyzed. Among them, the working points were 1000 rpm, 1660 Nm and 3200 rpm, 1134 Nm was controlled by MTPA, and the other two points were controlled by a weak magnetic field. Based on the SVPWM control model, the dq-axis currents at different operating points of the motor with and without the magnetic saturation effect were calculated separately, and then Park inverse transformation was performed on the direct axis and quadrature axis (dq-axis) current to obtain the phase current of the motor in one electrical cycle, as shown in Figure 2. When the motor adopted MTPA control, the internal magnetic saturation of the stator was relatively high, and the phase current obtained was larger than the phase current without considering the magnetic saturation. In weak field control, the magnetic saturation was low, and the phase current was smaller than the phase current without considering the effect of magnetic saturation [15,16,17,18,19,20,21,22,23].
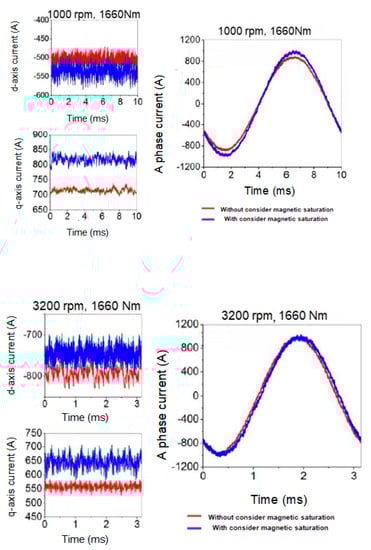
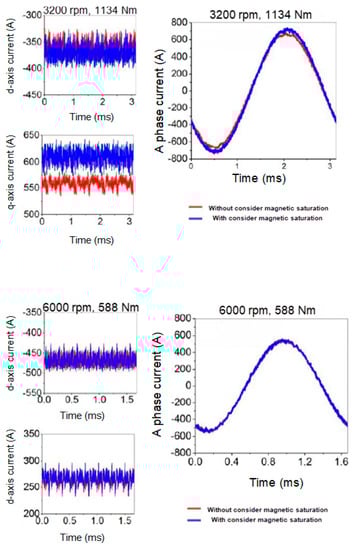
Figure 2.
Phase current and dq-axis current under different working points of the motor.
The A-phase current shown in Figure 2 was Fourier decomposed to get its harmonic amplitudes, as shown in Figure 3.
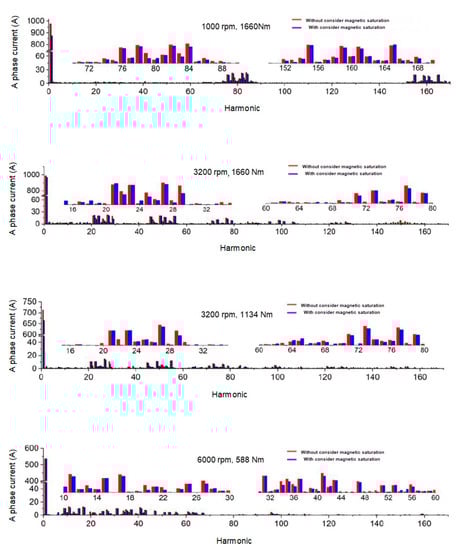
Figure 3.
A-phase harmonic current amplitude under different working points of the motor.
The phase current obtained by inverter space vector pulse width modulation, the main harmonic order of its waveform was (2i − 1)fc/f ± 2, (2i − 1)fc/f ± 4, 2ifc/f ± 1, 2ifc/f ± 5 (i = 1, 2, 3, …). Among them, fc is the inverter carrier frequency, and f is the fundamental frequency. The carrier frequency of the controller was 8kHz, when the PMSM was working at 1000 rpm, fc/f = 80, then the main harmonic orders were 80 ± 2, 80 ± 4, 160 ± 1, 160 ± 5, … The current harmonic orders at 3200 rpm were mainly 25 ± 2, 25 ± 4, 50 ± 1, 50 ± 5, 75 ± 2, 75 ± 4, … The current harmonic orders at 6000 rpm were mainly 13 ± 2, 13 ± 4, 26 ± 1, 26 ± 5, 39 ± 2, 39 ± 4, …
A large number of current harmonics were generated by the motor’s SVPWM. The current harmonic total distortion (THD) rate was used to reflect the harmonic content of the phase current, and its calculation Equation can be expressed as:
Based on Equation (3), the harmonic distortion rate of the phase current of the motor with and without the magnetic saturation effect was calculated separately, as shown in Table 2. After considering the magnetic saturation effect, the dq-axis flux linkage of the motor changed nonlinearly with the current, and the harmonic content of the phase current was higher than the harmonic content without considering the magnetic saturation effect.
Table 2.
The total harmonic distortion rate of the phase current of the motor with and without considering the magnetic saturation effect.
4. Magnetic Field Analysis under MTPA and Field Weakening Control Strategy
Figure 4 shows the vector control system used in this section to analyze the core loss under different working conditions [24,25,26,27,28].
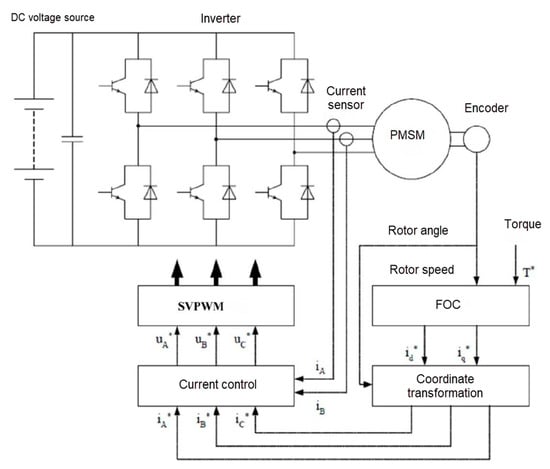
Figure 4.
Vector control system of PMSM.
During the operation of the motor, affected by different armature currents, the changes in the magnetic flux density at various internal positions are quite different, and detailed analysis of the magnetic field at different positions under various operating conditions is required.
For this motor, its operating characteristic curve and drive control mode under different working conditions are shown in Figure 5. The motor ran at low speed with constant torque and at high speed with constant power. In constant torque operation (0–3200 rpm), the winding current was 579.4 A, the current angle was 28.33°, the terminal voltage was gradually increased to 440 V, the motor achieved maximum torque current ratio operation, and the output rated torque was 1134 Nm; in field weakening control Area (3200–6000 rpm), the direct-axis current Id kept increasing, the quadrature-axis current Iq kept decreasing, the current angle gradually increased, the terminal voltage remained unchanged at 440 V, and the motor output rated power was 370 kW. The torque, power, current, and internal power factor angle (ψ) of the motor operating points (1000, 2000, 3200, 4000, 5000, and 6000 rpm) under different working conditions are shown in Table 3.
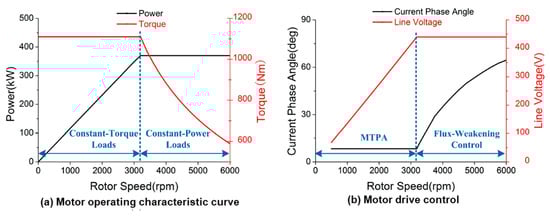
Figure 5.
Operating characteristic curve and drive control of the PMSM.
Table 3.
Motor operating points under different working conditions.
It can be seen from Table 3 that in the field weakening control zone, as the speed increased, due to the decrease of the quadrature axis current Iq, the phase current Is synthesized by Id and Iq gradually decreased, and the speed continued to increase; although the alternating current The shaft current Iq continued to decrease, the effect of the increase in the direct-axis current Id was more obvious, and the phase current Is began to rise again.
Figure 6 shows the distribution of magnetic field lines and air gap radial flux density when the motor was under no-load and field weakening control (3200 rpm, 6000 rpm) output rated power. When there was no load, there is no stator current, only the permanent magnet of the rotor provides the magnetomotive force, and the air-gap flux density waveform was close to a rectangular wave; in the field weakening control, the d-axis current gradually increases with the increase of the speed to weaken the magnetic field. Compared with the magnetic field at 3200 rpm, the magnetic field was significantly weakened at 6000 rpm.
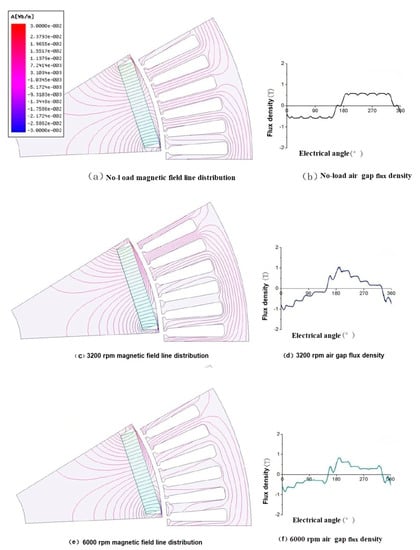
Figure 6.
The distribution of magnetic field lines and air gap radial flux density when the motor was under no-load and field weakening control.
The air gap radial flux density changes of the motor with no load and load are shown in Figure 7 and Figure 8. Figure 7 shows the air gap flux density under the armature reaction when the rotor permanent magnet magnetic field was not considered. Figure 8 shows the air gap flux density when the rotor permanent magnet magnetic field and the armature reaction magnetic field were combined.
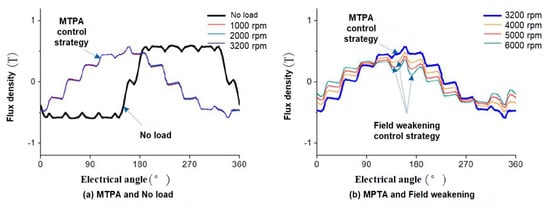
Figure 7.
The air gap flux density under the armature reaction without considering the magnetic field of the permanent magnet.
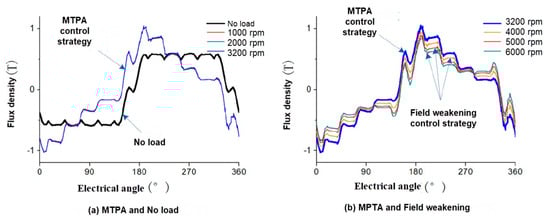
Figure 8.
The air gap flux density under the armature reaction with considering the magnetic field of the permanent magnet.
Affected by the armature reaction of the q-axis, the air gap flux density was significantly distorted compared with no-load. Before the rated speed (3200 rpm), the motor was under maximum torque control, and the winding current amplitude and phase are unchanged, so the air gap flux density waveform was basically the same, as shown in Figure 7a and Figure 8a. As the speed increased and the d-axis current Id increased, the d-axis current demagnetized. Obviously, the air gap flux density gradually decreased.
Under different working conditions, the control mode of the motor is different, and the flux density waveform in the stator core also changes under the action of the armature reaction. Points were taken at the typical position of the tooth and yoke, and analyze different conditions, namely no-load, constant torque operation (0–3200 rpm) and constant power operation (3200–6000 rpm)), the radial flux density of the motor teeth, and the tangential flux density of the yoke change, as shown in Figure 9.
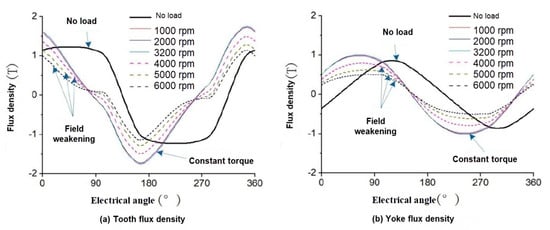
Figure 9.
Changes in the radial flux density of the teeth and the tangential flux density of the yoke of the motor under different working conditions.
It can be seen from Figure 9 that similar to the air gap flux density, the no-load air gap flux density of the tooth was a trapezoidal wave. In the constant torque region, the winding current amplitude and phase were the same. The flux density waveform was basically the same. In the constant power zone (field weakening control zone), as the speed increased, the air gap flux density of the motor gradually decreased. Perform Fourier analysis on the radial flux density of the tooth and the tangential flux density of the yoke, and the amplitude of each harmonic component is shown in Figure 10.
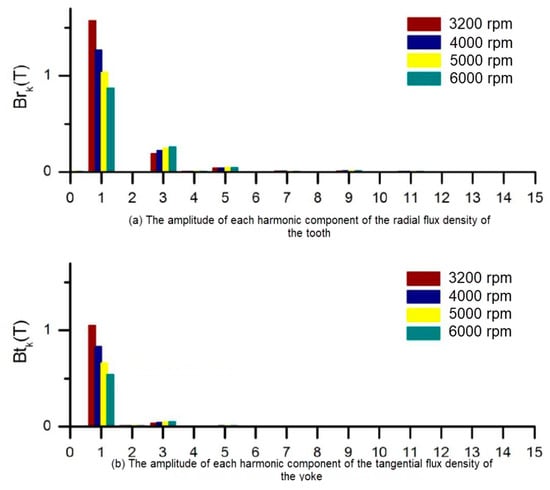
Figure 10.
The amplitude of each harmonic component of the radial flux density of the tooth and the tangential flux density of the yoke.
It can be seen from Figure 10 that under the field weakening control strategy, as the speed increased, the d-axis current increased, the magnetic field was weakened, and the amplitude of the fundamental wave decreased. But as the speed increased, the influence of space harmonics increased, and the proportion of harmonic components of flux density gradually increased.
5. Core Loss Calculation Results
The no-load and load core losses of the PMSM stator at different speeds are shown in Figure 11. It can be seen from the figure that as the speed increased, the no-load loss of the stator core gradually increased. Under load conditions, the Id current in the constant torque region (0–3200 rpm) remained the same, and the magnetic field in the stator core of the motor was the same. As the speed increased, the frequency of the motor also increased, resulting in the loss of the stator core. When there was an increase in the constant power zone (3200–6000 rpm), due to the gradual increase of the Id current, the demagnetization effect was obvious, and the magnetic field in the stator core was weakened. Even if the speed increased, the motor frequency increased, and the stator core loss also decreased [29].
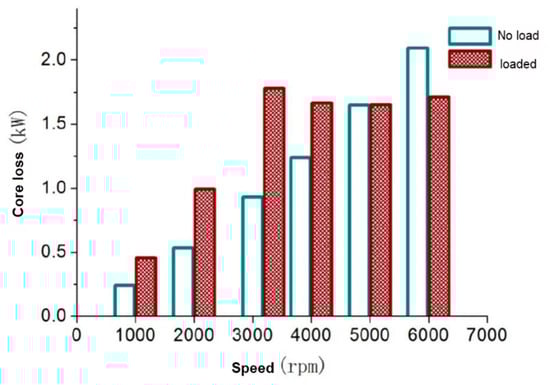
Figure 11.
No-load loss and load loss of the motor at different speeds.
Under load, the core loss was decomposed into hysteresis loss (Ph), eddy current loss (Pe), and additional loss (Pexc). The decomposed core loss at different speeds is shown in Figure 12, and their proportion to the total core loss is shown in Figure 13. It can be seen from Figure 12 that the hysteresis loss accounted for most of the core loss. In the constant torque region, with the increase in speed, the hysteresis loss gradually increased; in the constant power region, the magnetic field became smaller due to the weak magnetic field, causing the hysteresis loss to decrease with the increase of speed. With the increase of speed, in the constant torque region, the eddy current loss and additional loss were increasing; in the constant power region, even if the magnetic field became smaller, due to the increase of the motor frequency, the influence on the increase of loss increased, the eddy current loss and the additional loss continued to rise.
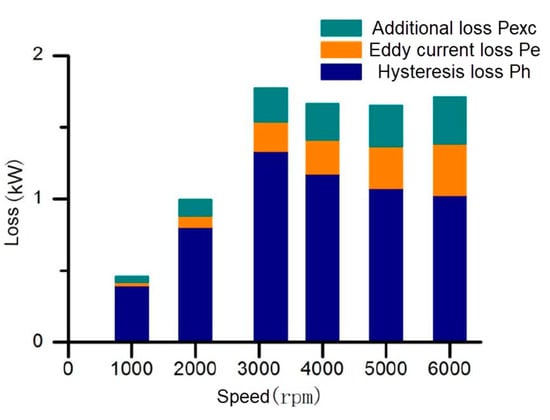
Figure 12.
Decomposed core loss under different speed loads.
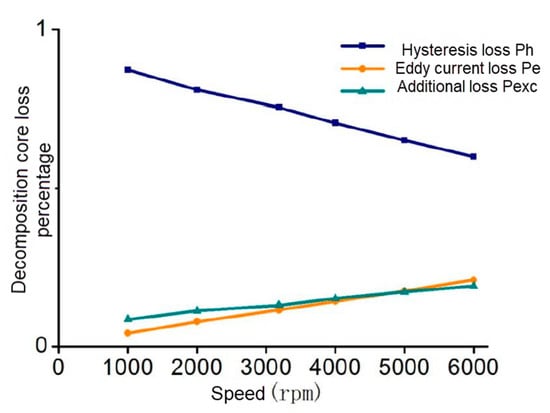
Figure 13.
The ratio of core loss to total core loss under different speeds under load conditions.
As shown in Figure 13, as the speed increased, the proportion of hysteresis loss, eddy current loss, and additional loss in the total core loss were constantly changing, and the proportion of hysteresis loss gradually decreased. Due to the increase in harmonic content, eddy current loss, and the proportion of additional loss, the rising speed of eddy current loss was higher than that of additional loss.
The above analysis is the calculation result under the condition of sinusoidal current source loading. Under normal circumstances, the calculation result under the sinusoidal current source can meet the basic needs of motor electromagnetic field and motor performance research. However, the loss results obtained were ignored because the influence of inverter carrier harmonics is relatively small. Therefore, it is necessary to analyze the motor loss under SVPWM of the inverter. The A-phase current of SVPWM at different speeds is shown in Figure 14.
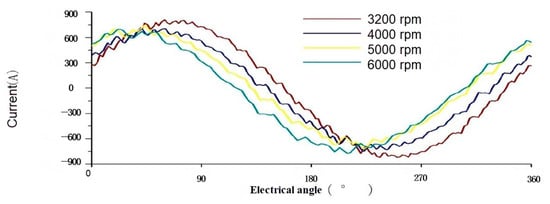
Figure 14.
Space vector pulse width modulation (SVPWM) phase A current at different speeds.
The current is generated by the space vector pulse width modulation of the inverter. The main harmonic order of the PWM waveform is (2i − 1)fc/f ± 2, (2i − 1)fc/f ± 4, 2ifc/f ± 1, 2ifc/f ± 5 (i = 1, 2, 3, …), where fc is the inverter carrier frequency, and f is the fundamental frequency. The carrier frequency of the motor controller is 7.5 kHz. When the motor is working at 5000 rpm, the main harmonic order was 15 ± 2, 15 ± 4, 30 ± 1, 30 ± 5, 45 ± 2, 45 ± 4, 60 ± 1, 60 ± 5, … Perform Fourier analysis on the phase A current at 5000 rpm gave the harmonic current amplitude under different harmonic orders, as shown in Figure 15.
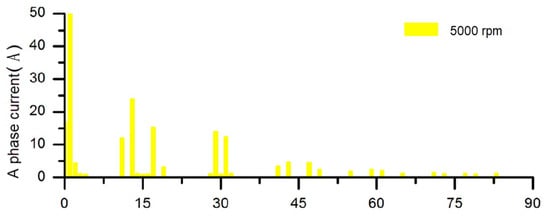
Figure 15.
Phase A harmonic current under different harmonic orders at 5000 rpm.
Fourier analysis was performed on the phase A current in the constant power field weakening control area, and the main harmonic current of phase A with SVPWM at different speeds was obtained as shown in Figure 16. As can be seen from the figure, due to the different fundamental frequencies of different speeds, the main harmonics of the phase A current generated by the inverter were also different.
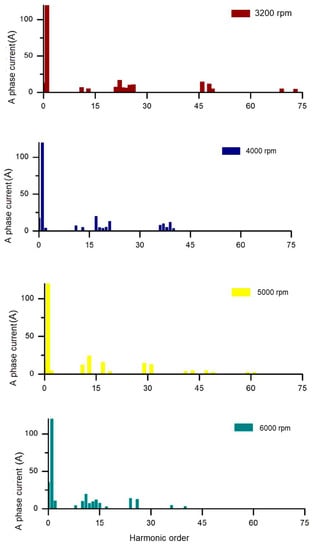
Figure 16.
Space vector pulse width modulation (SVPWM) phase A harmonic currents at different speeds.
Figure 17 shows the amplitude of each harmonic component of the tooth radial flux density and the yoke tangential flux density under SVPWM. Compared with Figure 10, it can be seen that the higher harmonics of the radial flux density of the teeth and the tangential flux density of the yoke increased significantly, and the main harmonics of the flux density at different speeds were consistent with the current harmonics. Compared with the sinusoidal current source, the harmonics generated by the inverter caused an increase in core loss. The core loss of the stator core loss under the sinusoidal current source and SVPWM and the increased core loss of SVPWM relative to the sinusoidal current source are shown in Table 4.
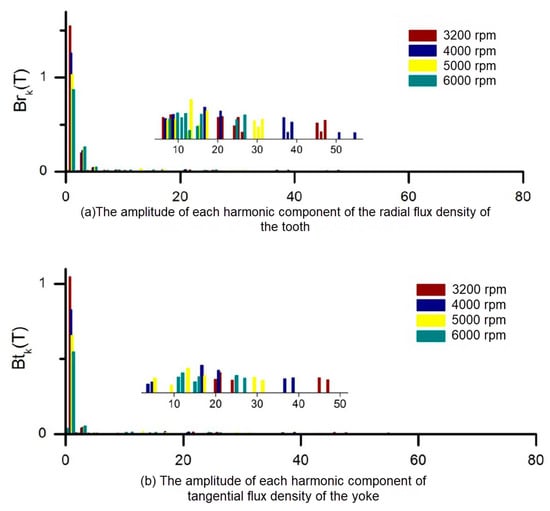
Figure 17.
The amplitude of each harmonic component of the tooth radial flux density and yoke tangential flux density under SVPWM.
Table 4.
Stator core loss under sinusoidal current source and SVPWM.
It can be seen from Table 4 that in the field weakening control area (3200–6000 rpm), compared with the sinusoidal current source loading, the motor loss under inverter SVPWM increased significantly, and the stator core loss increased by more than 25%. Results of the Fourier analysis of the stator core loss under SVPWM and the stator iron core loss harmonics are shown in Figure 18.
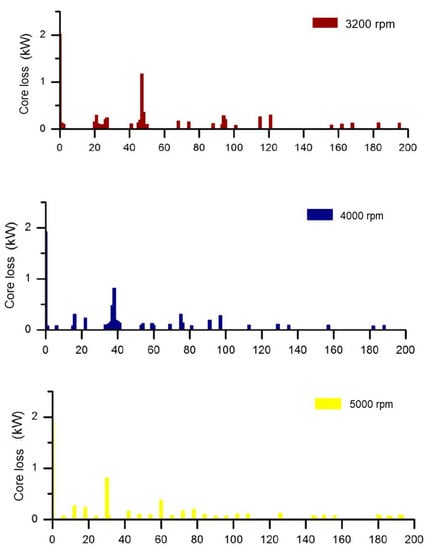
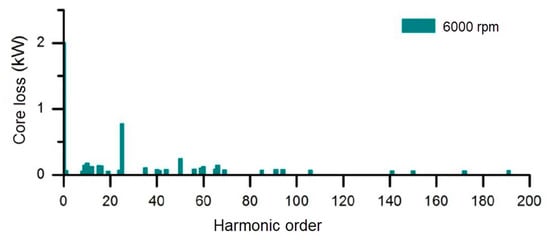
Figure 18.
Stator core loss harmonics under SVPWM.
Compared with Figure 16, the influence of time harmonic current on stator core loss can be clearly seen from Figure 18.
At different speeds, the stator core loss cloud chart is shown in Figure 19. It can be seen from the figure that the stator core loss of the motor was mainly distributed in the stator teeth, and the loss distribution at different speeds was slightly different. The higher the speed, the greater the local core loss.
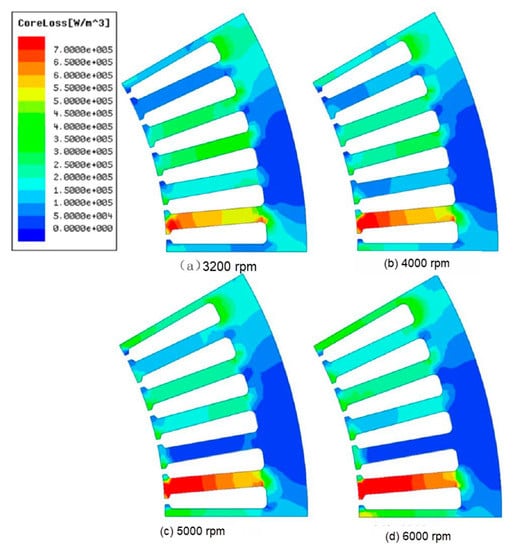
Figure 19.
Cloud diagram of load core loss at different speeds.
6. Experimental Verification
In order to verify the calculation results of core loss, a load core loss experiment was carried out on the prototype. The motor prototype, controller, and experimental bench are shown in Figure 20.
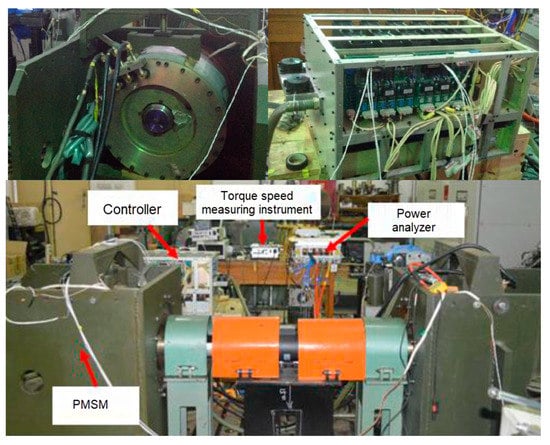
Figure 20.
The motor prototype, controller and experimental bench.
The experimental verification method was as follows:
- (1)
- Increase the motor speed to slightly more than 6000 rpm through the inverter;
- (2)
- The inverter stops working, and the motor slows to a standstill;record the relationship between time and speed when the motor speed is 6000 rpm and zero;
- (3)
- The power loss at different moments can be obtained through the deceleration curve of the motor.
It can be seen from Figure 21 that the calculation result was basically consistent with the core loss calculation result, and the maximum error of each point did not exceed 9.6%, which can meet the needs of the project. The motor core loss measured by this experimental method included the mechanical loss of the motor (bearing loss and wind abrasion loss), so there is a certain error between the calculation results and the experimental results.
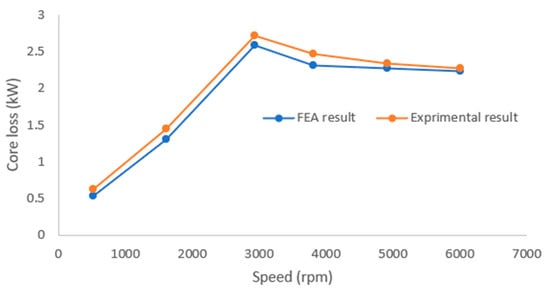
Figure 21.
Comparison curve of core loss measurement and calculation.
7. Discussion
This paper analyzes the air gap flux density, tooth radial flux density, and yoke tangential flux density of PMSM by changing the direct and quadrature axis currents when the PMSM is in different operating conditions. Additionally, this paper studied the change in the iron loss of the motor in the constant torque area and constant power as the speed changes, and the core loss of the PMSM under MTPA or field weakening control were studied.
When the motor is running at 1000 rpm, 3185 rpm and 6000 rpm, the trend of the PMSM loss considering the effect of magnetic saturation was consistent with the trend of loss without considering the magnetic saturation. However, under the same operating point, when the magnetic saturation was considered, the electromagnetic parameters changed nonlinearly. The current harmonics under SVPWM control were larger than those without magnetic saturation, making the stator magnetic field harmonics of the motor increase. The stator core loss increases and different motor control methods (MTPA or field weakening control) had different influences on the proportion of stator hysteresis loss, eddy current loss, and additional loss.
In the 1000 rpm working area, the PMSM loss was dominated by hysteresis loss. The motor did not enter the field weakening zone. As the load torque increased, especially when the torque was high, the phase current of the motor, when magnetic saturation was considered, was significantly higher than the phase current when magnetic saturation was not considered. The armature effect of the winding current was low, and the fundamental flux density was high; therefore, the proportion of hysteresis loss in total loss had a slight upward trend, while the proportion of eddy current loss and additional loss in total loss decreased.
In the 3185 rpm working area, the PMSM control mode was divided into MTPA control and field weakening control according to the size of the load torque. When the load torque was less than the rated torque, the PMSM was under MTPA control, and the increase in frequency increased the proportion of the PMSM eddy current loss, and the stator core loss increased with the increase in torque. As the torque increased, the PMSM enters the field weakening control area, the demagnetization current increased, and the total motor loss decreased, but the internal flux density harmonic content of the stator increased. At this time, the proportion of hysteresis loss in the total loss decreased. The proportion of eddy current loss and additional loss in total loss increased accordingly.
In the 6000 rpm working area, the PMSM adopted field weakening control, and the magnetic saturation effect had little influence on the stator core loss. With the increase of load torque, the degree of field weakening increased, and the increase of demagnetization current made the fundamental flux density of the stator decrease, the harmonic content increased, and the stator core loss increased slightly, but the magnitude of the change was not large. The proportion of loss in the total loss decreased slightly, while the proportion of eddy current loss and additional loss in the total loss increased.
8. Conclusions
This paper proposes a calculation method for calculating the core loss of permanent magnet synchronous motor in the full working range, considering the motor control strategy. Research shows that when the PMSM runs at a low-speed and high-torque region, MTPA control is adopted. At this time, the magnetic saturation inside the stator is relatively high, and the magnetic saturation effect has a greater impact on the phase current, magnetic field, and stator core loss. As the speed increases, the PMSM runs in the high-speed and field-weakening region, and the larger magnetic field weakening current reduces the degree of magnetic saturation in the stator, and the magnetic saturation effect reduces the influence of the motor phase current, magnetic field, and stator core loss. Therefore, considering the magnetic saturation effect under low-speed and high-torque conditions is very important for the accurate calculation of stator core loss.
The research results of this paper provide ideas for other researchers to accurately predict motor core loss when designing motors and also provide methods for analyzing core loss of existing motors.
Author Contributions
G.Y. conceived the proposed method for calculating stator core losses in the IPMSM under SVPWM excitation, analyzed the data, and drafted the manuscript; C.Z. and S.Z. contributed analysis tools. All authors have read and agreed to the published version of the manuscript.
Funding
This research was financially supported by the National Natural Science Foundation of China (Grant No. 51677005), the National Key Research and Development Program (No. 2017YFB0102402), and the China Scholarship Council (No. 201906030192).
Acknowledgments
We authors acknowledge the Beijing Institute of Technology and Newcastle University for sharing technical experts.
Conflicts of Interest
The authors declare no conflict of interest.
References
- Bertotti, G. General properties of power losses in soft ferromagnetic materials. IEEE Trans. Magn. 1988, 24, 621–630. [Google Scholar] [CrossRef]
- Zhu, J.; Ramsden, V.S. Improved formulations for rotational core losses in rotating electrical machines. IEEE Trans. Magn. 1998, 34, 2234–2242. [Google Scholar]
- Huang, Y.; Hu, Q.; Zhu, J. Calculation Method for Iron Loss of Permanent Magnet Brushless DC Motor. Electr. Mach. Control Appl. 2007, 31, 6–9. [Google Scholar]
- Roy, R.; Prabhakar, K.K.; Kumar, P. Core-loss calculation in different parts of induction motor. IET Electr. Power Appl. 2017, 11, 1664–1674. [Google Scholar] [CrossRef]
- Jiang, S.; Zou, J.; Xu, Y.; Liang, W. Variable coefficient iron loss calculating model considering rotational flux and skin effect. Proc. CSEE 2011, 31, 104–110. [Google Scholar]
- Takbash, A.M.; Pillay, P. A modified analytical method for core losses calculation in magnetic laminations for a wide range of frequency and flux density. In Proceedings of the IEEE International Conference on Electric Machines and Drives, Coeur d’Alene, ID, USA, 10–13 May 2015; pp. 1109–1114. [Google Scholar]
- Chen, P.; Tang, R.; Tong, W. Analysis of losses of permanent magnet synchronous motor with PWM supply. In Proceedings of the International Conference on Electrical Machines and Systems, Hangzhou, China, 22–25 October 2014; pp. 1119–1124. [Google Scholar]
- Kowal, D.; Sergeant, P.; Dupré, L.; Karmaker, H. Comparison of frequency and time-domain iron and magnet loss modeling including PWM harmonics in a PMSG for a wind energy application. IEEE Trans. Energy Convers. 2015, 30, 376–486. [Google Scholar] [CrossRef]
- Kim, C.W.; Koo, M.M.; Kim, J.M.; Ahn, J.H.; Hong, K.; Choi, J.Y. Loss analysis of permanent magnet synchronous generator under SVPWM modulation strategy. J. Hunan Univ. Nat. Sci. Ed. 2016, 43, 87–93. [Google Scholar]
- Sun, P. Research on the Influence of Pulse Width Modulation Strategy on the Loss of Asynchronous Traction Motor. Ph.D. Thesis, Dalian Jiaotong University, Dalian, China, 2015. [Google Scholar]
- Tong, W.; Zhu, X.; Zhu, L.; Li, H. Influence of different power supply modes on iron loss of amorphous alloy permanent magnet synchronous motor. Trans. China Electrotech. Soc. 2015, 30, 115–122. [Google Scholar]
- Sun, Z.C.; Shen, J.X.; Jin, M.J.; Hao, H. Research of the influence of different PWM inverters on the iron losses for induction motors. In Proceedings of the 17th International Conference on Electrical Machines and Systems, Hangzhou, China, 22–25 October 2014; pp. 96–100. [Google Scholar]
- Zhang, D.; Zhao, H.; Wang, Y.; Xu, G.; Liu, X. A Piecewise Variable Coefficient Model for Precise Analysis on Iron Losses of Electrical Machines. Trans. China Electrotech. Soc. 2016, 31, 16–23. [Google Scholar]
- Tian, Z.; Zhang, C.; Zhang, S. Analytical Calculation of Magnetic Field Distribution and Stator Iron Losses for Surface-Mounted Permanent Magnet Synchronous Machines. Energies 2017, 10, 320. [Google Scholar] [CrossRef]
- Guo, Q.; Zhang, C.; Li, L.; Zhang, J.; Wang, M. Maximum Efficiency per Torque Control of Permanent-Magnet Synchronous Machines. Appl. Sci. 2016, 6, 425. [Google Scholar] [CrossRef]
- Yang, X.; Kou, B.; Luo, J.; Zhou, Y.; Xing, F. Torque Characteristic Analysis of a Transverse Flux Motor Using a Combined-Type Stator Core. Appl. Sci. 2016, 6, 342. [Google Scholar] [CrossRef]
- Hu, J.; Yang, Y.; Jia, M.; Guan, Y.; Peng, T. A Novel Energy Optimization Control Strategy for Electric Drive System Based on Current Angle. Appl. Sci. 2020, 10, 3778. [Google Scholar] [CrossRef]
- Shin, H.; Chang, J. Efficiency Improvement Strategy for Multiple Operating Points in Doubly Fed Magnetic Geared Motor. Appl. Sci. 2020, 10, 2456. [Google Scholar] [CrossRef]
- Wu, H.; Zheng, L.; Li, Y.; Zhang, Z.; Yu, Y. Robust Control for Active Suspension of Hub-Driven Electric Vehicles Subject to in-Wheel Motor Magnetic Force Oscillation. Appl. Sci. 2020, 10, 3929. [Google Scholar] [CrossRef]
- Jagieła, M.; Bumby, J.; Spooner, E. Time-domain and frequency-domain finite element models of a solid-rotor induction/hysteresis motor. IET Electr. Power Appl. 2010, 4, 185–197. [Google Scholar] [CrossRef]
- Kulik, M.; Jagieła, M.; Łukaniszyn, M. Surrogacy-Based Maximization of Output Power of a Low-Voltage Vibration Energy Harvesting Device. Appl. Sci. 2020, 10, 2484. [Google Scholar] [CrossRef]
- Jagiela, M.; Garbiec, T.; Kowol, M. Design of High-Speed Hybrid Hysteresis Motor Rotor Using Finite Element Model and Decision Process. IEEE Trans. Magn. 2014, 50, 861–864. [Google Scholar] [CrossRef]
- You, Y.-M. Multi-Objective Optimal Design of Permanent Magnet Synchronous Motor for Electric Vehicle Based on Deep Learning. Appl. Sci. 2020, 10, 482. [Google Scholar] [CrossRef]
- Wang, D.; Yuan, T.; Wang, X.; Wang, X.; Wang, S.; Ni, Y. Performance Improvement for PMSM Driven by DTC Based on Discrete Duty Ratio Determination Method. Appl. Sci. 2019, 9, 2924. [Google Scholar] [CrossRef]
- Mellor, P.H.; Wrobel, R.; Holliday, D. A computationally efficient iron loss model for brushless AC machines that caters for rated flux and field weakened operation. In Proceedings of the IEEE IEMDC, Miami, FL, USA, 3–6 May 2009; pp. 490–494. [Google Scholar]
- Goss, J.; Wrobel, R.; Mellor, P.; Staton, D. The design of AC permanent magnet motors for electric vehicles: A design methodology. In Proceedings of the IEEE IEMDC, Chicago, IL, USA, 12–15 May 2013; pp. 871–878. [Google Scholar]
- Lee, H.W.; Lee, K.D.; Kim, W.H.; Jang, I.S.; Kim, M.J.; Lee, J.J.; Lee, J. Parameter design of IPMSM with concentrated winding considering partial magnetic saturation. IEEE Trans. Magn. 2011, 47, 3653–3656. [Google Scholar] [CrossRef]
- Stumberger, B.; Hamler, A.; Gorican, V.; Jesenik, M.; Trlep, M. Accuracy of iron loss estimation in induction motors by using different iron loss models. J. Magn. Magn. Mater. 2003, 24, 272–276. [Google Scholar] [CrossRef]
- Guo, Y.G.; Zhu, J.G.; Lu, H.Y.; Lin, Z.W.; Li, Y.J. Core loss calculation for soft magnetic composite electrical machines. IEEE Trans. Magn. 2012, 48, 3112–3115. [Google Scholar] [CrossRef]
Publisher’s Note: MDPI stays neutral with regard to jurisdictional claims in published maps and institutional affiliations. |
© 2020 by the authors. Licensee MDPI, Basel, Switzerland. This article is an open access article distributed under the terms and conditions of the Creative Commons Attribution (CC BY) license (http://creativecommons.org/licenses/by/4.0/).