Article

Managing a Smart City Integrated Model through Smart Program Management

by
Vita Santa Barletta
1,
Danilo Caivano
1,2,*,
Giovanni Dimauro
2,
Antonella Nannavecchia
3 and
Michele Scalera
2
1
Project Management Institute—Southern Italy Chapter, 80121 Napoli, Italy
2
CINI Smartcities Laboratory, 70125 Bari, Italy
3
Department of Economics and Management, University LUM Jean Monnet, 70010 Casamassima (BA), Italy
*
Author to whom correspondence should be addressed.
Appl. Sci. 2020, 10(2), 714; https://doi.org/10.3390/app10020714
Submission received: 30 November 2019 / Revised: 11 January 2020 / Accepted: 14 January 2020 / Published: 20 January 2020

Abstract

:
Context. A Smart city is intended as a city able to offer advanced integrated services, based on information and communication technology (ICT) technologies and intelligent (smart) use of urban infrastructures for improving the quality of life of its citizens. This goal is pursued by numerous cities worldwide, through smart projects that should contribute to the realization of an integrated vision capable of harmonizing the technologies used and the services developed in various application domains on which a Smart city operates. However, the current scenario is quite different. The projects carried out are independent of each other, often redundant in the services provided, unable to fully exploit the available technologies and reuse the results already obtained in previous projects. Each project is more like a silo than a brick that contributes to the creation of an integrated vision. Therefore, reference models and managerial practices are needed to bring together the efforts in progress towards a shared, integrated, and intelligent vision of a Smart city. Objective. Given these premises, the goal of this research work is to propose a Smart City Integrated Model together with a Smart Program Management approach for managing the interdependencies between project, strategy, and execution, and investigate the potential benefits that derive from using them. Method. Starting from a Smart city worldwide analysis, the Italian scenario was selected, and we carried out a retrospective analysis on a set of 378 projects belonging to nine different Italian Smart cities. Each project was evaluated according to three different perspectives: application domain transversality, technological depth, and interdependences. Results. The results obtained show that the current scenario is far from being considered “smart” and motivates the adoption of a Smart integrated model and Smart program management in the context of a Smart city. Conclusions. The development of a Smart city requires the use of Smart program management, which may significantly improve the level of integration between the application domain transversality and technological depth.

1. Introduction

Smart cities represent a future challenge, they are a city model where technology is a service for the people and a means for improving the quality of their economic and social life [1]. Since its origin, the Smart city concept has evolved from the execution of specific projects to the implementation of global strategies to deal with wider city challenges [2]. This concept implies a comprehensive approach to managing and developing a city that is able to balance technological, economic, and social factors involved in an urban ecosystem. A city can be viewed as a system of systems in a particular social and economic framework where all the systems work together [3]. Simply infusing intelligence into each subsystem of a city is not enough to become a smarter city [4]. Rather, a Smart city should be viewed as a large organic system [5] where city administrations develop an integrated city-planning framework, based on deciding where their internal expertise lie and identifying the city’s core competencies. The interrelationship between the Smart city’s core systems can make the “system of systems” smarter because no system can operate in isolation [6].
Many functions such as those serving individuals, buildings, and traffic systems are being automated in a way that enables policy makers to monitor, understand, analyze, and plan the city, improving aspects such as efficiency, equity, and quality of life for its citizens in real time [7]. Consequently, enormous amounts of data are automatically and routinely generated by access and interaction with a wide variety of devices, such as smartphones, computers, surveillance cameras, home appliances, sensors, commercial transactions, social networking sites, global positioning systems, and games [8].
Given these premises, Smart city projects need to adopt an integrated model of data and services from heterogeneous sources and multiple providers to ultimately allow the collaboration among different actors and coordinate the management of different initiatives in order to maximize the synergy between them, reuse common components, and align the management based on changes that may occur over time. The integrated management of related projects [9] is a prerequisite to obtain benefits and optimize and/or integrate costs, time, effort, and common assets. However, it requires the adoption of structured management processes [10]. Unfortunately, the current lack of integration between smart projects does not achieve these important synergies, making it difficult to communicate the improved smartness of the city to citizens [11]. Projects focused on individual smart dimensions—mobility, environment, people, living, governance, economy, etc. [12]—are no longer required, but instead a systemic and integrated approach that enhances the interoperability and scalability of solutions is needed. As so, management of smart projects must also be smart and a Smart city should be conceived as a solution that effectively integrates bi-dimensional assets, which are application domains and technology layers.
Nonetheless, an integrated management of projects goes beyond the objectives of ordinary project management as the latter focuses on the management of individual project initiatives by providing ad hoc processes and support methods and techniques. For example, the Project Management Institute in the well-known Project Management Body of Knowledge (PMBOK) [9], currently in its seventh edition, identifies 49 different processes for effectively managing a single project in compliance with the time, cost, and quality desired. Managing integration between different projects requires more than that. For this purpose, the Project Management Institute (PMI) introduces the concepts of “program” (i.e., a set of correlated and interrelated projects), as well as “program management” (i.e., the set of additional processes, methods, and techniques that are all necessary to achieve an integrated management of the projects contained in a program). So, project management focuses on the single project initiative while program management deals with the integrated management of multiple correlated projects, starting from the assumption that managing the integration requires specific processes and can generate additional value.
In this scenario, starting from the proposal of a Smart city integrated model [13], the goal of this research is to investigate the need for program management in a Smart city context and thus the potential benefits derived from using it. It also evaluates the actual level of integration along the two dimensions of a Smart city and the interdependency between smart projects.
To address this goal, the authors have carried out a retrospective analysis on a set of 378 [14] projects belonging to nine different Italian Smart cities. The results obtained show the lack of integration between smart projects and motivate the adoption of what we define as “Smart program management” (i.e., the integrated management of a program containing several smart projects in the context of a Smart city).
The paper is organized as follows: Section 2 briefly presents a general overview of Smart cities worldwide; Section 3 discusses related works; in Section 4 the program management approach is briefly sketched; Section 5 presents the Smart city integrated model and Section 6 introduces the Smart program management approach (i.e., a specialization of the program management approach tailored to the characteristics of a Smart city; Section 7 presents the research goals and questions along with the retrospective analysis planned, while Section 8 presents the data analysis carried out. Finally, Section 9, Section 10 and Section 11 respectively discuss the results, limitations of the work, and draw conclusions.

2. Smart City Worldwide Overview

The development of the Smart City paradigm has seen in recent years, the implementation of various international and national initiatives. There are several cases of Smart cities and all are examples of how a city of any size can be made more efficient, clean, livable, and functional. Citizens or social organizations, new technologies, and business or public administrations are all actors that should contribute together to the design and development of a Smart city. The role assigned to these actors makes a difference.
In a worldwide Smart city ranking [15], 102 cities were selected and classified according to a series of indicators, including social inclusion, environment, technological innovation, infrastructure, services to citizens and businesses, entertainment, cultural offer, problems management such as pollution, waste and supply of energy, and water resources.
Singapore is the world’s smartest city that adapts to smart technology integration, especially for its high scores on safety, air quality, and low congestion.
In second position is Zurich, the first European city that shows high scores for public transport, access to health services, and cultural offerings. Oslo follows Zurich in third, developing an advanced and widespread circular economy, experimenting with electronic e-voting systems (i.e., government), and mobility based on cycling rather than private cars.
The first of the Italian cities is Bologna (18th), followed by Milan (22nd), and then Rome, which occupies the 77th position in the ranking.
It can be seen that the size of the cities does not affect the ranking, indeed the top 20 Smart cities are small to medium centers: Copenhagen, Auckland, Taipei, Helsinki, Dusseldofr, Vancouver, Montreal. This is because in large cities the distances between public administrations and citizens are enormous. Consequently, it emerges that there is no confrontation and dialogue between the parties and many of the technological solutions that are adopted remain almost unknown to those who should reap the benefits, that is, the citizens. There is a large number of Smart city applications and platforms already available, but they are either not known to the general public, are not active or are not used.
Following this worldwide analysis, we focused our attention on the Italian context and carried out a detailed analysis with reference to the Smart Index [16].

3. Related Works

Smart city is a wide concept that involves technological, economic, and social improvement fueled by technologies based on sensors, big data, open data, new ways of connectivity, and exchange of information [17]. This concept is used worldwide with different nomenclatures, contexts, and meanings and includes several definitions adopted in both practical and academic scenarios [18], such as intelligent city, knowledge city, ubiquitous city, sustainable city, digital city, virtual city, etc., depending on the perceived meaning of the word “smart”. For example, Albino et al. [19] identified 23 different definitions proposed in literature for the term.
However, by analyzing and abstracting the different definitions, common aspects arise: the existence of a layered architecture, the existence of several application domains that coexist in a Smart city such as environment, people, mobility, etc., and the use of information and communication technology ICT_ as the glue element and enabling factor.
This word is increasingly used to refer to resource optimization through the use of advanced technologies [20,21] to create benefits for citizens in terms of well-being, inclusion and participation, environmental quality, and intelligent development [22,23]. Quality of life represents the basic component of a Smart city and all the actions taken should have the objective of raising the quality of life [24,25].
Consequently, this approach pushes towards adapting city services to the behavior of its inhabitants and enables the optimal use of available physical infrastructures and resources [26,27]. A better comprehension of urban infrastructures—as the systems that provide energy, water, food, safety, waste management, transportation, and public spaces—is essential to move from data to information, knowledge, and finally, action for urban sustainability and human well-being [28]. This objective can be pursued by developing an urban infrastructure that provides unified, secure [29], simple, and economical access to a plethora of public services, thus unleashing potential synergies and increasing transparency to citizens [30].
Both the necessity to implement many complex tasks in the area of a Smart city, using complex and complicated technical infrastructure, as well as the need to link the function of such an infrastructure with non-technical factors, require the development of a comprehensive model of intelligent city management [31]. Information and communication technology (ICT) and related emerging technology frameworks such as Internet of Things (IoT) [32], cyber physical systems (CPS), and big data are enabling keys for transforming traditional cities to Smart cities [3].
As a result, governments have started to gather and deploy data more effectively [33,34] in order to enhance the development and the sustainability of Smart cities [35], thinking in terms of strategic planning over days, hours, and minutes, rather than years, decades or generations [36].
City managers require a political understanding of technology and a focus on both economic gains and other public values to make a city smarter. They should consider the content of government actions as the production of better outcomes of policies in wealth, health, and sustainability and, at the same time, the process of governance as an innovative way of decision-making, administration, citizen participation, and even innovative forms of collaboration through the use of information and communication technologies [37]. Several models were proposed for evaluating, supporting decision assumptions, and planning, such as approaches based on fuzzy logic which offer a more extended comprehension, both for the decision makers as well as citizens, without yielding to competencies and personal subjectivity [1]; an indicator of how small or large the spectrum of vertical domains is in a Smart city which has developed projects and consolidated best practices, and reveals the improvement of Smart city initiatives in different application domains such as social, geographic, demographic, and environmental sectors [38]; a list of indicators to support the triple helix model in order to measure the performances of Smart city components [39].
A review of the literature has highlighted the effort spent in evolving towards the smart concept. However, at the same time, there are difficulties in managing projects in an integrated manner in order to maximize the benefits. Moreover, there is a gap between strategy applied and projects carried out for moving towards a Smart city, as well as a lack of alignment and integration between them. Therefore, it is necessary to manage the interdependence between projects as well as the correlation between strategy and execution, in order to obtain an integrated vision.
To manage this additional complexity, the Project Management Institute has over-structured management levels by introducing the concept of program management, whose logic is to increase the overall value of projects thanks to the exploitation of interdependencies between projects. In this case, therefore, the total value generated by the program goes well beyond the sum of the value of the individual projects. In the case of Smart cities, as mentioned above, the integration must be carried out along at least two distinct dimensions, application domains, and technology layers, and the program management must therefore be appropriately specialized.

4. Program Management

The Project Management Institute (PMI) defines a “Program” as related projects, subsidiary programs, and program activities managed in a coordinated manner to obtain benefits not available from managing them individually [40].
Programs are primarily conducted to provide benefits to sponsoring organizations or members of the sponsoring organization. They deliver the expected benefits through component projects and subsidiary programs that are carried out to produce outputs and results. Components of a program are connected through the achievements of complementary objectives, each of which contribute to achieving global benefits. The activities carried out for an adequate benefit management require that goals be correctly linked with the corporate strategy, the identification of tangible and intangible benefits, the mapping, profiling and classification of benefits, and the evaluation of their impact on stakeholders. The definitions of criteria and metrics for measuring benefits and managing risks and critical issues are also critical. Furthermore, such metrics can be identified and collected through various types of methods that entice statistical process control [41,42].
In order to achieve these objectives program management operates along five performance dimensions:
  • Program strategy alignment: identifies program outputs and outcomes to provide benefits aligned with the organization’s strategic goals and objectives.
  • Program benefits management: comprises a number of elements that are central to a program’s success. The purpose is to focus program stakeholders on the outcomes and benefits provided by the various activities conducted during program execution.
  • Program stakeholder engagement: identifies and evaluates stakeholder needs, mitigates the resistance, and manages expectations and communications to encourage stakeholder support.
  • Program governance: enables and performs program decision making, establishes practices to support the program, and maintains program oversight.
  • Program life cycle management: is the performance dimension that manages program activities required in order to ensure the realization of benefits according to five steps: (i) start: definition of the projects that realize (comprise) the program; (ii) planning: definition of the scope and development of the program, including all projects and all activities that occur during its execution; (iii) execution: the work needed to achieve the objectives and program benefits; (iv) control: monitoring progress, updating program plans, and managing change and risk; (v) closure: the finalization of all activities, including all component projects, the execution of the transition plan, archiving, obtaining approvals, and reporting.
Using program management exploits the synergies that can be activated between different projects to the benefit of the program and its stakeholders, thus obtaining benefits not obtainable otherwise by managing projects individually, regardless of how virtuous it may be. Program management means being able to identify areas of potential reuse between different projects, optimizing the use of resources (personnel, budgets, etc.), sharing semi-finished and entire deliverables, ensuring that the objectives of a single project can contribute to achieving the objectives of the remaining projects belonging to the program, supporting decision making, and defining common governance practices.

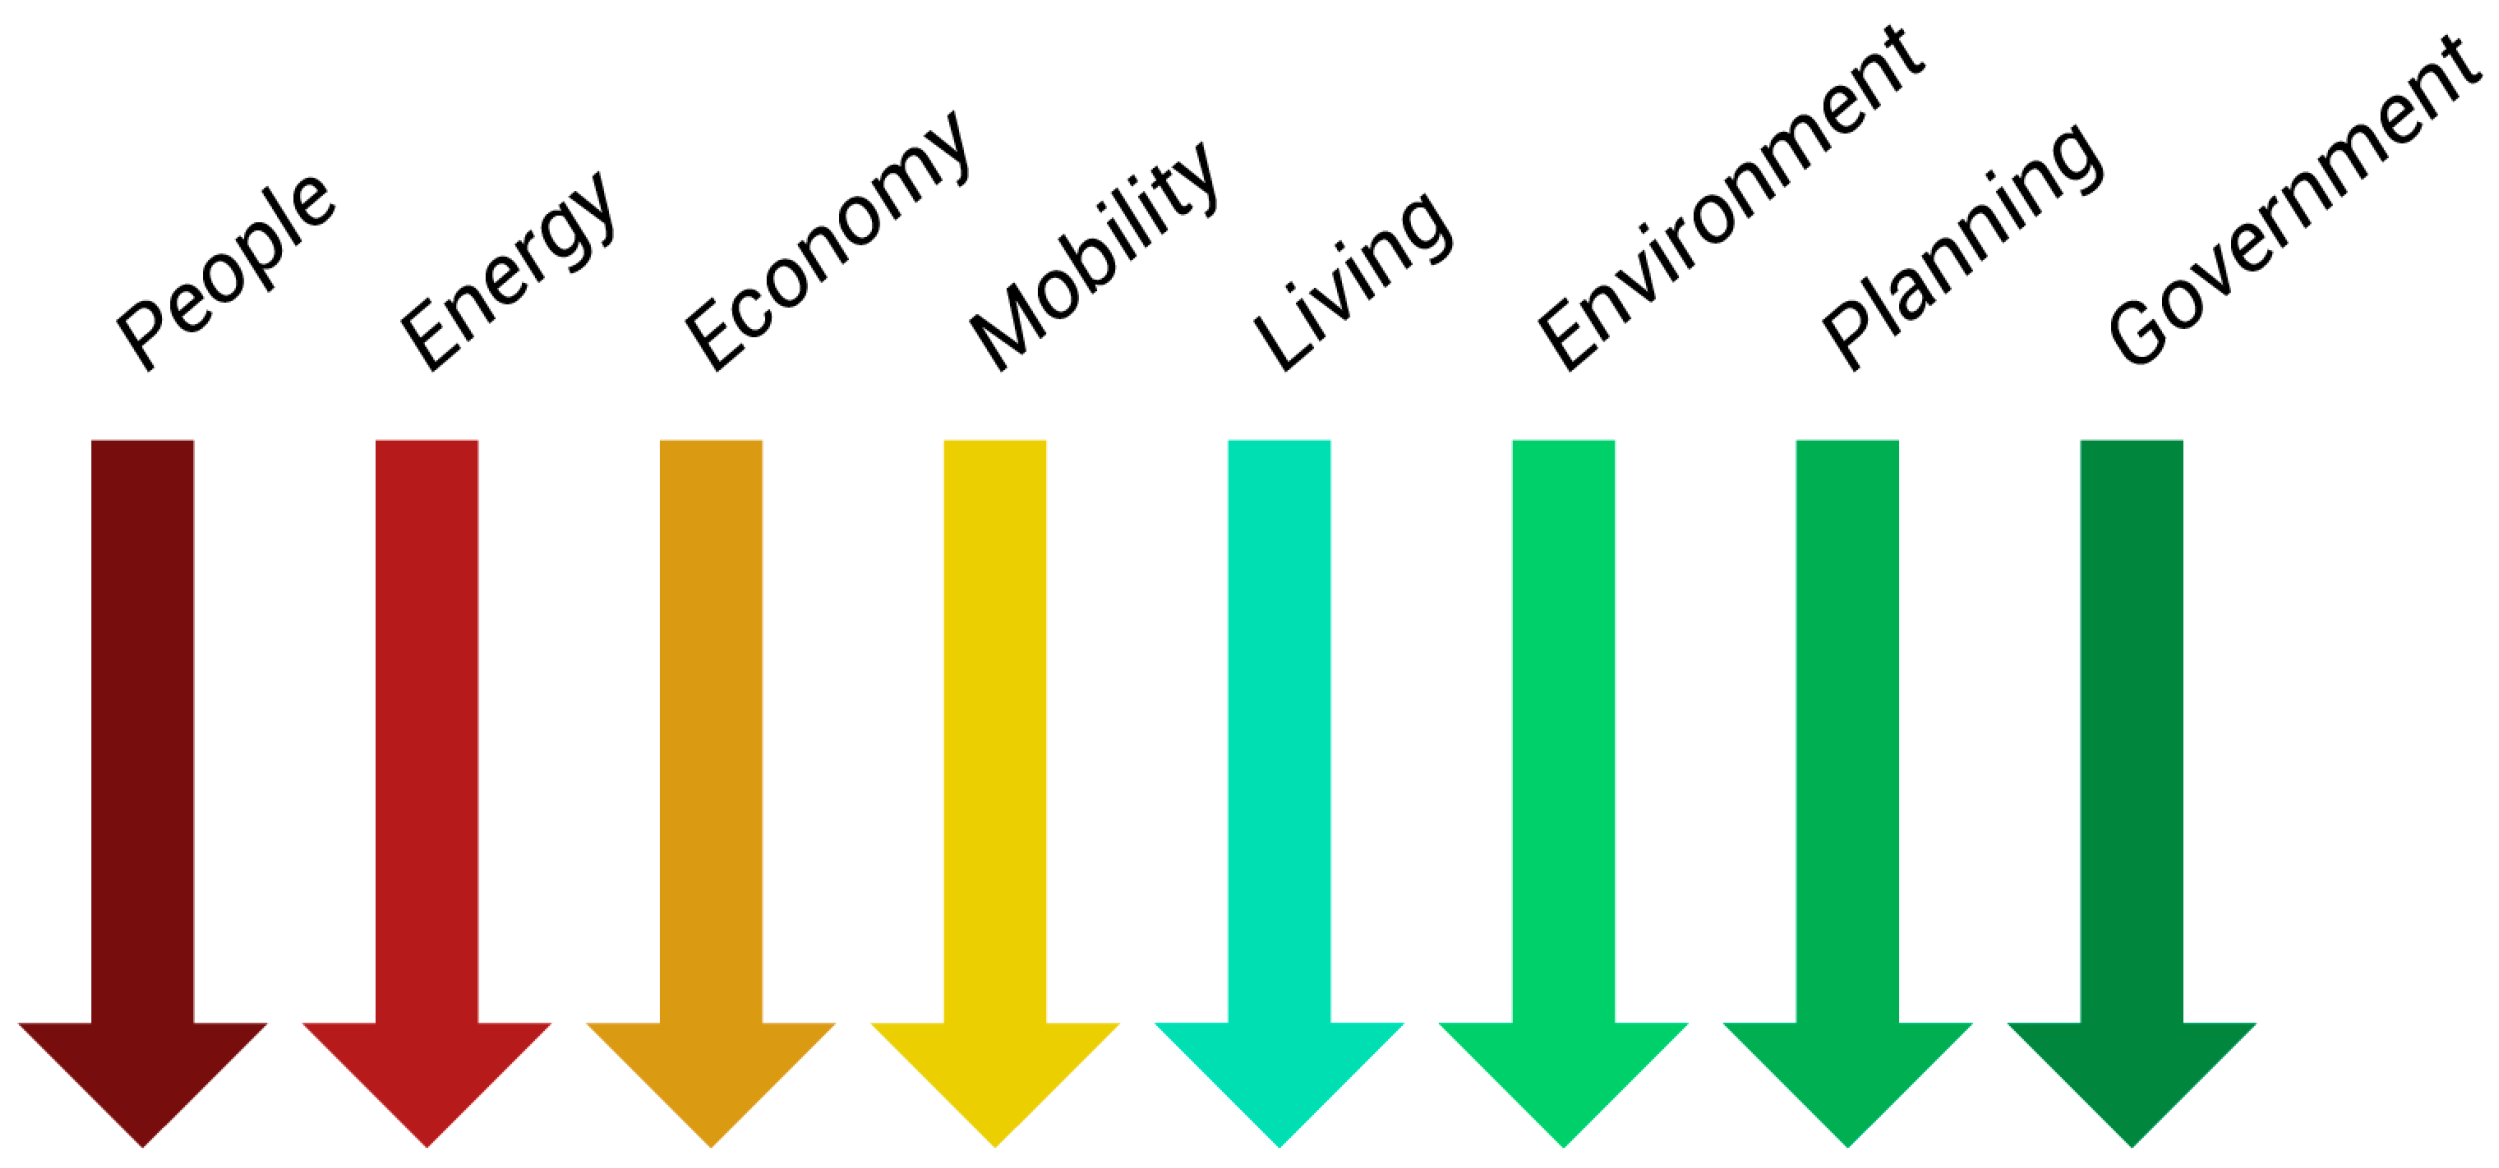
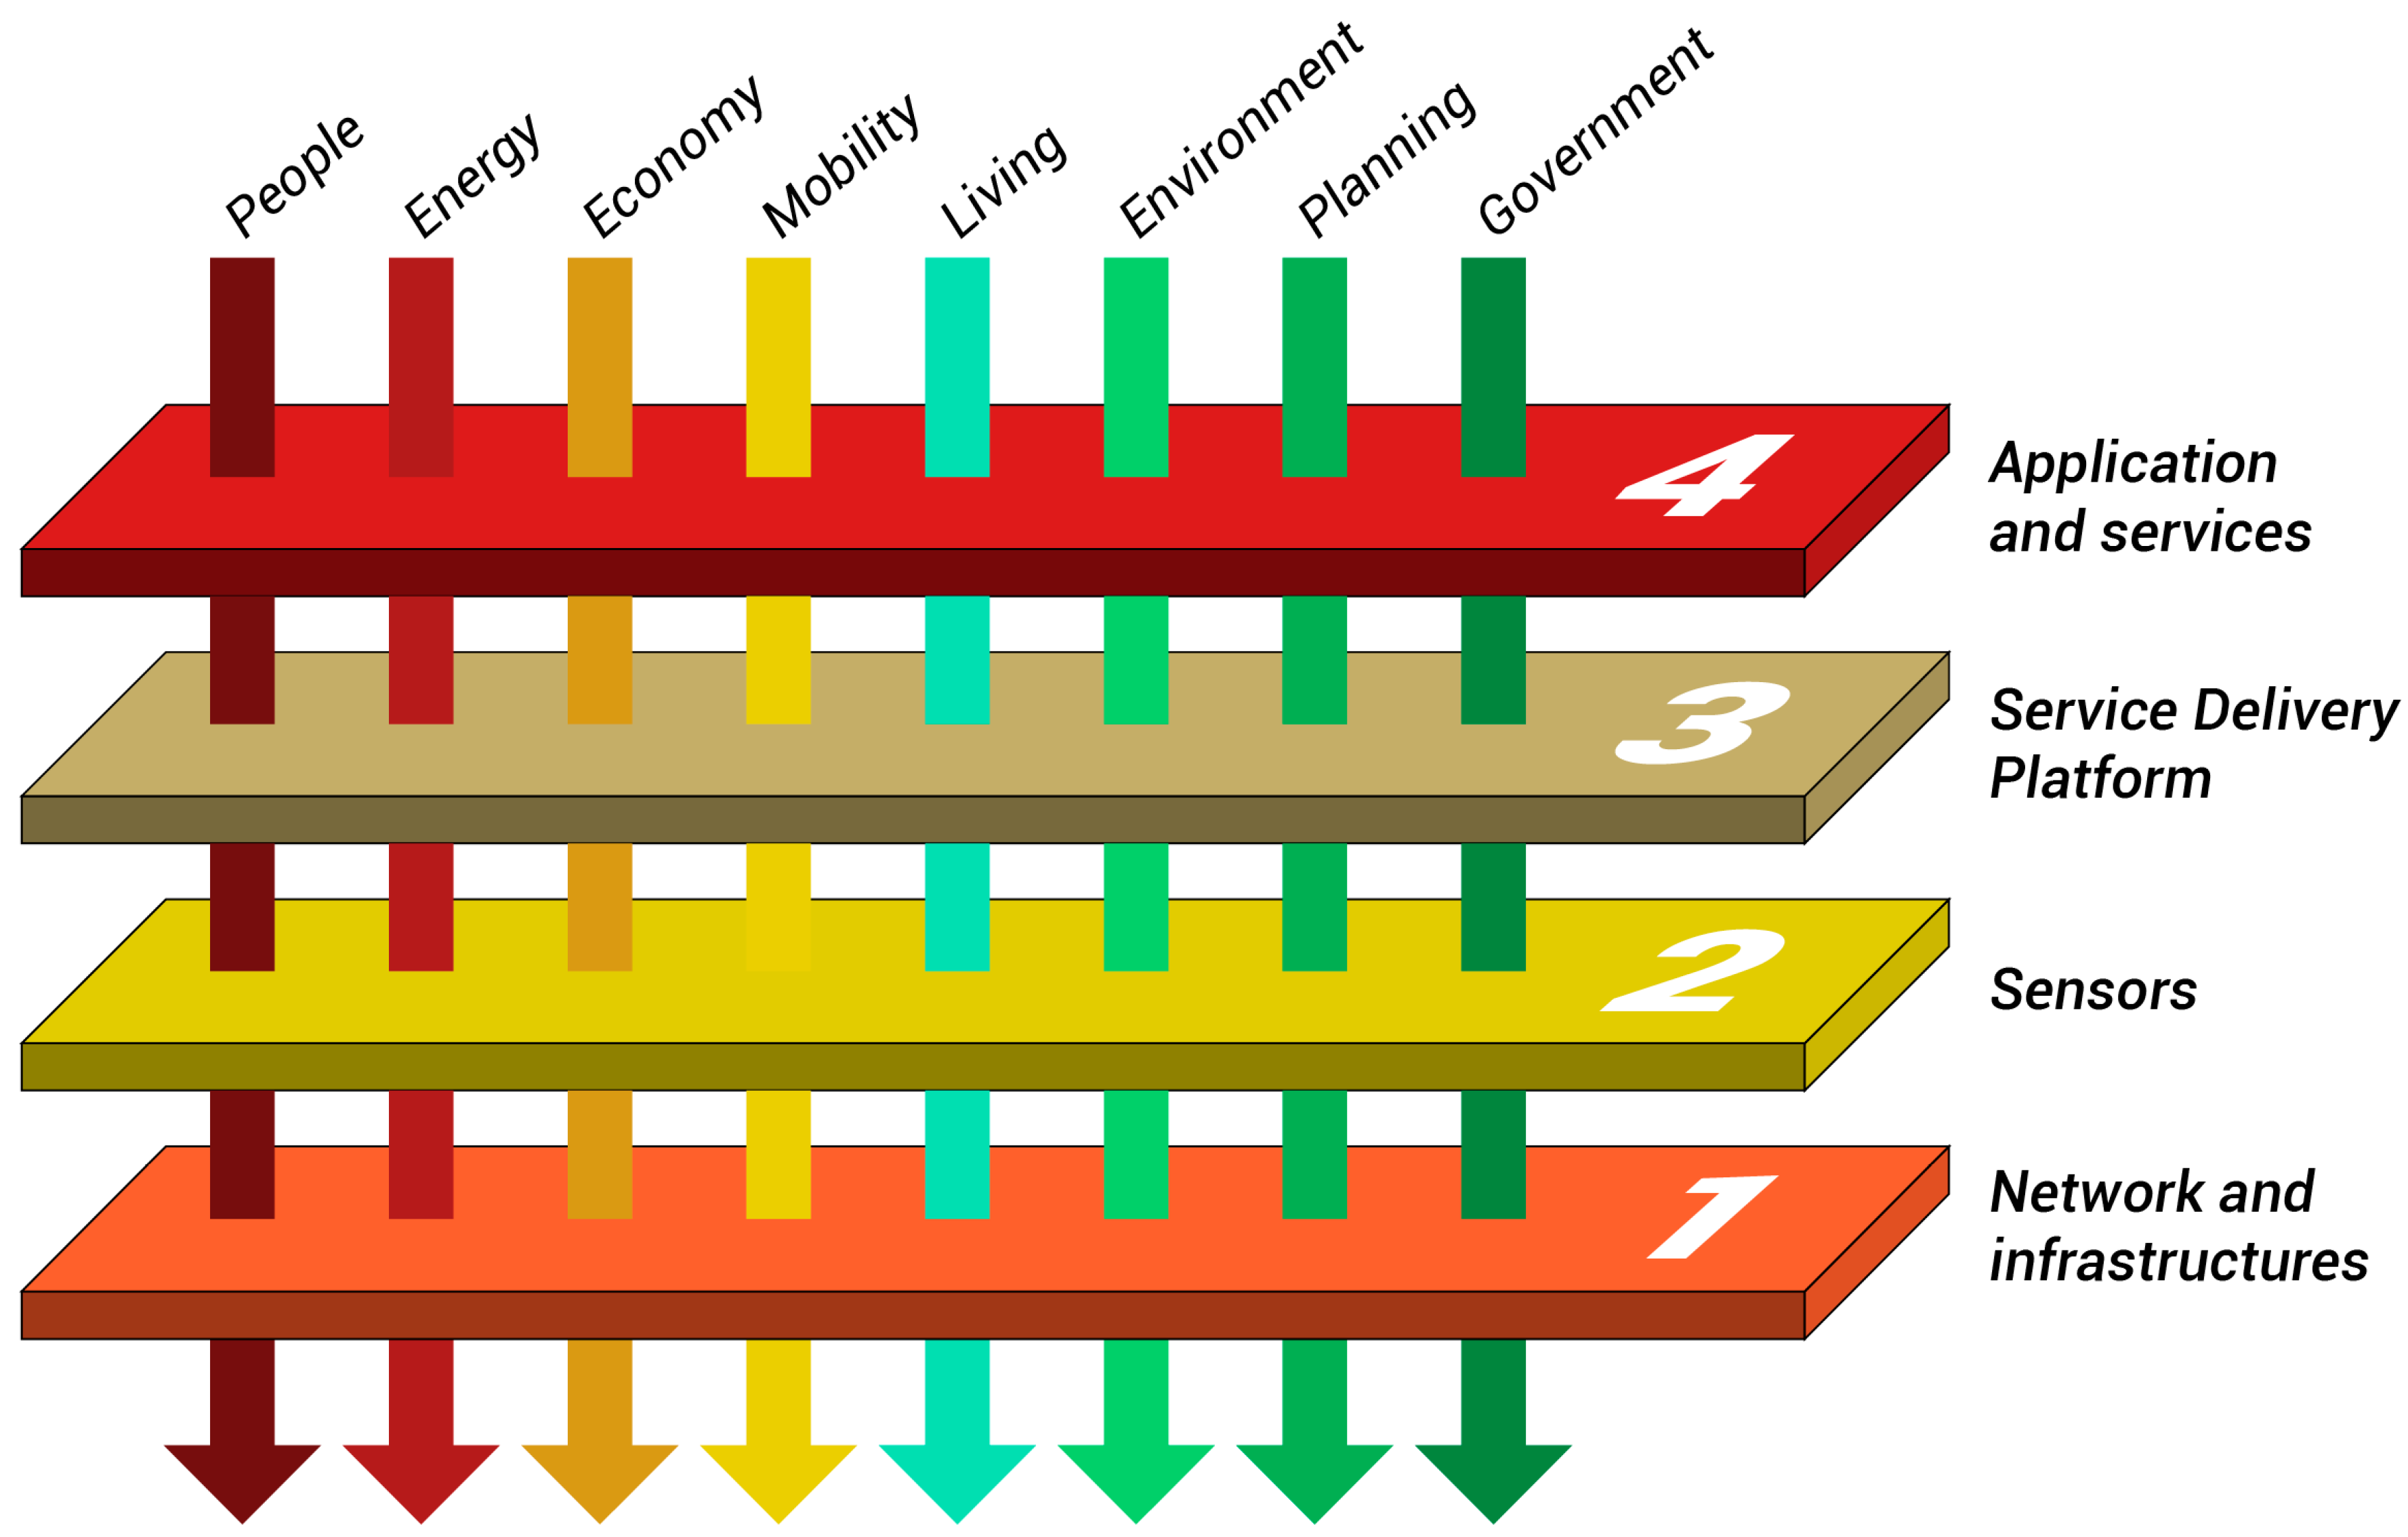
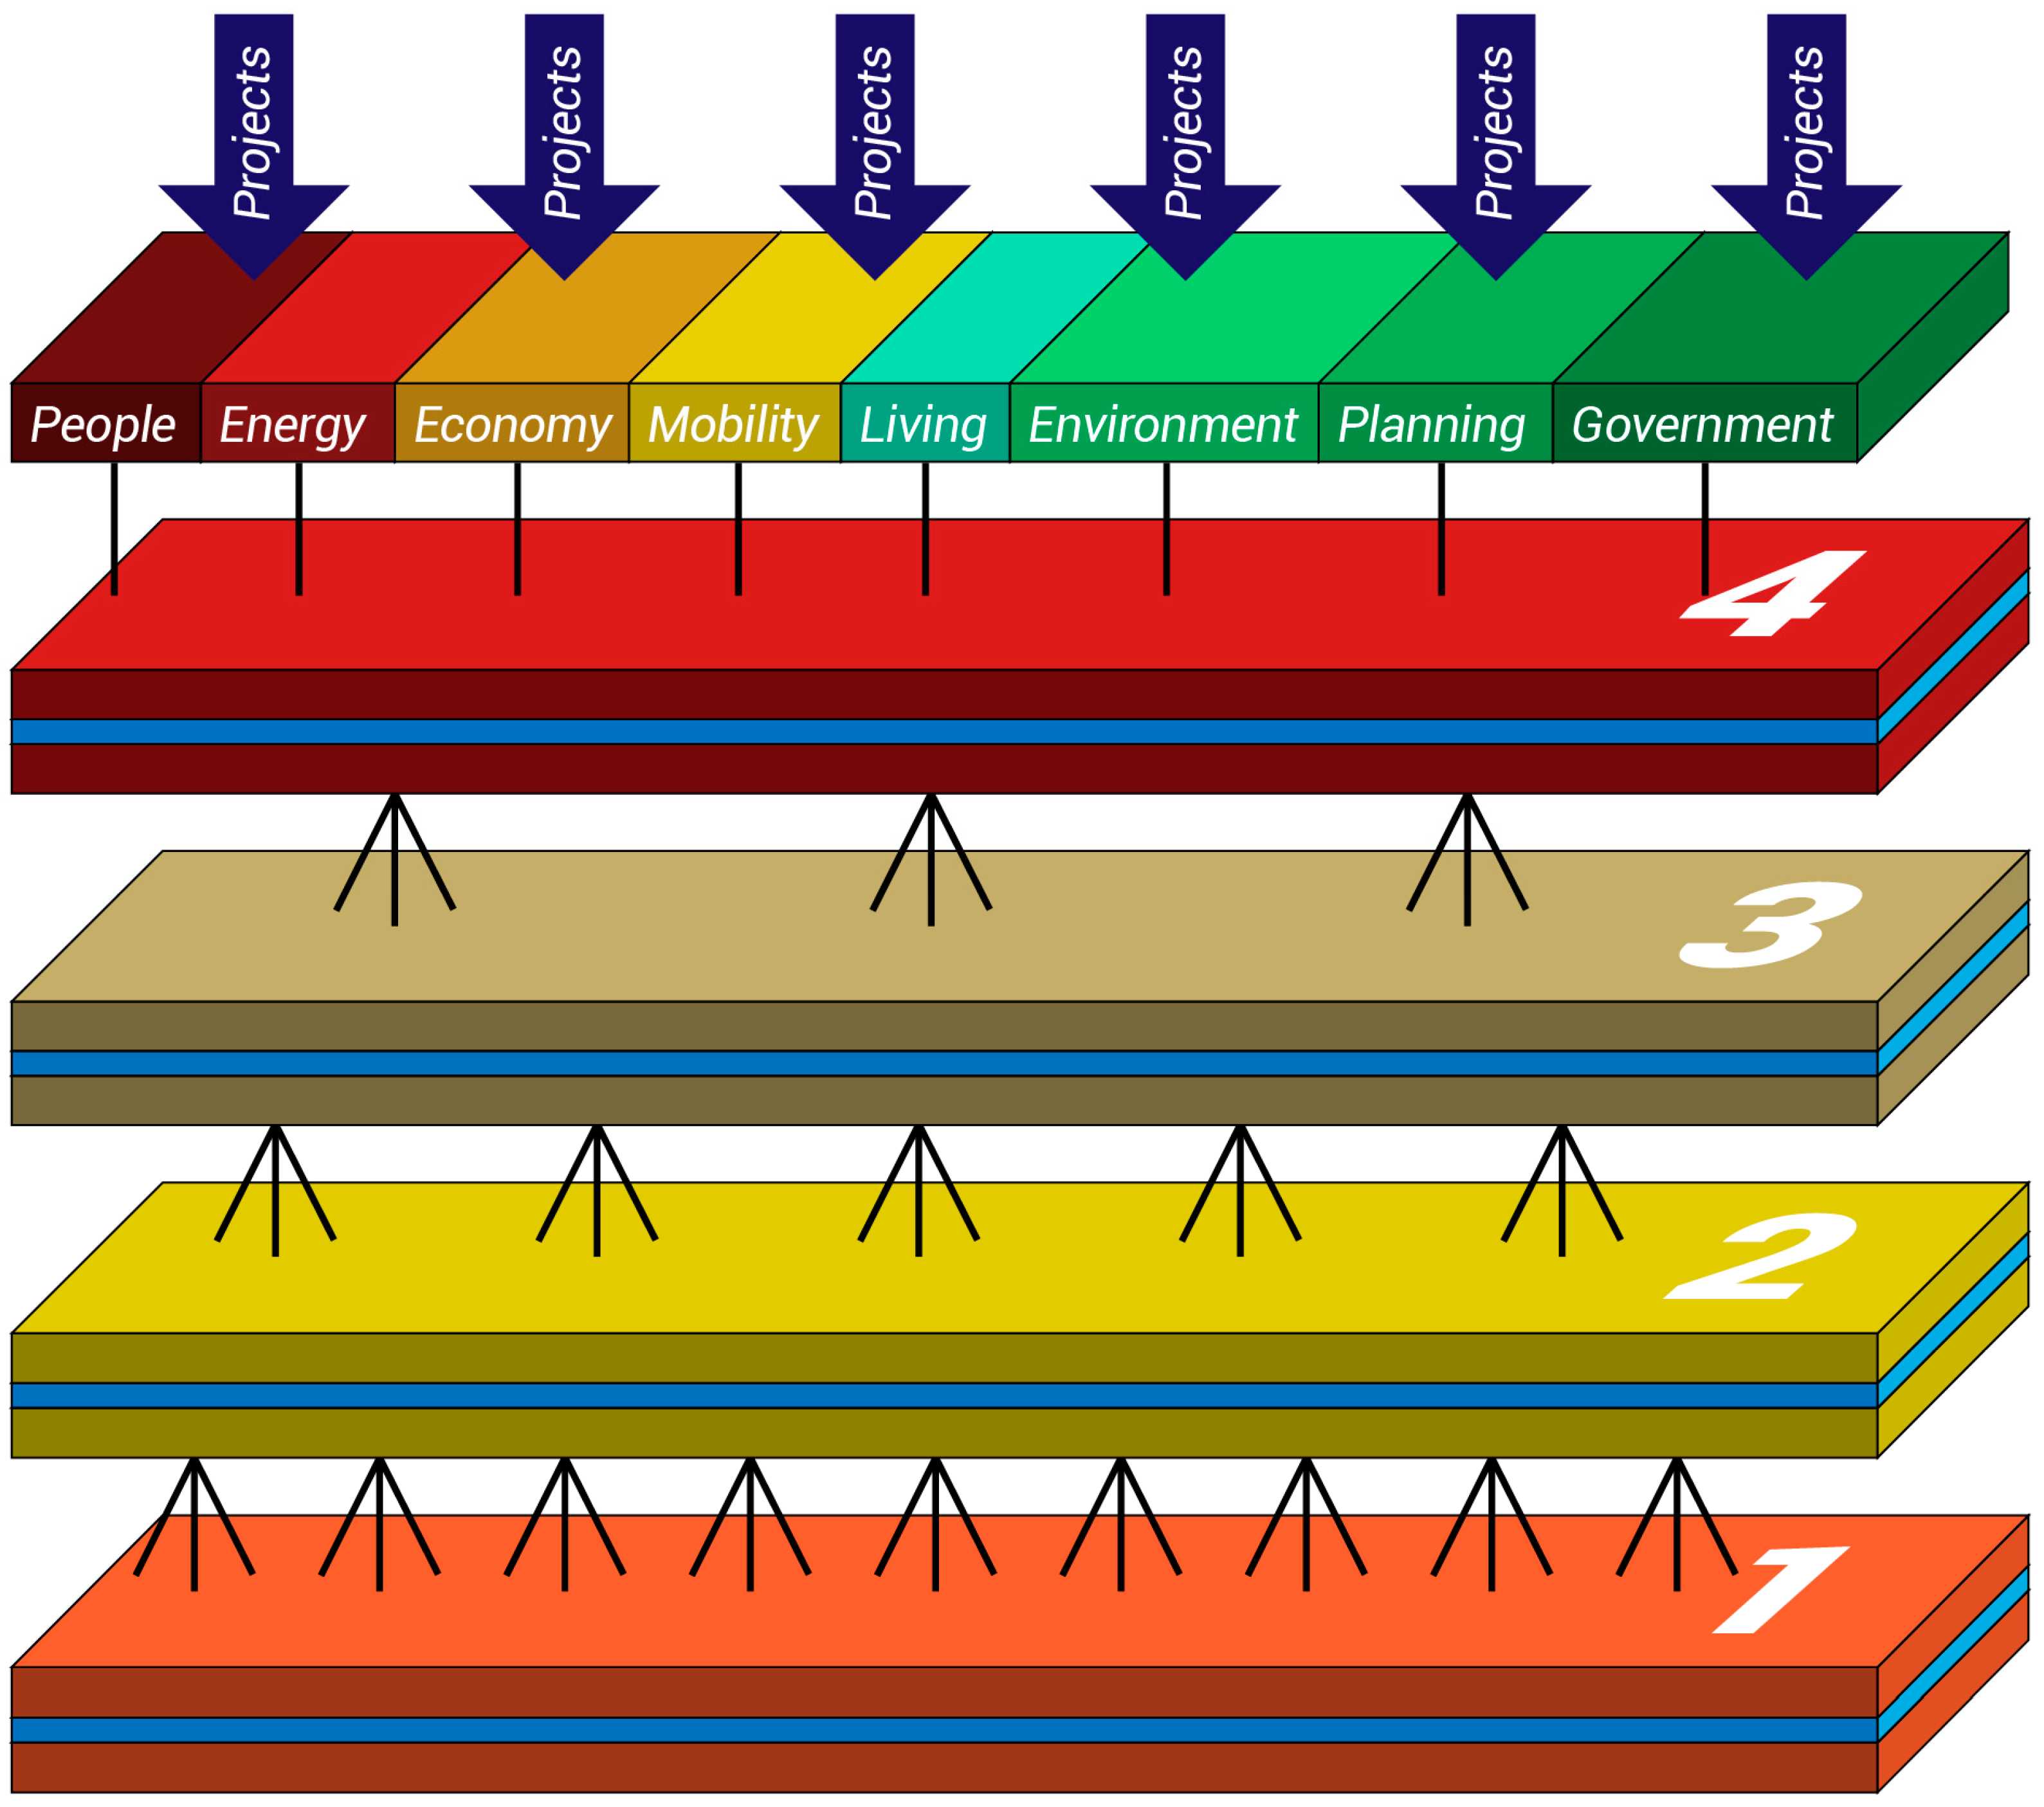
5. The Smart City Integrated Model

The Smart city is an abstract projection of future communities, an application and conceptual perimeter defined by a set of needs that find answers in technologies, services, and applications that refer to different domains. The Smart city domains involve almost all sciences, which approach this phenomenon from different perspectives [43] and take into consideration not only “hard domains” but also “soft domains” [38] that do not necessarily imply the application of ICT but represent crucial aspects of the urban, social, and economic development of a city, such as human capital, education, culture, policy innovations, social inclusion, and government [19,44]. However, the most general conceptual approach to a Smart city includes six dimensions that are common to several already proposed models: people, government, economy, mobility, environment, and living [45] that play a fundamental role in the design of a Smart city strategy [46]. Increasing environmental consciousness, urbanization, and technological development has led to the need to rethink how to construct and manage cities, converging under the concept of Smart sustainable cities [47]. A general goal of Smart cities is to improve sustainability with the help of technologies [48] analyzing the indicators of the frameworks adopted to evaluate both sustainable and smart urban performances.
An analysis of different definitions, models, and approaches highlights some common aspects of Smart cities; or rather, the existence of a layered architecture [49] and the use of ICT as the glue element and enabling factor. These considerations allow to conceptually organize a Smart city based on a two-dimensional integrated model: horizontal dimension and vertical dimension.
The horizontal dimension represents a set of four overlapping technological layers (Figure 1):
  • Network and infrastructure: the construction of a Smart city is based on this layer which involves telecommunication, mobility, energy, and environment (layer 1).
  • Sensors: level centered on IoT in order to collect big data from connected objects in the city that capture data on infrastructure, environment, and user behavior (layer 2).
  • Service delivery platform: enables platforms able to elaborate and enhance the big data of the territory generated by the other layers in order to improve the existing services and create new ones (layer 3).
  • Application and services: layer of service applications, provided through mobile and web applications, which represent the interface with the end users (layer 4).
The vertical dimension includes the thematic areas or application domains in a Smart city (Figure 2). These domains are identified and described by Giffinger and Pichler-Milanović [12] and extended in a project conducted at the Vienna University of Technology [49]. In this research, according to the “Agenda Urbana” [14], the domains considered are: people, energy, economy, mobility, living, environment, planning, government.
The result of the interaction between technological layers and application domains (Figure 3) contributes to the development of a Smart city and its smart services. In this integrated model a smart project may interact with multiple application domains and span over several technological layers.

6. Smart Program Management

Smart projects are an opportunity to build new strategic hypotheses for the future of individual cities and offer a credible and stable perspective over the medium term to private and public investors. These visions must be reconciled and brought back to a common strategy and benefit by using an integrated governance. In such a scenario, there is a need for “Smart program management” which should involve a systemic logic able to encourage the integration among various initiatives regarding the reuse of common services and replica of successful experiences.
Unfortunately, what currently seems to occur in Smart cities is a little bit different. There are several projects implemented that are often redundant in the functionalities and services delivered, that do not share any common asset between each other and that design and develop functionalities and services which may already be available from previously executed projects. These projects (very) often lack integration between application domains (vertical dimension) and technological layers (horizontal dimension).
Consequently, program management may help to manage the interdependences between projects and the correlation between a defined strategy and its execution. Moreover, if we consider the two dimensions of the Smart city integrated model, adopting program management in the horizontal dimension may allow to obtain common and reusable assets, for any layer, where some elements from the layer below are used by the layer above, generating high value outputs. The layer “n” thus becomes an enabling platform for the layer “n + 1”. Similarly, the use of program management along the vertical dimension allows integrating and optimizing project execution and maximizes the overall benefits (Figure 4).
Rather than having several self-consistent and autonomous projects that appear like independent silos, with program management more can be done starting from already existing reusable pieces or artifacts that are produced in other projects.
Program management within a Smart city context needs to be smart too. As so, Smart Program Management represents an evolution of program management able to deal with the bi-dimensional complexity of a Smart city: application domains (vertical dimension) and technological layers (horizontal dimension).
Therefore, each of the five performance dimensions need to be further specialized in order to be effective:
  • Program Strategy Alignment
    • Vertical alignment: identifies program outputs and outcomes, also in terms of macro functionalities and business services, with respect to the different application domains of interest (related to the smart projects included in the program) to provide benefits aligned with the Smart city strategic goals and objectives.
    • Horizontal alignment: identifies program outputs and outcomes, in terms of ICT solutions adopted, enabling platforms and architectural components for each technological layer impacted by the projects included in the program, to provide benefits aligned with the Smart city technological vision and objectives.
  • Program Benefits Management
    • Vertical benefits: identify the overall benefits to be provided for each of the application domains impacted by the smart projects included in the program and further achievable benefits thanks to the domain integration.
    • Horizontal benefits: identify the technological benefits obtainable for each of the technological layers impacted by the smart projects included in the program and further achievable benefits thanks to the reuse and integration between layers.
  • Program Stakeholder Engagement
    • Vertical needs: identify and evaluate application domains-related stakeholder needs, mitigate the resistance to organizational changes; manage customer and user expectations, and communications to encourage stakeholder support.
    • Horizontal needs: identify and evaluate stakeholder technological needs, mitigate the resistance to technological changes and adoption; manage expectations of technology providers and adopters and communications to encourage stakeholder support.
  • Program Governance
    • Vertical governance: enables and performs application domain decision making in the program, establishes practices to support integration of application domains in the program, and maintains program oversight.
    • Horizontal governance: enables and performs technological levels-related decision making, establishes practices to support integration of technological layers in the program, and maintains program technological oversight.
  • Program life cycle management: each step of the program life cycle management identifies program activities along two dimensions (Table 1).

7. Retrospective Analysis

The previous sections advocate the use of Smart program management as a reasonable approach for managing the complexity of smart projects. The research goal addressed in this paper is to investigate the potential effectiveness and benefits of Smart program management in managing the interdependencies across the numerous projects of a Smart city. For this aim, we carried out a retrospective analysis on a total set of 378 projects belonging to nine different Italian Smart cities. The following steps were executed by a team of seven members: a PhD Student, four senior researchers, and two IT specialists from a private company. The research goal and questions were defined according to the Goal-Question-Metrics paradigm [25,50]. In the following, details of the retrospective analysis process are provided.
  • Definition of the research goal and questions
    Research goal: Analyze smart projects with the aim of characterizing them from a Smart program management point of view in the context of a Smart city.
    Research questions:
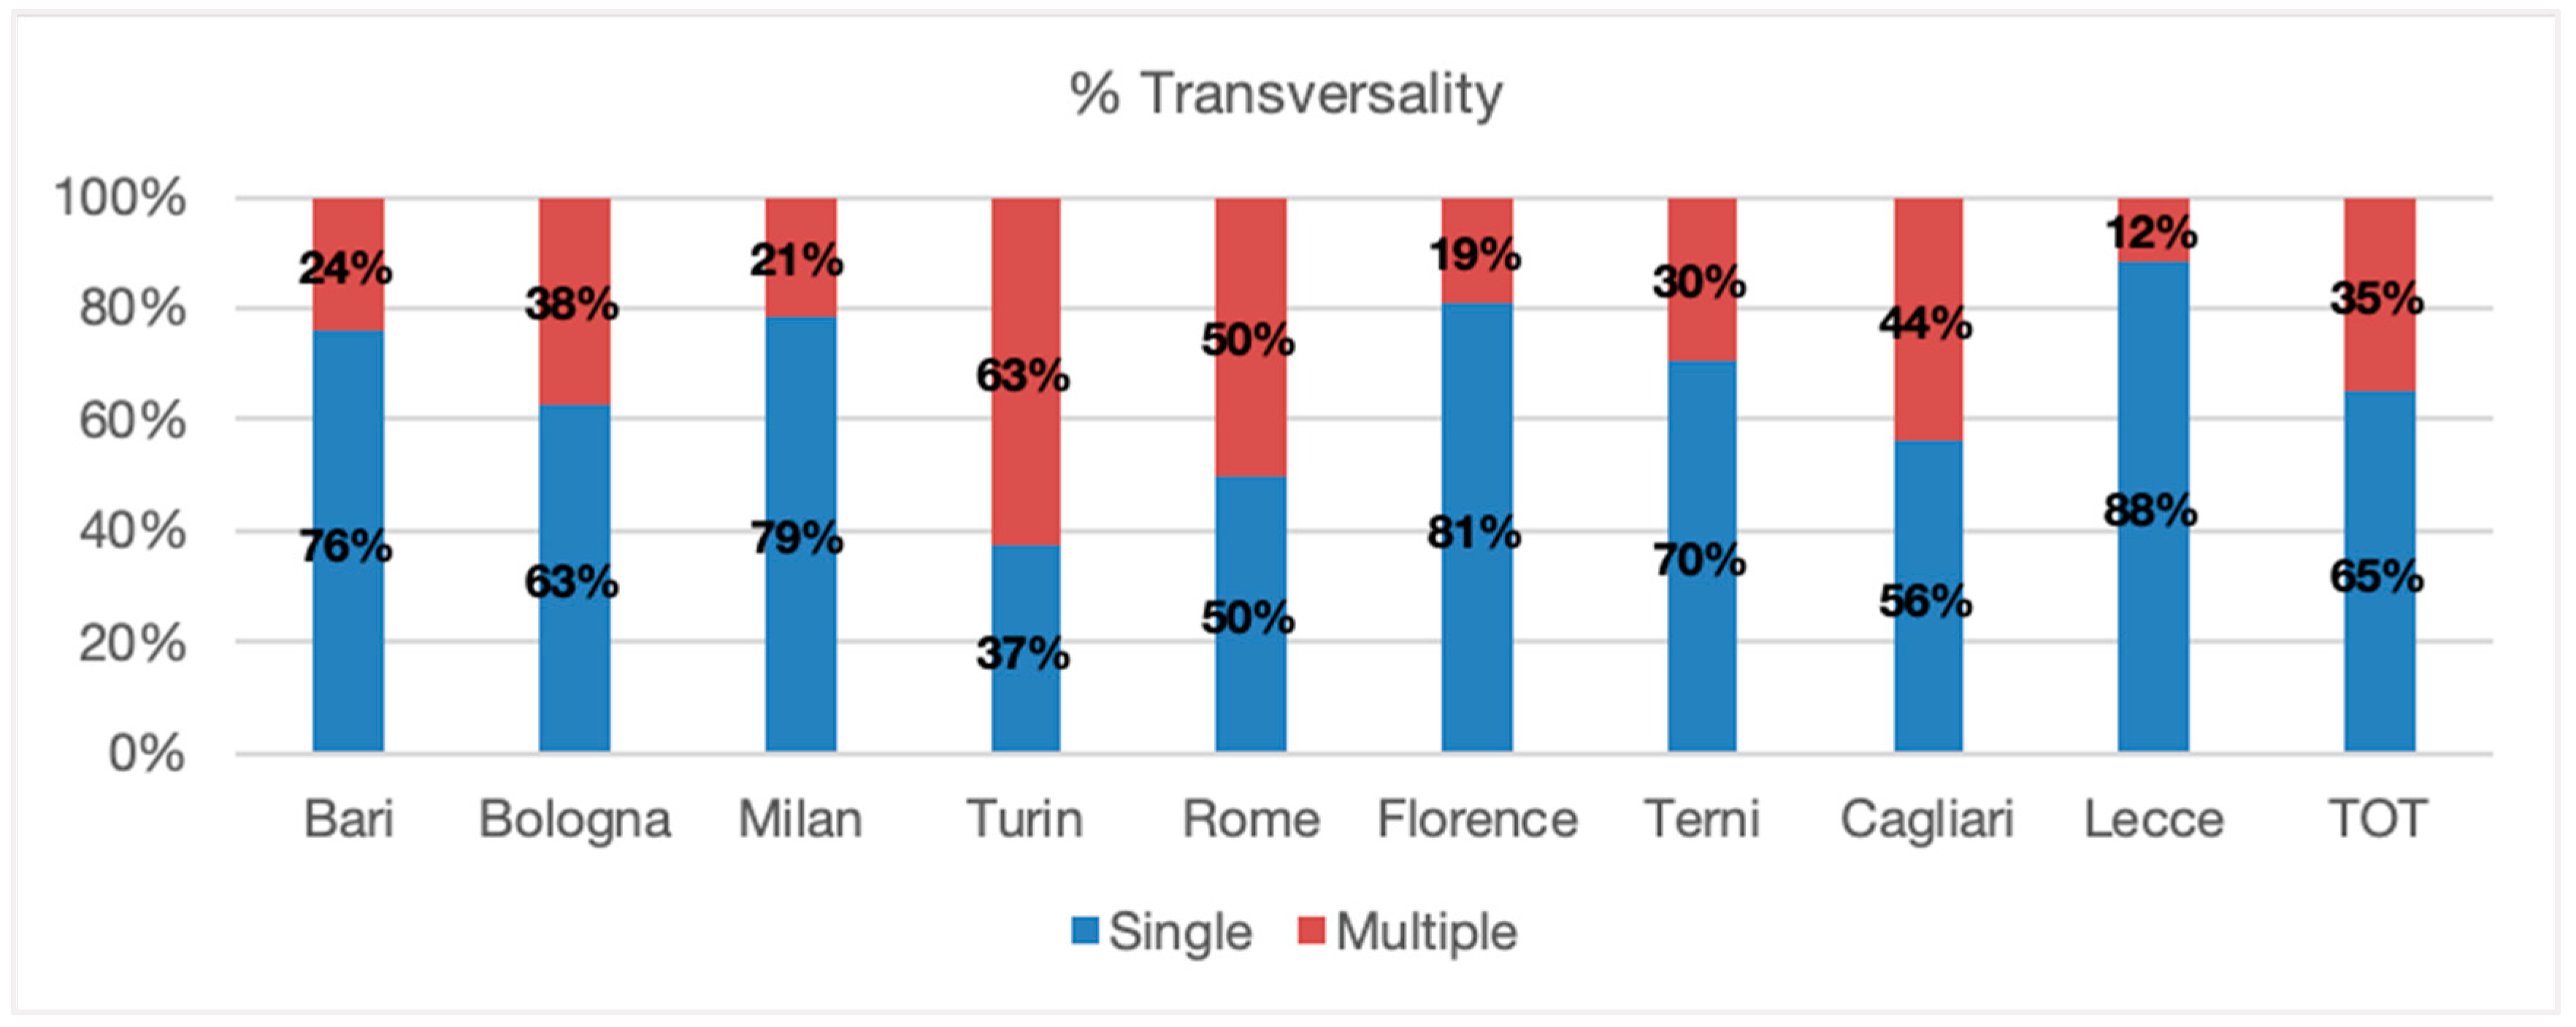
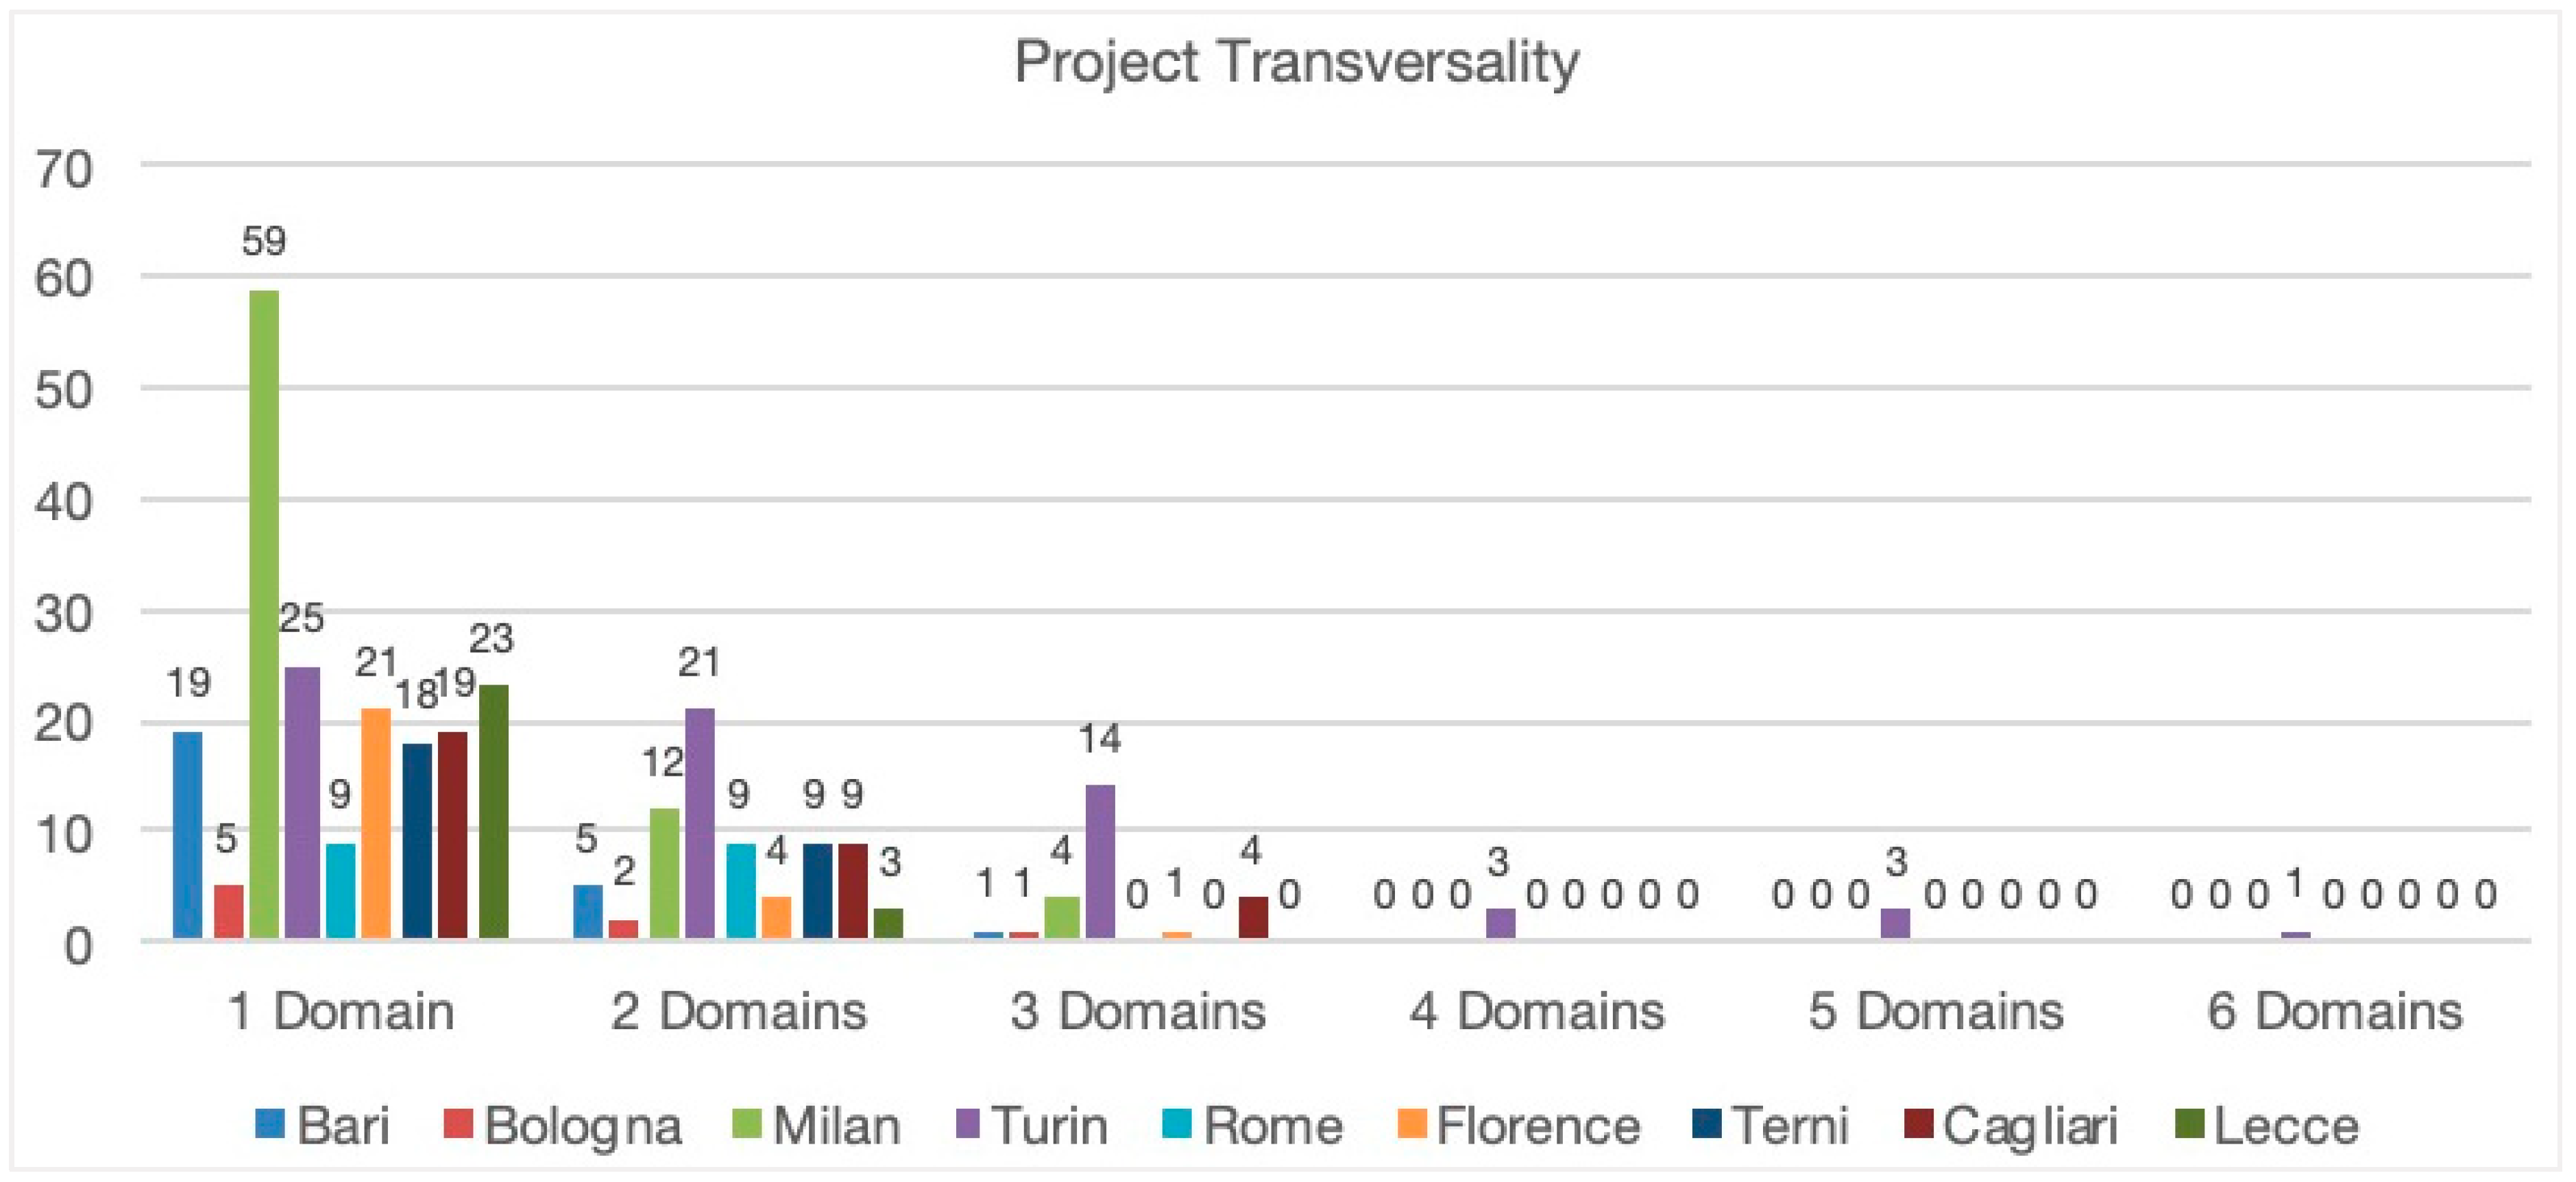
    • RQ1: What is the transversality of the smart projects?
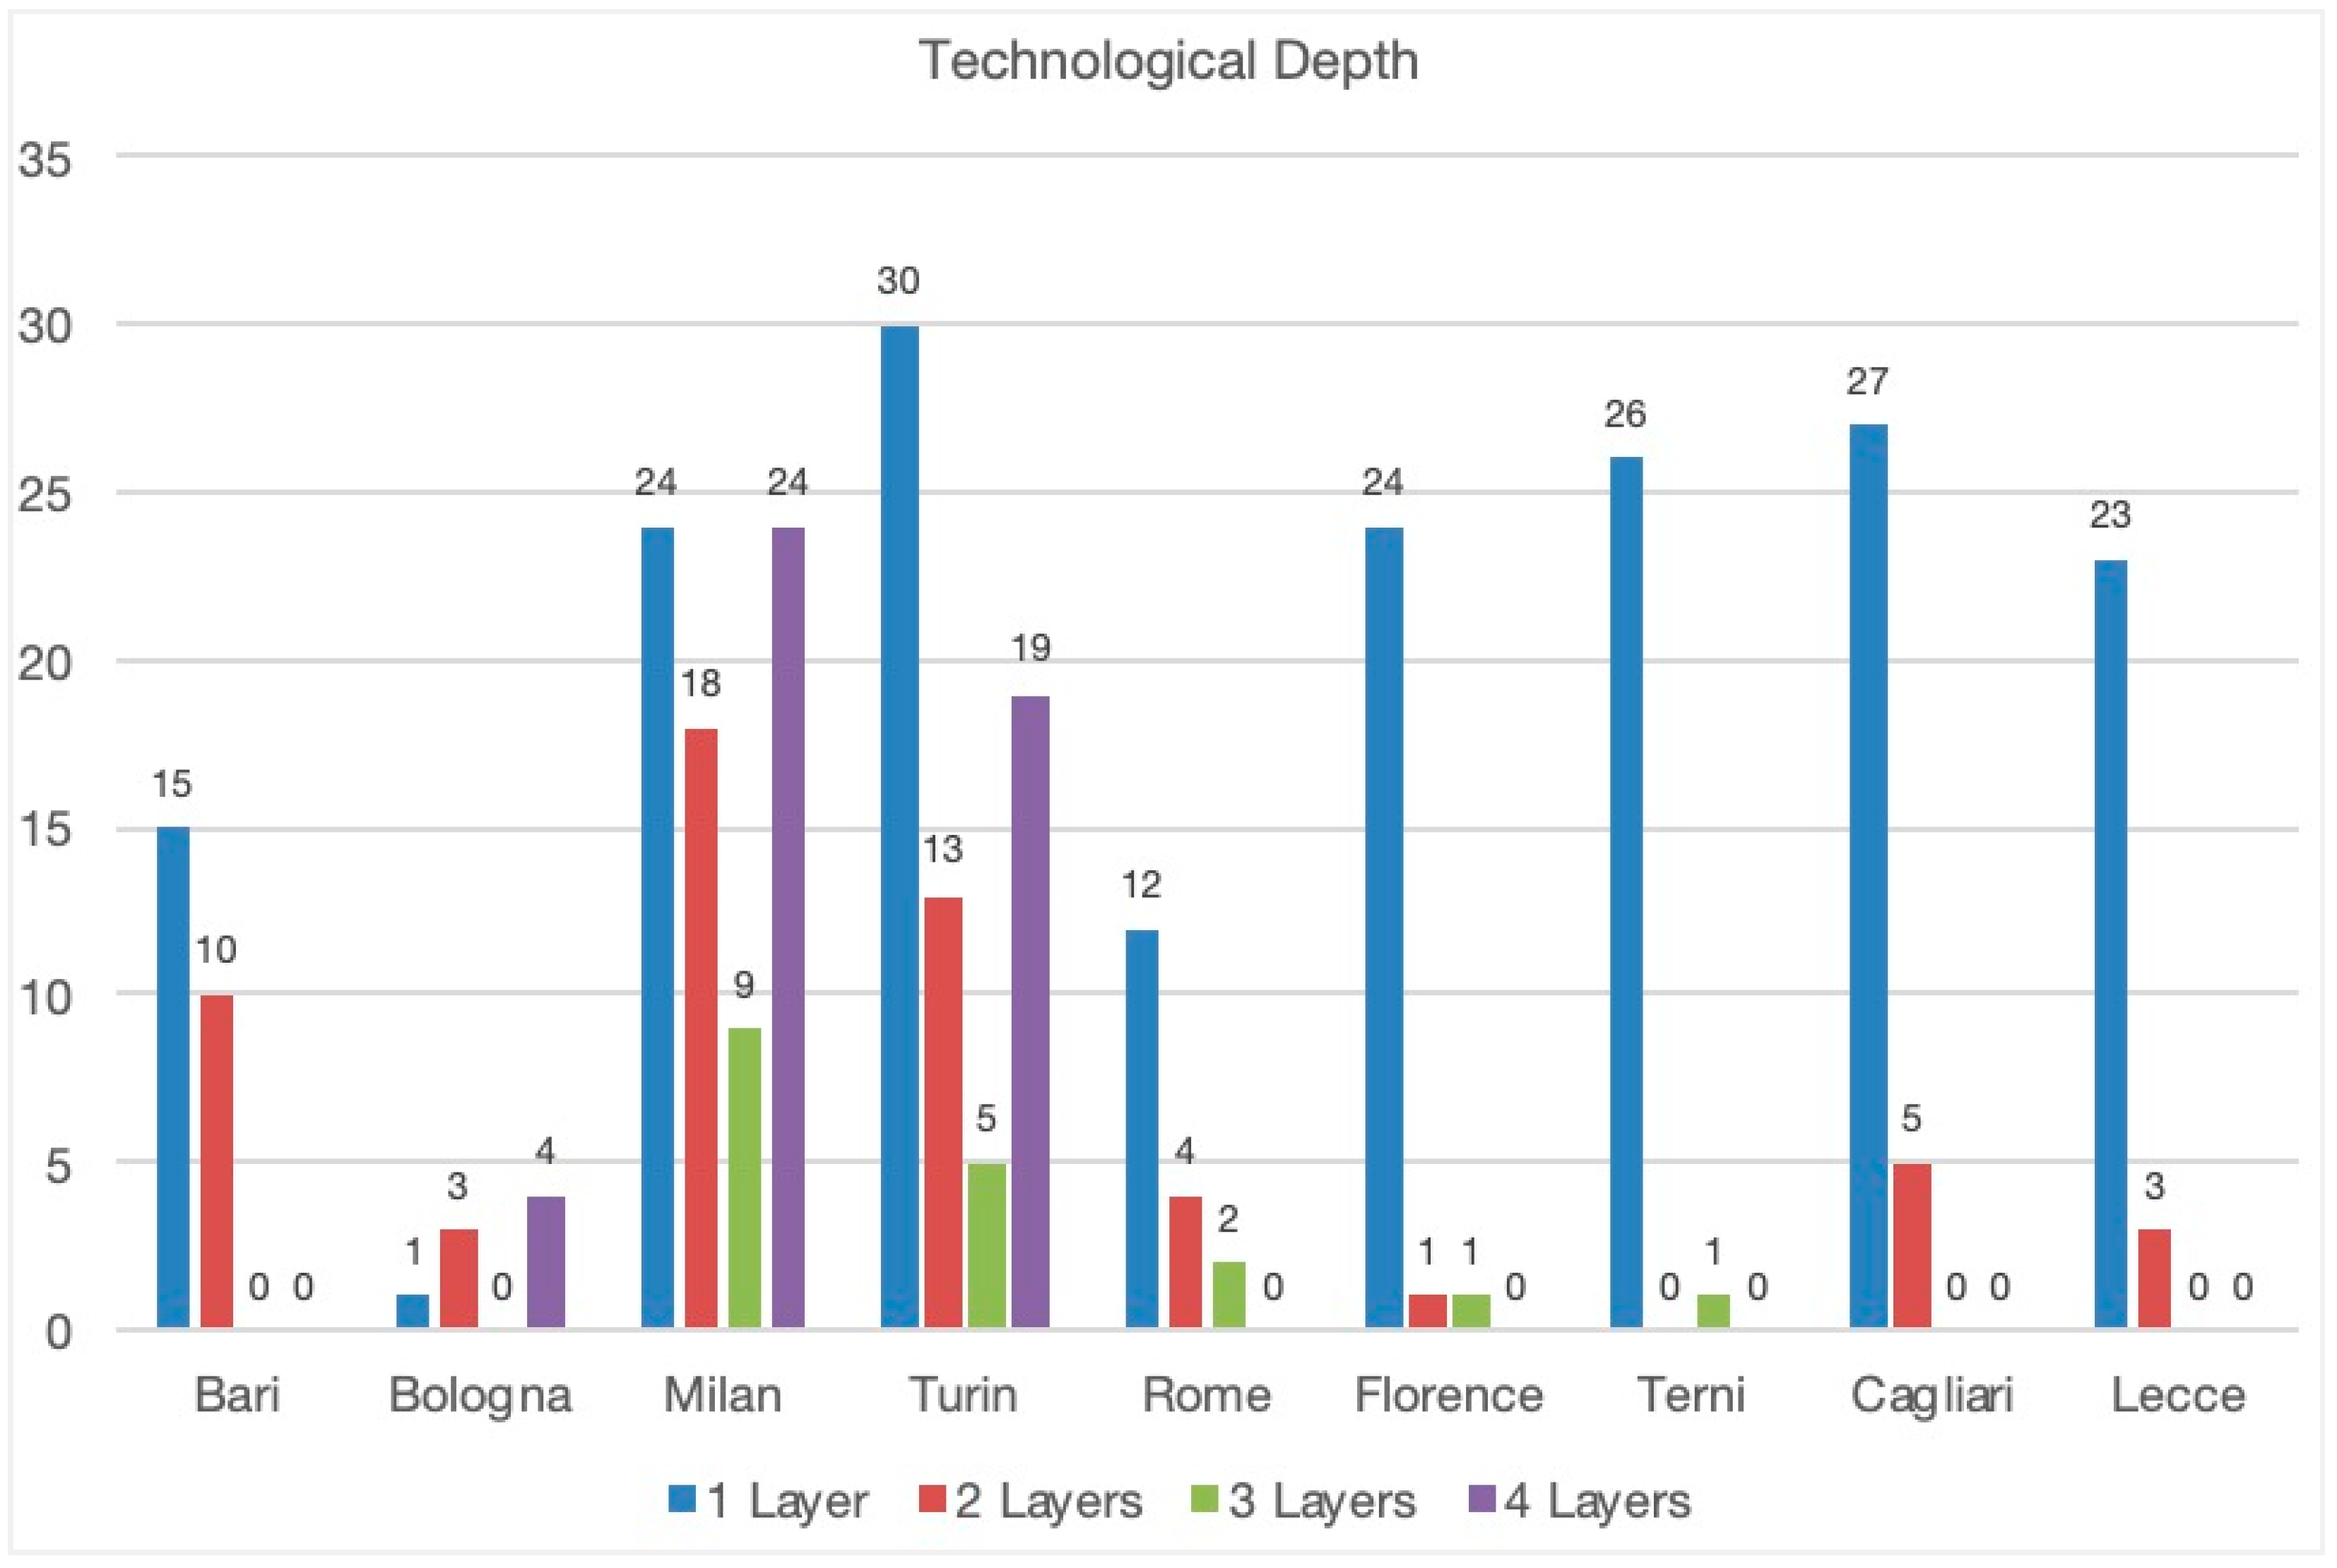
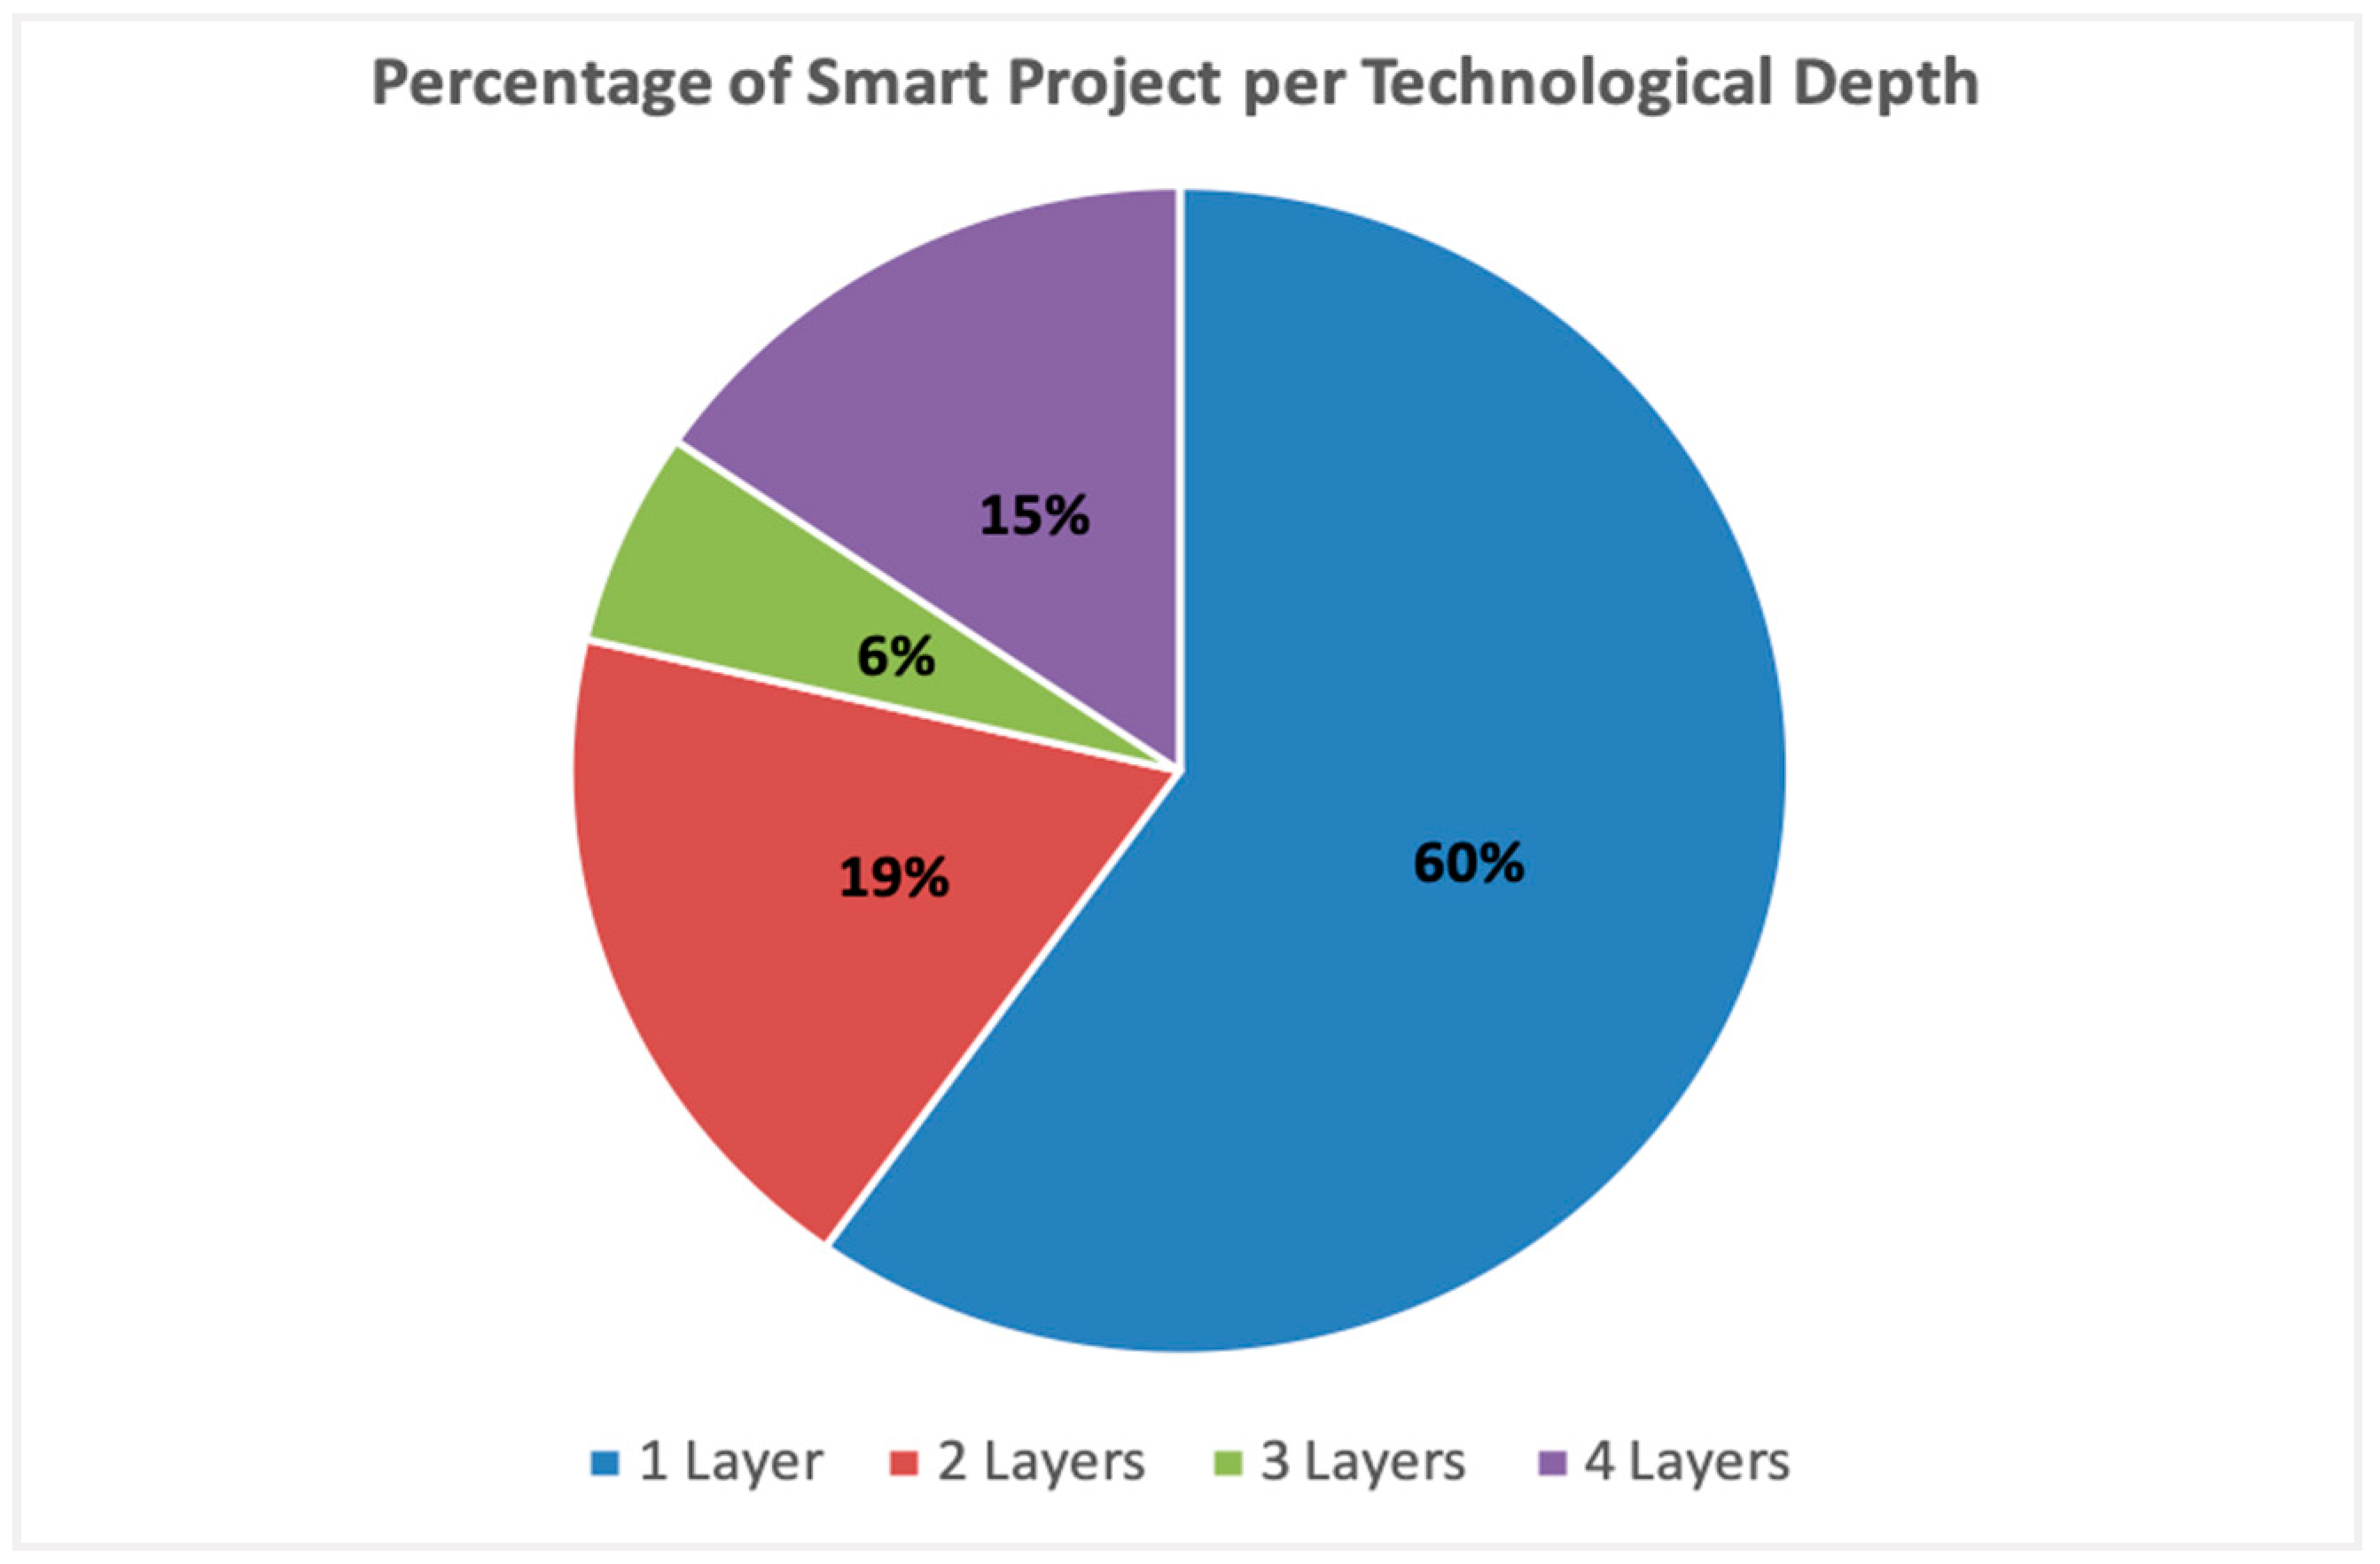
    • RQ2: What is the technological depth of the smart projects?
    • RQ3: How many potential interdependences exist between the projects?
    Metrics:
    • M1—Projects’ transversality (PT)
      Given Smart project i (SMi), PT(SMi) is equal to the number of different application domains that SMi spams/covers and PT(SMi)∈{1,2,3,4,5,6};
      M2—Technological depth (TD)
      Given Smart project i (SMi), TD(SMi) is equal to the number of different technological layers that SMi crosses, and TD(SMi)∈{1,2,3,4};
      M3—Project interdependencies (PI)
      Given two Smart Project i,j, PI(SMij) is equal to:
      0—if there are no interdependencies between SMi and SMj
      1—if interdependencies exist between SMi and SMj
      where an “interdependency” between SMi and SMj is any potential opportunity of reusing project requirements, functionalities, technologies used, or artifacts/deliverables produced between SMi and SMj.
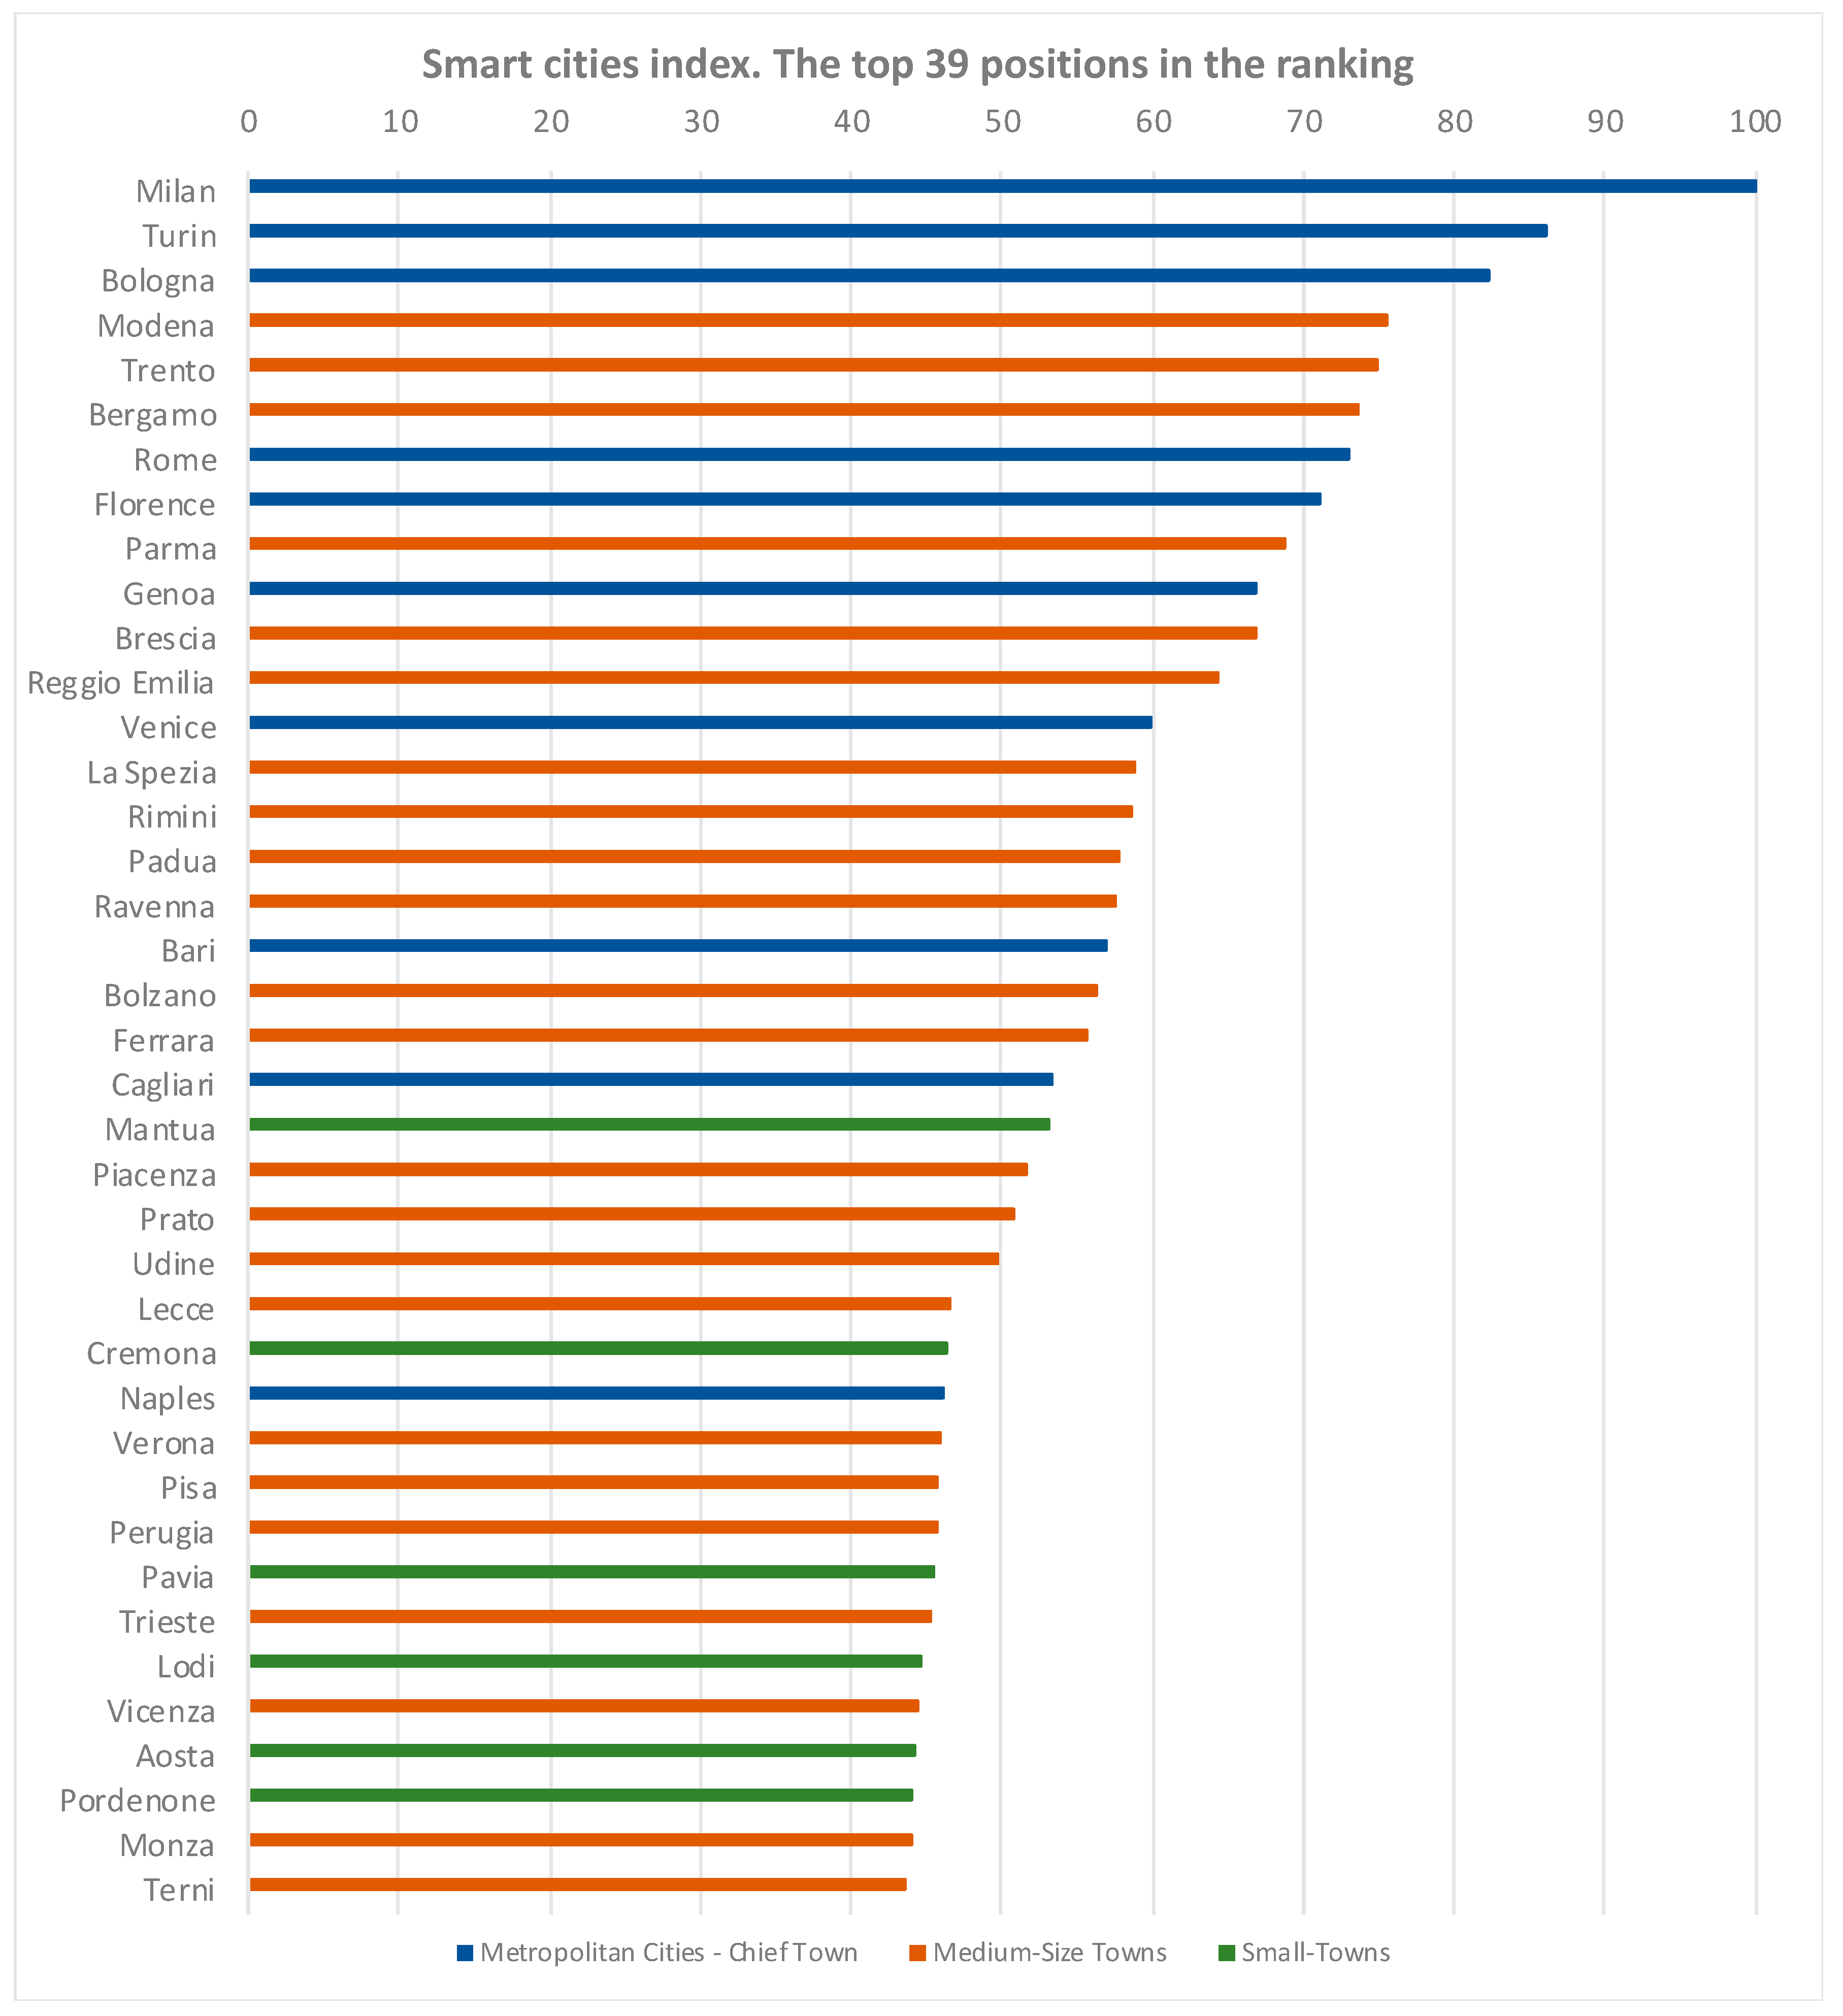
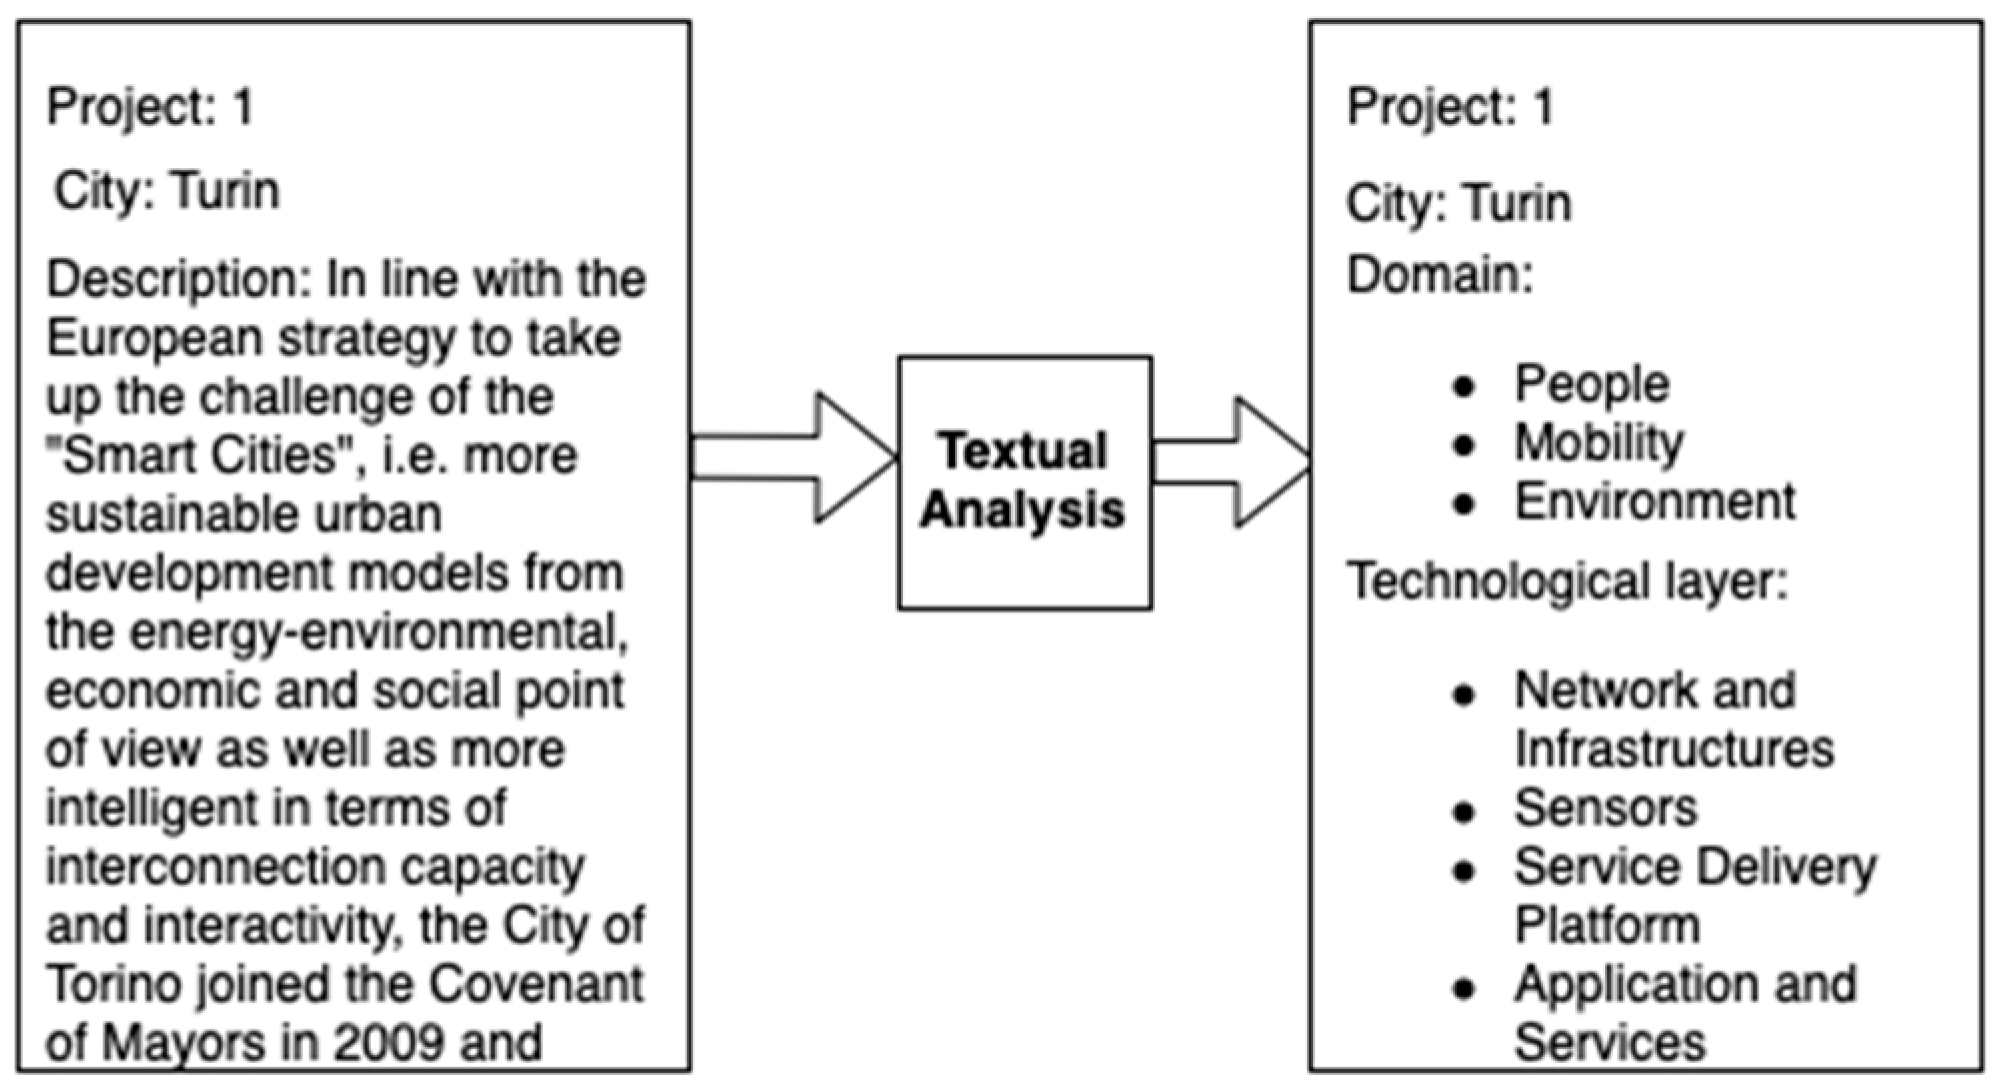
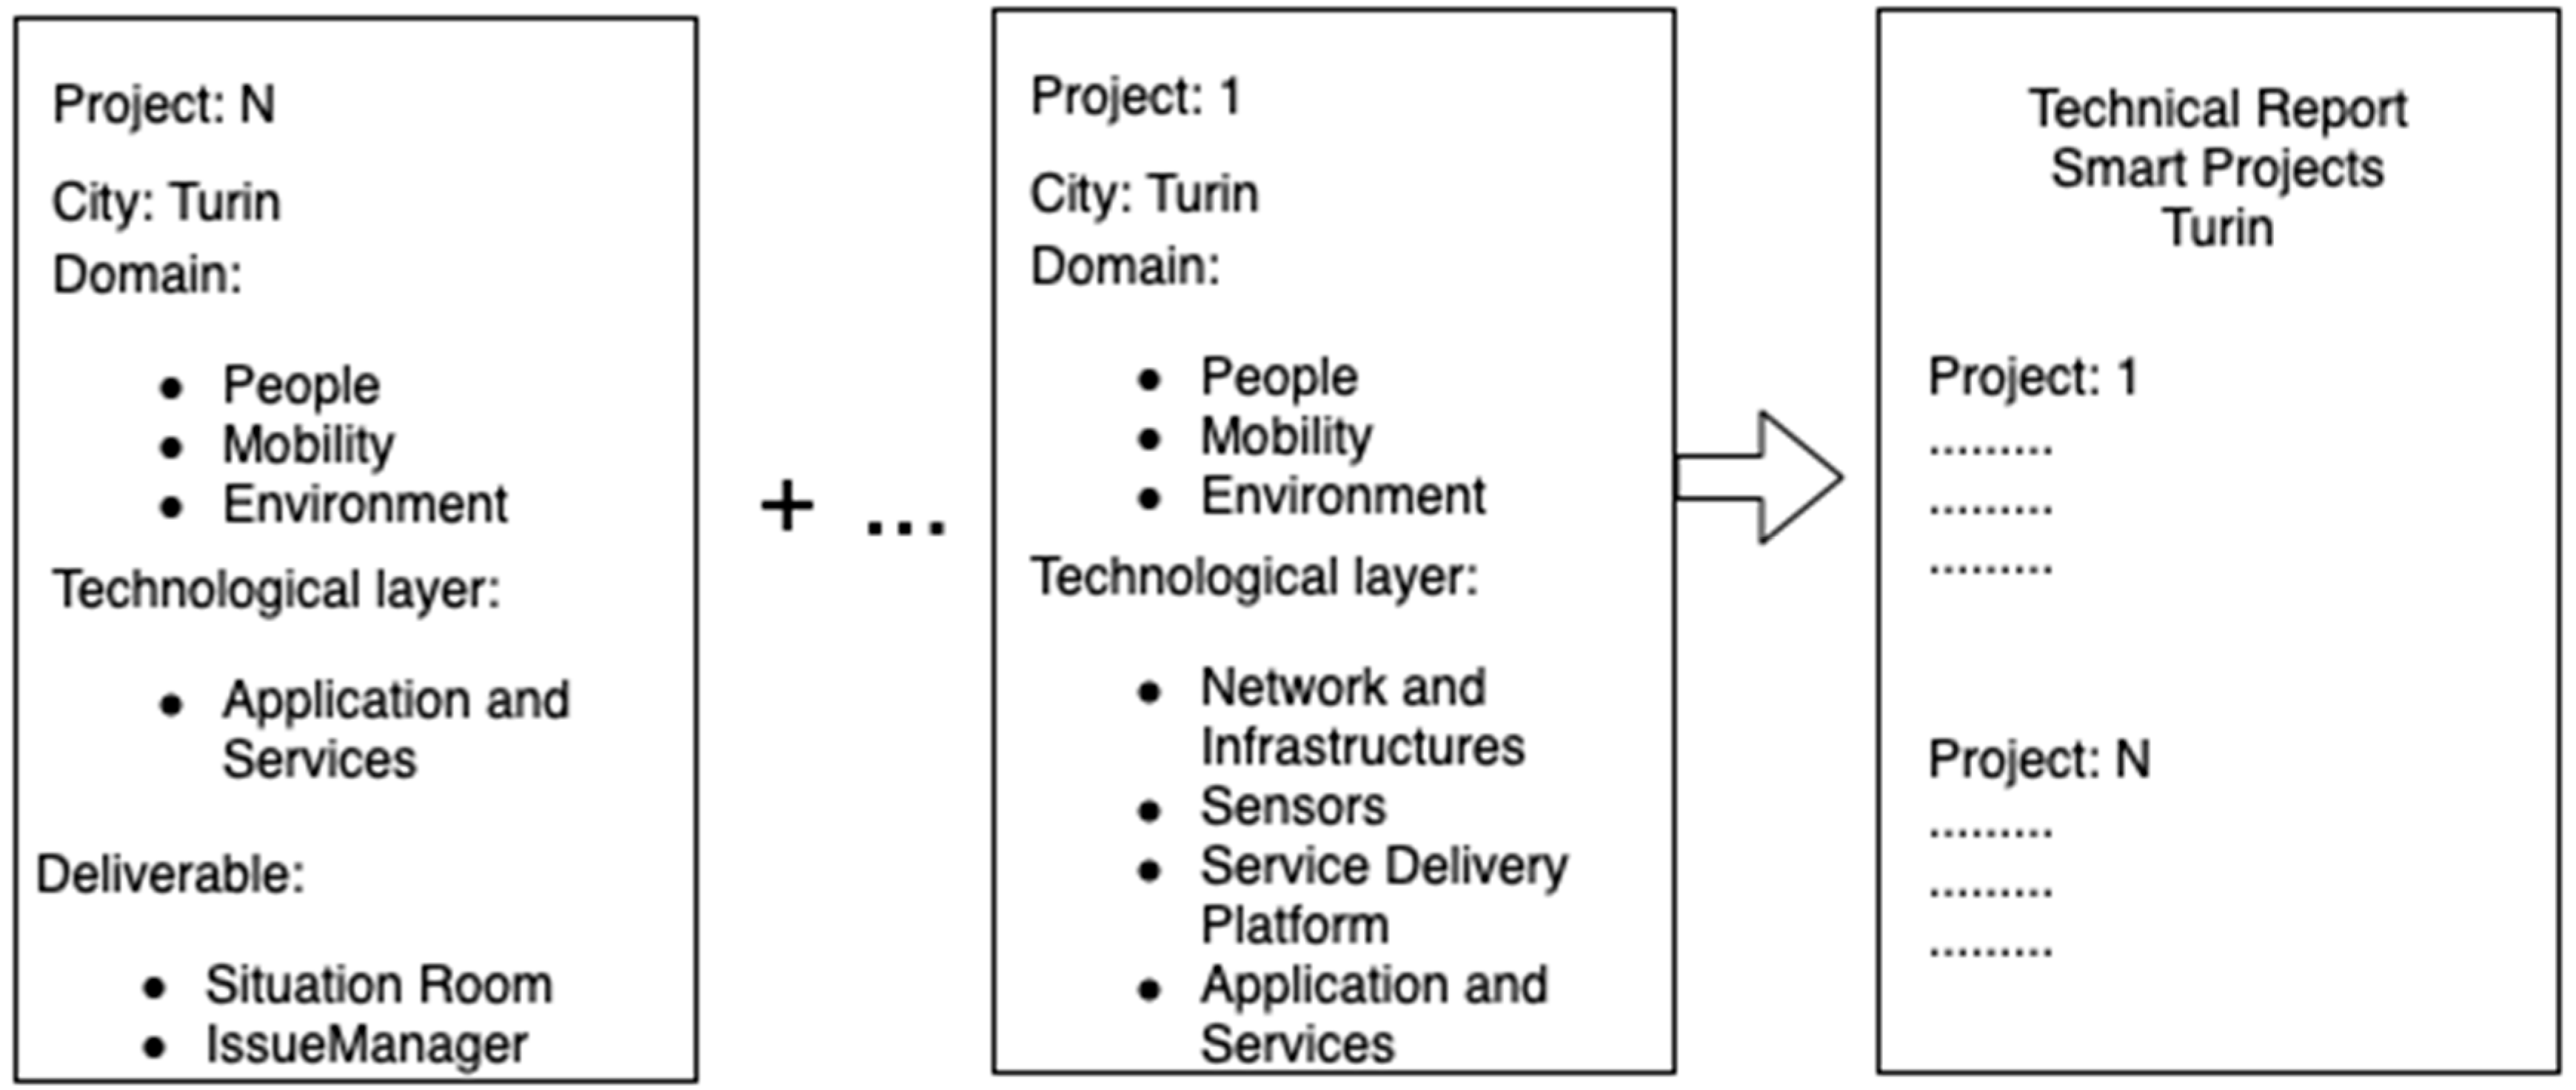
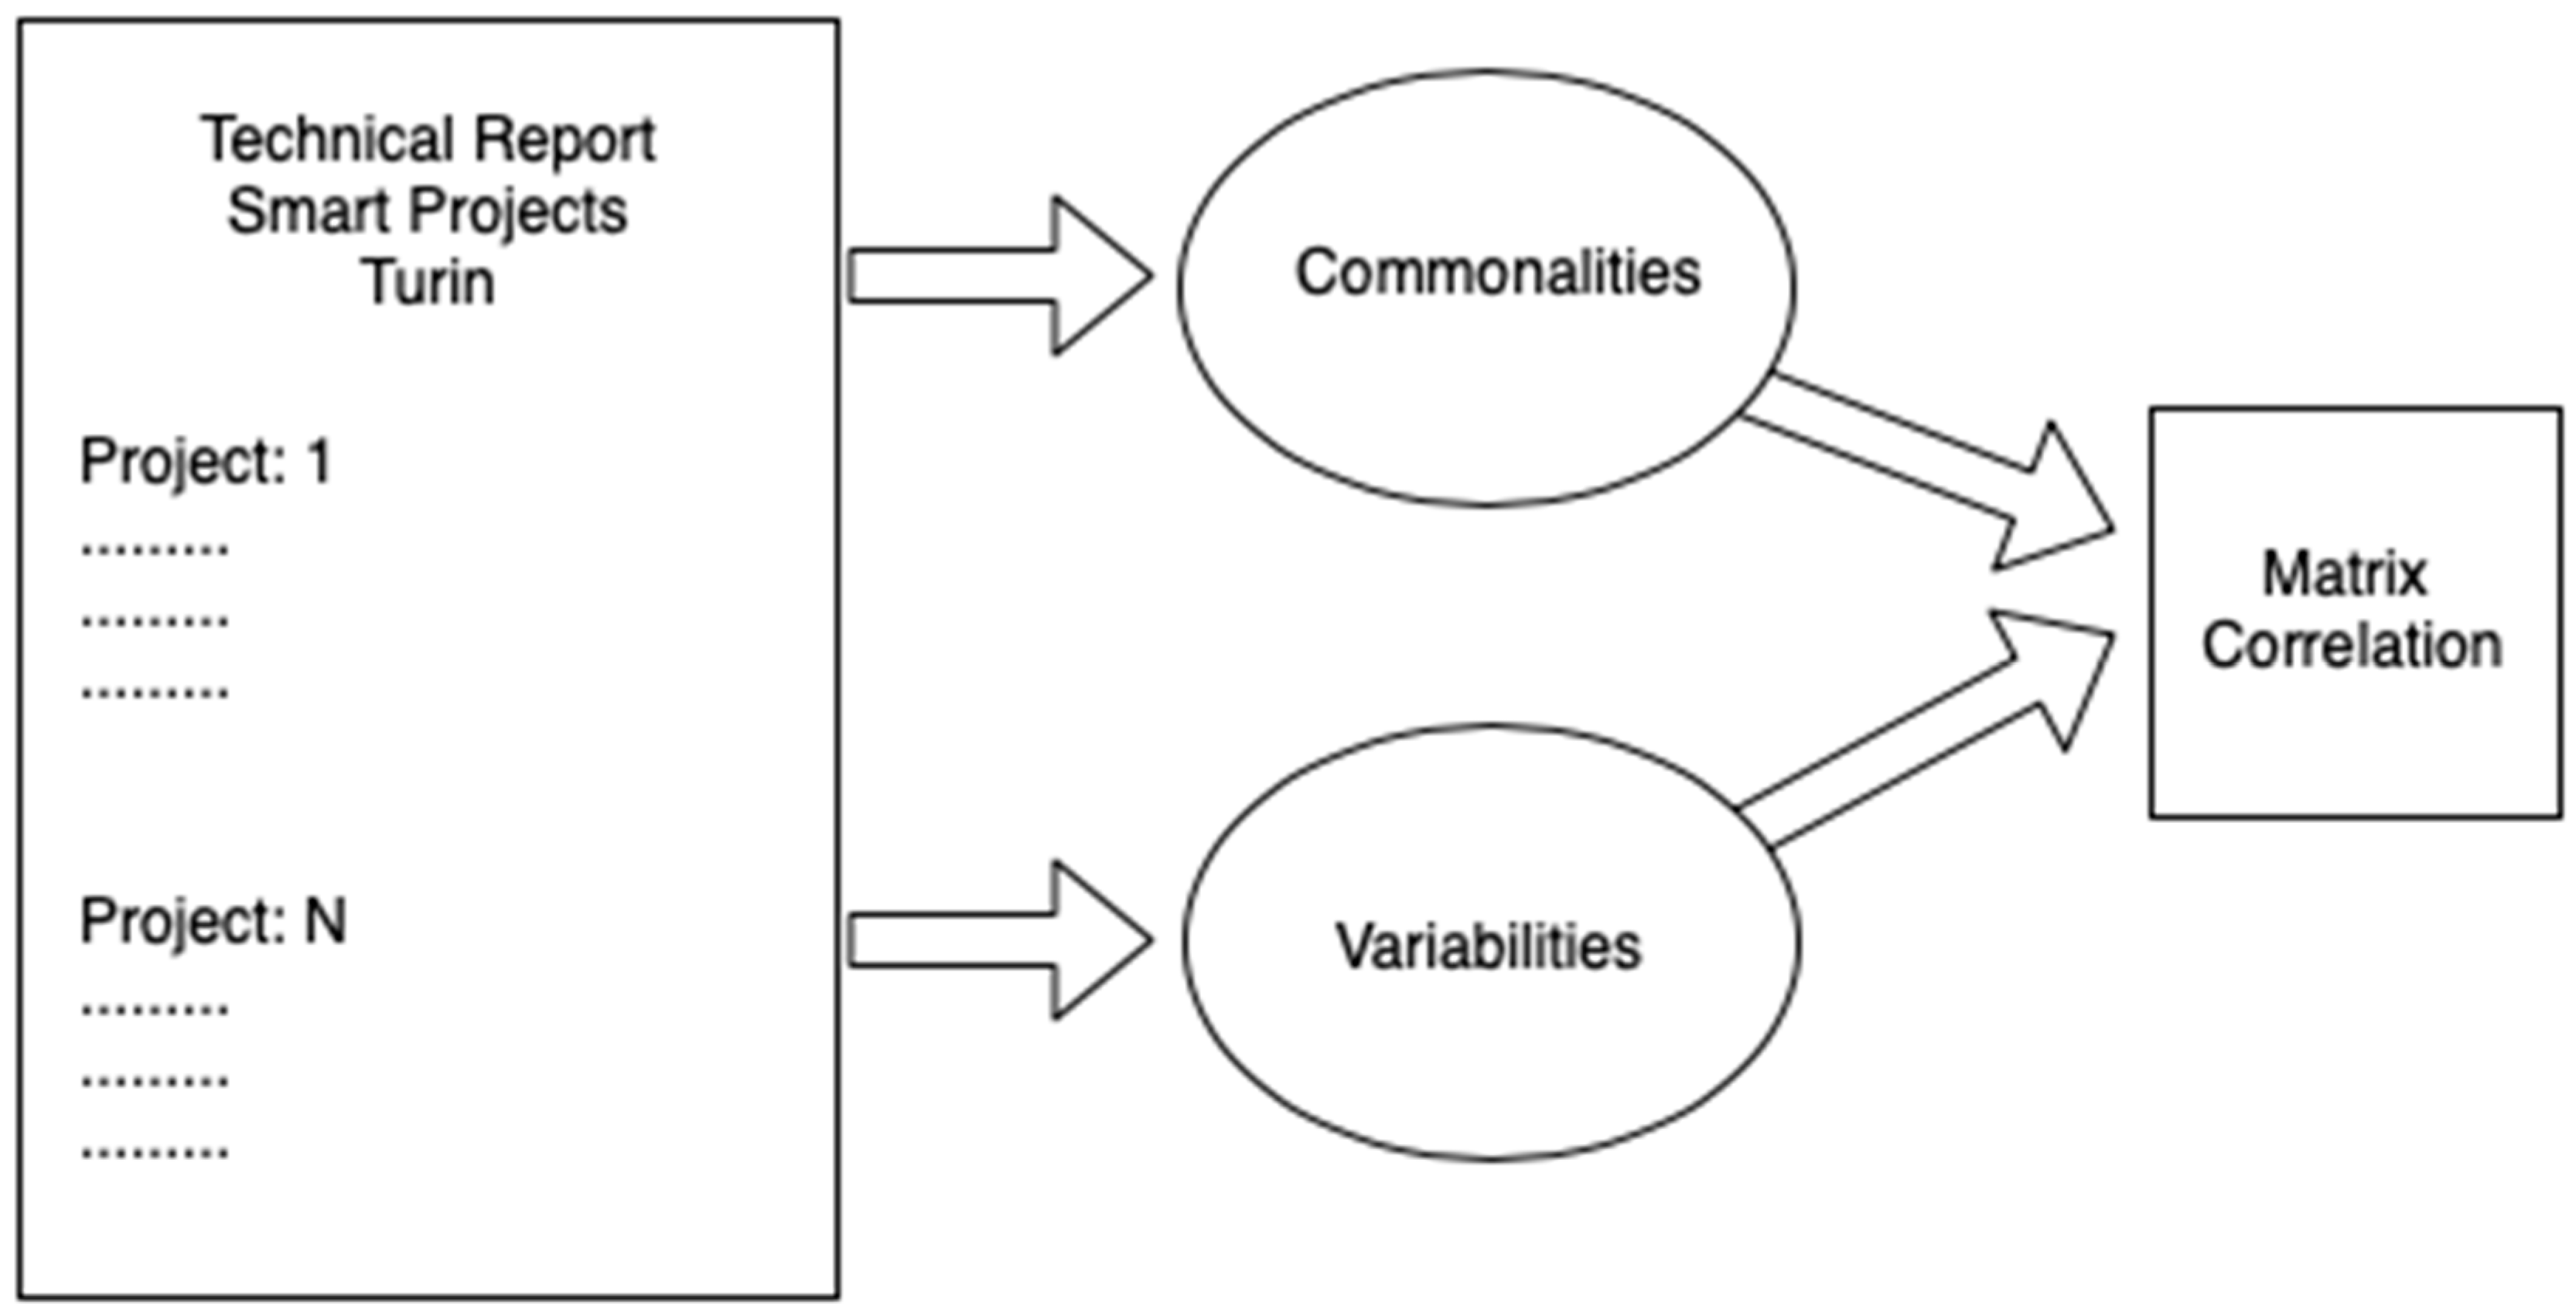
    PT and TD are objective metrics and in the absence of information, no subjective assumptions were made, while PI was evaluated subjectively based on expert judgment. Therefore, in order to identify the interdependency each expert used a correlation matrix to define the existence or not of interdependence (an example is given in Section 8.3) and of a technical report related to the data: project requirements, functionalities, technologies used, or artifacts/deliverables produced between SMi and SMj. In this way, each member of the team would be provided with all the information necessary to evaluate the existence of interdependence during the interview.
  • Selection of the experimental sample. For the selection of the experimental sample “Convenience sampling” was used, a specific type of non-probability sampling method based on data collected from population members [51]. The Italian scenario was selected mainly because it was feasible to analyze in comparison to the entire population (worldwide Smart cities) which would have been too large and therefore impossible to consider for both the availability of data (available only for the Italian cities) and the effort needed. Furthermore, within the Italian context, the criterion of geographical distribution of the sample was adopted to avoid potential threats to the investigation dictated by the particular economic and social context, being a factor that could influence the characteristics of the selected projects. The best rated cities for each geographical area were selected rather than chosen with a random selection, to avoid poor performances could also represent a threat for the retrospective analysis. Furthermore, given the geographical characteristics of the Italian territory we selected the same number of cities distributed between northern, central, and southern Italy. Two main sources were used to select the sample of experimental data. The first was represented by the report “Smart City Index 2018” [16] published at the beginning of 2019, and the second was the “Agenda Urbana” web portal [14]. In a study by D’acunto and colleagues [16], 117 Italian cities were analyzed and evaluated, classifying their development in terms of networks and intelligent infrastructures and measuring their ability to innovate and offer quality services to their citizens. The evaluation associates each city with a Smart Index obtained through the combination of over 480 different indicators. It provides a general classification on a national basis (Figure 5 shows the top 39 positions in the ranking).
    All the smart projects carried out in each of the cities evaluated in the 2018 Smart city index report [16] are surveyed and described in detail in [14]. The selection criteria adopted was the following:
    identify the three cities with the highest smart index in northern, central, and southern Italy;
    for each selected Smart city, include in the sample all the smart projects described in the Urban Agenda Web Portal.
    Initially the following cities were included in the sample: Milan, Turin, Bologna for northern Italy; Rome, Florence, and Pisa for central Italy and Bari, Cagliari, and Lecce for southern Italy. However, since there was no information for Pisa in the Urban Web Portal Agenda, it was excluded from the sample. The city classified in central Italy after Pisa was Perugia, but even in this case there was no information. We then moved on and selected the next city, Terni, which was included in the sample. As so, at the end of this process the following nine Italian Smart cities were selected: Milan, Turin, Bologna, Rome, Florence, Terni, Bari, Cagliari, and Lecce, along with 378 associated projects. The criterion of geographical distribution of the sample was adopted to avoid potential threats to the investigation dictated by the particular economic and social context, being a factor that could influence the characteristics of the selected projects. The best rated cities for each geographical area were also selected rather than using random selection, to avoid poor performances which could also represent a threat for the retrospective analysis.
  • Data collection. The information collected for each selected project were: project name; application domain; project description; project stakeholders; expected impact; conditions of replicability; project outputs.
  • Data analysis. This step was divided into three activities:
    • Data cleaning: the collected data was verified for completeness and consistency and projects that contained incomplete data or did not use ICT technologies were eliminated from the sample.
    • Descriptive statistics: used to obtain information and characterize the projects with respect to PT and TD.
    • Commonality and variability analysis (CVA) [52,53]: were used to identify the common aspects and distinctive and unique characteristics between the selected projects. It was carried out in order to collect data concerning the PI metric.

8. Results

The experimental sample selected was made up of nine Smart cities for a total of 378 projects [54] distributed across the Italian territory from the north, center, and south, as shown in Table 2. During data cleaning, the first phase of data analysis, a total of 74 projects were excluded because they were not considered “Smart” or contained incomplete data. An example of a non-smart project is the construction of a bridge, and an example of incomplete data is absence of the “project description”.

8.1. Transversality of the Smart Projects

Of the total 304 projects included in the final sample, only 35% were considered transversal to two or more domains, with a peak of 63% for Turin and a minimum of 12% for Lecce (Figure 6).
Overall, 198 projects out of 304 covered only one application domain, 74 covered two application domains, and 25 covered three domains (Figure 7). Six projects were transversal to four and five domains, and only one project had six domains. The results show that Turin is the highest performing Smart city in terms of transversality; out of 65 projects it developed 25 projects covering a single application domain, 21 projects covering two application domains, 14 covering three application domains, three projects covering four domains, another three projects focusing on five domains, and one project covering all six domains.

8.2. Technological Depth

Of the nine Smart cities analyzed, the highest performing in terms of technological depth were Milan, Turin, and Bologna (Figure 8). Out of a total of eight projects analyzed, Bologna developed only one project on one level, three projects on two levels, and four on four levels, taking full advantage of the potentiality offered by a layered architecture. The cities that do not seem to fully exploit this potentiality were Bari, Florence, Terni, and Cagliari.
Globally, 182 projects (60%) appeared to be single layer, 57 projects (19%) were double layer, 18 projects (6%) were triple layer, and only 47 projects (15%) were able to fully use the stratified architecture (Figure 9).

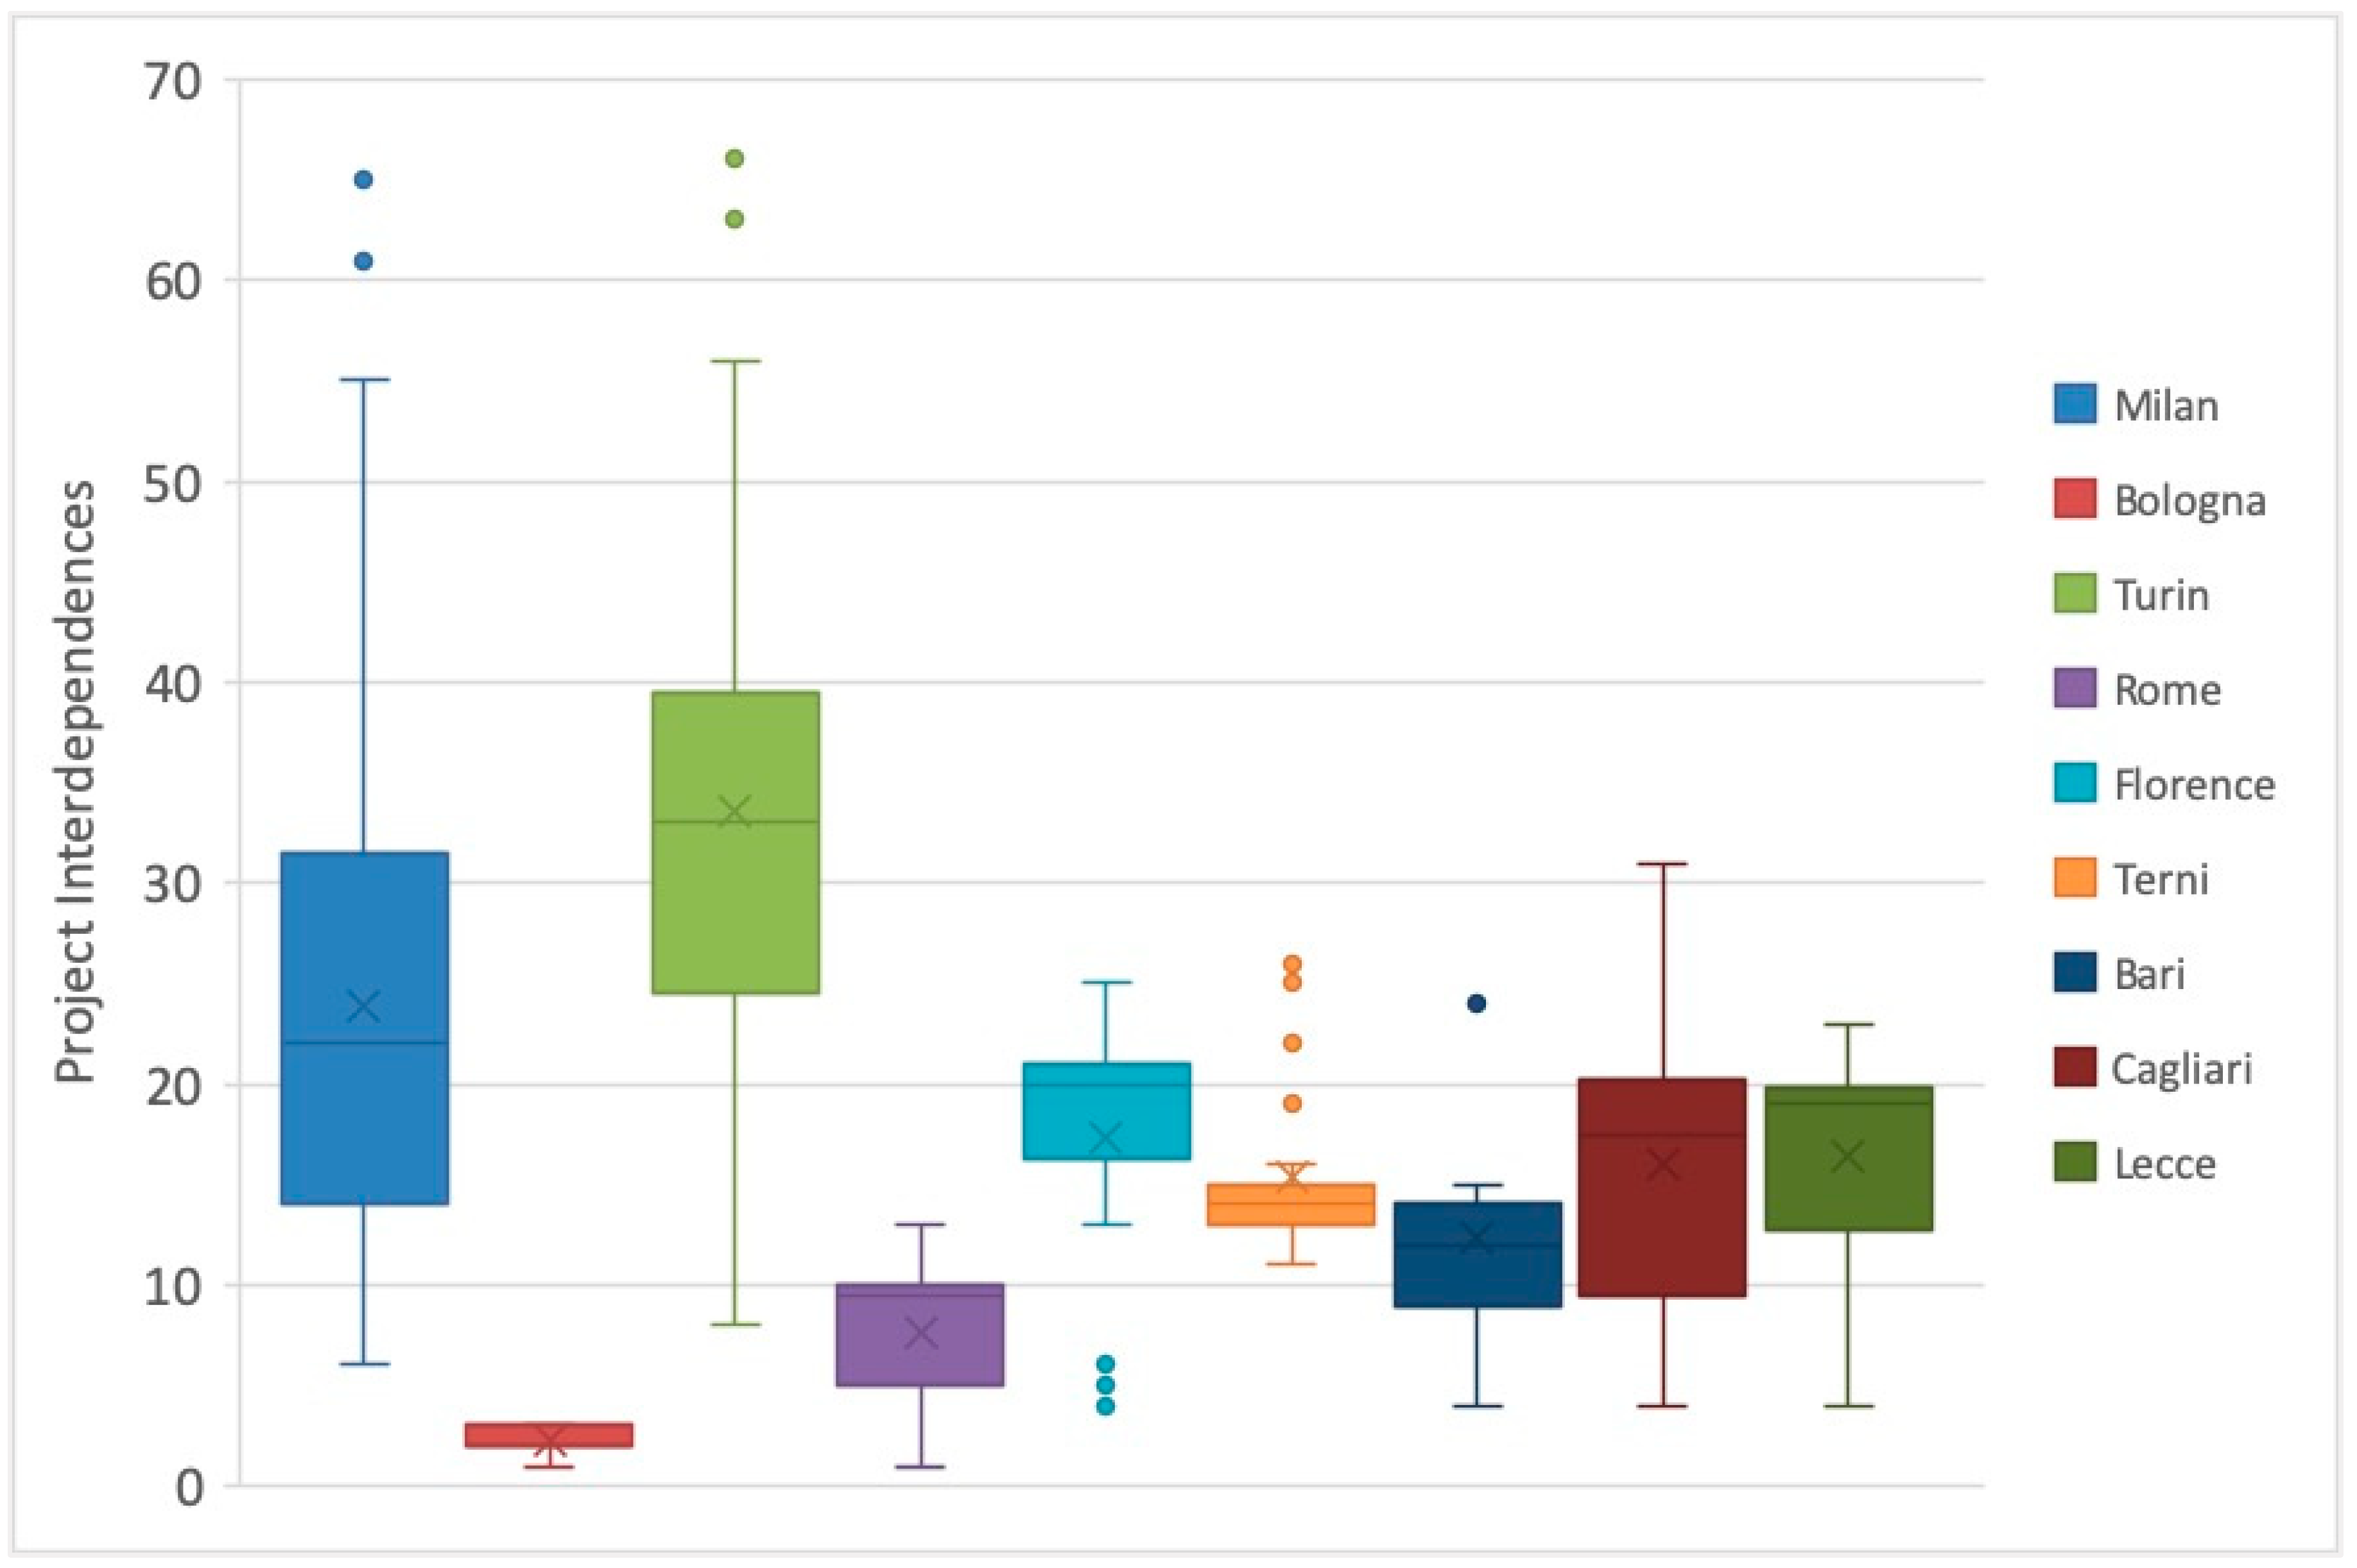
8.3. Project Interdependencies

Project interdependencies (PI) were investigated by using commonality and variability analysis (CVA) performed by a group of seven members. Starting from Agenda Urbana [14], for each city all the information concerning each project was collected, such as description, domain, number city partner, replicability conditions, stakeholder, development period, total investment, and population.
After collecting and examining all the information of each project, it was analyzed in order to extract the key terms to highlight common and variable aspects of each project.
Textual analysis [55] a tool for recording customer needs, allowed us to highlight key elements according to the integrated model described in Section 5. The Smart city integrated model includes application domain, technological layer, project requirements, functionalities, technologies used, and deliverables produced (Figure 10).
This textual analysis allowed to define a lean project sheet ready to be analyzed in order to evaluate the possible presence of interdependencies between the projects. Indeed, the sheets of each Smart city project were grouped together to analyze the common and variable aspects of all the projects related to a Smart city (Figure 11); for example, searching with the key term ‘People’ (application domain) or ‘App’ (deliverables produced) would elicit all the projects in that domain or that were deliverable.
The result of the research for each highlighted aspect has defined a set of aspects: commonalities, which describe what all projects of the Smart city have in common and variabilities which describe distinctive and unique aspects of each smart project that contribute to the development of the Smart city (Figure 12). In addition, this phase of analysis is complemented with expert judgement to assess interdependencies.
The nine Smart cities were divided among the members of the team; one city was assigned to each member except for one member who had to analyze three cities. The goal of the team was to study projects in order to identify project requirements, functionalities, technologies used, or artifacts/deliverables produced. These results were reported by each member in a technical report to discuss with the team.
Overall 10 face-to-face meetings were organized: during the first nine, the projects of each city were presented in turn. During each meeting, based on the technical report produced and sent a week in advance to the team, the rest of the members evaluated the actual existence, or not, of interdependence between the projects.
A correlation matrix was used to support data collection, and an example of Bologna Smart city is shown in Table 3.
The matrix contains the list of projects both on the first column and on the first row; for each (i, j) cell of the matrix, a value of 1 means that during the meetings the members of the working team identified an interdependence between project i and project j.
The results show that all the projects analyzed were interdependent with at least one project in the sample.
Figure 13 summarizes the distribution of the total PI achieved in each correlation matrix through a box plot for all the Smart cities. In this work, for each Smart city, a box plot shows: the lowest number of PI (minimum); the largest number of PI (maximum); the middle value of PI (median, Q2); the middle value between the smallest number and the median of PI (first quartile, Q1); the middle value between the largest number; and the median of PI (third quartile, Q3).
If we consider Milan, for example, the minimum value of PI was 6, the median was 22, and the first quartile was 14 (there are exactly 25% of PI that are less than the first quartile and exactly 75% of PI that are greater). The third quartile was 31.5 and the maximum (65) was an outlier, so the upper whiskers are drawn at the great value smaller than 1.5 interquartile range (IQR) above the third quartile, which is 55.
Bologna and Rome were the only cities with a PI value of 1, but they were also the two Smart cities with less smart projects. Bologna, Rome, Cagliari, and Lecce did not have outliers (i.e., any observations that were more than 1.5 IQR below Q1 or more than 1.5 IQR above Q3 were considered outliers [56]). This reinforces what was previously highlighted in Section 8.2. Bologna was able to develop projects on several layers and to fully exploit the advantages of the layered architecture. Also, Bari and Terni included outliers: two projects with PI = 24 for Bari and five projects for Terni with PI equal to, respectively, 19, 22, 25, 26, and 26. This confirms the existence of redundant projects unable to exploit potential areas of reuse, with loss of economies of scale and scope.
After removing the outliers, Bari, Cagliari, and Lecce had a minimum value of PI equal to 4 and a maximum value of 15 out of 25 projects for Bari, 31 out of 32 for Cagliari, and 23 out of 26 for Lecce.
Milan and Turin were the two cities with the highest number of smart projects and Turin, despite the removal of outliers, still remained the Smart city with the highest value of project interdependences.

9. Discussion of the Results and Answers to the Research Questions

The results obtained, as preliminarily discussed in a previous work [13], are interesting and confirmed the research hypothesis that the use of Smart program management can turn into a success factor in managing Smart city projects. On a sample of 378 projects, only 304 made use of ICT technologies and thus can be considered “Smart”. The remaining 74 projects were “smartless” projects: building heritage sites; realization of hanging gardens; building renovation project of an old abandoned military base; construction of a road bridge; construction of a bus station.
In the rest of the section each of the research questions defined are answered according to the data analysis performed.
  • RQ1: What is the transversality of smart projects?
Overall, 35% of the analyzed projects appear to be transversal to several application domains. Considering that they were carried out in the complete absence of any strategic planning and analysis of the potential reuse and integration, the result is even more meaningful. At the same time, it can be observed that the remaining 65% represents a large area of possible improvements.
Smart program management would allow a Smart city to be better structured, as the potential areas of reuse could be exploited to create more (and better) with less, according to an overall strategic vision and targeted local policies. Another key point is that the lack of transversality means low interoperation and thus, as a result, fragmentation of services delivered to the citizens with a negative impact on their user experience.
In some cities, such as Lecce and Florence, the transversality appears to be modest and therefore the improvements achievable with the adoption of an intelligent management of the projects would be even more relevant.
  • RQ2: What is the technological depth of smart projects?
The results show that each project of a Smart city actually consists of a self-consistent technological silo, leaving aside any integration both at the strategic and technical operation level. Consequently, the same considerations as for transversality generally apply here as well. Overall, 60% of the projects were developed on a single layer, 19% comprised three layers, and only 15% included four layers. Bologna is the highest performing city that was able to design applications and services by exploiting four architectural layers in four different projects, over a total of eight. Therefore, the need to create enabling platforms for each of the layers, to be used and reused, in each new project emerges. This would eliminate the probability of having to carry out each new project from scratch and having to develop the components for each of the technological layers each time.
  • RQ3: How many potential interdependences are there between the projects?
The interdependencies analysis corroborates the research hypothesis underlying this work, namely that each project could benefit from what has already been achieved in other projects. The average value of PI for all the cities analyzed is 16% and, on average, one project shares artifacts with 16 other projects.
Interdependent means potential reuse, interoperation opportunities, and more focused services. Exploiting interdependencies results in an integrated vision and better resources management, financial resources, workload, and human capital needed for application and service development and delivery.
Consequently, the adoption of Smart program management for planning and implementing Smart city projects is an effective means to do such. Continuing to invest in the growth of a Smart city requires the adoption of enabling platforms for each of the four technological levels of the architecture, so that each new smart project can take advantage of what has already been achieved.

10. Limitations and Threats to Validity

In order to provide the reader with all the elements for evaluating the results presented, possible experimental threats to validity, consistency, magnitude of the results, and transferability are analyzed below.
Threats to validity, internal validity or credibility are related to the extent that the results match the meanings and knowledge constructed in the investigated context. To increase credibility in the studies, we tried to achieve maximum variation collecting data from different projects related to different Smart cities. We selected nine Smart cities with the highest Smart index in different geographical areas: three in northern Italy, three in central Italy, and three in southern Italy. The high index of the selected cities guarantees that the results obtained are not the effect of the poor performance of the cities analyzed. The shortcomings highlighted by the analysis in terms of transversality, technological depth, and interdependencies can only increase in the case of cities with a lower index. Choosing cities in three different areas of Italy, prevents context factors such as local economy, available resources, and cultural level from being threats to validity. We then synthesized the results of our analysis across all the projects considered nationwide. This synthesis produced no contradictory evidence, increasing our confidence on the credibility of our findings.
Consistency refers to whether the researchers did not make any inference that cannot be supported by the data. To increase consistency, we performed all data analysis in group. The analysis was performed by one researcher and reviewed by all other researchers. Member checking was also used to check the consistency of our interpretations. Inconsistencies among researchers were resolved in consensus meetings. We used the framework method to enhance the consistency of data analysis among the researchers [57].
Finally, with respect to the magnitude of the results, in this work, 378 projects from nine Italian Smart cities were analyzed; this represents a limit as the sample size was considerably lower than the total number of Italian projects (about 1300) classified as smart. Furthermore, the selected projects are not worldwide and refer only to Italian Smart cities. Different cultural practices and issues such as the organizational and social aspects that lead the management of projects in a Smart city might have influenced the results. Therefore, we do not claim generalization of our results to a large population in a positivist perspective. Instead, consistent with our interpretive perspective, we believe that the use of multiple sources of data derived from projects across Italy and related to cities with various characteristics (e.g., dimension, culture, traditions, economy, etc.), supports good analytical generalization increasing the potential of transferability [58] of the findings to other contexts. In fact, we should keep in mind that the smart management of projects carried out in a Smart city is comparable to those of other countries. As thus the typical management of any potential project, we are confident in concluding that the results are representative. Moreover, to further strengthen the results of these findings, we are currently performing a replicated multi-country study involving projects of Smart cities in other European countries in the attempt to apply similarity-based generalization [50,59]. Despite the impossibility of generalizing the results obtained, the authors believe that they offer interesting indications for the adoption of “Smart program management” in the context of a Smart city.

11. Conclusions

The research work presents the proposal of a Smart city integrated model and a Smart program management approach for managing the transversality, technological matters, and interdependences between smart projects.
The integrated model organizes a Smart city with respect to two dimensions: horizontal (application domains) and vertical (technological layers). The result of the interaction between these dimensions contributes to the development of a Smart city and its services. In this context, Smart program management helps to manage the interdependences between projects and the correlation between a defined strategy and its execution. With respect to the horizontal dimension, program management allows to obtain common and reusables assets, whereas from the vertical dimension it allows to integrate and optimize project execution maximizing overall benefits.
In this article, a retrospective analysis was carried out on a set of 378 projects belonging to nine different Italian Smart cities starting from the proposal of the integrated model. The aim was to investigate the potential benefits from using Smart program management analyzing the transversality and the technological depth of the smart projects, and the existence of potential interdependences between them.
The results obtained show that not all projects can be classified as ‘Smart’ and only 35% of them are transversal to several application domains. Each smart project consists of a self-consistent technological silo, leaving aside any integration both at the strategic and technical operation level. This suggests that the proposed approach may be an effective means for planning and implementing more effective Smart city projects.
The data analysis performed also provides useful insights on how Smart cities should be designed and managed from strategic and operational points of views. Moreover, the following lessons learned can by summarized:
  • the adoption of the Smart city integrated model and Smart program management model helps to plan strategic development of a Smart city pushing towards the realization of integrated services across various domains. The integration between services cannot be achieved solely on a technological level, it would not be sufficient. It requires the harmonization of administrative procedures, public administration processes as well as infrastructures and physical resources available in urban areas. This requires vision, strategy, and knowledge of the stakeholders and territory, all in terms of usable needs, resources, and assets. The initiated projects cannot ignore the transversal nature of a Smart city and, therefore, must consider the impacts and effects generated on the different domains and conceive solutions capable of harmonizing the new with the already existing components;
  • from a technological point of view, it is necessary to conceive a Smart city as a stratification of enabling platforms reusable by those who intend to produce new services and new solutions. This guarantees technological standardization, but also strong specialization. Each layer of the Smart city integrated model can be managed by one or a group of specialized providers, capable of continuously evolving technologies and infrastructures based on new needs and market trends. At the same time, this would allow those who begin new projects to fully exploit these platforms, focusing on generating additional value. Everything should not be built from scratch; the various layers should not be re-implemented each time. Project resources can therefore be used to take a step forward compared to what already exists in the Smart city and, above all, in the right direction (i.e., the one dictated by the vision and growth strategy defined).
Given these considerations, some implications for both industrial and academic communities can be pointed out. First of all, it is necessary to invest in approaches that focus on the development of ICT solutions strongly based on reuse. The development of new software services must be based as much as possible on the re-use of existing services and the technological heritage already available in Smart cities. Second, the traditional application-integration between software systems is not alone sufficient to guarantee an acceptable result. As demonstrated by the analyses carried out, the current smart projects are silos both from the applicative and technological point of view although they are characterized by a strong interdependence (project interdependence). Each with their own services, authentication systems, user registries, and interfaces. Everything is redundant. It should be simplified, streamlined, and optimized. The control flows, the underlying data structure, and the operating logics must be rethought. A citizen must be able to use the various services with the same login and password, he/she must be able to insert information and be able to exploit it for all the services offered (health, banking, administrative, etc.), without having to start from scratch each time. In this vision the user interfaces are a very critical aspect since they represent the means for simplifying user interaction relegating the complexity underlying the functioning of the various systems to the lower layers of layered architecture. Finally, the data and information collected must become a common asset useful for generating new knowledge. The availability of new data and information is a primary resource to fuel today’s race towards artificial intelligence, which is increasingly strategic to realize such a simplification process. In short, routine decisions must be made automatically, interaction with the user must be intelligent, and the use of software and services must be simplified to the maximum thanks to the use of recommendation systems, chatbots or voice interaction.

Author Contributions

Conceptualization, V.S.B. and D.C.; Methodology, D.C., G.D., A.N. and M.S.; Software, V.S.B. and D.C.; Validation, V.S.B., D.C., G.D., A.N. and M.S.; Formal analysis, V.S.B., D.C., G.D., A.N. and M.S.; Investigation, V.S.B., A.N. and M.S.; Resources, V.S.B.; Data curation, V.S.B., G.D., A.N.; Writing—original draft preparation, V.S.B., A.N. and M.S.; Writing—review and editing, V.S.B., D.C., G.D.; Visualization, V.S.B. and A.N.; Supervision, D.C.; Project administration, D.C.; Funding acquisition, D.C. All authors have read and agreed to the published version of the manuscript.

Funding

This study was funded by: Italian Minister of University and Research, grant number PON03PE_00136_1, project name “Digital Service Ecosystem”; Apulia Region, grant number T5LXK18, project name “Auriga 2020”.

Conflicts of Interest

The authors declare no conflicts of interest.

References

  1. Lazaroiu, G.C.; Roscia, M. Definition methodology for the smart cities model. Energy 2012, 47, 326–332. [Google Scholar] [CrossRef]
  2. Monzon, A. Smart Cities Concept and Challenges: Bases for the Assessment of Smart City Projects. In Smart Cities, Green Technologies, and Intelligent Transport Systems; Helfert, M., Krempels, K.-H., Klein, C., Donellan, B., Guiskhin, O., Eds.; Springer International Publishing: Cham, Switzerland, 2015; pp. 17–31. [Google Scholar]
  3. Mohanty, S.P.; Choppali, U.; Kougianos, E. Everything you wanted to know about smart cities: The Internet of things is the backbone. IEEE Consum. Electron. Mag. 2016, 5, 60–70. [Google Scholar] [CrossRef]
  4. Moss Kanter, R.; Litow, S.S. Informed and interconnected: A manifesto for smarter cities. Harv. Bus. Sch. Gen. Manag. Unit Work. Pap. 2009. [Google Scholar] [CrossRef]
  5. Nam, T.; Pardo, T.A. Conceptualizing smart city with dimensions of technology, people, and institutions. In Proceedings of the 12th Annual International Digital Government Research Conference: Digital Government Innovation in Challenging Times, New York, NY, USA, 12–15 June 2011. [Google Scholar]
  6. Dirks, S.; Keeling, M. A vision of smarter cities: How cities can lead the way into a prosperous and sustainable future. IBM Inst. Bus. Value 2009. Available online: https://www-03.ibm.com/press/attachments/IBV_Smarter_Cities_-_Final.pdf (accessed on 23 November 2019).
  7. Batty, M.; Axhausen, K.W.; Giannotti, F.; Pozdnoukhov, A.; Bazzani, A.; Wachowicz, M.; Ouzounis, G.; Portugali, Y. Smart cities of the future. Eur. Phys. J. Spec. Top. 2012, 214, 481–518. [Google Scholar] [CrossRef] [Green Version]
  8. Hashem, I.A.T.; Chang, V.; Anuar, N.B.; Adewole, K.; Yaqoob, I.; Gani, A.; Ahmed, E.; Chiroma, H. The role of big data in smart city. Int. J. Inf. Manag. 2016, 36, 748–758. [Google Scholar] [CrossRef] [Green Version]
  9. Project Management Institute. A Guide to the Project Management Body of Knowledge (PMBOK® Guide), 6th ed.; Project Management Institute: Newtown Township, PA, USA, 2018. [Google Scholar]
  10. Dameri, R.P.; Rosenthal-Sabroux, C. Smart City and Value Creation. In Smart City: How to Create Public and Economic Value with High Technology in Urban Space; Dameri, R.P., Rosenthal-Sabroux, C., Eds.; Springer International Publishing: Cham, Switzerland, 2014; pp. 1–12. [Google Scholar] [CrossRef]
  11. Paroutis, S.; Bennett, M.; Heracleous, L. A strategic view on smart city technology: The case of IBM Smarter Cities during a recession. Technol. Forecast. Soc. Chang. 2014, 89, 262–272. [Google Scholar] [CrossRef]
  12. Giffinger, R.; Pichler-Milanović, N. Smart Cities: Ranking of European Medium-Sized Cities; Centre of Regional Science, Vienna University of Technology: Vienna, Austria, 2007. [Google Scholar]
  13. Baldassarre, M.T.; Santa Barletta, V.; Caivano, D. Smart Program Management in a Smart City. In Proceedings of the 2018 AEIT International Annual Conference, Bari, Italy, 3–5 October 2018; pp. 1–6. [Google Scholar] [CrossRef]
  14. NCI. La Via Italiana Alle Comunità Intelligenti. 2019. Available online: http://www.agendaurbana.it (accessed on 22 November 2019).
  15. The IMD World Competitiveness Center. Smart City Index. 2019. Available online: https://www.imd.org/globalassets/wcc/docs/smart_city/digital-smart_city_index.pdf (accessed on 28 December 2019).
  16. D’acunto, A.; Mena, M.; Polimanti, F.; Quintiliano, C. Polis 4.0. Rapporto Smart City Index 2018. EY. Available online: https://www.ey.com/Publication/vwLUAssets/Smart_City_Index_2018/$FILE/EY_SmartCityIndex_2018.pdf (accessed on 23 November 2019).
  17. Gretzel, U.; Werthner, H.; Koo, C.; Lamsfus, C. Conceptual foundations for understanding smart tourism ecosystems. Comput. Hum. Behav. 2015, 50, 558–563. [Google Scholar] [CrossRef]
  18. Chourabi, H.; Nam, T.; Walker, S.; Gil-Garcia, J.R.; Mellouli, S.; Nahon, K.; Scholl, H.J. Understanding Smart Cities: An Integrative Framework. In Proceedings of the 2012 45th Hawaii International Conference on System Sciences, Maui, HI, USA, 4–7 January 2012; pp. 2289–2297. [Google Scholar] [CrossRef]
  19. Albino, V.; Berardi, U.; Dangelico, R.M. Smart Cities: Definitions, Dimensions, Performance, and Initiatives. J. Urban Technol. 2015, 22, 3–21. [Google Scholar] [CrossRef]
  20. Cocchia, A. Smart and Digital City: A Systematic Literature Review. In Smart City: How to Create Public and Economic Value with High Technology in Urban Space; Dameri, R.P., Rosenthal-Sabroux, C., Eds.; Springer International Publishing: Cham, Switzerland, 2014; pp. 13–43. [Google Scholar] [CrossRef]
  21. Gretzel, U.; Sigala, M.; Xiang, Z.; Koo, C. Smart tourism: Foundations and developments. Electron. Mark. 2015, 25, 179–188. [Google Scholar] [CrossRef] [Green Version]
  22. Dameri, R.P. Searching for smart city definition: A comprehensive proposal. Int. J. Comput. Technol. 2013, 11, 2544–2551. [Google Scholar] [CrossRef]
  23. Piro, G.; Cianci, I.; Grieco, L.A.; Boggia, G.; Camarda, P. Information centric services in smart cities. J. Syst. Softw. 2014, 88, 169–188. [Google Scholar] [CrossRef]
  24. Shapiro, J.M. Smart Cities: Quality of Life, Productivity, and the Growth Effects of Human Capital. Rev. Econ. Stat. 2006, 88, 324–335. [Google Scholar] [CrossRef]
  25. Baldassarre, M.T.; Caivano, D.; Visaggio, G. Comprehensibility and Efficiency of Multiview Framework for Measurement Plan Design. In Proceedings of the International Symposium on Empirical Software Engineering, ISESE 2003, Rome, Italy, 30 September–1 October 2003; pp. 89–98. [Google Scholar] [CrossRef]
  26. Harrison, C.; Eckman, B.; Hamilton, R.; Hartswick, P.; Kalagnanam, J.; Paraszczak, J.; Williams, P. Foundations for Smarter Cities. IBM J. Res. Dev. 2010, 54, 1–16. [Google Scholar] [CrossRef]
  27. Kummitha, R.; Crutzen, N. How do we understand smart cities? An evolutionary perspective. Cities 2017, 67, 43–52. [Google Scholar] [CrossRef]
  28. Ramaswami, A.; Russell, A.G.; Culligan, P.J.; Sharma, K.R.; Kumar, E. Meta-principles for developing smart, sustainable, and healthy cities. Science 2016, 352, 940–943. [Google Scholar] [CrossRef] [PubMed] [Green Version]
  29. Baldassarre, M.T.; Barletta, V.S.; Caivano, D.; Raguseo, D.; Scalera, M. Teaching cyber security: The hack-space Integrated model. In Proceedings of the ITASEC 2019, Pisa, Italy, 13–15 February 2019; Volume 2315. [Google Scholar]
  30. Zanella, A.; Bui, N.; Castellani, A.; Vangelista, L.; Zorzi, M. Internet of things for smart cities. IEEE Internet Things J. 2014, 1, 22–32. [Google Scholar] [CrossRef]
  31. Kaźmierczak, J.; Loska, A.; Kučera, M.; Abashidze, I. Technical Infrastructure of “Smart City”: Needs of Integrating Various Management Tasks. Multidiscip. Asp. Prod. Eng. 2018. [CrossRef] [Green Version]
  32. Shelton, T.; Zook, M.; Wiig, A. The ‘actually existing smart city. Camb. J. Reg. Econ. Soc. 2014, 8, 13–25. [Google Scholar] [CrossRef]
  33. Brauneis, R.; Goodman, E.P. Algorithmic transparency for the smart city. Yale JL Tech. 2018, 20, 103. [Google Scholar] [CrossRef] [Green Version]
  34. Baldassarre, M.T.; Barletta, V.S.; Caivano, D.; Scalera, M. Privacy Oriented Software Development. Commun. Comput. Inf. Sci. 2019, 1010, 18–32. [Google Scholar] [CrossRef]
  35. Al Nuaimi, E.; Al Neyadi, H.; Mohamed, N.; Al-Jaroodi, J. Applications of big data to smart cities. J. Internet Serv. Appl. 2015, 6, 25. [Google Scholar] [CrossRef] [Green Version]
  36. Batty, M. Big data, smart cities and city planning. Dialogues Hum. Geogr. 2013, 3, 274–279. [Google Scholar] [CrossRef] [PubMed]
  37. Meijer, A.; Bolívar, M.P.R. Governing the smart city: A review of the literature on smart urban governance. Int. Rev. Adm. Sci. 2016, 82, 392–408. [Google Scholar] [CrossRef]
  38. Neirotti, P.; De Marco, A.; Cagliano, A.C.; Mangano, G.; Scorrano, F. Current trends in Smart City initiatives: Some stylized facts. Cities 2014, 38, 25–36. [Google Scholar] [CrossRef] [Green Version]
  39. Lombardi, P.; Giordano, S.; Farouh, H.; Yousef, W. Modelling the smart city performance. Innov. Eur. J. Soc. Sci. Res. 2012, 25, 137–149. [Google Scholar] [CrossRef]
  40. Project Management Institute. The Standard for Program Management, 4th ed.; Project Management Institute: Newtown Square, PA, USA, 2017. [Google Scholar]
  41. Caivano, D. Continuous software process improvement through statistical process control. In Proceedings of the Ninth European Conference on Software Maintenance and Reengineering, Manchester, UK, 21–23 March 2005; pp. 288–293. [Google Scholar] [CrossRef]
  42. Baldassarre, T.; Boffoli, N.; Caivano, D.; Visaggio, G. Managing Software Process Improvement (SPI) through Statistical Process Control (SPC). In Product Focused Software Process Improvement; Bomarius, F., Iida, H., Eds.; PROFES 2004. Lecture Notes in Computer Science; Springer: Berlin/Heidelberg, Germany, 2014; Volume 3009. [Google Scholar] [CrossRef]
  43. Anthopoulos, L.G. Understanding the Smart City Domain: A Literature Review. In Transforming City Governments for Successful Smart Cities; Rodríguez-Bolívar, M.P., Ed.; Springer International Publishing: Cham, Switzerland, 2015; pp. 9–21. [Google Scholar] [CrossRef]
  44. Caivano, D.; Fogli, D.; Lanzilotti, R.; Piccinno, A.; Cassano, F. Supporting end users to control their smart home: Design implications from a literature review and an empirical investigation. J. Syst. Softw. 2018, 144, 295–313. [Google Scholar] [CrossRef]
  45. Anthopoulos, L.; Janssen, M.; Weerakkody, V. A Unified Smart City Model (USCM) for smart city conceptualization and benchmarking. In Smart Cities and Smart Spaces: Concepts Methodologies, Tools, and Application; IGI Global: Hershey, PA, USA, 2019; pp. 247–264. [Google Scholar]
  46. Angelidou, M. Smart city policies: A spatial approach. Cities 2014, 41, S3–S11. [Google Scholar] [CrossRef]
  47. Höjer, M.; Wangel, J. Smart Sustainable Cities: Definition and Challenges. In ICT Innovations for Sustainability; Hilty, L.M., Aebischer, B., Eds.; Springer International Publishing: Cham, Switzerland, 2015; pp. 333–349. [Google Scholar]
  48. Ahvenniemi, H.; Huovila, A.; Pinto-Seppä, I.; Airaksinen, M. What are the differences between sustainable and smart cities? Cities 2017, 60, 234–245. [Google Scholar] [CrossRef]
  49. Giffinger, R.; Gudrun, H. Smart cities ranking: An effective instrument for the positioning of the cities? ACE Archit. City Environ. 2010, 4, 7–26. [Google Scholar]
  50. Baldassarre, M.T.; Bianchi, A.; Caivano, D.; Visaggio, G. An Industrial Case Study on Reuse Oriented Development. In Proceedings of the 21st IEEE International Conference on Software Maintenance (ICSM’05), Budapest, Hungary, 25–26 September 2005; pp. 283–292. [Google Scholar] [CrossRef]
  51. Wohlin, C.; Runeson, P.; Hst, M.; Ohlsson, M.C.; Regnell, B.; Wessln, A. Experimentation in Software Engineering; Springer Publishing Company: New York, NY, USA, 2012; In corporated. [Google Scholar]
  52. Tsuchiya, R.; Kato, T.; Washizaki, H.; Kawakami, M.; Fukazawa, Y.; Yoshimura, K. Recovering traceability links between requirements and source code in the same series of software products. In Proceedings of the 17th International Software Product Line Conference (SPLC’13), New York, NY, USA, 13–17 September 2013; pp. 121–130. [Google Scholar] [CrossRef]
  53. Coplien, J.; Hoffman, D.; Weiss, D. Commonality and variability in software engineering. IEEE Softw. 1998, 15, 37–45. [Google Scholar] [CrossRef] [Green Version]
  54. Barletta, V.S.; Caivano, D.; Dimauro, G.; Nannavecchia, A.; Scalera, M. Extra Material of Analysis of Smart Cities. Available online: https://serlab.di.uniba.it/smart-cities/ (accessed on 8 January 2020).
  55. Visual Paradigm, Textual Analysis. Available online: https://www.visual-paradigm.com/ (accessed on 8 January 2020).
  56. Upton, G.; Cook, I. Understanding Statistics; Oxford University Press: Oxford, UK, 1996; ISBN 0-19-914391-9. [Google Scholar]
  57. Gale, N.K.; Heath, G.; Cameron, E.; Rashid, S.; Redwood, S. Using the framework method for the analysis of qualitative data in multi-disciplinary health research. BMC Med Res. Methodol. 2013, 13, 117. [Google Scholar] [CrossRef] [PubMed] [Green Version]
  58. Merriam, B.S.; Tidell, E.J. Qualitative Research: A Guide to Design and Implementation, 4th ed.; Jossey-Bass: San Francisco, CA, USA, 2015; ISBN 978-1-119-00361-8. [Google Scholar]
  59. Ghaisas, S.; Rose, P.; Rose, P.; Daneva, M.; Sikkel, N.; Wieringa, R.J. Generalizing by similarity: Lessons learnt from industrial case studies. In Proceedings of the 1st International Workshop on Conducting Empirical Studies in Industry, CESI 2013, San Francisco, CA, USA, 20 May 2013; pp. 37–42. [Google Scholar] [CrossRef]
Figure 1. Horizontal dimension of a Smart city.
Applsci 10 00714 g001
Figure 2. Vertical dimension of a Smart city.
Applsci 10 00714 g002
Figure 3. The interaction between application domains and technological layers.
Applsci 10 00714 g003
Figure 4. Smart program management in a Smart city.
Applsci 10 00714 g004
Figure 5. Smart cities index. Positioning by layers and domains: 1–39.
Applsci 10 00714 g005
Figure 6. Single vs. multiple application domains projects.
Applsci 10 00714 g006
Figure 7. Projects’ transversality for single Smart city.
Applsci 10 00714 g007
Figure 8. Overview of technological depth for single Smart city.
Applsci 10 00714 g008
Figure 9. Percentage of smart project per technological depth.
Applsci 10 00714 g009
Figure 10. Textual analysis.
Applsci 10 00714 g010
Figure 11. Technical report smart projects.
Applsci 10 00714 g011
Figure 12. Commonality and variability analysis.
Applsci 10 00714 g012
Figure 13. Box plot of project interdependencies.
Applsci 10 00714 g013
Table 1. Program life cycle management: vertical and horizontal dimensions.
Vertical ProgramHorizontal Program
Program Life Cycle Management
Start: Definition of the projects that execute the program trying to identify and maximize the potential reuse opportunities and interdependencies between what projects to include.xx
Planning: Definition of the scope and development of the program, including all projects and all activities that occur during its execution.xx
Execution: The work needed to achieve the objectives and the program benefits.xx
Control: Monitor progress, update program plans, manage change and risk. xx
Closure: This is a crucial phase for Smart program management. Other than what is necessary to finalize all the activities of the program, including all component projects, execution of the transition plan, archiving, obtaining approvals, and reporting, an extra effort has to be made in the direction of individuating any potential area of reuse in the vertical and horizontal dimensions. This phase contributes to the generation of extra values for the Smart city and future projects that will benefit from the results and solutions developed in the past. xx
Table 2. Project distribution.
Smart CityProjects SelectedProjects RemovedProjects Included
Milan79475
Bologna1028
Turin76967
Rome18018
Florence32626
Terni371027
Bari492425
Cagliari501832
Lecce27126
Total37874304
Table 3. Correlation matrix for Bologna project interdependencies (PI) evaluation.
CORRELATION MATRIX Prj i vs Prj jPrj BO1Prj BO2 Prj BO3Prj BO4Prj BO5Prj BO6Prj BO7Prj BO9 j = 1 j = 8 P I ( P r j   j , i ) 1
Prj BO1101001002
Prj BO2011010002
Prj BO3111000103
Prj BO4000111002
Prj BO5010111003
Prj BO6100111003
Prj BO7001000112
Prj BO9000000111
i = 1 i = 8 P I ( P r j   i , j ) 1 22323321

