1. Introduction
Several methods are available to describe and characterize the physics of musical instruments and their sound radiation. Ernst Chladni (1756–1827) first discovered that rigid and thin structures (e.g., plates), most of them symmetric and very clear, could depict special and particular mode shapes when they were bowed by a vibrating violin bow [
1]. Chladni is therefore considered one of the pioneers (together with Robert Hooke) of modern experimental modal analysis. Starting from Chladni’s studies, modal analysis became quite important for studies on musical instruments. Frederick A. Saunders, in his important works about stringed musical instruments’ acoustics, described experimental modal analysis as one of the most important physical analyses of violins [
2,
3]. Carleen Hutchins, during her long activity as a scientist and violinmaker, considered modal analysis the most important and useful method for determining acoustic and sound quality in violin tops and backs [
4,
5]. However, no information about modal patterns and their importance (and rank) in the definition of sound characteristics was provided, although Hutchins stated that modes 2 and 5 were fundamental for the sound characterization of violin plates. These results were confirmed by several other authors, such as Erik V. Jannson [
6,
7]. Experimental modal analysis is based on the measurements of a frequency response function (FRF), which is obtained by exciting the sound board with a shaker or an impact hammer and capturing the vibration by means of accelerometers. Nevertheless, several authors such as Wogram [
8], Suzuki [
9] and Giordano [
10] have not discovered a robust correlation between FRF and modal analysis. Moreover, they have questioned whether there was a rank among all the modes, and what the relationship is between modal analysis (i.e., mode shapes) and sound radiation. When Hutchins stated that modes 2 and 5 in violins were fundamental, she did not provide any scientific reason for not considering modes 1, 3 and 4; therefore, further research was required. Conversely, a different acoustic parameter that has recently been introduced called intensity of acoustic radiation (IAR) is well linked to the mechanical vibration of the sound source [
11]. The IAR enables the sound characterization of musical instruments, including wind instruments [
12].
Even though several measurements could be utilized for characterizing musical instruments, they do not enable the ranking of the different modal shapes or link modal shapes with sound radiation (i.e., sound production of musical instruments).
In this paper, the intensity of acoustic radiation (IAR) is experimentally evaluated for three Persian stringed musical instruments, namely the thar, si-thar and santoor. The IAR enables the determination of the most important frequencies responsible for sound propagation of the musical instruments. Furthermore, based on the results of the IAR, the modal patterns obtained from these frequencies are calculated. The Persian musical instruments were made in an original workshop in Tehran, Iran, then purchased and carried straight to Europe.
2. Materials and Methods
2.1. Acoustic Measurements on Musical Instruments
Apart from modal analysis, various other approaches have been introduced to study and evaluate the physical characteristics of musical instruments. Among these, we can distinguish physical and non-physical methods. Obviously, physical measurements can be of various kinds: mechanical, fluid-dynamic, chemical, electronic, and so on, and each one can contain subcategories (e.g., dendrochronology, mechanical resistance, C14, radiography, etc.). Acoustic measurements are therefore a small part of physical measurements, and are based essentially on two main phenomena: sound pressure (sound pressure, particle velocity, flow velocity) and mechanical vibration (acceleration, velocity, displacement). Consequently, the other main physical and acoustic measurements that can be identified are as follows:
acoustic impedance (driving point mechanical impedance or admittance);
directivity;
sound intensity;
damping (loss factor);
acoustic radiation;
finite element method (FEM);
interferometry;
frequency and impulse responses;
The last parameter allows the virtual emulation of the behavior of musical instruments by measuring impulse responses [
13,
14] as well as considering non-linear characteristics [
15,
16].
2.2. Sound Radiation from Musical Instruments
In order to determine the efficiency of the acoustic emissions of a surface that is vibrating, Fahy introduced the following relationship:
where
W represents the sound power radiated by a surface with area
S, which could be obtained by integrating the far-field intensity over a hemispherical surface centered on the panel;
represents the space-averaged value of the time-averaged normal distribution of velocity; and
represents the air density and
c the velocity of sound propagation (speed of sound).
The method introduced by Fahy could be also applied also to musical instruments, and it has been utilized by several researchers to the frame of musical instruments for calculating the possibilities of a soundboard to produce sound emission.
In 1984, Wogram introduced the parameter
F/
v, identifying
F as the excitation vector and
v as the corresponding velocity at the point of excitation (1984). Using the “surface-intensity” method (1986), Suzuki identified
where
I represents the time average intensity, measured in the near acoustic field (about 30 cm from the radiating surface), perpendicular to the vibrating surface; and
p and
a represent the pressure and acceleration at the measuring point, respectively. Giordano used the parameter
p/
v, where
p represents the sound pressure captured in the near field and
v represents the velocity of the soundboard (1998). It is worthwhile considering that a similar method has been recently developed for the acoustic situation of sound insulation [
17], far from musical instruments. Unfortunately, all these studies have one prevalent outcome: the frequencies of resonance have not coincided with those of acoustic emission, and they often have an adverse correlation.
2.3. Intensity of Acoustic Radiation—IAR
Starting from the studies described above, the intensity of acoustic radiation (IAR) parameter was defined as the space-averaged amplitude of the cross-spectrum between the sound pressure generated from the vibration of the surface and the velocity of the surface vibration. IAR is calculated by the equation
where
represents the sound pressure measured in near field, and
represents the vibration velocity of the vibrating surface (i.e., the soundboard). The measurements of IAR require an omnidirectional microphone located in a fixed position in the near field, about 25–30 cm over the instruments, which should correspond to about one-fourth of the principal dimension of the instrument. Instead of a perfect anechoic room, the measurements should be carried out in a dry room that is almost anechoic (i.e., less than 0.2 s at mid frequencies), where average radiation induced by early modes (at low frequencies) is easily achieved via the reverberation time. The acoustics chamber has no effect on the readings at higher frequencies. In addition, the measurements are enhanced by the space-averaging of information carried out by shifting transductors through the instruments. The previous measurements, conducted by one of the authors on a kettledrum, have demonstrated the perfect matching between theoretical and experimental modal patterns. These results were also obtained during measurements on other musical instruments, as in Carabattola [
18].
2.4. Persian Musical Instruments
Persian music utilizes a wide variety of musical instruments that differ from classical European ones in several aspects. Persian musical instruments could be regarded as similar to Indian instruments rather than European ones due to their features: many of them consist of a sound chest made with local wood, while the soundboard is often made from animal skin. In this paper, three distinct Persian stringed musical instruments, namely the thar, si-thar and santoor, were made in an original shop in Tehran, Iran, then purchased and carried straight to Europe. The scientific and historical literature on Persian musical instruments is very limited [
19]. Moreover, only a few papers are available that discuss the acoustic behavior of them [
20].
The thar (tār, tar,
تار) is a Persian long-necked string instrument (
Figure 1) that is commonly played in many countries on the Caucasus region. This musical instrument could be considered to be the most representative Persian musical instrument in view of its characteristic shape and sound. Often this musical instrument is also called a čāhārtār or čārtār, which means “four string” in Farsi. This is a common practice in Persian-speaking areas in which lutes are distinguished on the basis of the number of strings originally employed. Belonging to the lute family, the thar appeared in its present form in the middle of the eighteenth century and has since become one of the most important musical instruments in Iran and the Caucasus. The body is a double-bowl shape carved from mulberry wood, with a thin membrane of stretched lambskin covering the top. The long and narrow neck has a flat fingerboard with twenty-five to twenty-eight adjustable gut frets, and there are three double courses of strings. Its range is about two and one-half octaves (C3-A6), and it is played with a small brass plectrum.
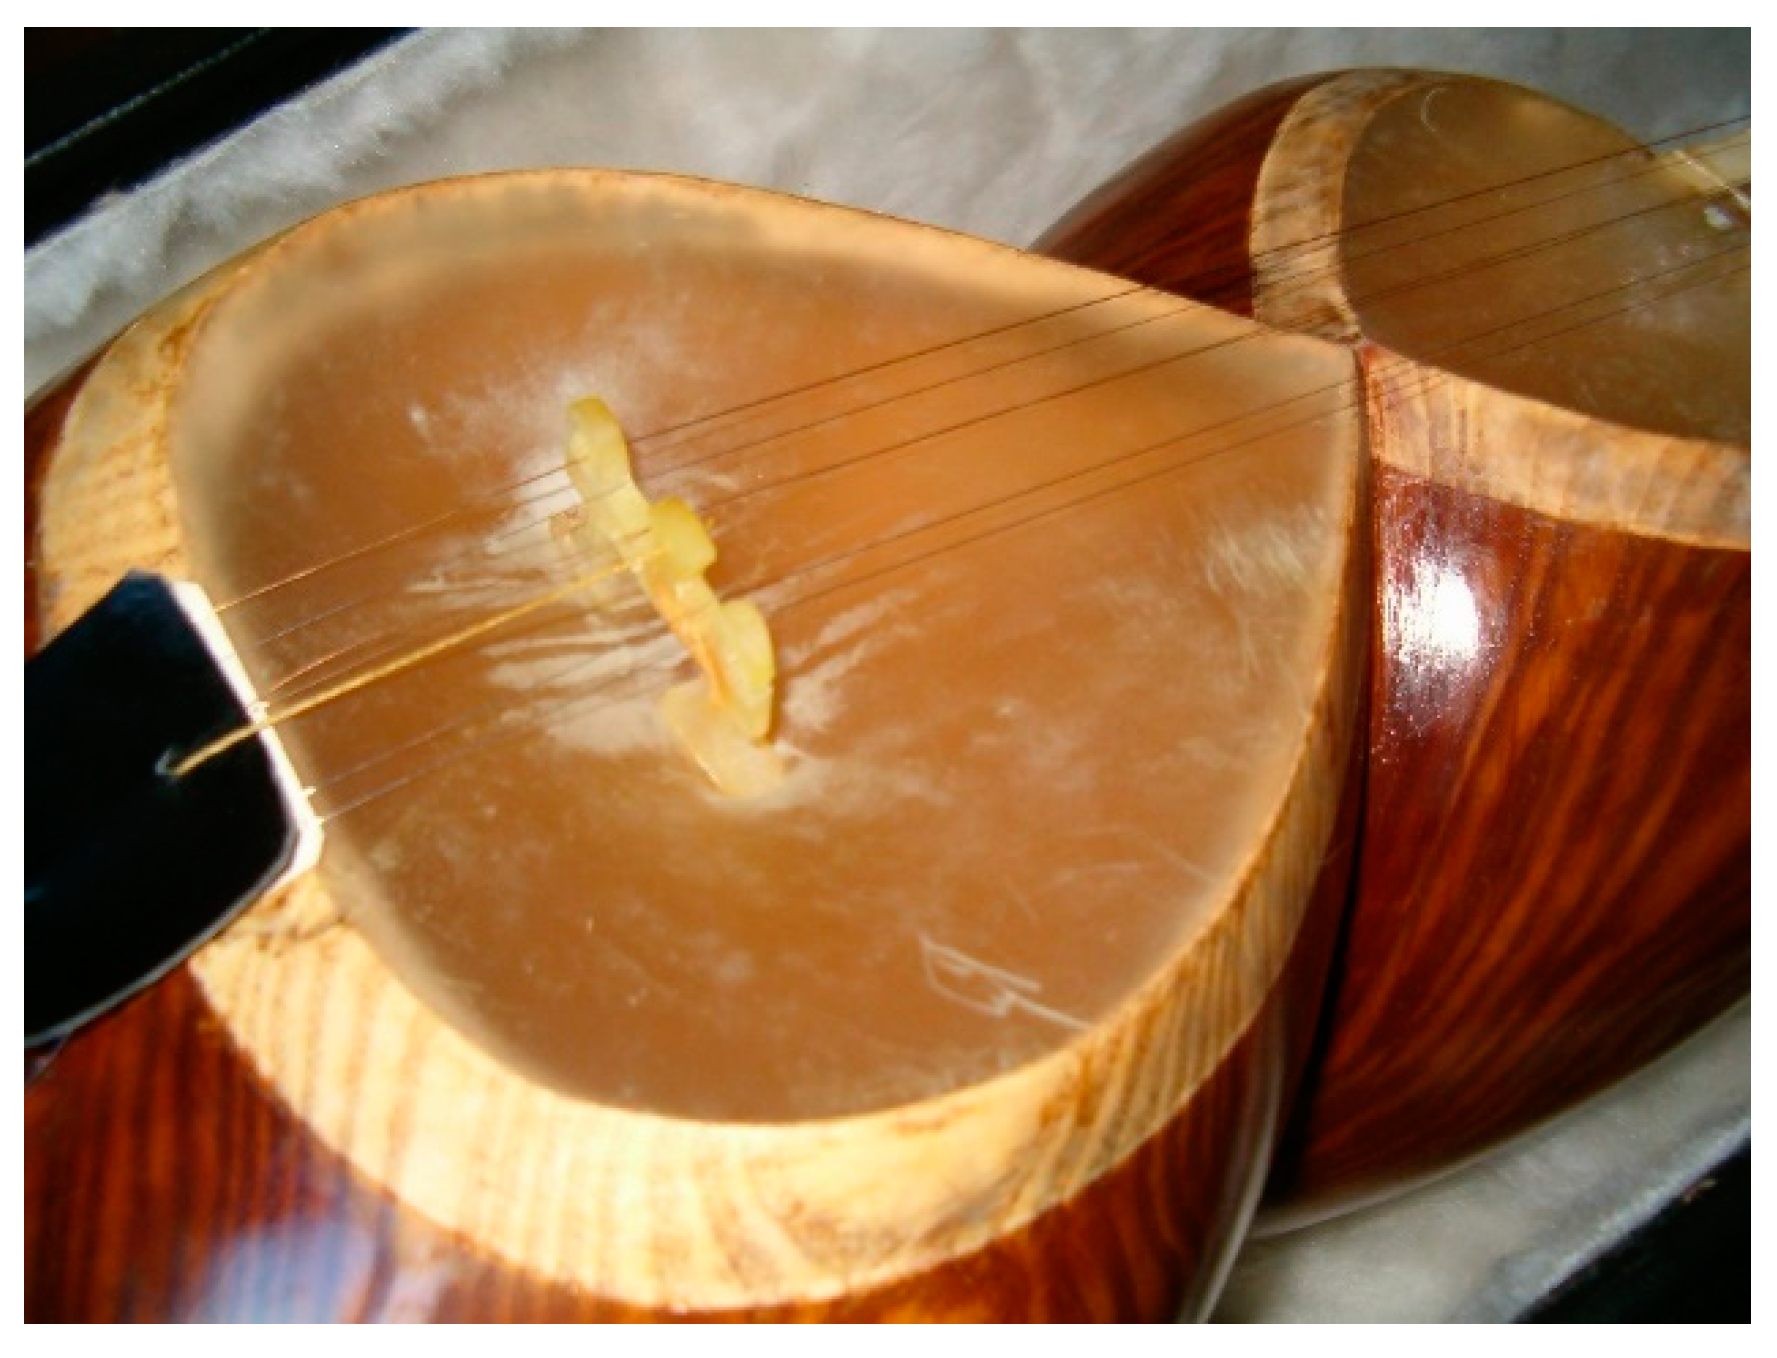
The si-thar (setâr,
سهتار) is another important Persian musical instrument (
Figure 2). It is a member of the lute family that is played with the index finger of the right hand. It has twenty-five to twenty-eight moveable frets that are usually made of gut. The si-thar covers more than two and a half scales (F4-G6). The ancestry of the si-thar can be traced to the ancient tanbur of Persia. As previously explained, following the rules of Persian speech, si-thar is literally translated as “three strings”.
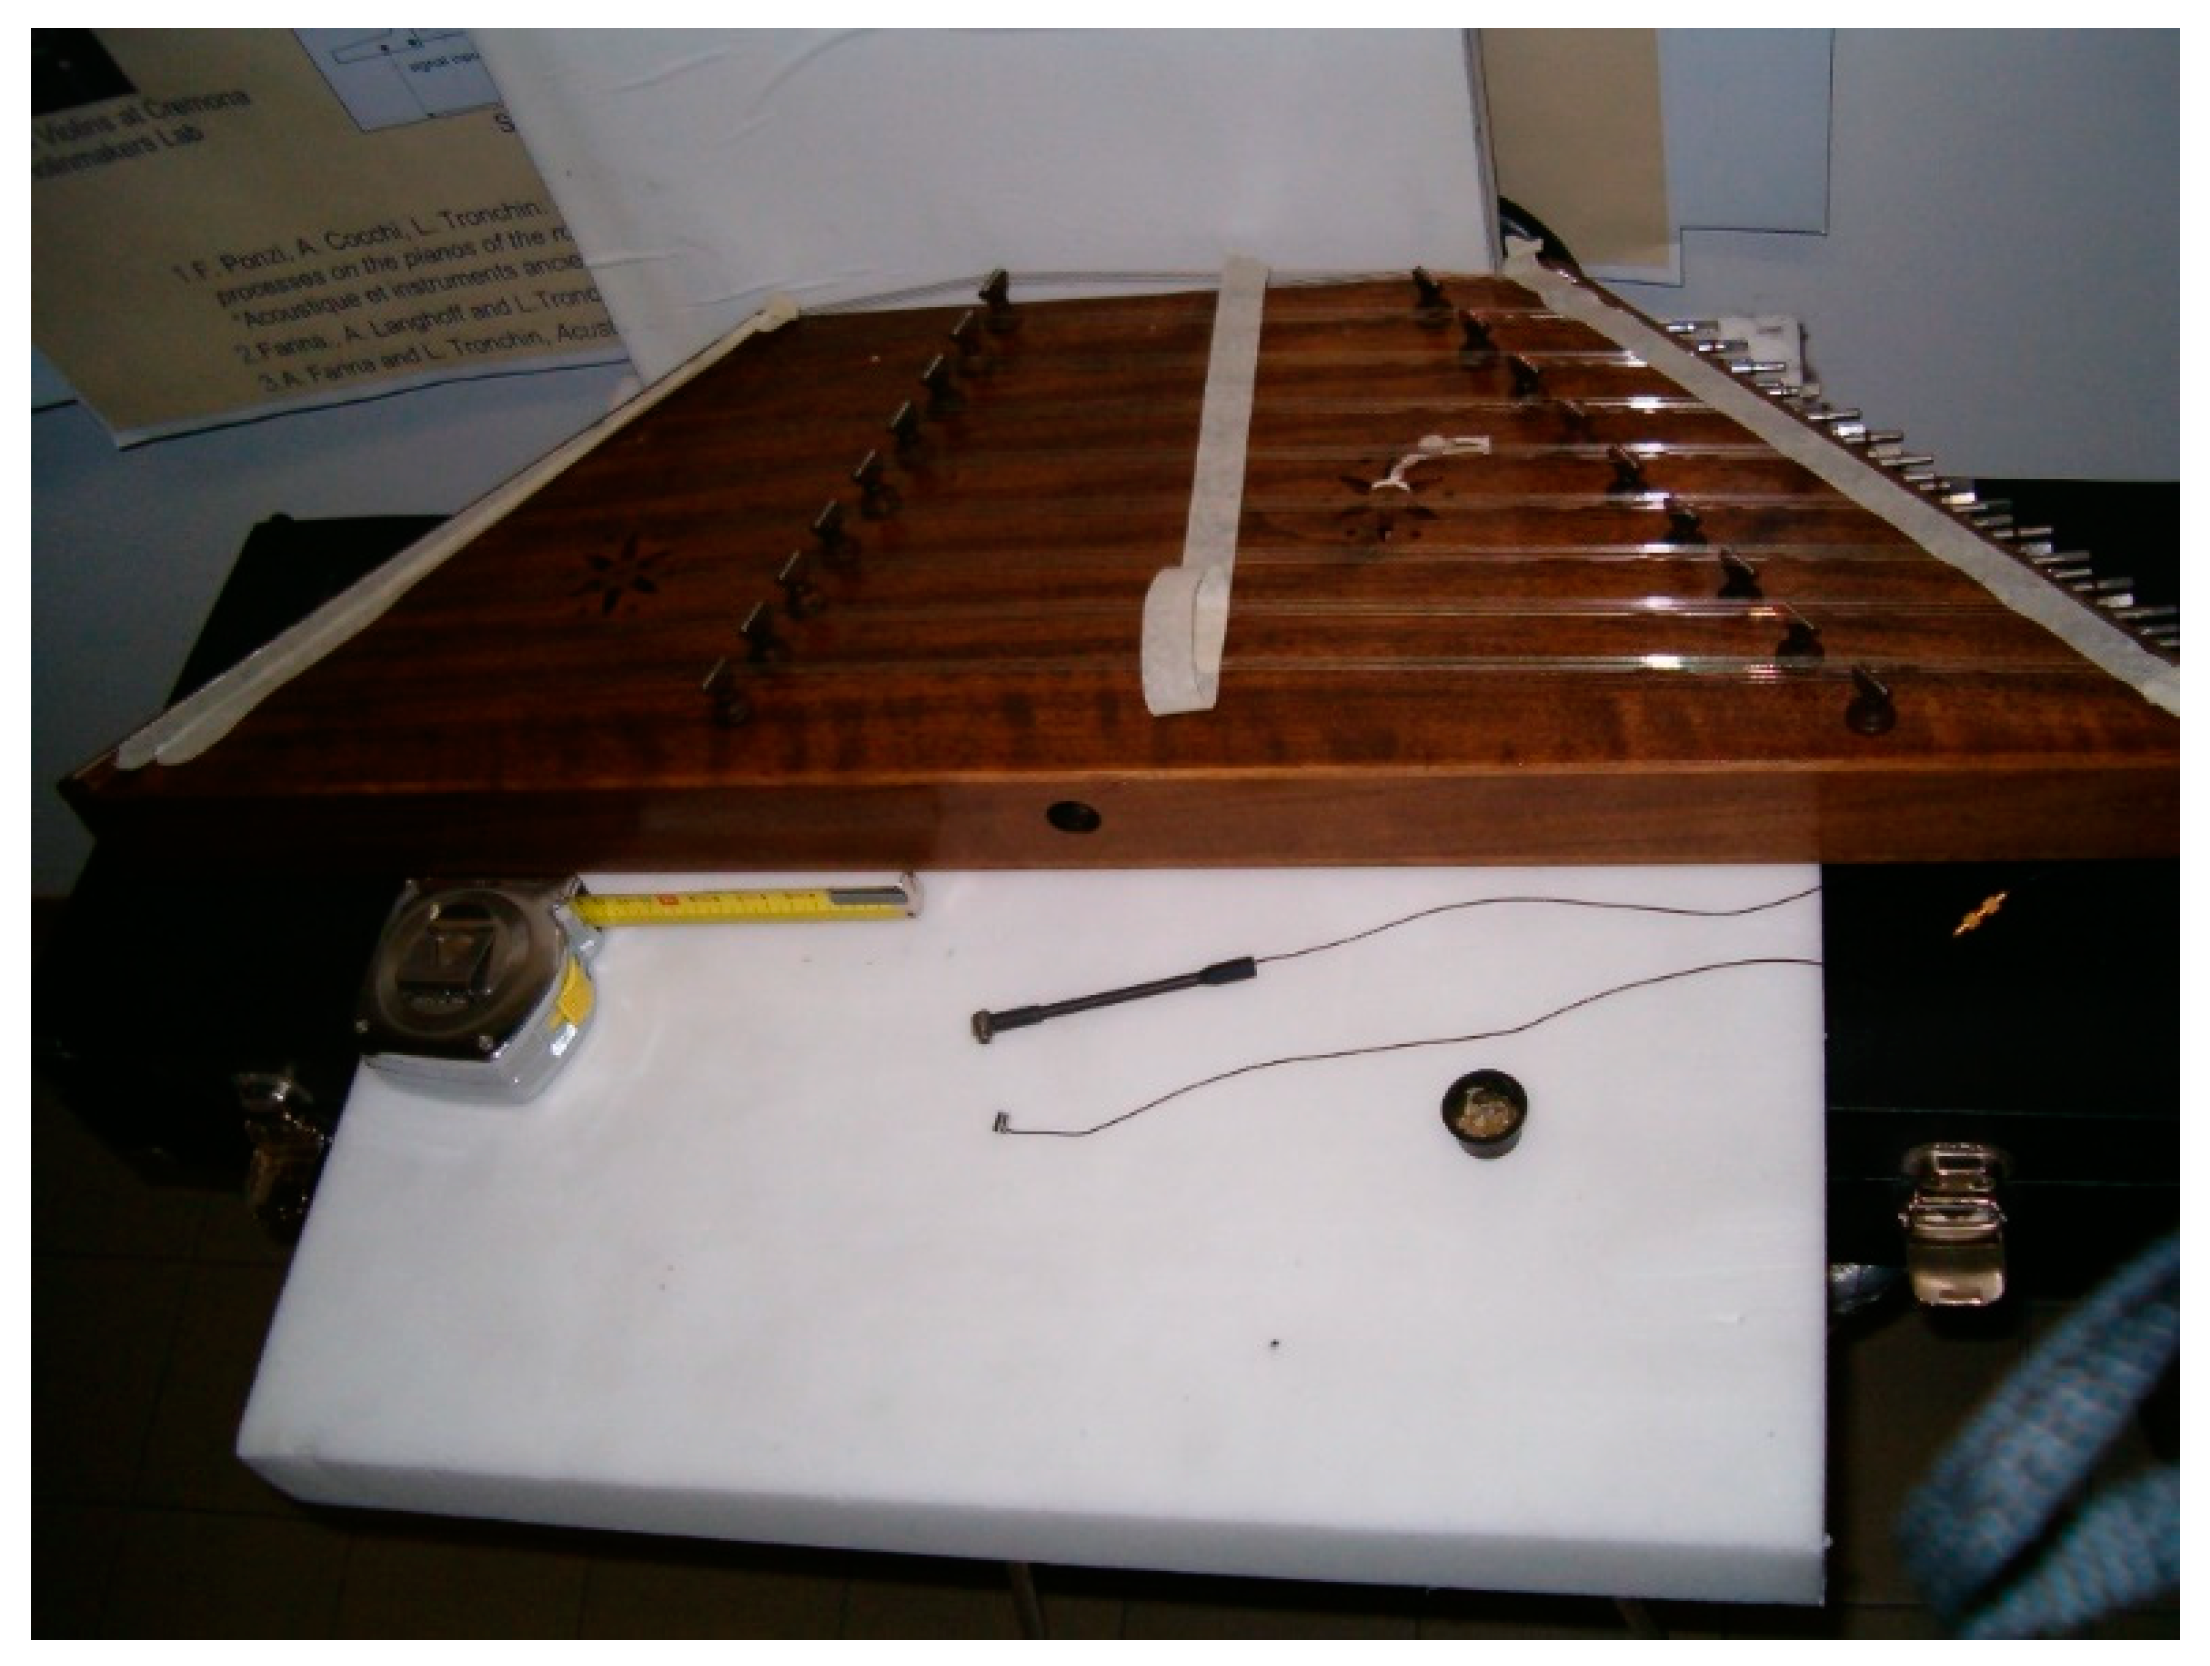
The santoor (santur,
سنتور) is a Persian three-octave (F3-G6) wooden-hammered dulcimer with seventy-two strings that are arranged on adjustable tuning pegs in eighteen quadruple sets, with nine (bronze) in the low register and nine (steel) in the middle register (
Figure 3). The santoor can be made from various kinds of wood depending on the desired sound quality. However, there is no scientific information about which would be the preferable wood. The front and the back of the instrument are connected by soundposts whose positions play an important role in determining the sound quality of the instrument. Although the santoor is very old, it was neither depicted in miniatures, nor presented in any other medium until the 19th century.
To the authors knowledge, these three musical instruments have never been studied from an acoustic perspective, and this paper aims to evaluate their quality by means of acoustic measurements of IAR and modal analysis.
2.5. Acoustic Measurements
In order to characterize the sound and vibrational behaviors of these three Persian musical instruments, a measurement campaign was conducted. The measurements were made in an almost anechoic listening room (i.e., the Arlecchino room at University of Bologna, the same one in which the first experiments on kettledrums were performed in 2005) [
11]. The room has a reverberation time lower than 0.2 s at 500 Hz, which helps to increase uniformity of sound radiation at low frequencies (i.e., at the first modes). At higher frequencies, the room acoustics do not influence the measurements. For all measurements, the equipment used was the following:
Hammer Brüel & Kjær type 8203;
Accelerometer Brüel & Kjær type 4374;
two charge amplifiers Brüel & Kjær type 2635;
PC equipped with 24 bit A/D converter soundcard and 8 channels with a 96 kHz sample rate;
Soundfield MKV microphone;
Based on reciprocity theory, the accelerometer was located at the bridge in all of the instruments, in a few fixed positions, whilst the soundboards were excited by the hammer in dozens of positions.
3. Results
During the measurements, both acoustic pressure and velocity vibrations were collected and stored, as well as the excitation signal from the hammer. The modal analysis was undertaken for resonant frequencies up to 1 kHz. In addition, as described in Equation (3), the IAR was calculated in a second step for all three musical instruments.
3.1. Thar
Since the soundboard in the thar is produced of lamb skin, measuring vibrations became quite difficult. The thar has a wooden sound chest built of double-heart string instruments. The following impedance graph (
Figure 4) displays an evaluation of the frequency response function along with the IAR.
The following images (
Figure 5) show the results of the modal analysis carried out during the analysis of acoustical characteristics of the thar.
3.2. The Si-thar
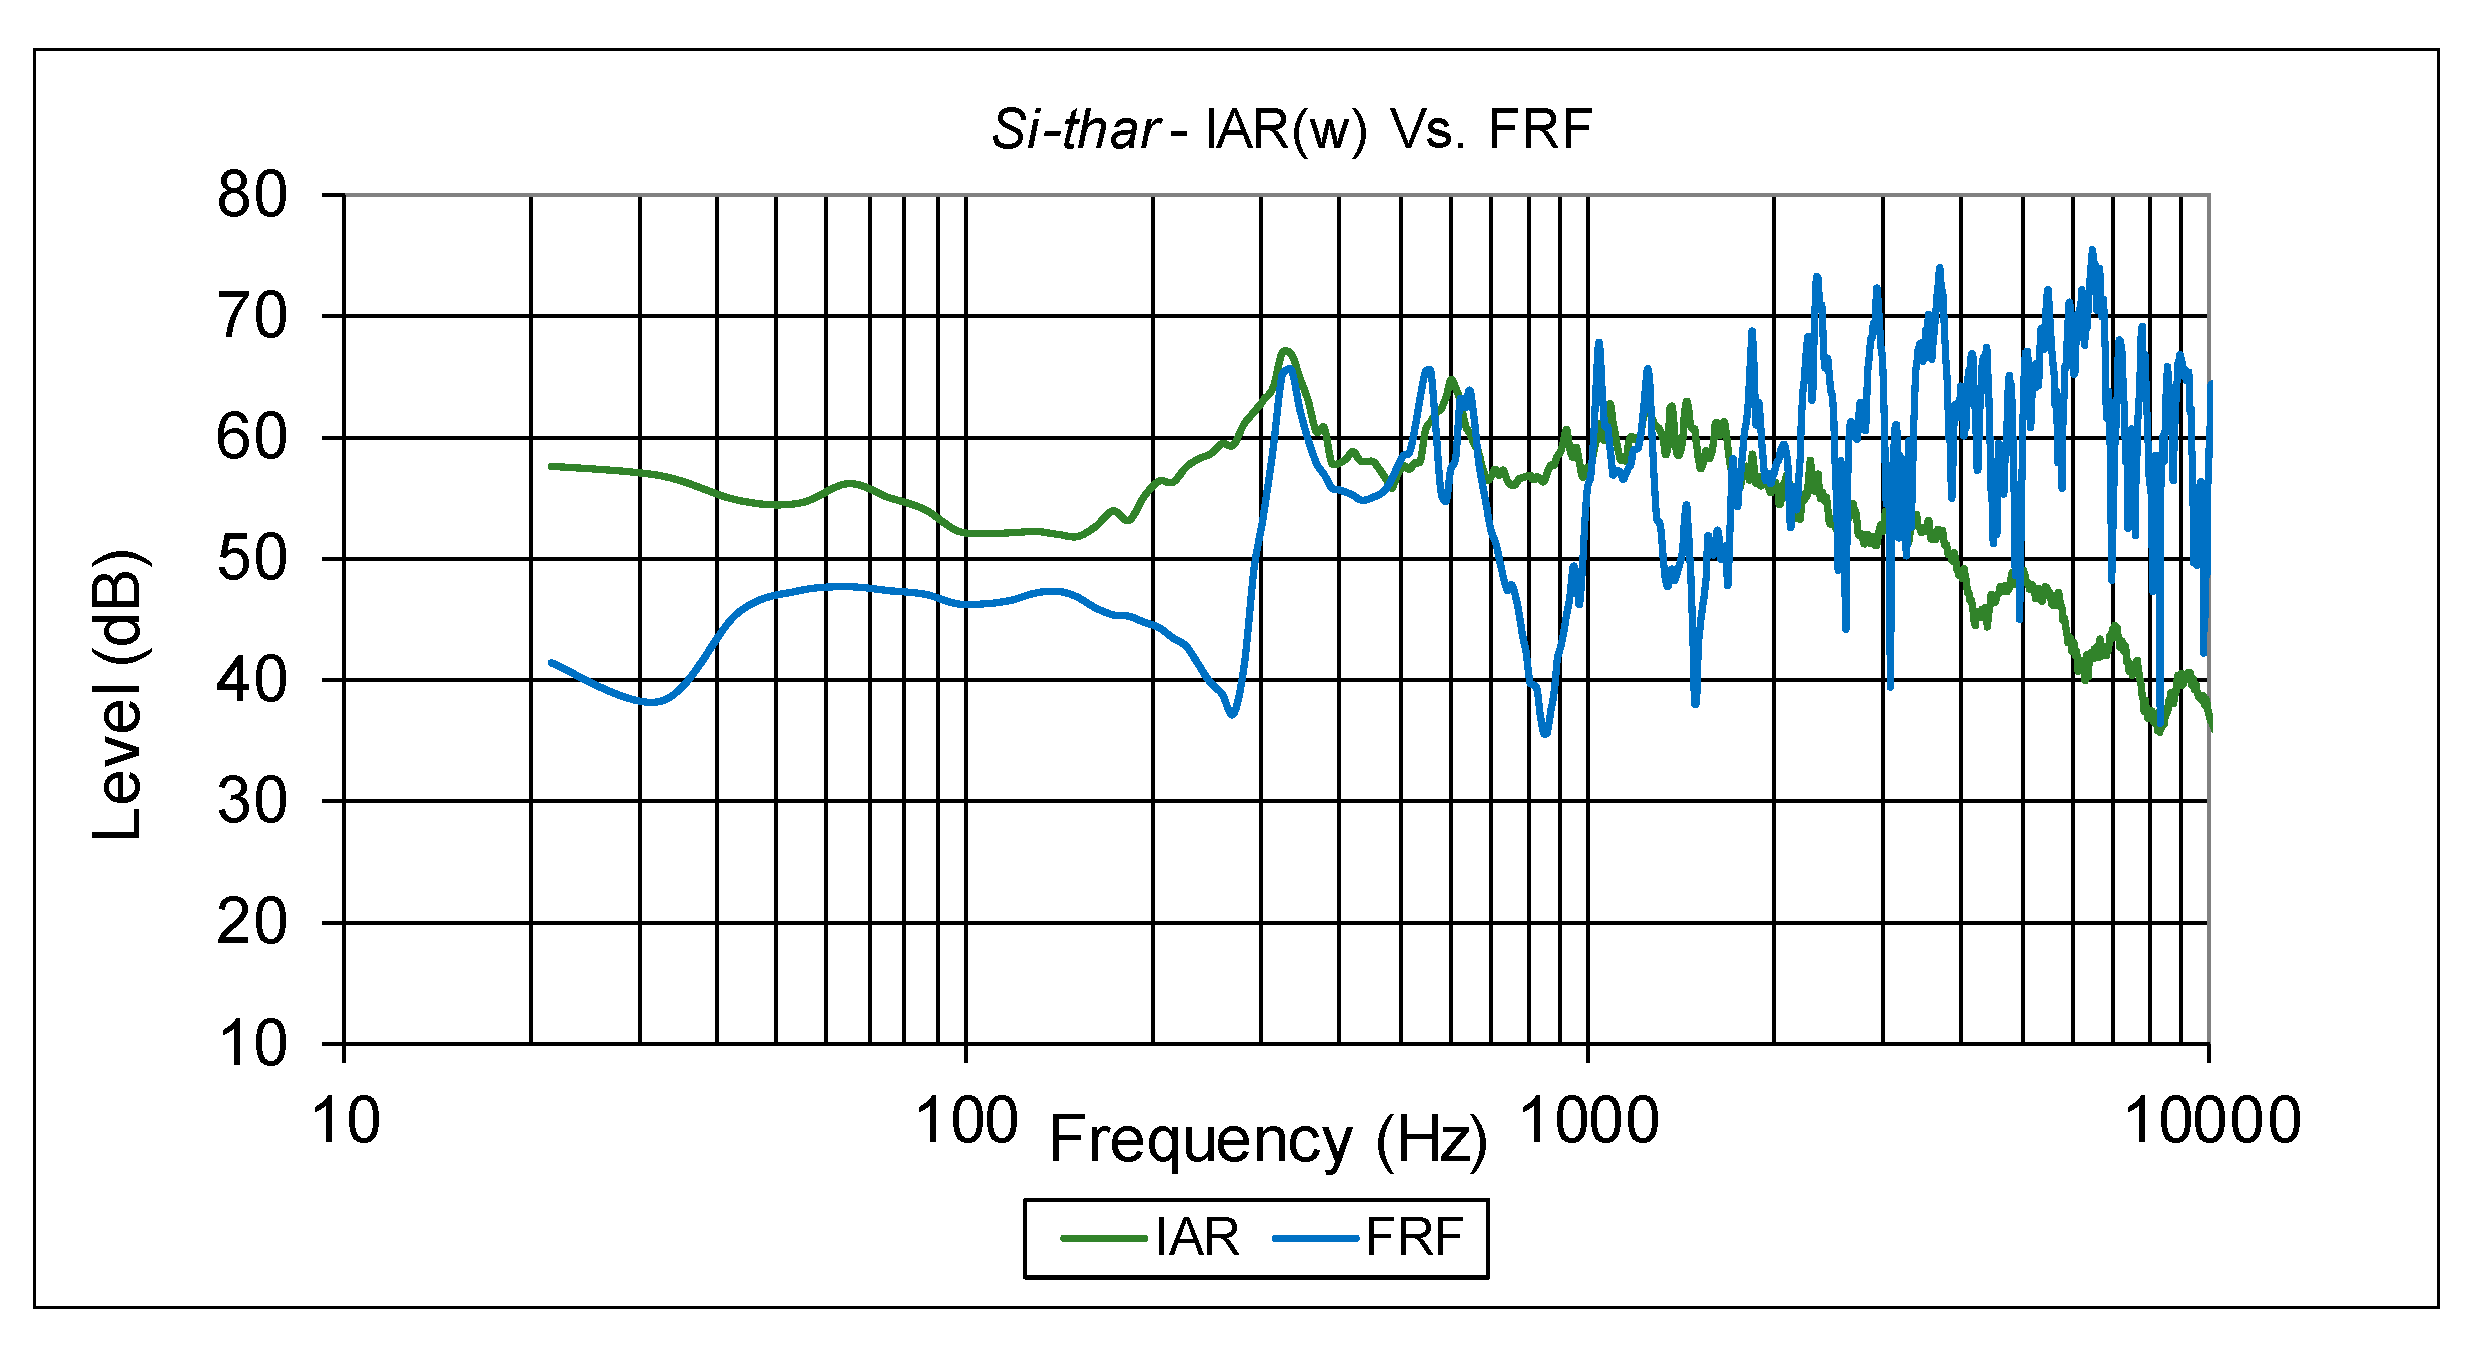
Due to its narrower size and lamb-skin soundboard, the Persian si-thar differs from the Indian one. As with the thar, the soundboard measurements required high precision and handling care. The following impedance graph (
Figure 6) displays an evaluation of the frequency response function along with the IAR.
Figure 7 shows the results relative to the modal analysis carried out during the analysis of acoustical characteristics of the si-thar.
3.3. The Santoor
The santoor resembles a xylophone or clavichord, and it simpler to move than the other instruments. Although the soundboard is produced from wood and is resistant, it becomes almost impossible to measure soundboard vibrations in the sound chest due to the complexity of the musical instrument, which has a high number of strings and the feasibility of moving the bridge.
Figure 8 show the impedance graph, which displays an evaluation of the frequency response function along with the IAR.
The modal analysis results obtained during the measurements are shown below (
Figure 9).
4. Discussion
Measurements of the IAR were reported in combination with FRF charts for all three musical instruments. In general, the low–mid IAR and FRF frequencies were near to each other in all cases, while correlations at the higher frequencies were lower. This result was already found for the kettledrum, and is a typical result of frequency analysis (with a narrow band of 10 Hz). Moreover, the thar and si-thar had a comparable frequency response. Both had a resonant frequency at 322 Hz, although they differed rather significantly at medium and high frequencies. Due to the large amount of cords and the more complicated form of the sound chest, the santoor generated a more balanced sound spectrum, which differentiated it from the other two string instruments.
By analyzing the results in more detail and comparing the IAR with modal analysis, we found the following:
In case of the thar, the most significative modal patterns that resulted were those at 322 and 462 Hz (i.e., a difference of 140 Hz). Moreover, if we consider the ratio between 322 and 140, it yields 2.3, whilst the ratio between 462 and 140 yields 3.3. This means that the ratio between the mode at 462 Hz and the mode at 322 Hz is 3:2 (i.e., a fifth), demonstrating that the dimensions of the two components of the soundboard allow a proper tuning of the frequency response of the musical instrument. This is not obvious, since the dimensions of the two components of the soundchest (i.e., the volume) are roughly in a 1:4 ratio.
In case of si-thar, analysis of the IAR showed that the two most relevant frequencies (i.e., the two main peaks) were 322 and 602 Hz, whereas for the FRF the most relevant frequencies among the 8 modal patterns reported here were 269, 322, 549 and 645 Hz. It could also be noted that 602 represents an important frequency for IAR, as it almost corresponds to the 592 Hz frequency at which the FRF has a minimum value and is between the two main values (549 and 645). Analyzing these frequencies, we see that, starting from 269 Hz while considering the value of 602 Hz for the IAR, they are in ratios of 6:5, 2:1, 18:8 and 12:5. This sequence represents almost a perfect minor natural (Zarlinian) scale, with 269–549 and 322–645 almost in the ratio of 2:1. This could be a reason for the typical melodies composed for this particular musical instrument.
The third musical instrument differed from the others for several reasons. For one thing, it is a percussion instrument, with a higher number of strings. Furthermore, the resonant cavity is much smaller and does not vibrate like the others, and the strings of the musical instrument are struck by little wooden hammers (mezrabs).
The analysis of IAR and modal patterns underlines the strong differences with the previous musical instruments. There was little evidence of specific resonant frequencies, even considering the IAR and FRF. The modal patterns were not very clear, unlike the previous cases. However, we could find a certain importance of the frequencies at 269 and 538 Hz (i.e., in the ratio 2:1), even if the corresponding modal pattern did not seem to underline a specific or noticeable shape. The other frequencies did not provide any specific evidence.
5. Conclusions
In this paper, the acoustic radiation and modal analysis of three Persian musical instruments was undertaken. The space-averaged amplitude of the cross spectrum <p v> between sound pressure—measured at a fixed point of 25 cm from the instruments—and vibration velocity of the soundboard was calculated for several measuring points. This was the intensity of acoustic radiation parameter (IAR). Comparing the two graphs (i.e., the IAR and the FRF), some modal patterns for each musical instrument were obtained and reported. In the case of thar and si-thar, we found significant values of resonant frequencies that were in a harmonic ratio (3:2 for the thar; 2:1, 6:5, 18:8 and 12:5 for the si-thar). For each frequency, a clear modal pattern was obtained. In the case of the santoor, modal patterns were less evident than in the other musical instruments due to the complexity of the instrument, and we only found a significant value of frequencies in the ratio of 2:1. These results provide an initial description of the vibro-acoustic behavior of three important Persian musical instruments. Since the thar and si-thar have a similar vibroacoustic behavior, it is likely that other similar Persian (or Caucasian) stringed musical instruments might have the same sound characteristics. On the other hand, musical instruments like the santoor behave differently.


