Article

Tonic and Phasic Amperometric Monitoring of Dopamine Using Microelectrode Arrays in Rat Striatum

by
Martin Lundblad
1,†,
David A. Price
1,†,
Jason J. Burmeister
1,†,
Jorge E. Quintero
1,
Peter Huettl
1,
Francois Pomerleau
1,
Nancy R. Zahniser
2,‡ and
Greg A. Gerhardt
1,*
1
Department of Neuroscience, Center for Microelectrode Technology and Brain Restoration Center, University of Kentucky Medical Center, MN206, Lexington, KY 40536-0298, USA
2
Department of Pharmacology, Neuroscience Program, University of Colorado Denver, Aurora, CO 80045, USA
*
Author to whom correspondence should be addressed.
Co-First Authors.
Professor Nancy R. Zahniser died unexpectedly on 5 May 2016.
Appl. Sci. 2020, 10(18), 6449; https://doi.org/10.3390/app10186449
Submission received: 7 August 2020 / Revised: 28 August 2020 / Accepted: 9 September 2020 / Published: 16 September 2020
(This article belongs to the Special Issue Advanced Electrochemical Biosensors)

Abstract

:
Here we report a novel microelectrode array recording approach to measure tonic (resting) and phasic release of dopamine (DA) in DA-rich areas such as the rat striatum and nucleus accumbens. The resulting method is tested in intact central nervous system (CNS) and in animals with extensive loss of the DA pathway using the neurotoxin, 6-hydroxyDA (6-OHDA). The self-referencing amperometric recording method employs Nafion-coated with and without m-phenylenediamine recording sites that through real-time subtraction allow for simultaneous measures of tonic DA levels and transient changes due to depolarization and amphetamine-induced release. The recording method achieves low-level measures of both tonic and phasic DA with decreased recording drift allowing for enhanced sensitivity normally not achieved with electrochemical sensors in vivo.

1. Introduction

Dopamine (DA) serves as a principle neurotransmitter for essential brain pathways that regulate affect, cognition, movement, and reward [1]. Analytical approaches for the detection and quantification of extracellular levels of brain DA have been of the utmost importance for elucidating its role as a modulatory neurotransmitter and for advancing our understanding of how brain DA systems impact ongoing behavior [2,3]. Extracellular DA is present in both synaptic and extrasynaptic pools, which enables differential modulation of pre- and postsynaptic neuronal signaling [4]. Following activity-dependent release, diffusion mediates spillover of synaptic DA into extrasynaptic pools where DA transporters (DATs) are involved in “regulating the sphere of influence and lifetime of released DA beyond a synapse [5].” However, current analytical techniques are unable to measure both tonic and phasic levels of DA simultaneously and, thus, require the use of a complementary approach to investigate the “missing” component of extracellular neurotransmitter dynamics. In turn, there is a need for the effective simultaneous measure and quantitation of synaptic and extra-synaptic DA levels using neurochemical methods that combine real-time monitoring with high spatial-temporal resolution and sensitivity.
Microdialysis sampling coupled with powerful analytical technologies has been the conventional approach for quantifying extracellular neurotransmitter levels in vivo. Once collected, dialysate samples are processed with separation analytics like high-performance liquid chromatography (HPLC), providing measurements with excellent chemical selectivity and sensitivity while affording the opportunity to measure multiple analytes for both acute and chronic in vivo studies [6]. Although high-level chemical selectivity and sensitivity measures have become hallmarks of such strategies, the low-level spatial-temporal resolution of sampling continues to generate curiosity regarding the missed neurochemical dynamics that occur between the large inter-sample intervals (typically 10 min) while spurring controversy as to which extracellular pool of neurotransmitters is being sampled [7,8]. While sampling rates have continued to undergo refinement towards improving temporal resolution (e.g., up to 1 sample per 10 s), second-by-second or sub-second monitoring has not hitherto been achieved [6,9]. Microdialysis probes typically have an active length of 1–4 mm with tip diameters of 0.2–0.3 mm, which places the sampling resolution of this approach at >0.1 mm3 [6]. Because of its large size, probe-induced tissue damage and neuroinflammation may culminate in secondary effects on neurotransmitter efflux and resting levels, further complicating the interpretation of results [10,11,12,13]. Thus, despite the tandem use of powerful separation analytical approaches, the low-level spatial-temporal resolution of microdialysis continues to limit its capabilities for monitoring phasic neurotransmission in vivo.
In vivo electrochemical approaches have emerged as a complementary collection of techniques to microdialysis as they “provide answers that are not presently accessible by microdialysis or any other measurement technique [11].” For example, in vivo electrochemistry has been instrumental to identifying the presence of spontaneous DA release and regulation of DAT-mediated clearance of DA [14,15,16,17,18]. Electrochemical sensors are designed for use in freely moving behavioral recordings where higher resolution is necessary to capture transient DA events. While the chemical selectivity achieved with powerful separation technologies is irrefutable, the spatial-temporal resolution of electrochemical techniques greatly exceeds that of microdialysis probes and, thus, enables sub-second measures with an electrode diameter of 5–200 μm [19]. Importantly, smaller sized electrochemical electrodes produce less tissue responsiveness and damage post-implantation in the brain [20,21]. Although advances in electrochemical approaches have opened up new avenues in the area of in vivo neurotransmitter monitoring including 3D printed carbon electrodes, submicron sized cavity carbon-nanopipette electrodes, sub-millisecond resolution measuring DA over months, and optogenetic stimulation, the most significant shortcoming of these approaches for measures of extracellular DA continues to be the inability to resolve resting neurotransmitter levels [14,22,23,24,25].
Here, we describe the development and implementation of ceramic-based microelectrode arrays (MEAs) for intracranial monitoring of tonic and phasic DA neurotransmission by: (1) demonstrating the ability of MEAs to measure DA in vitro and in vivo with constant potential amperometry; (2) discussing in vivo testing through proof-of-concept experiments using normal and denervated striatum in anesthetized rats; and (3) introducing new developments for the measurement of brain DA through a conformal MEA design that enable the real-time, simultaneous monitoring of DA from multiple depths in the rat brain.

2. Materials and Methods

2.1. Reagents

Unless stated otherwise, laboratory chemicals were purchased from Fisher Scientific (Waltham, MA, USA) or Sigma Aldrich (St. Louis, MO, USA).

2.2. Experimental Subjects

Male Sprague–Dawley rats (10–12 weeks old; Harlan Laboratories, Inc.; Indianapolis, IN, USA) were individually housed on a 12 h light/dark cycle with ad libitum access to food and water. Animals were acclimated ≥1 week before any experiment. All procedures involving the use of animals were carried out in accordance with the National Institutes of Health Guide for the Care and Use of Laboratory Animals and were approved by the Institutional Animal Care and Use Committee of the University of Kentucky (IACUC Identification Number: 2019-3387).

2.3. Dopamine (DA) Lesions

Striatal DA was depleted by unilateral infusion of 6-hydroxydopamine (6-OHDA) into the medial forebrain bundle (MFB), which causes an extensive and non-recoverable lesion to the DA neurons [26,27]. Animals were anesthetized by inhalation of 1.5–3% isoflurane (Isothesia™, Butler; Dublin, OH, USA) and, once stable, were administered Rimadyl® (5 mg/kg, intraperitoneal injection (i.p.)) for pre-operative analgesia. Body temperature was maintained using a recirculating water blanket (Gaymar® Industries, Inc.; Orchard Park, NY, USA). The right MFB was infused with 6-OHDA (3.0 μg/μL) or vehicle—sterile saline containing 0.02% ascorbic acid (AA)—at a flow rate of 1 μL/min through a 26 s gauge GASTIGHT Hamilton syringe (Hamilton Company; Reno, NV). The delivered volumes and stereotaxic coordinates were 2.5 μL at tooth bar (TB): −2.3 mm, anterior-posterior (AP): −4.4 mm, medial-lateral (ML): −1.2 mm, dorsal-ventral (DV): −7.8 mm and 2.0 μL at TB: +3.4 mm, AP: −4.0 mm, ML: −0.8 mm, DV: −8.0 mm. The AP and ML stereotaxic coordinates were taken with respect to Bregma and DV coordinates were determined relative to the brain surface for all stereotaxic surgeries [28]. Following infusion, the syringe was left in place for 2.5 min before being slowly retracted.

2.4. Microelectrode Array (MEA) Preparation

The photolithographic fabrication of ceramic MEAs has previously been described in detail [27,29]. All electrochemical procedures were carried out using the FAST-16 mkII recording system and software (Quanteon, L.L.C.; Nicholasville, KY, USA). The present study used S2 (Side-by-Side 2nd generation, Figure 1A) and Double-Sided-Pair-Row-8 pairs, conformal DSPR8 (Figure 1B) ceramic-based MEAs which were obtained from the Center for Microelectrode Technology cost center (University of Kentucky, Lexington, KY, USA). S2 MEAs, have previously been characterized [25]. These comprised n = 4 platinum recording sites (15 × 333 μm each) geometrically arranged as two side-by-side pairs (30 μm between sites within a pair, 100 μm separation between pairs) [30]. The newly designed, conformal DSPR8 MEAs comprised n = 8 platinum recording sites (50 × 100 μm each) geometrically arranged as four vertically aligned pairs (100 μm between sites within a pair) with differential spacing between pairs to enable simultaneous electrochemical recordings at multiple brain depths along the dorsal-ventral plane (Figure 1B). All MEAs were prescreened to select electrodes that had recording site sensitivities for analytes that were within +/− 10% standard deviation (SD) to achieve the analytical performance necessary for the studies. On the day before electrochemical recordings, all Pt recording sites were coated with the anionic polymer Nafion® (Figure 1A,B), which repels negatively charged interferents such as AA and 3,4-dihydroxyphenylacetic acid (DOPAC), as previously described [29,31,32]. One site within each pair of S2 MEAs (Figure 1A) or the upper recording site of each pair of the DSPR8 MEAs (Figure 1B) was then selectively electroplated with m-phenylenediamine (m-PD), a size exclusion barrier that blocks DA and other large molecules from reaching the Pt recording sites [33]. m-PD was selectively electrodeposited onto individual platinum recording sites as previously described [34]. Following coating with Nafion® and differential electroplating with m-PD, MEA tips were soaked in phosphate-buffered saline (PBS) at 25 °C overnight prior to use to remove excess m-PD molecules. The final configuration of S2 (Figure 1A) and DSPR8 (Figure 1B) MEAs consisted of Nafion®-only sites (i.e., DA sites) and Nafion®-coated + m-PD electroplated sites (i.e., sentinel sites).

2.5. In Vitro Microelectrode Array Electrochemistry

On the day of in vivo electrochemical recordings, MEAs were individually calibrated in 40 mL of stirred 25 °C PBS (0.05 M; pH 7.4) as previously described [30]. Constant potential amperometry was used for all electrochemical experiments. A +0.35 V potential vs. a RE-5B Ag/AgCl reference (Bioanalytical Systems; West Lafayette, IN, USA) was applied at a frequency of 1 Hz (S2) or 4 Hz (DSPR8); 1 Hz and 4 Hz data were comparable. After establishing a stable baseline, interferent(s) and analyte additions were made to the stirred solution. Unless stated otherwise, AA (250 μM) and three additions of DA (2 μM increments) served as the interferent and analyte, respectively.

2.6. In Vivo Microelectrode Array Electrochemistry

Surgical procedures for in vivo electrochemical studies were carried out as previously described [35,36]. Animals were anesthetized with urethane (1.25 g/kg, i.p.), and body temperature was maintained using a re-circulating water blanket. A Ag/AgCl reference wire was placed in the superficial cortex through a hole drilled caudal to the MEA implantation site. Calibrated S2 MEAs were first targeted to the primary motor cortex using the following coordinates: AP: +1.0 mm, ML: ±2.5 mm, DV: −2.0 mm. After establishing a baseline signal in cortex, S2 MEAs were lowered ventrally with the aid of a microdrive to the dorsal striatum (dSTR) to a new DV coordinate of −3.5 mm. DSPR8 MEAs were implanted using the following coordinates: AP: +1.0 mm, ML: −2.5 mm, DV: −6.3 mm. In all cases, the tip of the MEA device was lowered to the indicated DV coordinate with respect to the brain surface. Once implanted, saline-soaked cotton balls or gauze were placed around the MEA shank to keep the brain surface moist. For some studies, micropipettes were affixed to S2 MEAs (aligned in the center between upper and lower recording pairs) for the local delivery of isotonic KCl (120 mM KCl, 20 mM NaCl, 2.5 mM CaCl2; pH 7.4) as previously described [34]. At the end of in vivo electrochemical recordings, each animal was sacrificed by decapitation.

2.7. Determination of Striatal DA Tissue Content

The tissue content of DA in the dorsal striatum was determined from normal and 6-OHDA lesioned animals as previously described [37].

2.8. Data and Statistical Analyses

All data are expressed as the mean ± standard error of the mean (SEM). Means were determined by summing the individual samples then dividing by the number of samples. Standard deviation was calculated by taking the square root of the variance. Variance was calculated by averaging the squared differences from the mean. SEM was calculated by dividing the standard deviation of the samples by the square root of the sample size. Selectivity, linearity (R2), sensitivity (i.e., DA slope) and limit of detection (LOD) were calculated for all recording sites as previously described [29]. In the case of S2 MEAs, self-referencing was used to identify and eliminate interfering signals and background charging current from the analyte response as previously described [32]. Thus, signals from sentinel sites were subtracted from those of DA sites of S2 MEAs to yield one self-referenced signal per pair of platinum recording sites (i.e., the self-referenced signal). Stable baseline recordings were first obtained from the primary motor cortex (i.e., an area of low DA innervation) in each animal before recording from the dorsal striatum (i.e., area of high DA innervation) [38,39]. The average current of the self-referenced cortical signal 1 min prior to relocation to the dSTR was subtracted from each point of the self-referenced dSTR signal of the same animal to determine the resting DA current.

3. Results

3.1. In Vitro Characterization of MEAs for Measuring DA

The recording properties of 4-channel S2 (Figure 1A) and 8-channel DSPR8 (Figure 1B) MEAs configured for the measurement of DA were evaluated through in vitro calibrations in PBS (Table 1). Constant potential amperometry (Eapplied = +0.35 V) was used to measure DA at individual recording sites over a DA concentration range of 0–6 μM (2 μM increments). Oxidation of DA with the MEA recording sites occurred at any potential greater than +0.2 V vs. Ag/Ag+ on the MEAs [40]. The applied potential of +0.35 V was chosen because it achieved a robust DA response while limiting oxidation of species that could be present like H2O2 or NO that oxidize at higher potentials. Nafion®-coated DA recording sites on both S2 and DSPR8 MEAs had excellent linearity for DA detection while effectively maintaining high selectivity ratios for DA over 250 μM challenges of AA (Table 1) or DOPAC (data not shown). As shown in Table 1, both MEA types demonstrated high-sensitivity measurements of DA (range, in pA/μM: S2, −5.9 to −121.3; DSPR8, −3.5 to −107.2), nanomolar limits of detection recorded without self-referencing subtraction (range, in nM: S2, 2.7 to 430; DSPR8, 1.9 to 100.0) and showed similar sensitivity per unit area measurements of DA (range, in pA/μM−1/mm−2: S2, −1181 to −24,277; DSPR8, −696 to −21,437). Importantly, sentinel recording sites (i.e., Nafion®-coated + m-PD) did not respond to additions of DA or AA. Sensitivity/area is comparable to previous work [29].

3.2. Proof-of-Concept for MEA-Based In Vivo Measures of Phasic and Tonic DA Levels

The high level of spatial-temporal resolution imparted by in vivo electrochemical technologies with microelectrodes has been instrumental to shaping current views of phasic DA neurotransmission in the areas of release and uptake [11]. The ability of S2 MEAs to measure phasic changes in extracellular DA was determined in the dSTR of anesthetized rats with and without a 6-OHDA lesion. The in vivo MEA response was tracked following the local application of DA (100 nL; 200 μM, pH 7.4) in the dSTR (data not shown). In addition to detecting exogenous DA, MEAs successfully captured active DA uptake—indicated by the descending portion of the curve. In keeping with previous observations from our laboratory using carbon fiber microelectrodes, amplitude-matched DA signals were cleared more slowly in the lesioned vs. non-lesioned dSTR [41]. Figure 2 shows the in vivo MEA response to repeated applications of KCl (100 nL; 120 mM, pH 7.4) in the dSTR, which stimulates neurotransmitter release from nerve terminals. Ejection of KCl in the non-lesioned dSTR stimulated endogenous DA release (peak amplitude in μM: first stimulation, 4.3; second stimulation, 3.1). Importantly, KCl-evoked DA release in the lesioned dSTR was significantly reduced for both the first and second applications of KCl (peak amplitude in μM based on the calibration slope calculated in pA/μM: first stimulation, 0.1; second stimulation, 0.05). In addition, while the rat striatum has norepinephrine and serotonin nerve terminals that can be detected by the MEAs, the KCl-evoked signals are dramatically reduced in the lesioned striatum showing that the signal recorded is likely predominantly DA. The MEAs are known to respond to serotonin and norepinephrine in vitro and in vivo, but the levels of these neurotransmitters in vivo are 40–1000 folds lower than the DA based on the tissue levels of the monoamines [42]. Collectively, these data support the use of MEAs for traditional measures of in vivo DA signals.
The inability of in vivo electrochemical techniques to measure tonic DA levels continues to be a major shortcoming and necessitates that a complementary approach (e.g., microdialysis) be used to study resting DA levels [7]. While the combined approach escalates the complexity, cost and commitment to a study, inclusion of one approach and not the other may only be appropriate for certain experimental designs. MEAs have been routinely utilized to quantify both evoked and resting glutamate levels in the CNS [30,32,33,34,43,44,45,46]. Therefore, we employed 4-channel S2 MEAs in initial studies aimed at providing proof-of-concept for measurement of tonic DA levels in the dSTR of anesthetized rats. Preliminary studies determined that self-referencing alone did not always remove the intrinsic background current of S2 MEA recording sites in vivo (data not shown). Therefore, we utilized the small size of the MEA device to record electrochemical signals in brain regions that differ with regard to dopaminergic innervation—DA innervation is low in the primary motor cortex and high in the dSTR—in conjunction with the self-referencing approach to establish a baseline electrochemical signal in the brain microenvironment (Figure 3A). MEAs were first positioned in the cortex, and after establishing a stable baseline signal (typically ≥90 min), S2 MEAs were lowered ventrally to a final recording position in the dSTR (Figure 3A). Initially, the self-referenced baseline signal measured by DA sites appeared to be comparable between the cortex and dSTR (Figure 3B). However, Figure 3B shows that the dSTR baseline signal is actually greater (i.e., flipped) vs. the cortical baseline signal (in vivo baseline current, in pA: cortex, 71.7; dSTR, 73.0). Thus, by first recording in the primary motor cortex, which is void of DA, the electrochemical current in the dSTR and background electrochemical current of the brain could be distinguished. We next used these basic principles to measure tonic (i.e., resting) DA levels in the dSTR of rats with and without a 6-OHDA lesion. Following self-referencing, the cortical baseline signal was subtracted from the dSTR baseline signal to remove the background electrochemical current to enable resting DA levels to be quantified. The S2 MEA approach showed a significant 88% decrease of resting DA levels in the dSTR (in nM: non-lesioned, 19.4 ± 2.1; 6-OHDA, 2.3 ± 1.3 ***; paired t-test, *** p < 0.001). HPLC confirmed a 99% loss of DA tissue content in the denervated dSTR (in μg/g of tissue: non-lesioned, 6.3 ± 0.8; 6-OHDA, 0.03 ± 0.002). These low nanomolar levels of resting DA are consistent with studies using no net flux microdialysis [6,47,48,49,50] and the recent square wave voltammetry study by Taylor et al. [51].

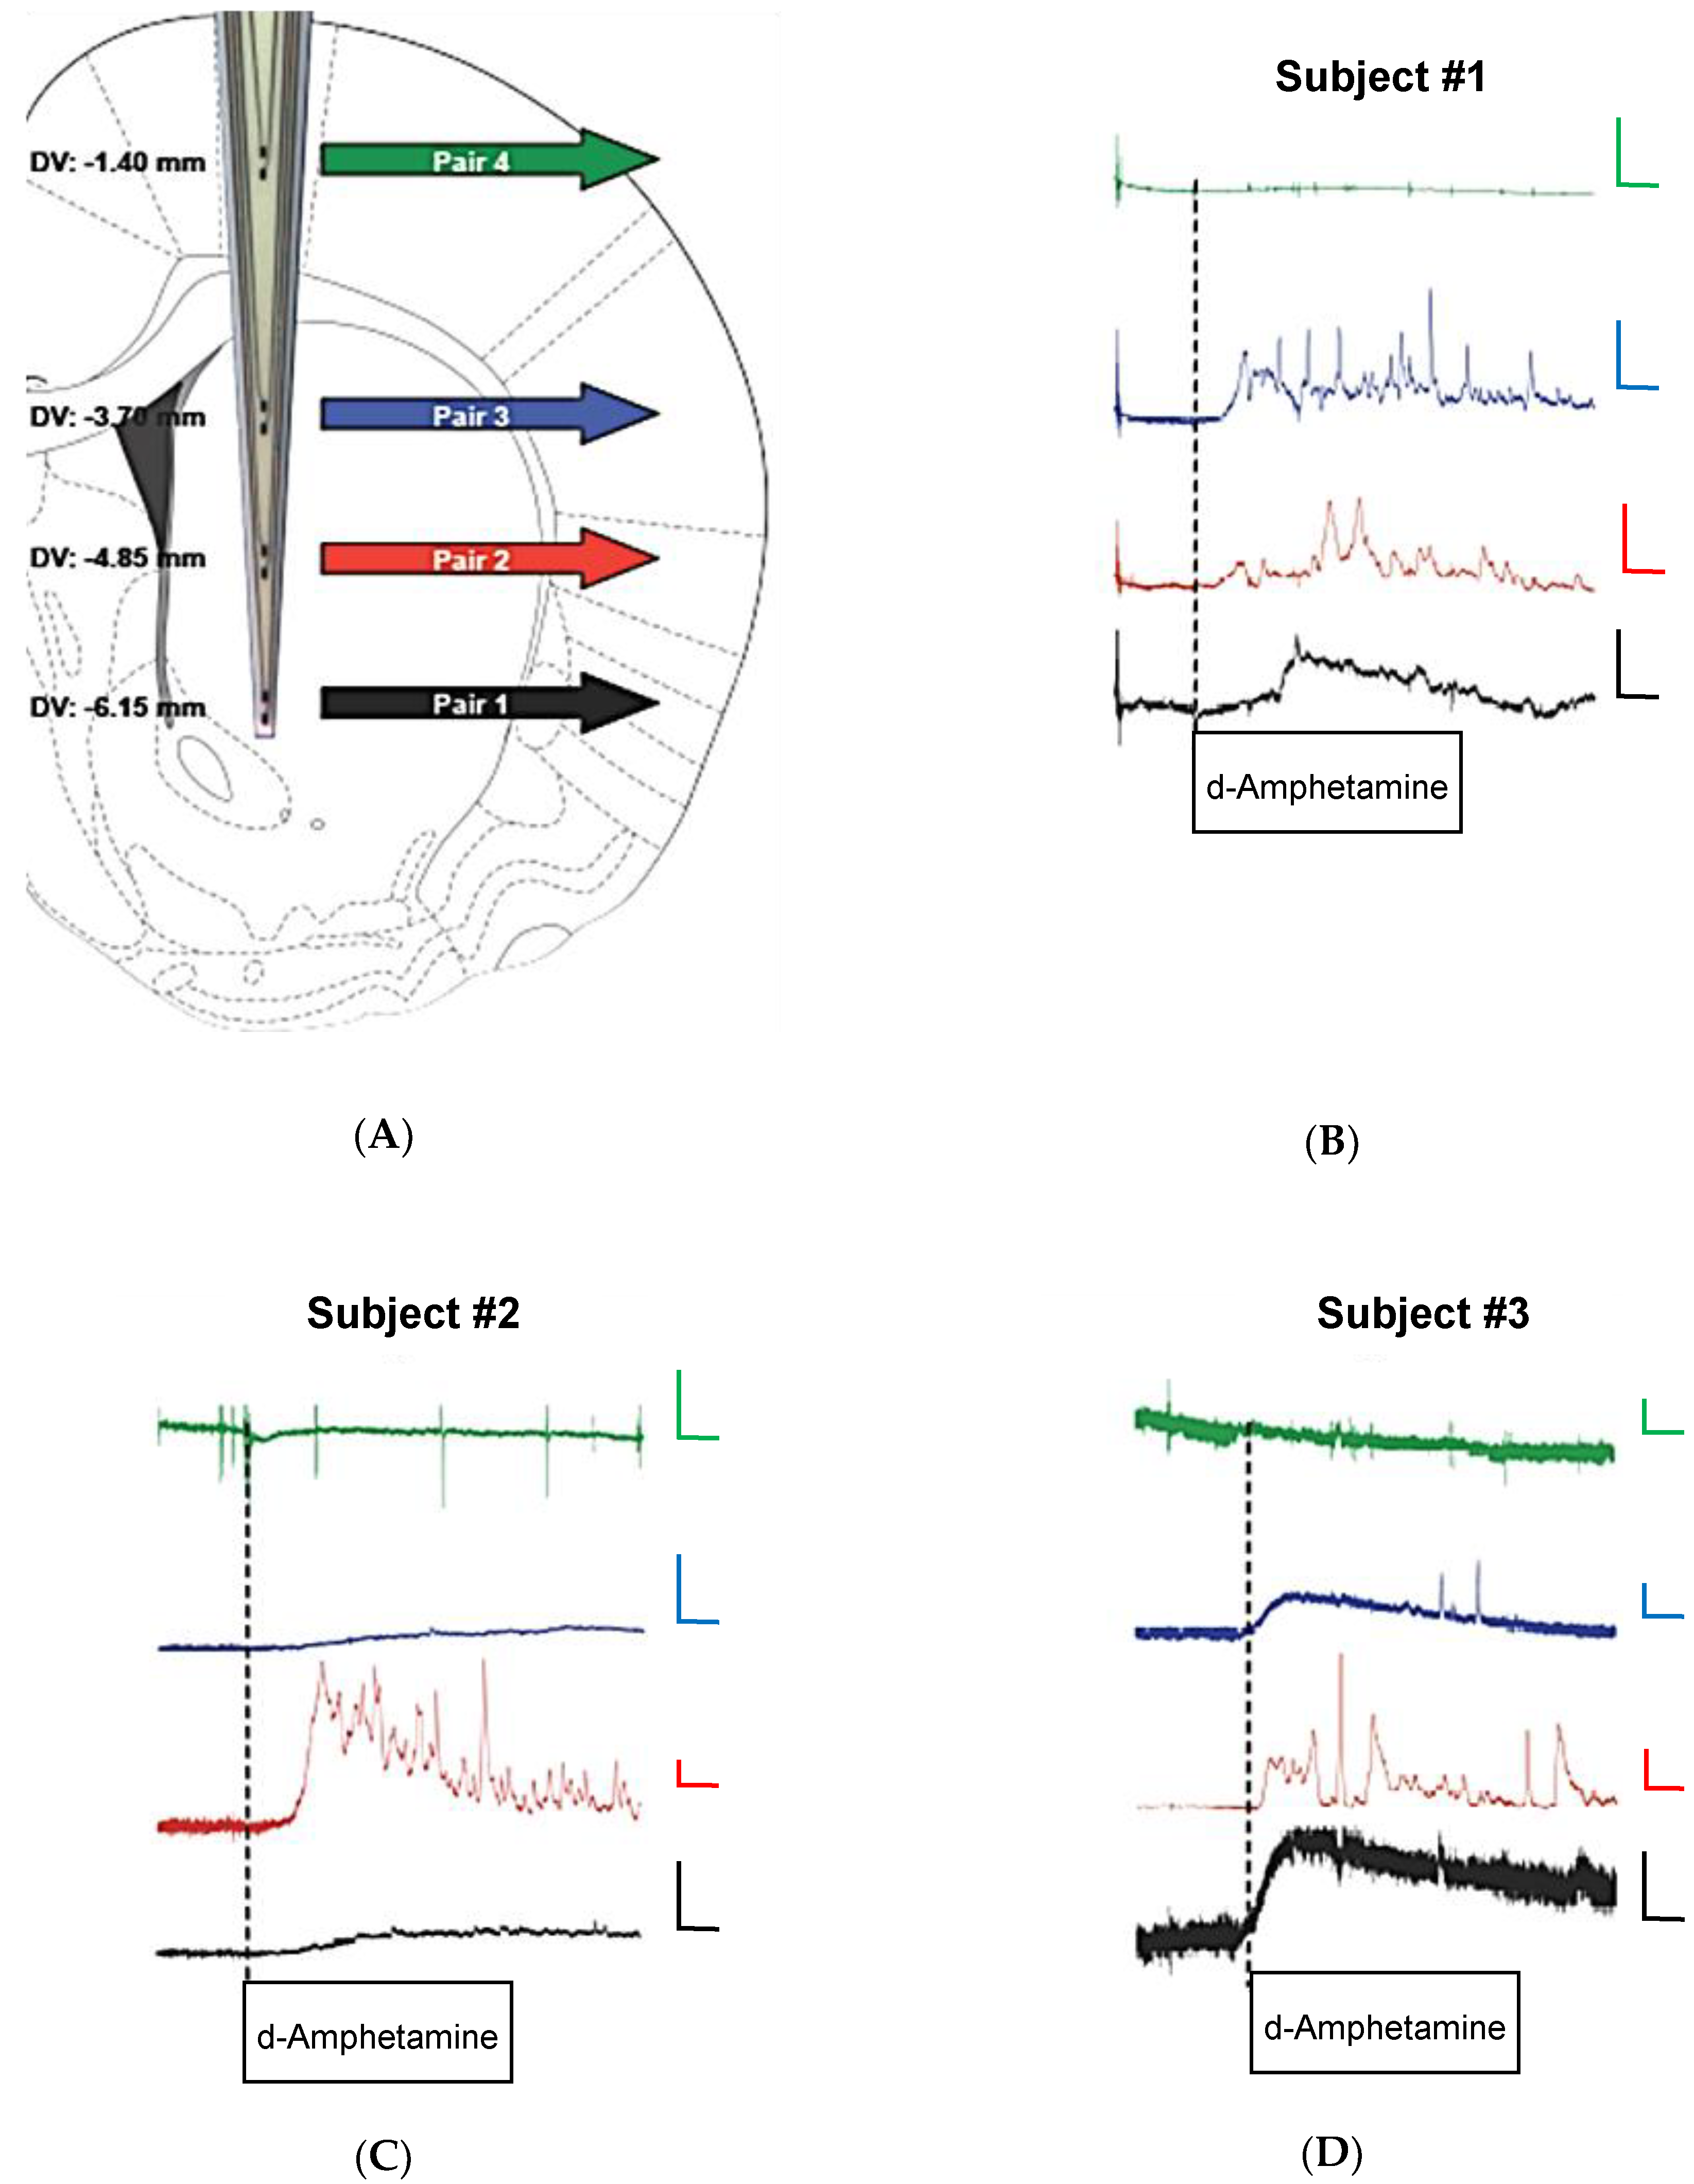
3.3. Conformal MEAs for In Vivo Measures of DA from Multiple Recording Depths

The proof-of-principle studies outlined above led us to design a novel 8-channel MEA with differential spacing of platinum recording site pairs to enable simultaneous measures of DA at multiple recording depths in the rat brain. The single-sided DSPR8 MEA was designed on earlier studies using S2 MEAs to measure DA. Figure 4A shows the 1–2 mm spacing between recording pairs on the DSPR8 MEA, which allows, in this case, one pair of sites to record in the primary motor cortex while the other three more ventral pairs (≥2 mm from the cortical pair) are positioned to record at multiple depths in the dSTR (1 mm spacing between each pair in the dSTR). Once the tip of the DSPR8 MEA was lowered to the final DV coordinate, the electrochemical signals were allowed to reach a stable baseline (typically ≥90 min). Figure 4B–D show the self-referenced DA signal at each recording depth before and after systemic administration of the psychostimulant d-amphetamine (2 mg/kg, i.p.). The onset of d-amphetamine changes in DA signaling was quite rapid. In vitro testing showed MEAs are insensitive to d-amphetamine.
The effects of the psychostimulant, d-amphetamine, on DA release have been widely characterized and are a known way to measure non-calcium dependent release of DA [52]. Therefore, we assessed the effect of systemic administration of d-amphetamine (2 mg/kg, i.p.) on resting levels of DA in the anesthetized dSTR of rats. d-Amphetamine caused a rapid extracellular increase in DA. Interestingly, the elevated levels of resting DA were accompanied by DA transients seen more closely in Figure 5, which are likely related to the complex actions of d-amphetamine on DA release. The number of spikes and the amplitudes varied in number and size (range: ~5 nM to 800 nM). Of particular note is that this pilot study shows the variable response of DA nerve terminals to the d-amphetamine in subregions of the rat striatum and nucleus accumbens (ventral striatum) of the same animal.

4. Discussion

In vivo monitoring of neurotransmitters in the CNS during the last decade with ceramic-based MEAs has primarily focused on the measurement and quantification of non-electroactive chemical species (e.g., glutamate) through enzyme-mediated conversion to an electroactive reporter molecule (i.e., H2O2) [30,34,43,44,45]. Undoubtedly, the success of these approaches for the determination of phasic and tonic neurotransmitter levels, can be directly attributed to the multi-site configuration of the MEAs [29,32]. More recently, Nafion®-coated MEAs with m-PD electroplated on select platinum recording sites were used for the measurement of brain nitric oxide [53]. Here, S2 MEAs were successfully utilized to measure phasic and tonic DA levels in the anesthetized rat dSTR—extending the abilities of MEA technology for in vivo monitoring. The confirmation of a hypodopaminergic state in the 6-OHDA lesion model—attenuated DA uptake, impaired evoked release of DA and depleted resting DA levels—observed with the S2 MEAs provided a sound platform and proof-of-concept for further exploring the utility of this approach.
In addition to repelling negatively charged molecules (e.g., AA), thus reducing high-level background currents in vivo, Nafion® concentrates positively charged molecules (e.g., DA) near the electrode surface [28,31,32]. During the last decade, the design and fabrication of MEAs has continued to evolve alongside steps towards understanding the unique performance abilities of the device [54]. When compared with earlier MEA designs, the enhanced performance of the MEA types used here to measure DA can likely be attributed to improved precision and reproducibility of the Pt recording sites due to the MEA fabrication process [29]. Subtle differences between individual recording site performances within a single MEA device, as well as between MEA devices, are not unexpected since individual pads retain unique physical properties post-fabrication. In this regard, we have recently shown that the nanostructured surface topography of individual pads contributes to an electroactive area that is greater than the geometric area [41]. However, dissimilarities regarding the thickness of Nafion® following dip-coating, which may produce differential diffusion layers, may also contribute to small differences in the responsiveness of individual recording sites. In addition to confirming the utility of Nafion® for repelling major CNS interferents, our findings here further support the utility of m-PD for removing larger organic molecules (e.g., AA), including the analyte of interest (i.e., DA), for the incorporation of self-referencing approaches [33].
Both Nafion and m-PD were employed on the sentinel recording sites to achieve the self-referencing configuration to selectively measure resting DA levels This dual-selective layer makes the Pt recording sites of the MEAs essentially unresponsive to electroactive species that are anionic and larger than H2O2. When the sentinel signal is subtracted from the Nafion-only site a ‘pure’ catecholamine signal is achieved. In addition, m-PD can be precisely coated onto recording sites even if they are in close proximity (within microns) to other sites. The resulting electrode pairs have excellent selectivity over anionic species such as DOPAC and ascorbate. In addition, they display nanomolar detection limits for DA which are adequate to measure resting levels. However, the subtraction approach employed in this study achieved improved baseline stability for long recordings in vivo (>2 h) and had an improved apparent limit of detection (LOD) that far exceeds standard amperometric recordings with the same MEAs (Table 1). This is similar to self-referenced in vivo glutamate measures where noise that is present on both sites is removed [55,56]. Our estimated LOD for the S2 and DSRP8 MEAs, employed using the self-referencing subtraction approach, ranged from 0.3 to 1 nanomolar, which rivals the recent report of DA detection by Taylor et al. using square-wave voltammetry [51]. This is seen from the recordings of d-amphetamine-induced DA transients seen in Figure 5, which required no filtering or signal averaging. The improved stability and enhanced LOD of the recording are attributed to the “real time” subtraction of the non-Faradaic background current of the Pt recording pairs that achieves the measures of resting DA. The improved baseline stability and the enhanced LOD exceed the capabilities of other amperometric recording methods, warranting further investigation and use.
Amperometric recording methods have always been limited due to the inherent problems of the current signal being composed of both non-Faradaic, background current and the Faradaic response to analytes [57]. As such, techniques such as differential pulse voltammetry and chronoamperometry were developed to minimize the analytical shortcomings of the unpredictability of an electrode’s “double layer” [57]. The present study employed a novel approach to subtract off the apparent “non-Faradaic” signals of the recording pads by a real-time subtraction approach that measures the differential response of two nearly identical recording pads. This approach cannot be readily achieved by hand-fabricated microelectrodes where the active surface area of the electrode cannot always be predicted from the geometric area of the surface. By contrast, the MEAs are a microfabricated technology that achieves precision by methods used in the microelectronic industry to build microchips. The manufacturing process achieves a high level of precision and the MEAs are sorted for their analytical response to achieve precision so that in essence the Pt recording sites are nearly identical. Thus, in contrast to many microelectrode technologies, the active recording surfaces are highly reproducible and the active recording area of the electrode is proportional to the surface area. We stress that the differential recording method described in this paper will only work with MEAs that have a very high level of recording site precision. In this study, conformal MEAs were used to compare real-time DA levels from multiple recording depths in vivo within the same animal following systemic administration of d-amphetamine. D-amphetamine has been extensively studied and is known to produce a non-calcium-dependent release of DA through its interaction with the dopamine transporter (DAT) located on the DA presynaptic terminal [52]. Importantly, DA is released through the reverse transport of DAT [21]. Our study demonstrated such release in multiple areas of the rat striatum, yielding signals that contained both slower DA release and evidence of transient DA signals of varying amplitudes and time courses in some brain regions. Galli and coworkers using electrophysiological methods to study DAT have shown that d-amphetamine can change the probability of d-amphetamine-induced DA release through the DAT by a shuttle carrier vs. pore like model [58]. We attribute the more transient spikes of DA release seen in some to the rat brain areas to be due to enhanced pore function of the DAT. This is an exciting hypothesis that needs to be further explored.

5. Conclusions

The present study has demonstrated that a differential recording method can be employed in DA-rich areas of the rat striatum and nucleus accumbens to reliably measure tonic (resting) and phasic DA release with subsecond temporal resolution and a refined spatial resolution dictated by the size of the MEA Pt recording sites. Proof of concept studies show that the technique can reliably measure changes in resting levels and transient changes in DA with improved baseline stability and a greatly enhanced apparent LOD. The use of the DSRP8 MEAs demonstrates that multisite recordings can be simultaneously made in brain subregions within the same animal. The enhanced stability of the recording method and the improved LOD of the method is worthy of further exploration.

Author Contributions

Conceptualization, G.A.G., N.R.Z. and M.L.; methodology, F.P. and J.E.Q.; software, J.J.B.; validation, M.L., D.A.P. and J.E.Q.; formal analysis, M.L.; investigation, M.L., D.A.P.; resources, P.H.; data curation, F.P.; writing—original draft preparation, Co-First Authors, M.L., D.A.P., J.J.B.; writing—review and editing, J.J.B., G.A.G., P.H., F.P., and J.E.Q.; visualization, M.L. and D.A.P.; supervision, J.E.Q.; project administration, P.H. and J.E.Q.; funding acquisition, G.A.G., N.R.Z. All authors have read and agreed to the published version of the manuscript.

Funding

This research was funded by NIH CEBRA II DA017186. M.L. was supported by Wenner-Gren Foundation, Stockholm, Sweden.

Conflicts of Interest

GAG is principal owner of Quanteon LLC, J.E.Q., F.P., P.H., and J.J.B. serve as consultants to Quanteon LLC. The funders had no role in the design of the study; in the collection, analyses, or interpretation of data; in the writing of the manuscript; or in the decision to publish the results.

References

  1. Siegel, G.J. Basic Neurochemistry: Molecular, Cellular, and Medical Aspects, 7th ed.; Elsevier Academic Press: Burlington, MA, USA, 2006. [Google Scholar]
  2. Schultz, W. Multiple DA Functions at Different Time Courses. Annu. Rev. Neurosci. 2007, 30, 259–288. [Google Scholar] [CrossRef] [PubMed] [Green Version]
  3. Perry, M.; Li, Q.; Kennedy, R.T. Review of Recent Advances in Analytical Techniques for the Determination of Neurotransmitters. Anal. Chim. Acta 2009, 653, 1–22. [Google Scholar] [CrossRef] [PubMed] [Green Version]
  4. Grace, A.A. The Tonic/Phasic Model of DA System Regulation: Its Relevance for Understanding How Stimulant Abuse Can Alter Basal Ganglia Function. Drug Alcohol Depend. 1995, 37, 111–129. [Google Scholar] [CrossRef]
  5. Cragg, S.J.; Rice, M.E. DAncing Past the DAT at a DA Synapse. Trends Neurosci. 2004, 27, 270–277. [Google Scholar] [CrossRef] [PubMed]
  6. Watson, C.J.; Venton, B.J.; Kennedy, R.T. In Vivo Measurements of Neurotransmitters by Microdialysis Sampling. Anal. Chem. 2006, 78, 1391–1399. [Google Scholar] [CrossRef]
  7. Jones, S.R.; Gainetdinov, R.R.; Caron, M.G. Application of Microdialysis and Voltammetry to Assess DA Functions in Genetically Altered Mice: Correlation with Locomotor Activity. Psychopharmacology 1999, 147, 30–32. [Google Scholar] [CrossRef]
  8. Budygin, E.A.; Kilpatrick, M.R.; Gainetdinov, R.R.; Wightman, R.M. Correlation between Behavior and Extracellular DA Levels in Rat Striatum: Comparison of Microdialysis and Fast-Scan Cyclic Voltammetry. Neurosci. Lett. 2000, 281, 9–12. [Google Scholar] [CrossRef]
  9. Parrot, S.; Bert, L.; Mouly-Badina, L.; Sauvinet, V.; Colussi-Mas, J.; Lambás-Señas, L.; Robert, F.; Bouilloux, J.P.; Suaud-Chagny, M.F.; Denoroy, L.; et al. Microdialysis Monitoring of Catecholamines and Excitatory Amino Acids in the Rat and Mouse Brain: Recent Developments Based on Capillary Electrophoresis with Laser-Induced Fluorescence Detection—A Mini-Review. Cell. Mol. Neurobiol. 2003, 23, 793–804. [Google Scholar] [CrossRef]
  10. Clapp-Lilly, K.L.; Roberts, R.C.; Duffy, L.K.; Irons, K.P.; Hu, Y.; Drew, K.L. An Ultrastructural Analysis of Tissue Surrounding a Microdialysis Probe. J. Neurosci. Methods 1999, 90, 129–142. [Google Scholar] [CrossRef]
  11. Borland, L.M.; Michael, A.C. Electrochemical Methods for Neuroscience; Michael, A.C., Borland, L.M., Eds.; CRC Press, Taylor and Francis Group: Boca Raton, FL, USA, 2007. [Google Scholar]
  12. Mitala, C.M.; Wang, Y.; Borland, L.M.; Jung, M.; Shand, S.; Watkins, S.; Weber, S.G.; Michael, A.C.; Yang, H. In Vivo Fast-Scan Cyclic Voltammetry of DA near Microdialysis Probes. J. Neurosci. Methods 2008, 174, 177–185. [Google Scholar] [CrossRef] [Green Version]
  13. Yang, H.; Peters, J.L.; Michael, A.C. Coupled Effects of Mass Transfer and Uptake Kinetics on In Vivo Microdialysis of DA. J. Neurochem. 1998, 71, 684–692. [Google Scholar] [CrossRef]
  14. Clark, J.J.; Sandberg, S.G.; Wanat, M.J.; Gan, J.O.; Horne, E.A.; Hart, A.S.; Akers, C.A.; Parker, J.G.; Willuhn, I.; Martinez, V.; et al. Chronic Microsensors for Longitudinal, Subsecond DA Detection in Behaving Animals. Nat. Methods 2010, 7, 126–129. [Google Scholar] [CrossRef] [PubMed] [Green Version]
  15. Robinson, D.L.; Heien, M.L.; Wightman, R.M. Frequency of DA Concentration Transients Increases in Dorsal and Ventral Striatum of Male Rats during Introduction of Conspecifics. J. Neurosci. 2002, 22, 10477–10486. [Google Scholar] [CrossRef] [PubMed] [Green Version]
  16. Garris, P.A.; Ciolkowski, E.L.; Pastore, P.; Wightman, R.M. Efflux of DA from the Synaptic Cleft in the Nucleus Accumbens of the Rat Brain. J. Neurosci. 1994, 14, 6084–6093. [Google Scholar] [CrossRef] [PubMed] [Green Version]
  17. Michael, A.C.; Borland, L.M.; Mitala, J.J.; Willoughby, B.M.; Motzko, C.M. Theory for the Impact of Basal Turnover on DA Clearance Kinetics in the Rat Striatum After Medial Forebrain Bundle Stimulation and Pressure Ejection. J. Neurochem. 2005, 94, 1202–1211. [Google Scholar] [CrossRef]
  18. Zahniser, N.R.; Larson, G.A.; Gerhardt, G.A. In Vivo DA Clearance Rate in Rat Striatum: Regulation by Extracellular DA Concentration and DA Transporter Inhibitors. J. Pharm. Exp. Ther. 1999, 289, 266–277. [Google Scholar]
  19. Gerhardt, G.A.; Burmeister, J.J. Encyclopedia Analytical Chemistry: Instrumentation and Applications; Meyers, R.A., Ed.; John Wiley and Sons: Chichester, UK, 2000; pp. 710–731. [Google Scholar]
  20. Hascup, E.R.; af Bjerkén, S.; Hascup, K.N.; Pomerleau, F.; Huettl, P.; Strömberg, I.; Gerhardt, G.A. Histological Studies of the Effects of Chronic Implantation of Ceramic-Based Microelectrode Arrays and Microdialysis Probes in Rat Prefrontal Cortex. Brain Res. 2009, 1291, 12–20. [Google Scholar] [CrossRef] [Green Version]
  21. Jaquins-Gerstl, A.; Michael, A.C. Comparison of the Brain Penetration Injury Associated with Microdialysis and Voltammetry. J. Neurosci. Methods 2009, 183, 127–135. [Google Scholar] [CrossRef] [Green Version]
  22. Yang, C.; Cao, Q.; Puthongkham, P.; Lee, S.T.; Ganesana, M.; Lavrik, N.V.; Venton, B.J. 3D-Printed Carbon Electrodes for Neurotransmitter Detection. Angew. Chem. 2018, 57, 14255–14259. [Google Scholar] [CrossRef]
  23. Cheng, Y.; Hu, K.; Wang, D.; Zubi, Y.; Lee, S.T.; Puthongkham, P.; Mirkin, M.V.; Venton, B.J. Cavity Carbon-Nanopipette Electrodes for Dopamine Detection. Anal. Chem. 2019, 91, 4618–4624. [Google Scholar] [CrossRef]
  24. Schwerdt, H.N.; Shimazu, H.; Amemori, K.; Amemori, S.; Tierney, P.L.; Gibson, D.J.; Hong, S.; Yoshida, T.; Langer, R.; Cima, M.J.; et al. Chronic fast-scan dopamine voltammetry in primates. Proc. Natl. Acad. Sci. USA 2017, 114, 13260–13265. [Google Scholar] [CrossRef] [PubMed] [Green Version]
  25. Liu, C.; Zhao, Y.; Cai, X.; Xie, Y.; Wang, T.; Cheng, D.; Li, L.; Li, R.; Deng, Y.; Ding, H.; et al. A wireless, implantable optoelectrochemical probe for optogenetic stimulation and dopamine detection. bioRxiv 2020, 6, 1–12. [Google Scholar] [CrossRef]
  26. Schwarting, R.K.W.; Huston, J.P. The Unilateral 6-HydroxyDA Lesion Model in Behavioral Brain Research. Analysis of Functional Deficits, Recovery and Treatments. Prog. Neurobiol. 1996, 50, 275–331. [Google Scholar] [CrossRef]
  27. Hascup, K.N.; Rutherford, E.C.; Quintero, J.E.; Day, B.K.; Nickell, J.R.; Pomerleau, F.; Huettl, P.; Burmeister, J.J.; Gerhardt, G.A. Electrochemical Methods for Neuroscience; Michael, A.C., Borland, L.M., Eds.; CRC Press: Boca Raton, FL, USA, 2007; pp. 407–450. [Google Scholar] [CrossRef]
  28. Paxinos, G.; Watson, C. The Rat Brain in Stereotaxic Coordinates; Elsevier: Amsterdam, The Netherlands, 2007. [Google Scholar]
  29. Burmeister, J.J.; Moxon, K.; Gerhardt, G.A. Ceramic-Based Multisite Microelectrodes for Electrochemical Recordings. Anal. Chem. 2000, 72, 187–192. [Google Scholar] [CrossRef]
  30. Day, B.K.; Pomerleau, F.; Burmeister, J.J.; Huettl, P.; Gerhardt, G.A. Microelectrode Array Studies of Basal and Potassium-Evoked Release of L-glutamate in the Anesthetized Rat Brain. J. Neurochem. 2006, 96, 1626–1635. [Google Scholar] [CrossRef]
  31. Gerhardt, G.A.; Oke, A.F.; Nagy, G.; Moghaddam, B.; Adams, R.N. Nafion-Coated Electrodes with High Selectivity for CNS Electrochemistry. Brain Res. 1984, 290, 390–395. [Google Scholar] [CrossRef]
  32. Burmeister, J.J.; Gerhardt, G.A. Self-Referencing Ceramic-Based Multisite Microelectrodes for the Detection and Elimination of Interferences from the Measurement of L-glutamate and Other Analytes. Anal. Chem. 2001, 73, 1037–1042. [Google Scholar] [CrossRef]
  33. Burmeister, J.J.; Pomerleau, F.; Huettl, P.; Gash, C.R.; Werner, C.E.; Bruno, J.P.; Gerhardt, G.A. Ceramic-Based Multisite Microelectrode Arrays for Simultaneous Measures of Choline and Acetylcholine in CNS. Biosens. Bioelectr. 2008, 23, 1382–1389. [Google Scholar] [CrossRef]
  34. Hinzman, J.M.; Thomas, T.C.; Burmeister, J.J.; Quintero, J.E.; Huettl, P.; Pomerleau, F.; Gerhardt, G.A.; Lifshitz, J. Diffuse Brain Injury Elevates Tonic Glutamate Levels and Potassium-Evoked Glutamate Release in Discrete Brain Regions at Two Days Post-Injury: An Enzyme-Based Microelectrode Array Study. J. Neurotrauma 2010, 27, 889–899. [Google Scholar] [CrossRef]
  35. Cass, W.A.; Zahniser, N.R.; Flach, K.A.; Gerhardt, G.A. Clearance of Exogenous DA in Rat Dorsal Striatum and Nucleus Accumbens: Role of Metabolism and Effects of Locally Applied Uptake Inhibitors. J. Neurochem. 1993, 61, 2269–2278. [Google Scholar] [CrossRef]
  36. Friedemann, M.N.; Gerhardt, G.A. Regional Effects of Aging on DArgic Function in the Fischer-344 Rat. Neurobiol. Aging 1992, 13, 325–332. [Google Scholar] [CrossRef]
  37. Hall, M.E.; Hoffer, B.J. Rapid and Sensitive Determination of Catecholamines in Small Tissues Samples by High Performance Liquid Chromatography Coupled with Dual-Electrode Coulometric electrochemical detection. LCGC 1989, 7, 258–265. [Google Scholar]
  38. Herrera-Marschitz, M.; Goiny, M.; Utsumi, H.; Ungerstedt, U. Mesencephalic DA Innervation of the Frontoparietal (Sensorimotor) Cortex of the Rat: A Microdialysis Study. Neurosci. Lett. 1989, 97, 266–270. [Google Scholar] [CrossRef]
  39. Schwarz, A.J.; Zocchi, A.; Reese, T.; Gozzi, A.; Garzotti, M.; Varnier, G.; Curcuruto, O.; Sartori, I.; Girlanda, E.; Biscaro, B.; et al. Concurrent Pharmacological MRI and In Situ Microdialysis of Cocaine Reveal a Complex Relationship between the Central hemodynamic response and Local DA Concentration. Neuroimage 2004, 23, 296–304. [Google Scholar] [CrossRef] [PubMed]
  40. Pomerleau, F.; Day, B.K.; Huettl, P.; Burmeister, J.J.; Gerhardt, G.A. Real time in vivo measures of L-glutamate in the rat central nervous system using ceramic-based multisite microelectrode arrays. Ann. N. Y. Acad. Sci. 2003, 1003, 454–457. [Google Scholar] [CrossRef]
  41. Van Horne, C.; Hoffer, B.J.; Strömberg, I.; Gerhardt, G.A. Clearance and Diffusion of Locally Applied DA in Normal and 6-HydroxyDA-Lesioned Rat Striatum. J. Pharm. Exp. Ther. 1992, 263, 1285–1292. [Google Scholar]
  42. Hebert, M.A.; Gerhardt, G.A. Behavioral and neurochemical effects of intranigral administration of glial cell line-derived neurotrophic factor on aged Fischer 344 rats. J. Pharmacol. Exp. Ther. 1997, 282, 760–768. [Google Scholar]
  43. Hascup, E.R.; Hascup, K.N.; Stephens, M.; Pomerleau, F.; Huettl, P.; Gratton, A.; Gerhardt, G.A. Rapid Microelectrode Measurements and the Origin and Regulation of Extracellular Glutamate in Rat Prefrontal Cortex. J. Neurochem. 2010, 115, 1608–1620. [Google Scholar] [CrossRef] [Green Version]
  44. Rutherford, E.C.; Pomerleau, F.; Huettl, P.; Strömberg, I.; Gerhardt, G.A. Chronic Second-by-Second Measures of L-Glutamate in the Central Nervous System of Freely Moving Rats. J. Neurochem. 2007, 102, 712–722. [Google Scholar] [CrossRef] [Green Version]
  45. Hascup, K.N.; Hascup, E.R.; Stephens, M.L.; Glaser, P.E.; Yoshitake, T.; Mathé, A.A.; Gerhardt, G.A.; Kehr, J. Resting Glutamate Levels and Rapid Glutamate Transients in the Prefrontal Cortex of the Flinders Sensitive Line Rat: A Genetic Rodent Model of Depression. Neuropsychopharmacology 2011, 36, 1769–1777. [Google Scholar] [CrossRef] [PubMed]
  46. Burmeister, J.J.; Palmer, M.; Gerhardt, G.A. L-Lactate Measures in Brain Tissue with Ceramic-Based Multisite Microelectrodes. Biosens. Bioelectron. 2005, 20, 1772–1779. [Google Scholar] [CrossRef] [PubMed]
  47. Tang, A.; Bungay, P.M.; Gonzales, R.A. Characterization of probe and tissue factors that influence interpretation of quantitative microdialysis experiments for dopamine. J. Neurosci. Methods 2003, 126, 1–11. [Google Scholar] [CrossRef]
  48. Chen, N.H.; Lai, Y.J.; Pan, W.H. Effects of different perfusion medium on the extracellular basal concentration of dopamine in striatum and medial prefrontal cortex: A zero-net flux microdialysis study. Neurosci. Lett. 1997, 225, 197–200. [Google Scholar] [CrossRef]
  49. Parsons, L.H.; Justice, J.B., Jr. Extracellular concentration and in vivo recovery of dopamine in the nucleus accumbens using microdialysis. J. Neurochem. 1992, 58, 212–218. [Google Scholar] [CrossRef] [PubMed]
  50. Martin-Fardon, R.; Sandillon, F.; Thibault, J.; Privat, A.; Vignon, J. Long-term monitoring of extracellular dopamine concentration in the rat striatum by a repeated microdialysis procedure. J. Neurosci. Methods 1997, 72, 123–135. [Google Scholar] [CrossRef]
  51. Taylor, I.M.; Patel, N.A.; Freedman, N.C.; Castagnola, E.; Cui, X.T. Direct in Vivo Electrochemical Detection of Resting Dopamine Using Poly(3,4-ethylenedioxythiophene)/Carbon Nanotube Functionalized Microelectrodes. Anal. Chem. 2019, 91, 12917–12927. [Google Scholar] [CrossRef]
  52. Arnold, E.B.; Molinoff, P.B.; Rutledge, C.O. The release of endogenous norepinephrine and dopamine from cerebral cortex by amphetamine. J. Pharmacol. Exp. Ther. 1977, 202, 544–557. [Google Scholar]
  53. Santos, R.M.; Lourenço, C.F.; Pomerleau, F.; Huettl, P.; Gerhardt, G.A.; Laranjinha, J.; Barbosa, R.M. Brain Nitric Oxide Inactivation Is Governed by the Vasculature. Antioxid. Redox Signal. 2010, 14, 1011–1021. [Google Scholar] [CrossRef]
  54. Talauliker, P.M.; Price, D.A.; Burmeister, J.J.; Nagarid, S.; Pomerleau, F.; Huettl, P.; Hastings, J.T.; Gerhardt, G.A. Ceramic-Based Microelectrode Arrays: Recording Surface Characteristics and Topographical Analysis. J. Neurosci. Methods 2011, 198, 222–229. [Google Scholar] [CrossRef] [Green Version]
  55. Burmeister, J.J.; Pomerleau, F.; Palmer, M.; Day, B.K.; Huettl, P.; Gerhardt, G.A. Improved ceramic-based multisite microelectrode for rapid measurements of L-glutamate in the CNS. J. Neurosci. Methods 2002, 119, 163–171. [Google Scholar] [CrossRef]
  56. Burmeister, J.J.; Gerhardt, G.A. Ceramic-based multisite microelectrode arrays for in vivo electrochemical recordings of glutamate and other neurochemicals. Trends Anal. Chem. 2003, 22, 498–502. [Google Scholar] [CrossRef]
  57. Bard, A.; Faulkner, L. Electrochemical Methods: Fundamentals and Applications, 2nd ed.; Wiley & Sons: Hoboken, NJ, USA, 2000. [Google Scholar]
  58. Williams, J.M.; Galli, A. The dopamine transporter: A vigilant border control for psychostimulant action. Handb. Exp. Pharmacol. 2006, 175, 215–232. [Google Scholar] [CrossRef]
Figure 1. Microelectrode array (MEA) design and function as configured for dopamine (DA) measurement. Photomicrographs and corresponding schematics of Nafion®-coating and selective electrodeposition of m-phenylenediamine (m-PD) for a (A) 4-channel S2 MEA (333 × 15 micron pairs) and (B) 8-channel DSPR8 MEA with reaction schemes are shown. The distance between recording pairs is also shown for both MEAs.
Applsci 10 06449 g001
Figure 2. In vivo MEA-based measures of phasic DA neurotransmission. Representative traces of the DA signal measured on DA (solid line) and sentinel (dashed line) recording sites following the local application of KCl (100 nL; 120 mM, pH 7.4) in the dorsal striatum (dSTR) of anesthetized non-lesioned ((A)–Blue) or 6-hydroxydopamine (6-OHDA) lesioned ((B)—Red) rats.
Applsci 10 06449 g002
Figure 3. Proof-of-concept for MEA-based measures of resting DA levels in vivo. (A) Reconstruction of differential cortical-striatal recording with a 4-channel S2 MEA. S2 MEAs were positioned in primary motor cortex and after establishing a baseline signal were lowered ventrally into the dSTR. (B) Baseline current differences measured in the anesthetized rat primary motor cortex and dSTR following self-referencing. Recording shows the cortical-striatal baseline current increase between the primary motor cortex (i.e., low DA innervation) and dSTR (i.e., high DA innervation). The difference between the baseline current measured in the dSTR vs. cortex represents resting DA levels. (C) The self-referenced cortical baseline was subtracted from the self-referenced baseline signal in dSTR to calculate differences in resting DA levels between the non-lesioned and 6-OHDA lesioned dSTR. *** p < 0.001, paired t-test. Note the low nanomolar detected levels of DA by the method. (D) High-performance liquid chromatography (HPLC) analysis of DA tissue content from non-lesioned and 6-OHDA lesioned dSTR. *** p < 0.001, paired t-test (n = 5–7).
Applsci 10 06449 g003
Figure 4. Conformal MEA design for simultaneous measures of in vivo DA dynamics at multiple recording depths. (A) Depth profile illustrating location of each MEA pair; (BD) concentration versus time plots for subjects 1–3 before and after administration of d-amphetamine (2 mg/kg, i.p.). Time axis bars are 10 min and concentration axis bars are 100 μM.
Applsci 10 06449 g004
Figure 5. Upper plots (AC) show the self-referenced dopamine peak amplitude at the 3 depths for subjects 1–3; bar is the average amplitude of the spikes in each region. Lower traces (DF) are self-referenced DA concentration versus time plots for the three test subjects following administration of d-amphetamine. Green arrows indicate the time that the d-amphetamine was administered. Note the high signal-to- noise of these signals that are not filtered or averaged. Typical detection limits of these signals, based on a signal-to-noise of 3, typically ranged from 0.3 to 1 nanomolar, rivaling the recent report of Taylor et al., 2019 [51].
Applsci 10 06449 g005
Table 1. Recording properties of microelectrode arrays for the measurement of DA.
Electrode TypenSensitivity (pA/μM)Sensitivity/Area (pA mM−1 mm−2)LOD (nM)R2Selectivity
S223−42.0 ± 0.0−8422 ± 95462.3 ± 21.30.976 ± 0.0081487 ± 194
DSPR820−31.7 ± 7.1−6349 ± 142327.5 ± 5.70.965 ± 0.0062664 ± 358

