Neural Network Based Country Wise Risk Prediction of COVID-19


Abstract
1. Introduction
2. Related Works
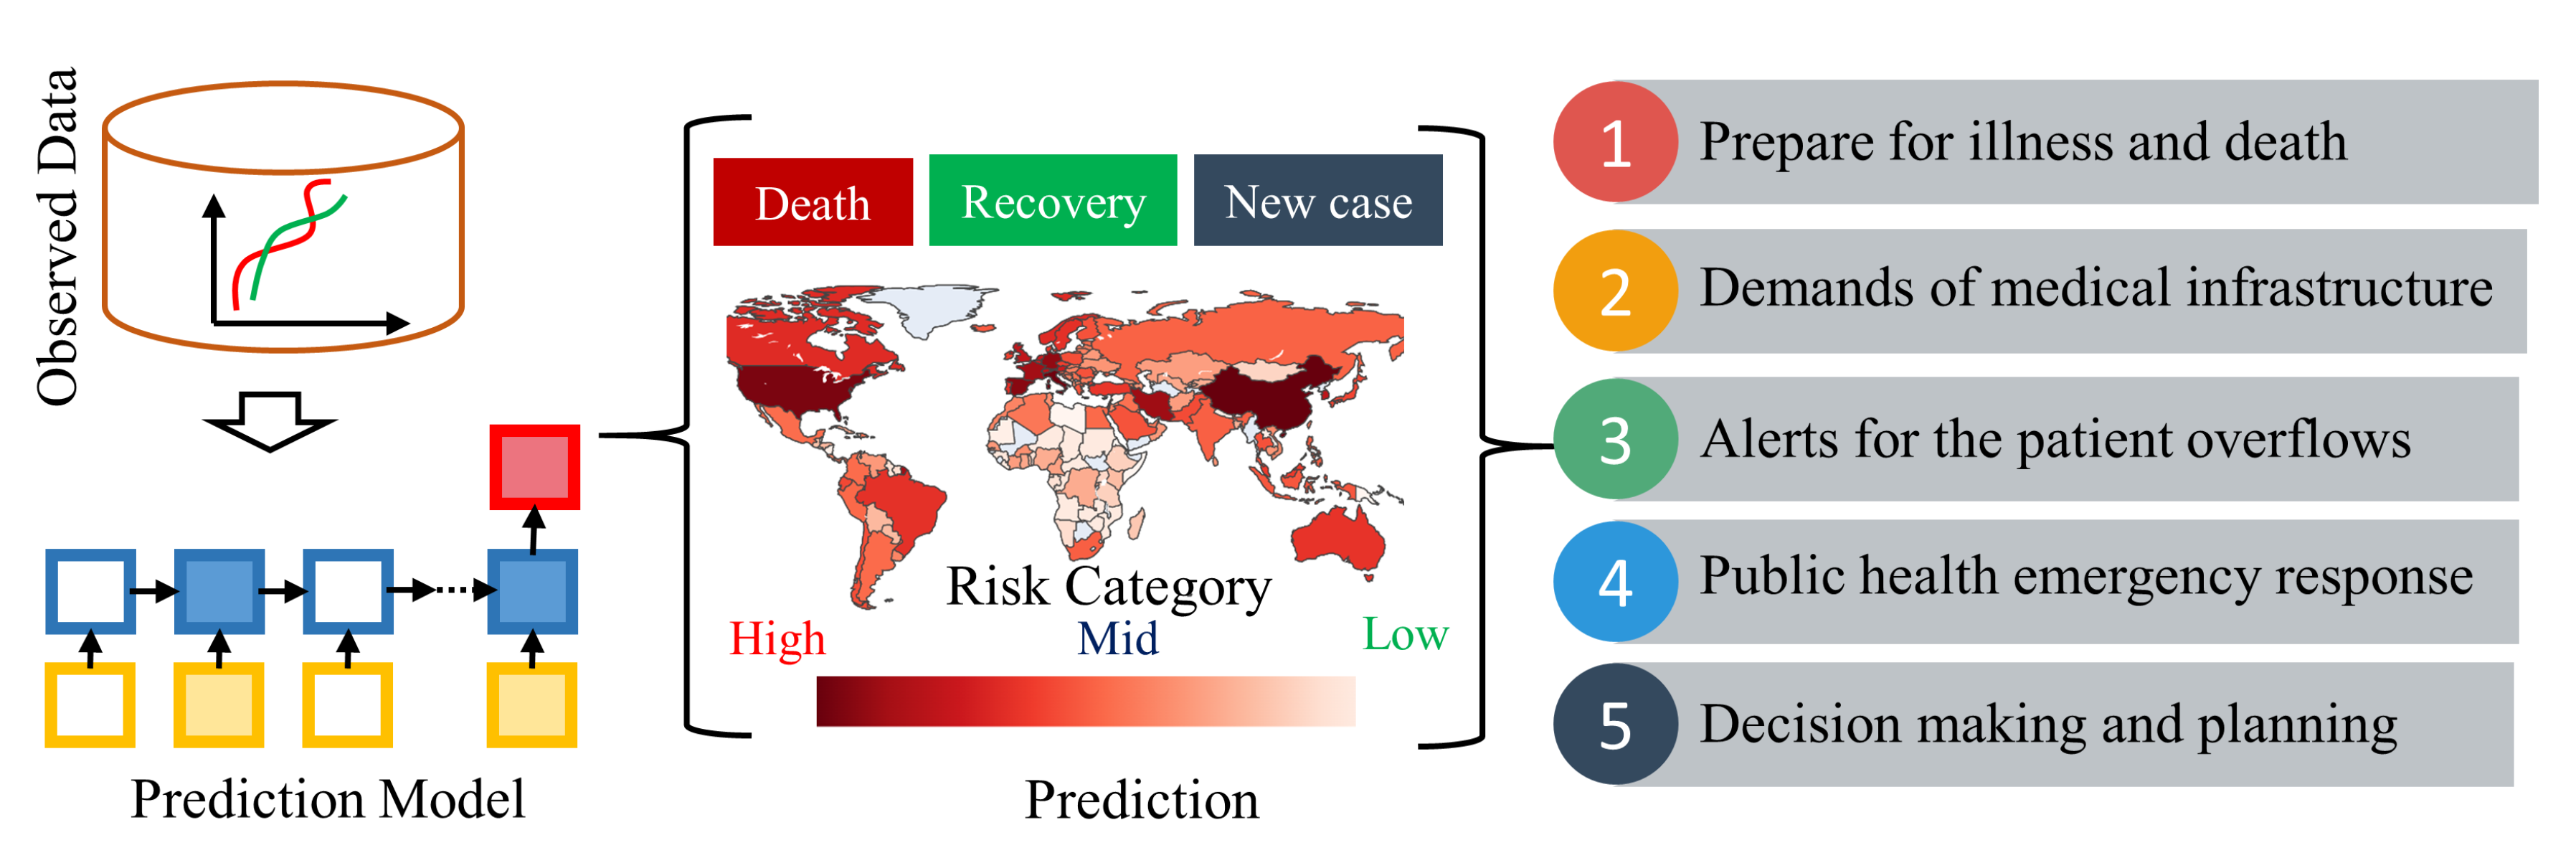
3. Proposed Model
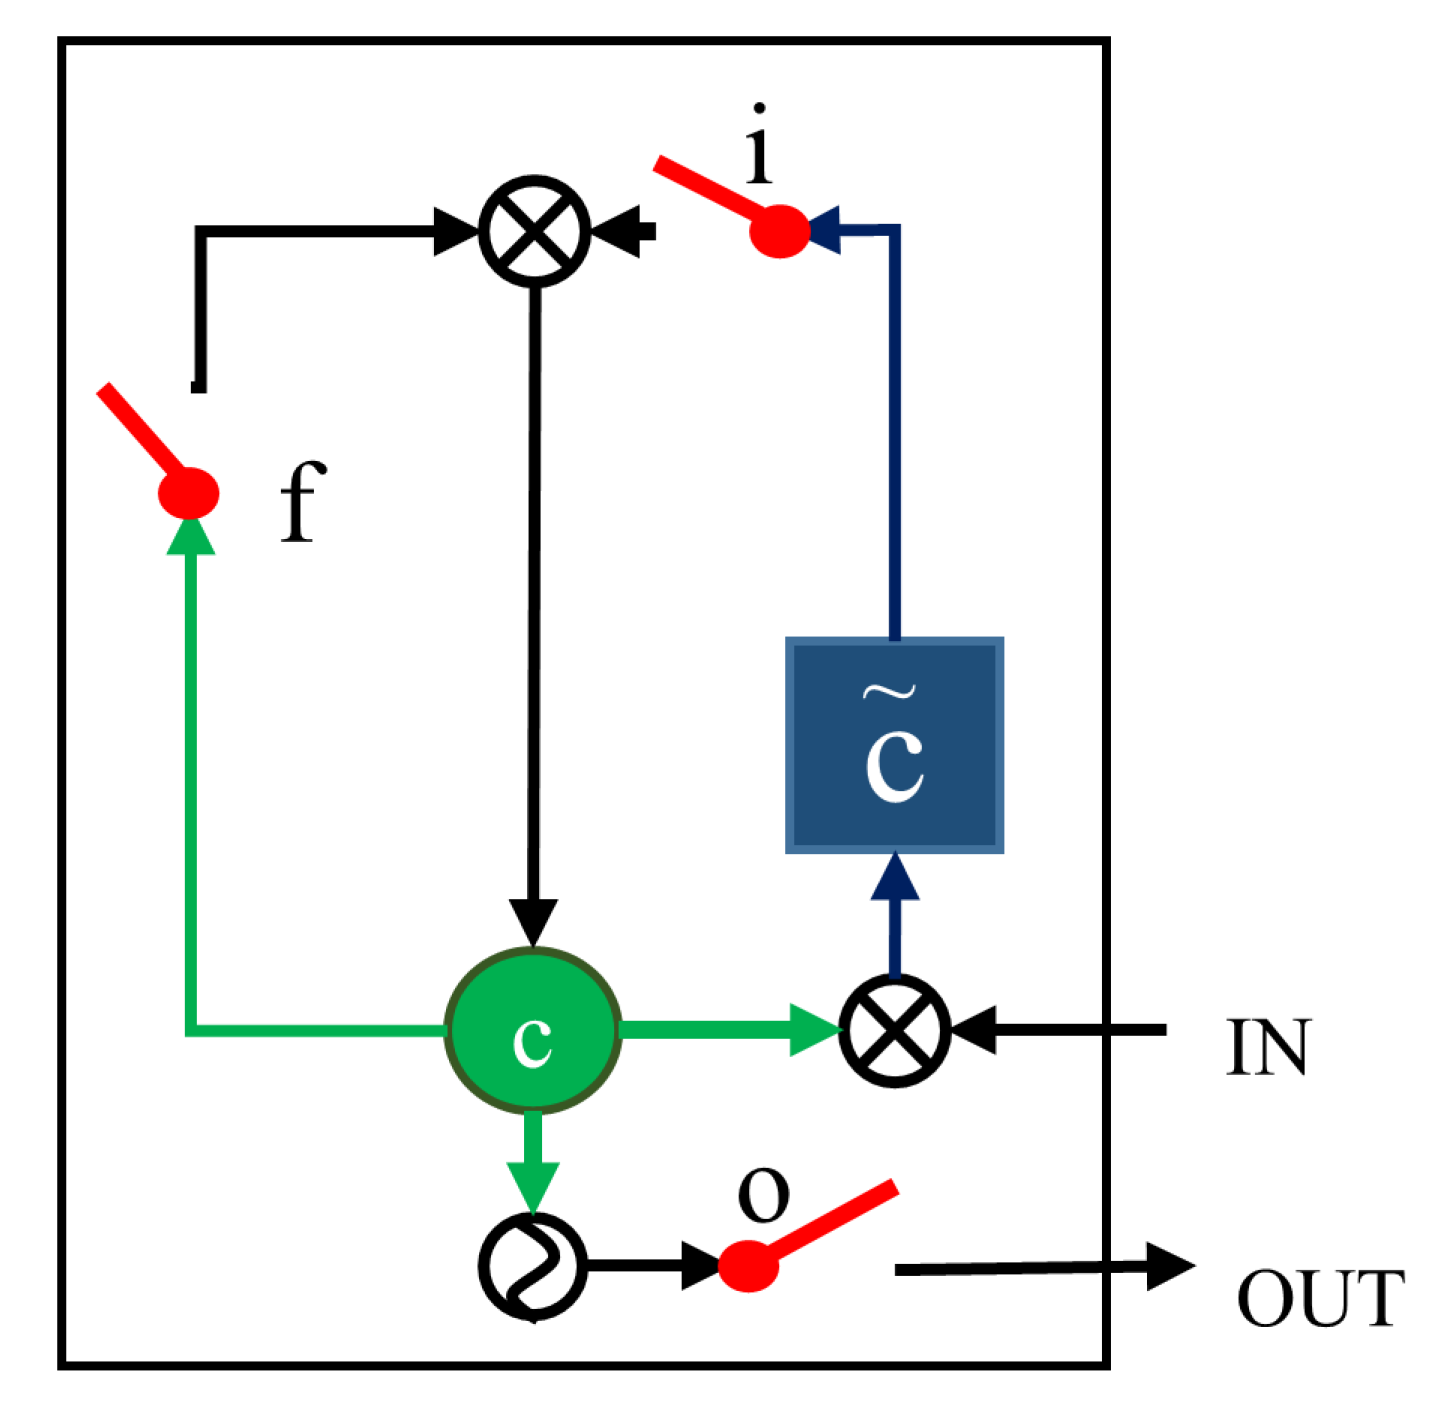
3.1. Background
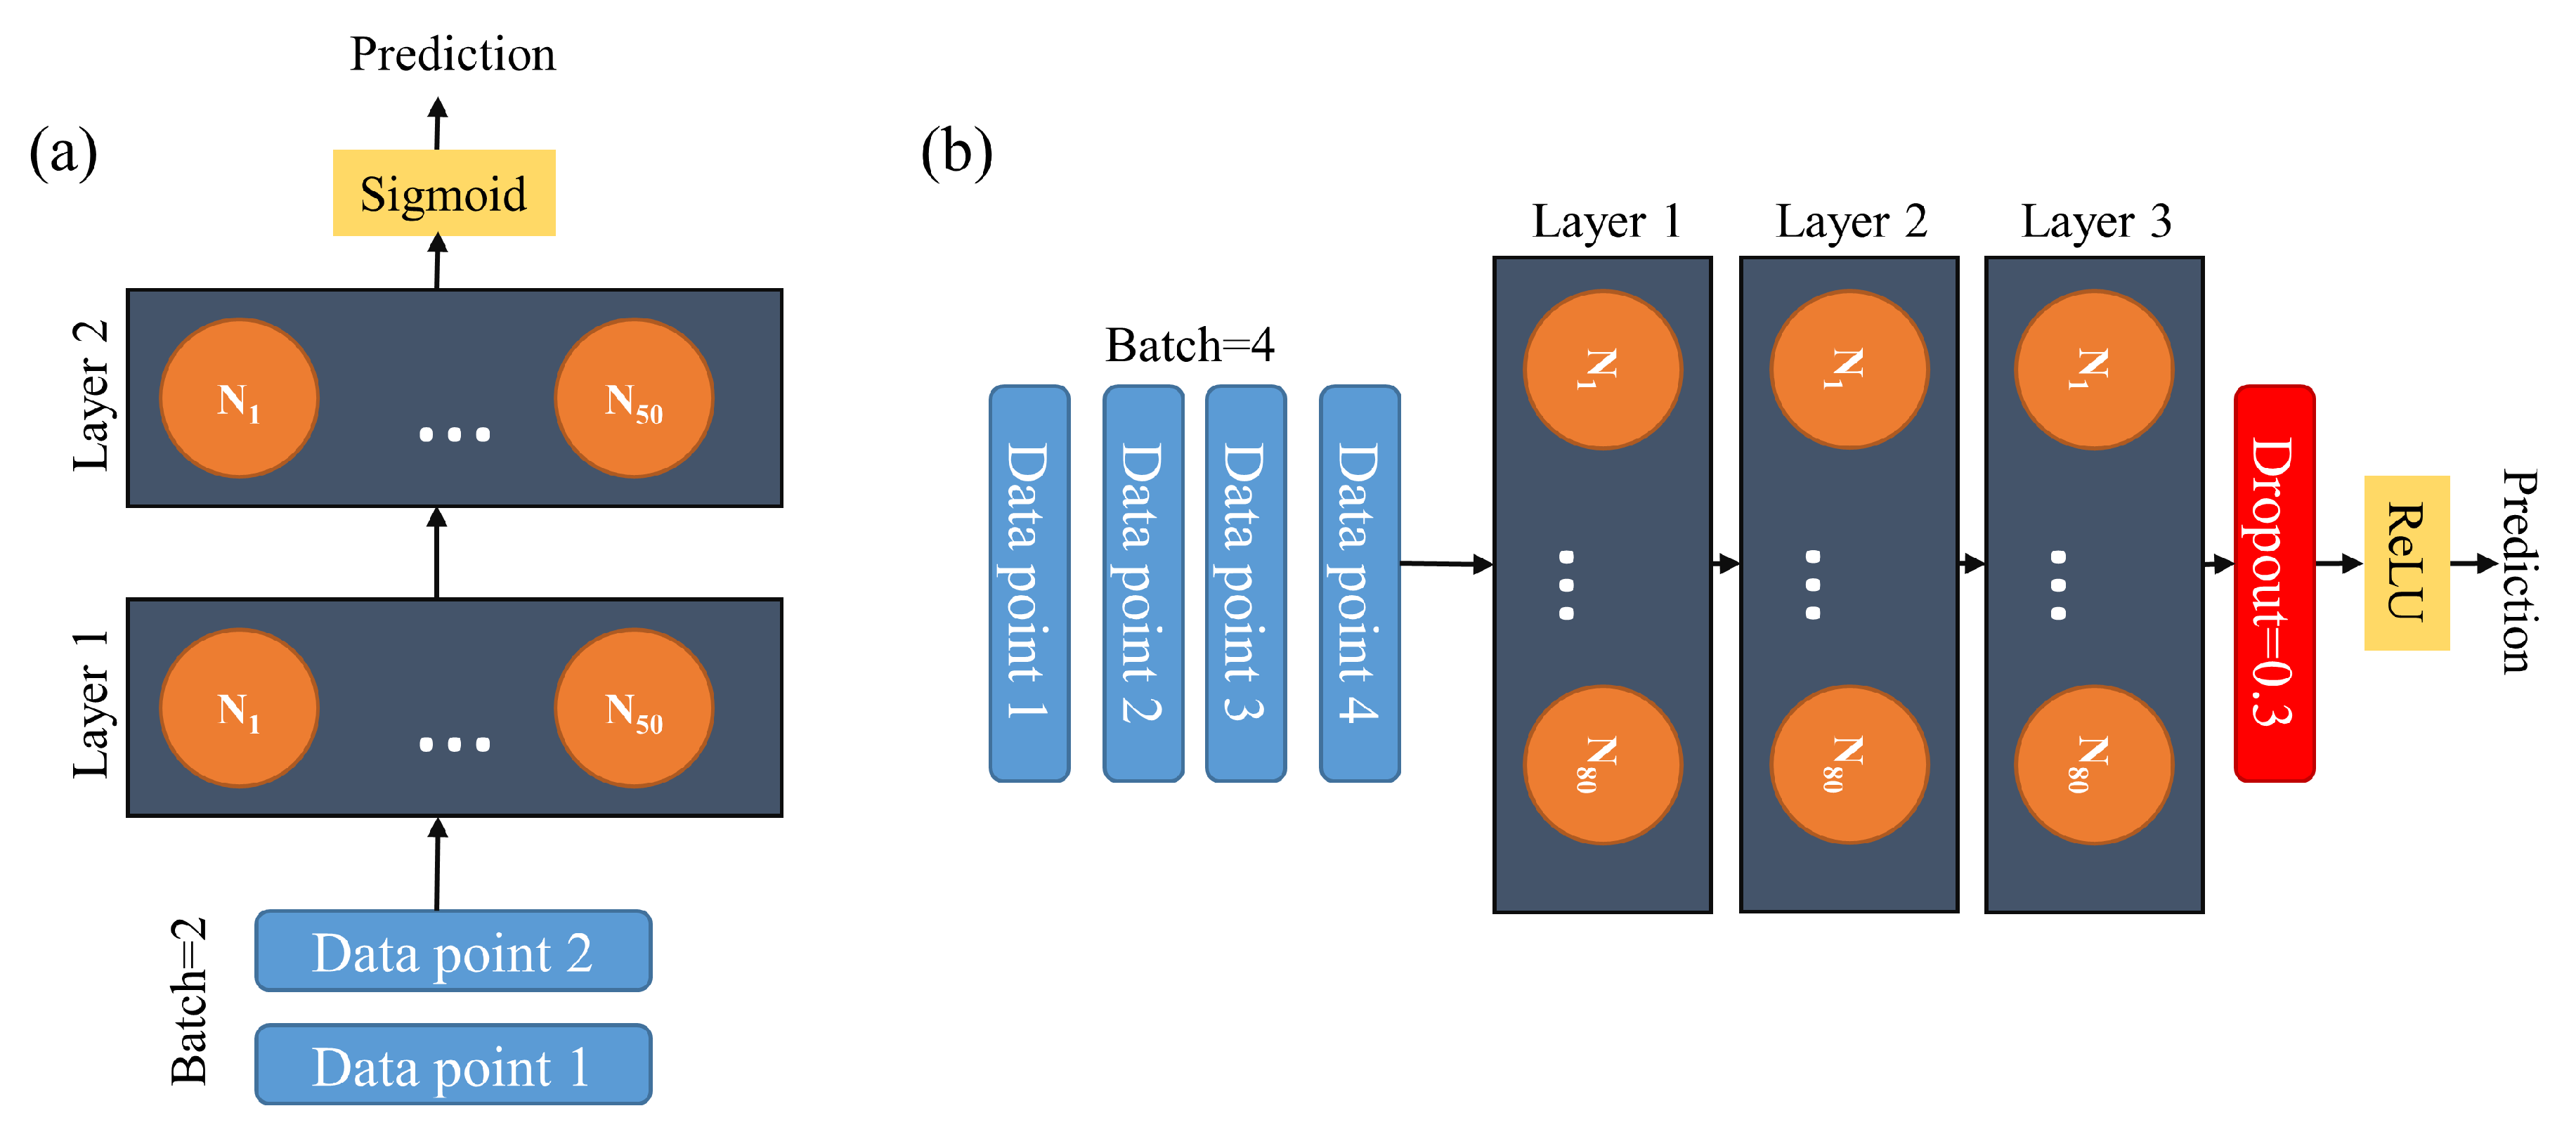
3.2. Search Space Definition
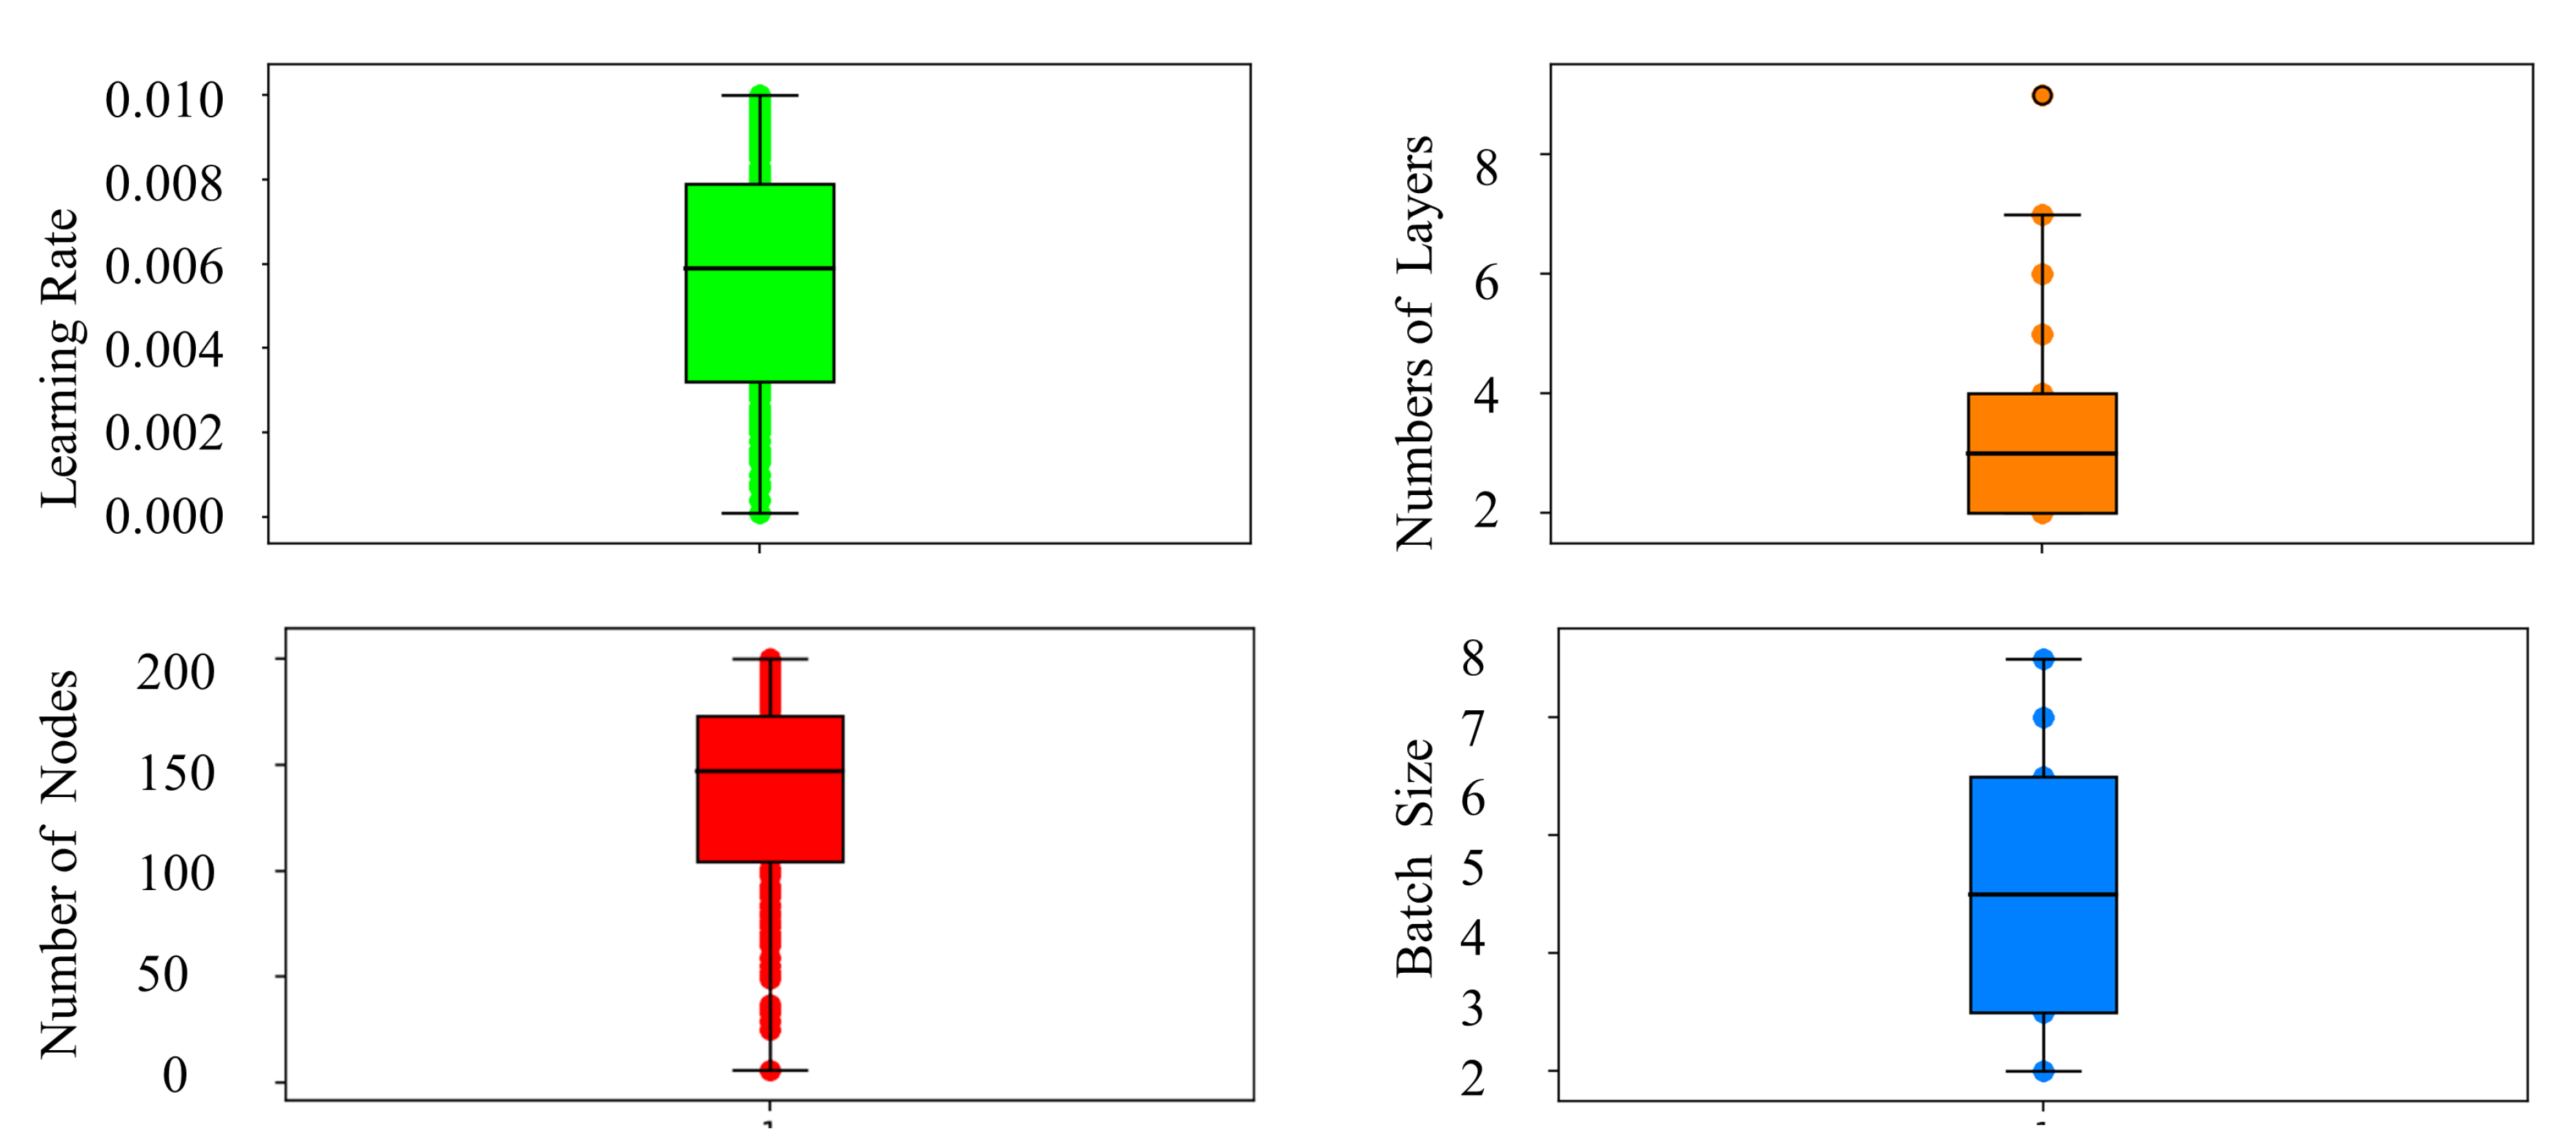
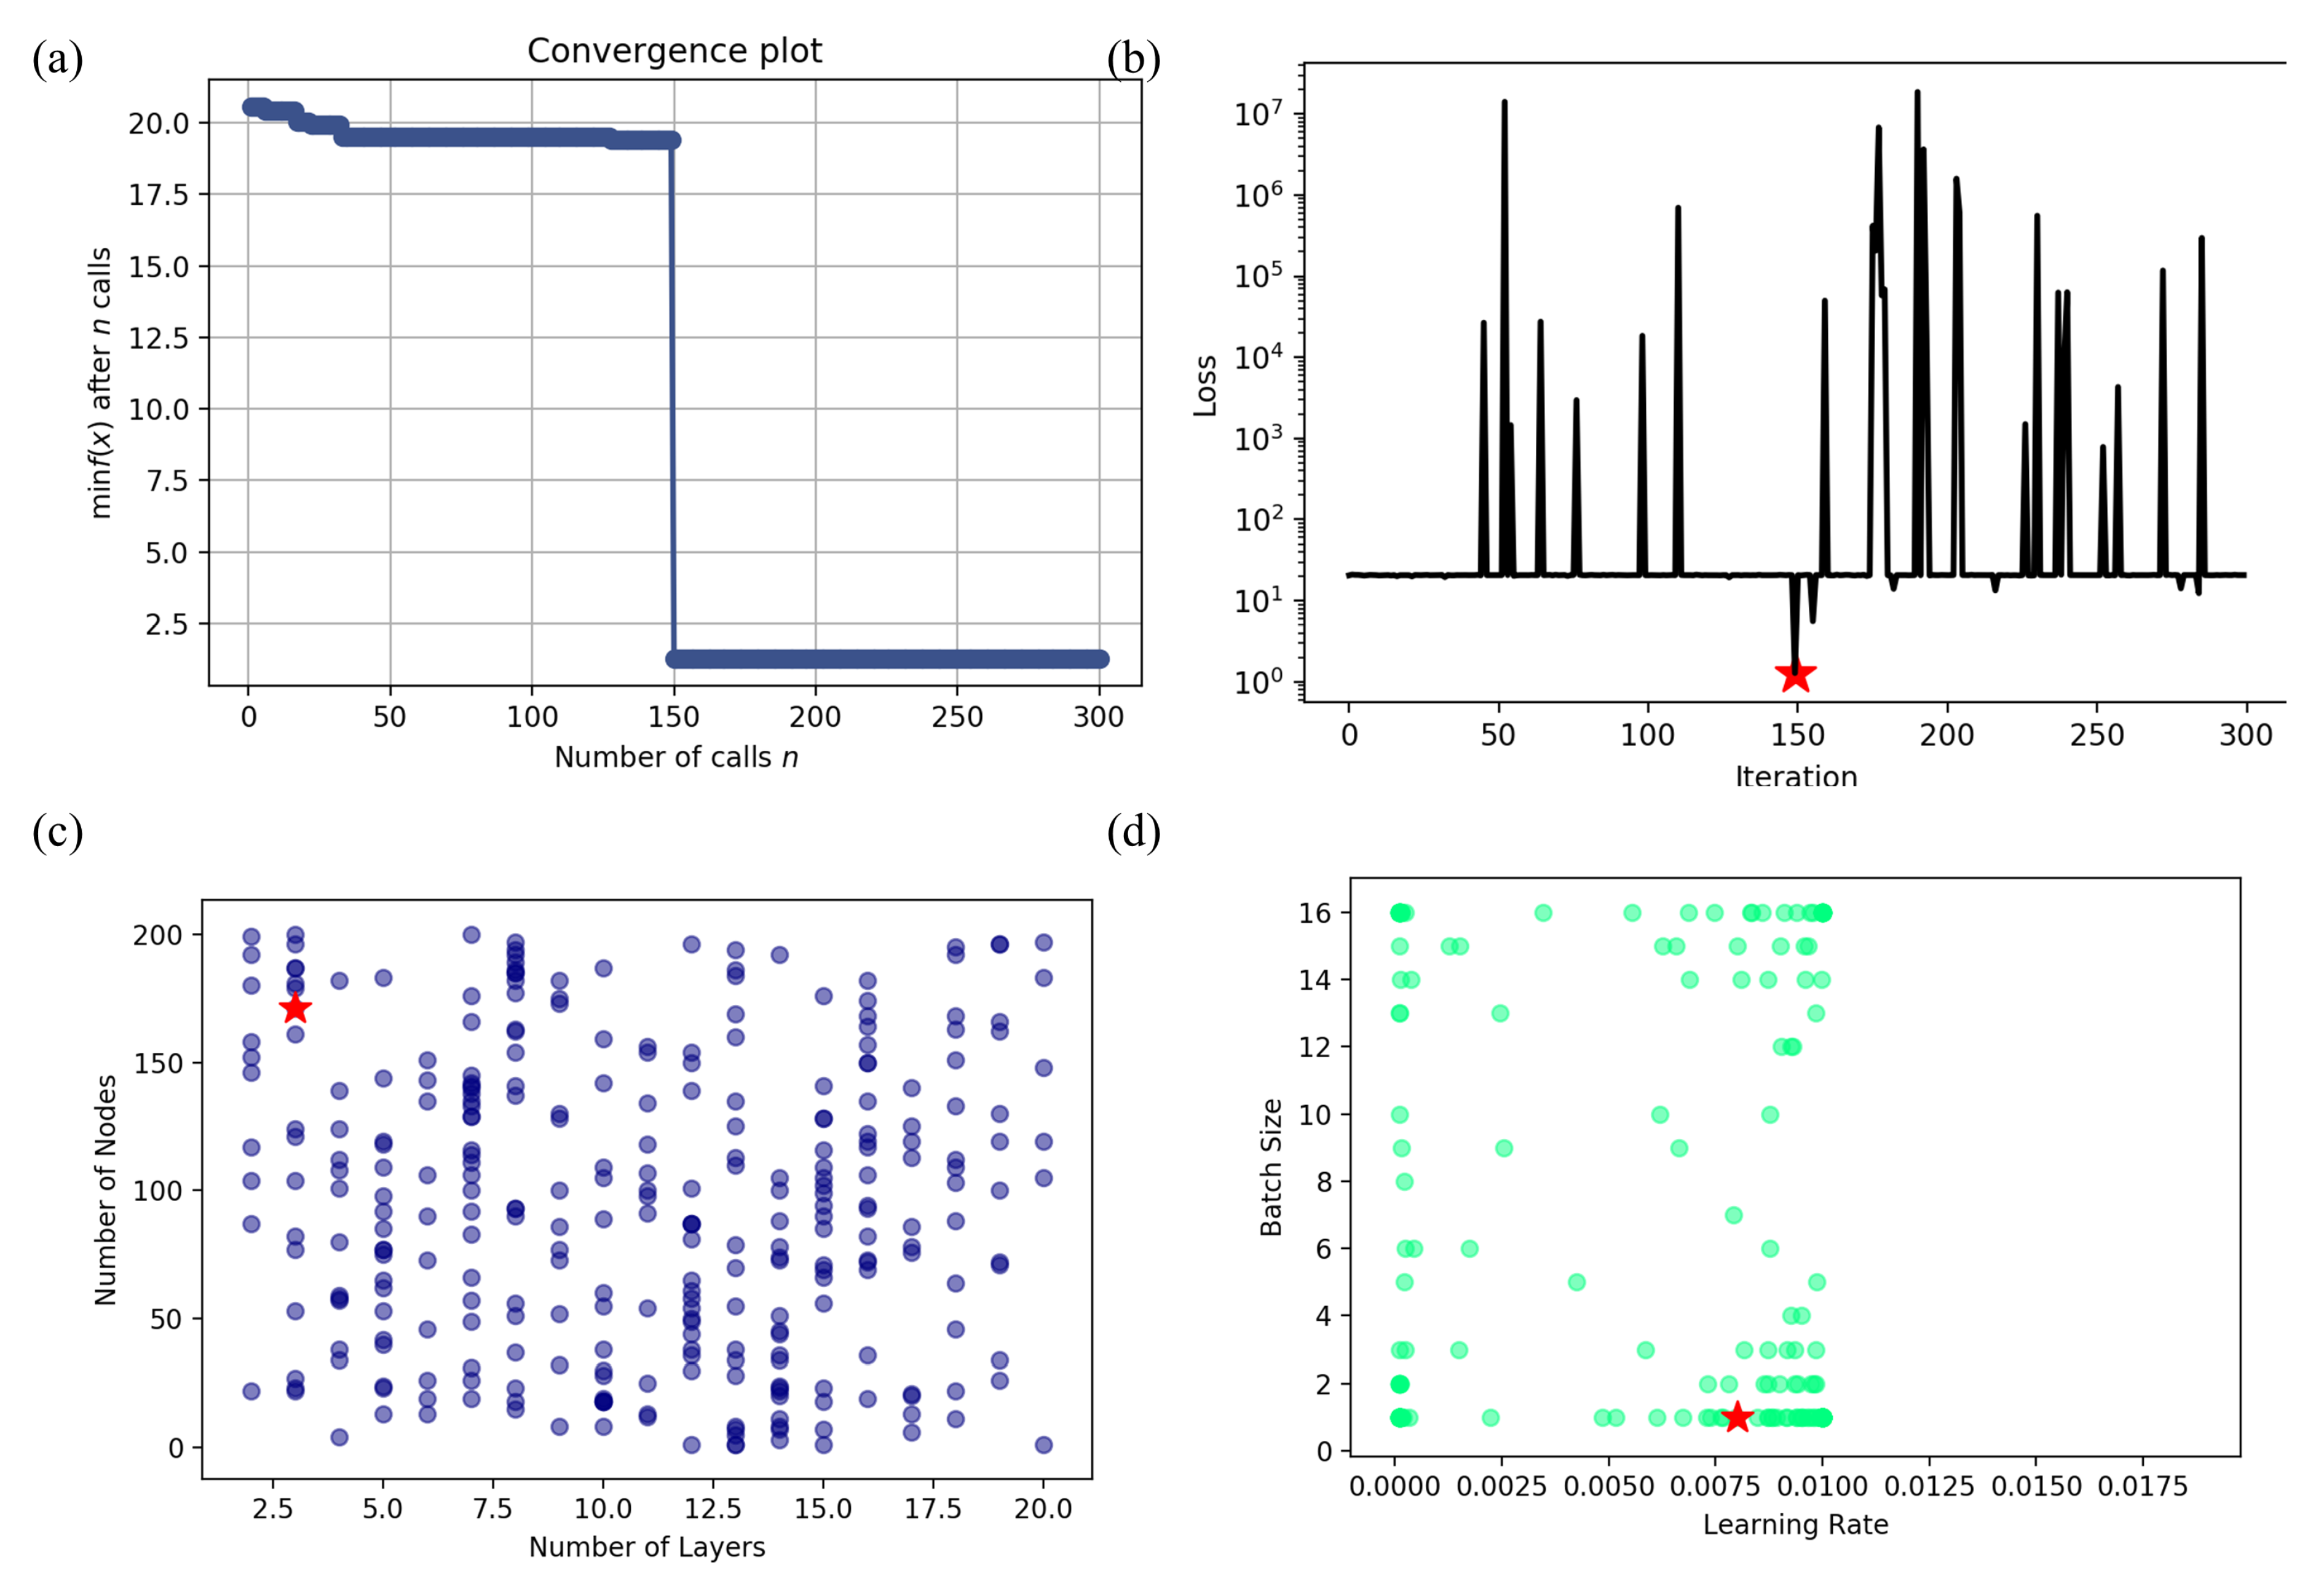
3.3. Network Search
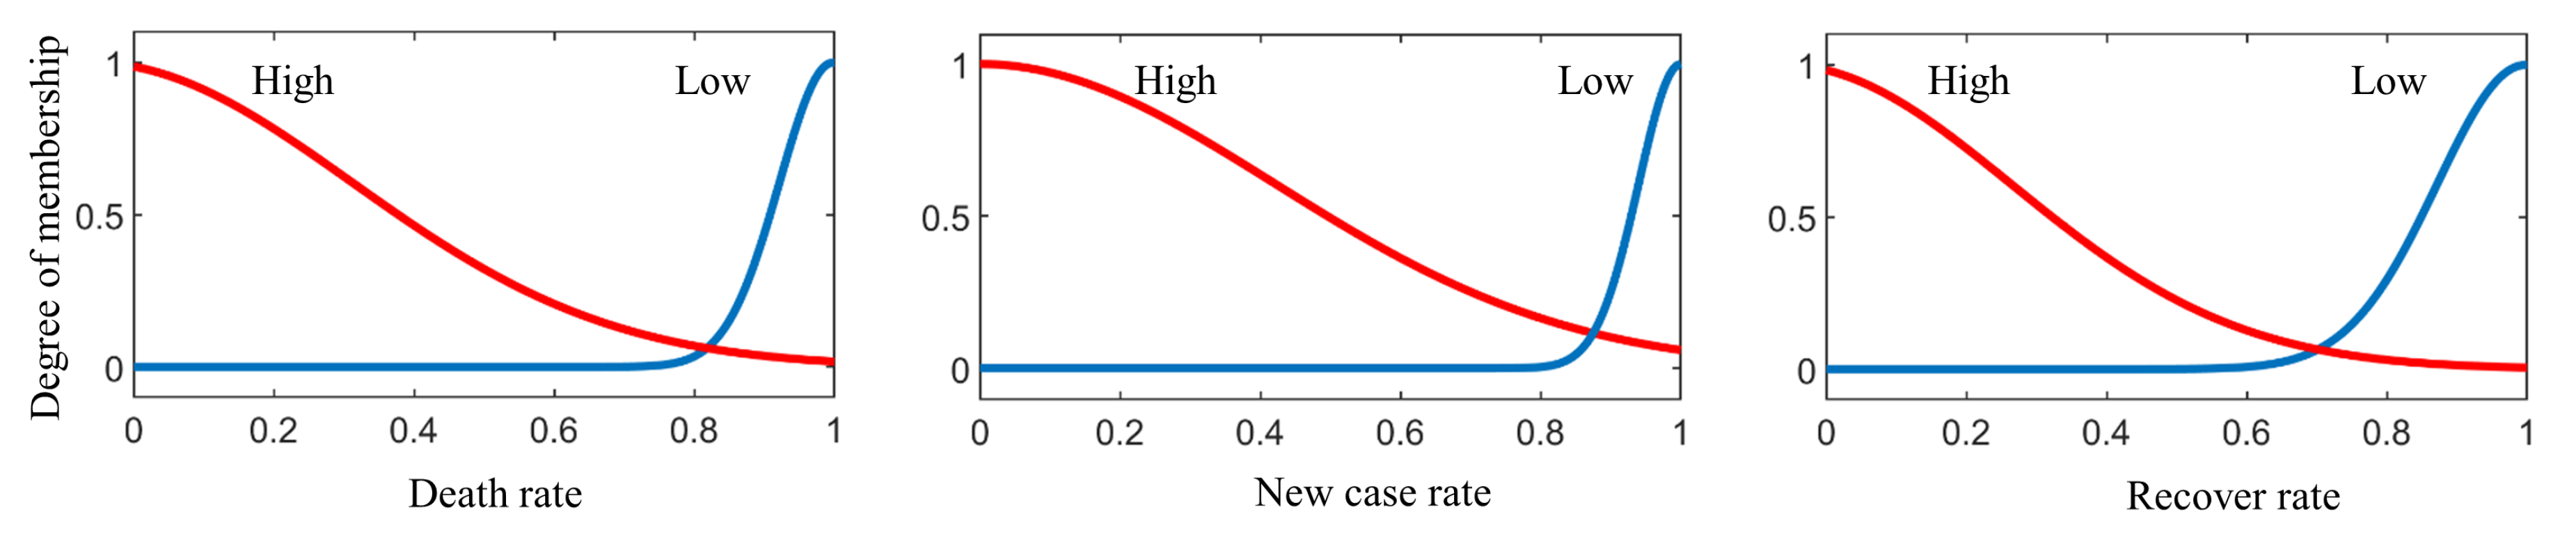
3.4. Fuzzy Rule-Based Risk Categorization
4. Results and Discussion
4.1. Dataset
4.2. Network Optimization
4.3. Training
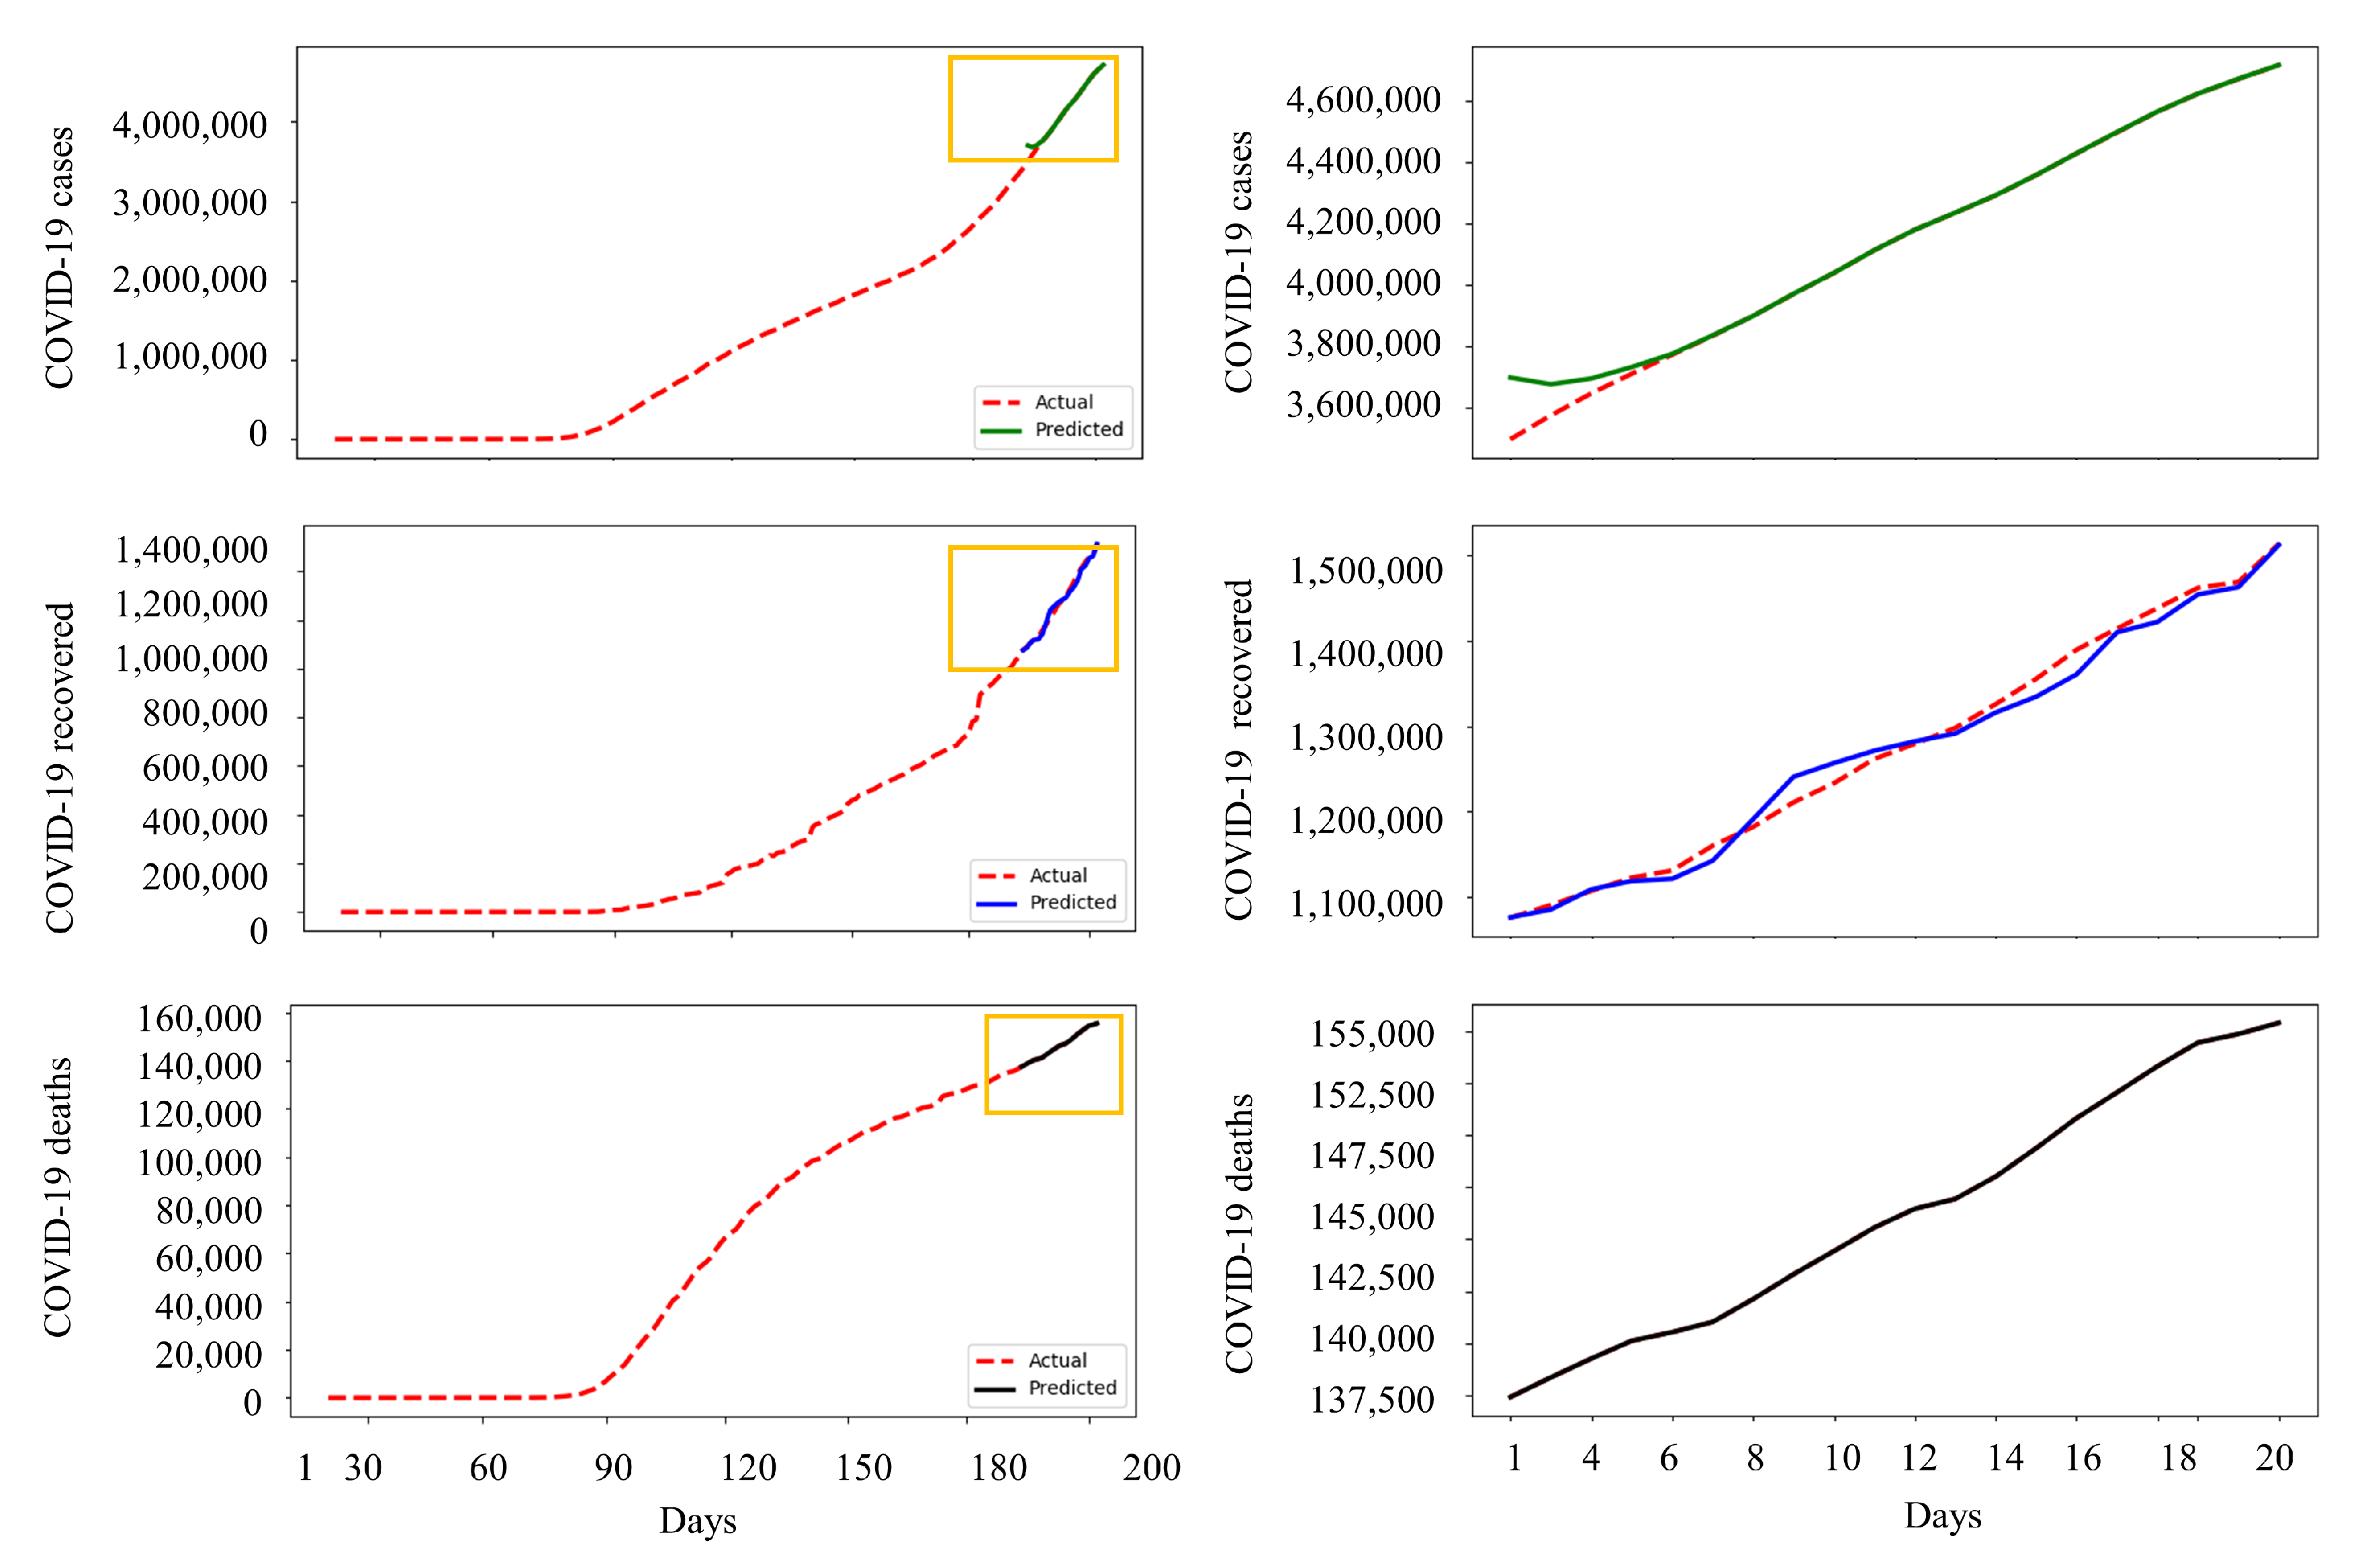
4.4. Prediction Accuracy
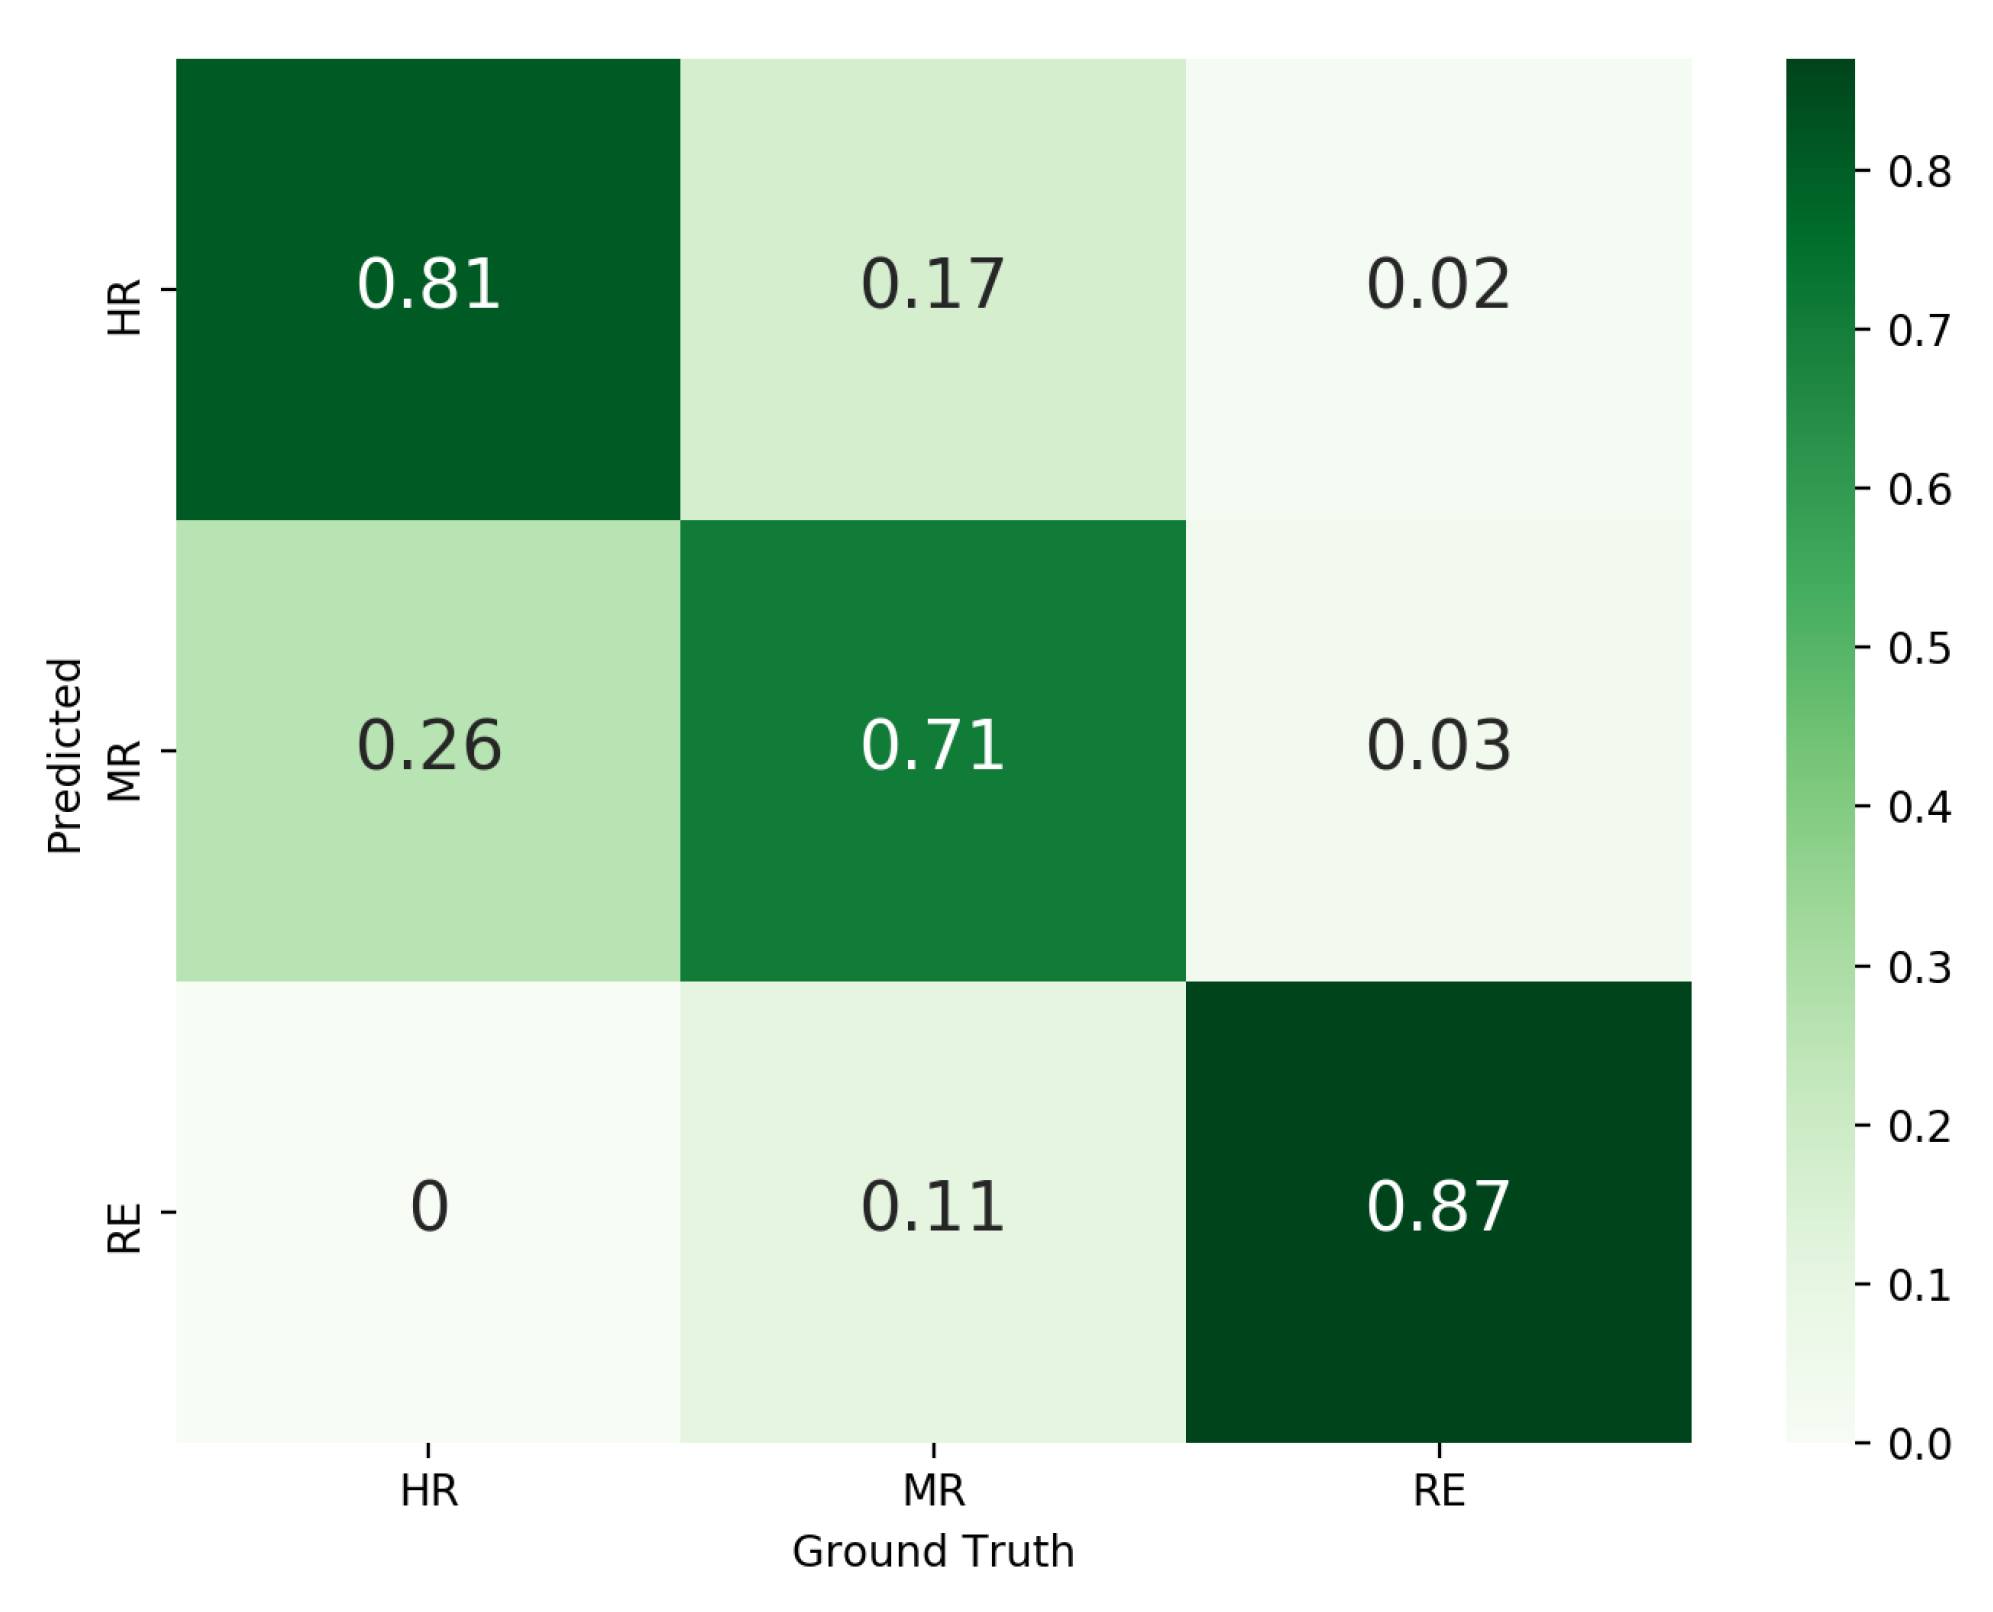
4.5. Risk Classification Accuracy
4.6. Implementation and Computational Cost
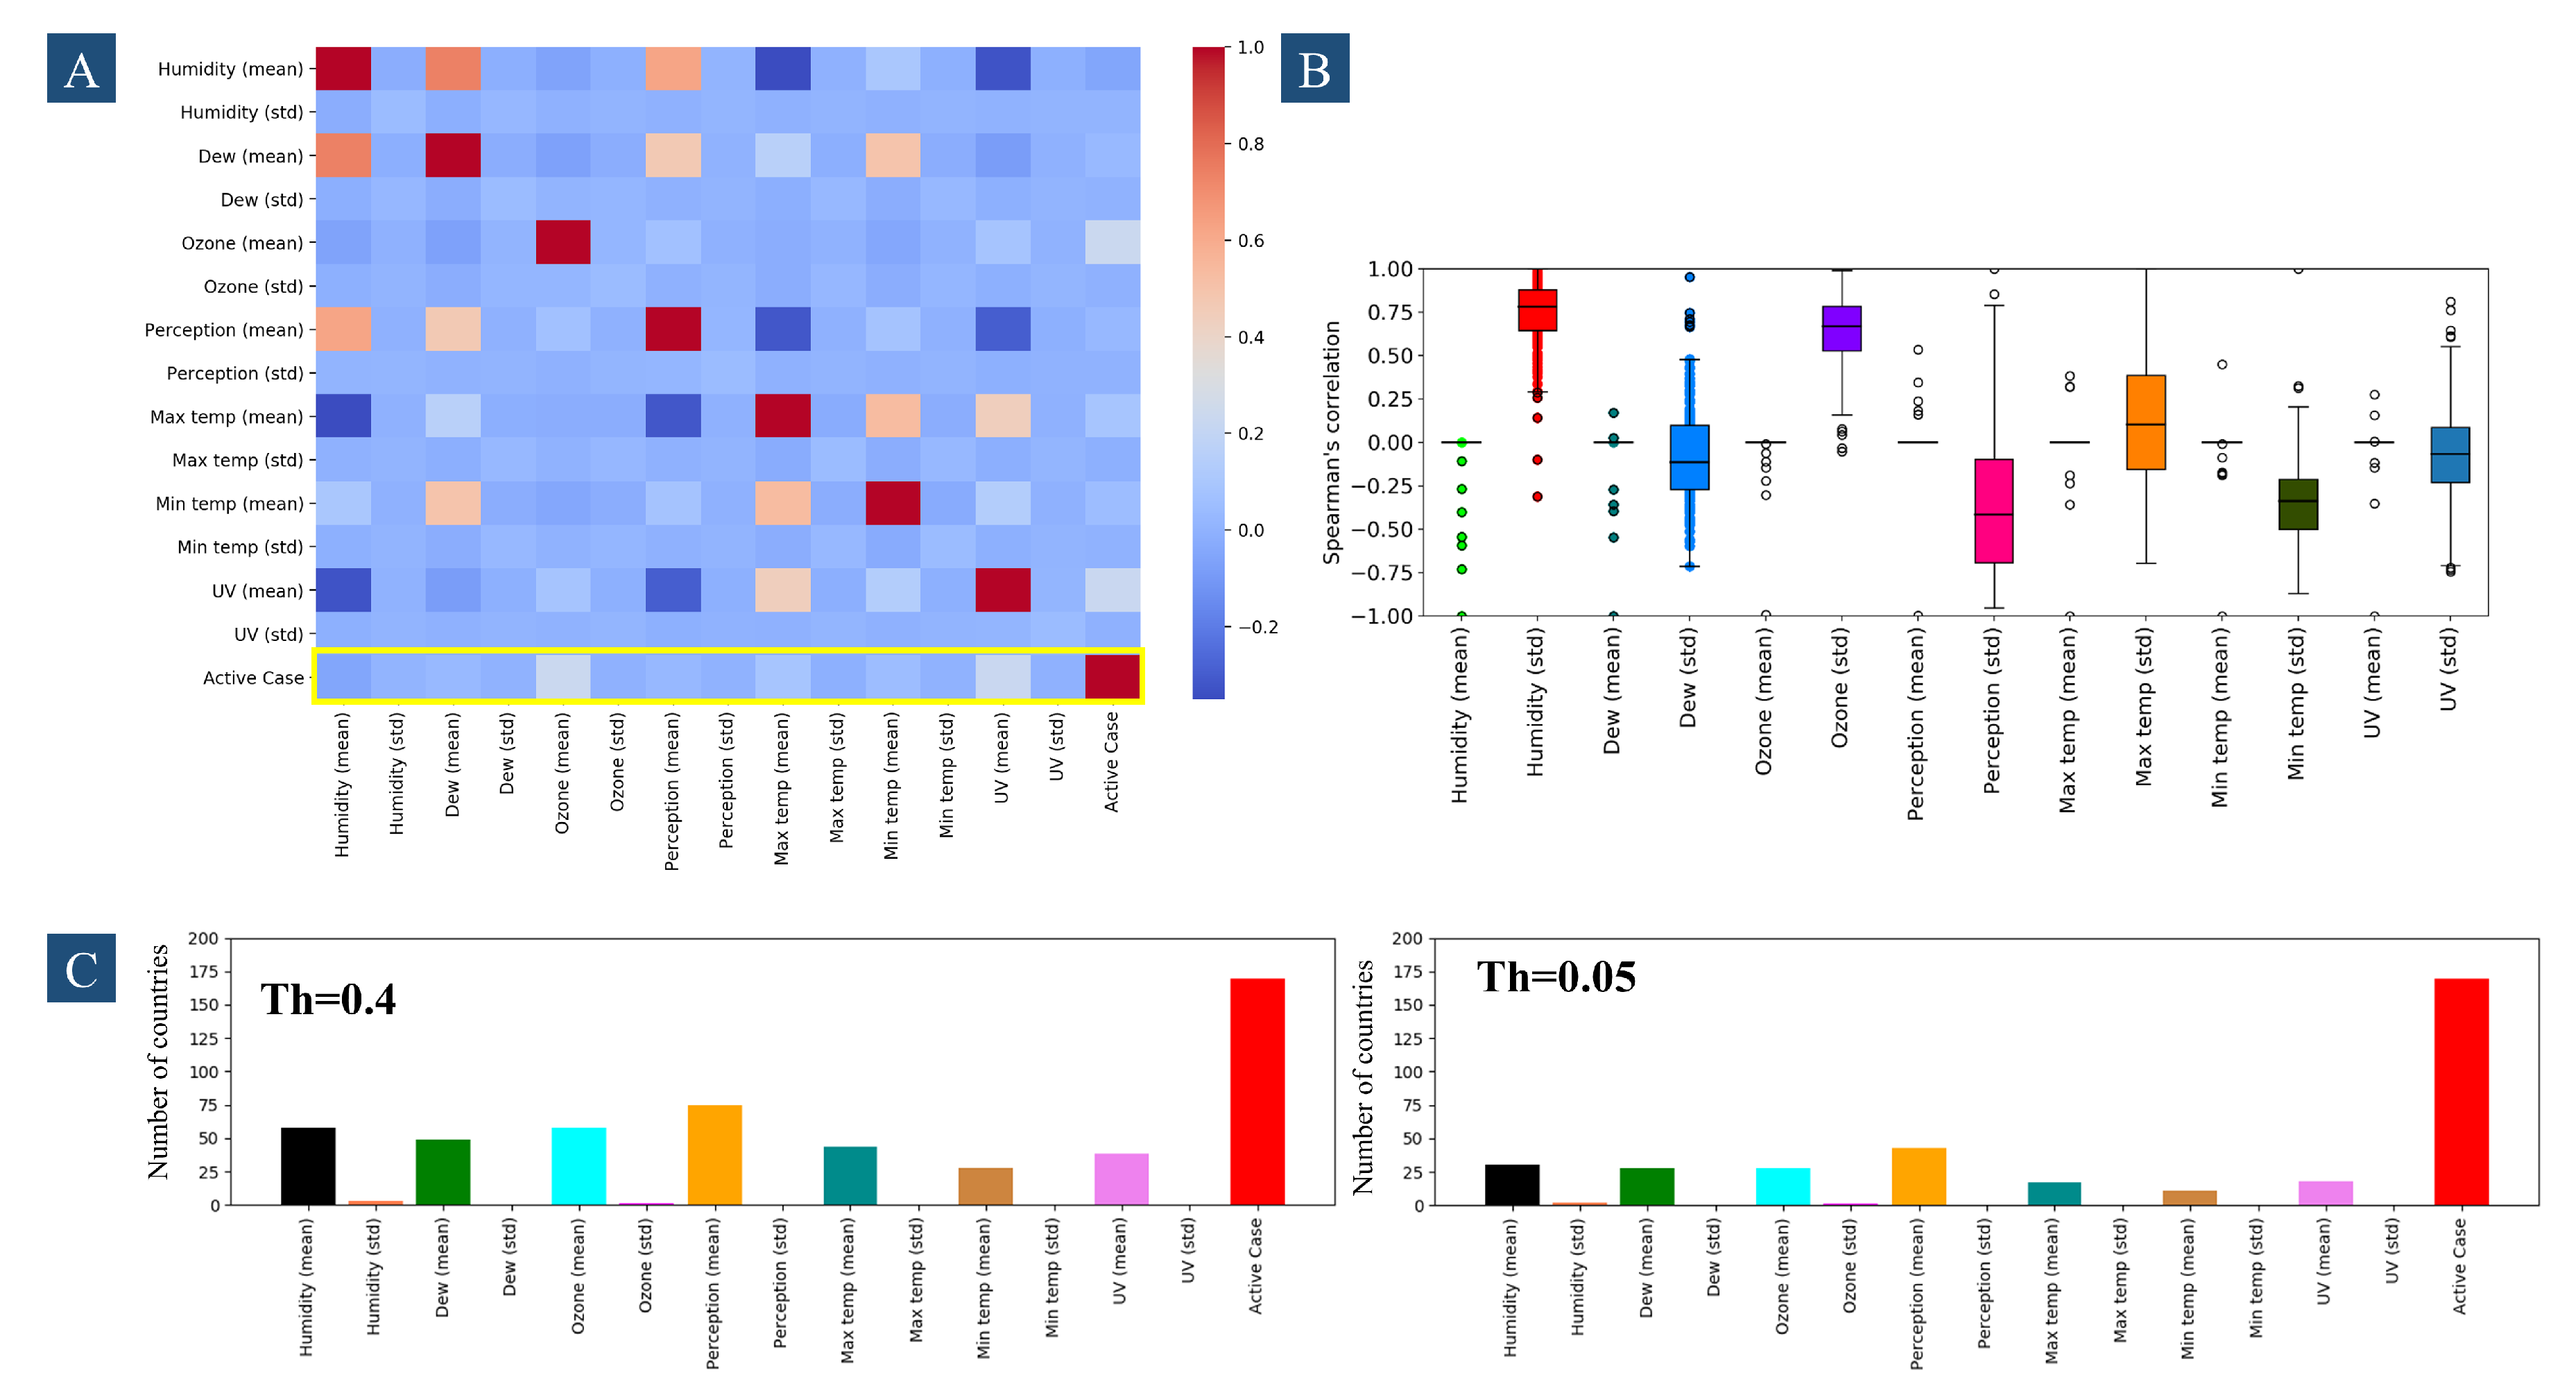
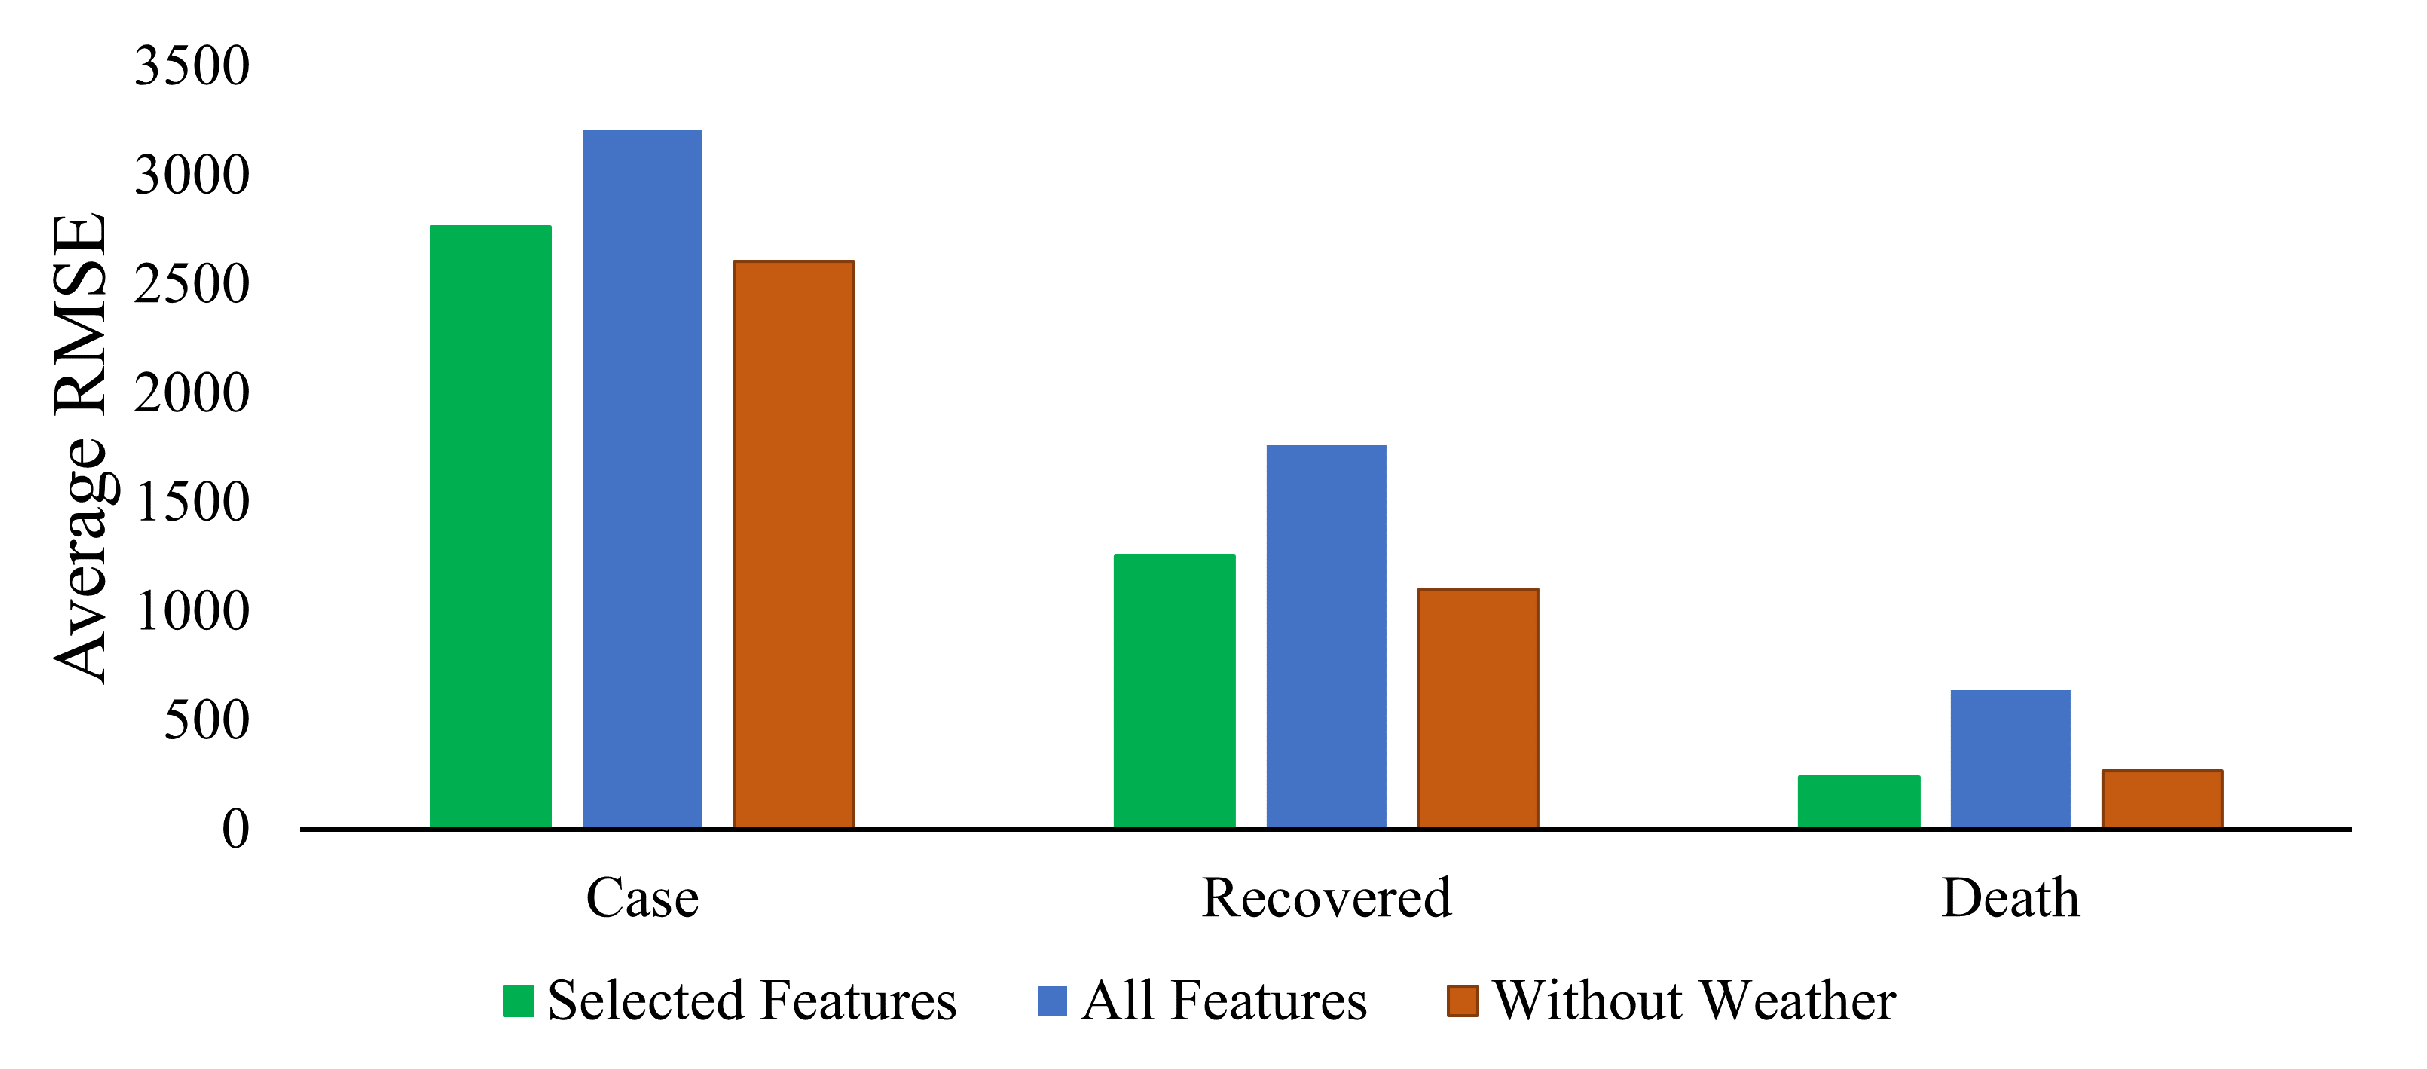
4.7. The Effect of Weather
| Algorithm 1. Feature selection algorithms |
 |
5. Conclusions
Author Contributions
Funding
Conflicts of Interest
References
- Wu, F.; Zhao, S.; Yu, B.; Chen, Y.M.; Wang, W.; Song, Z.G.; Hu, Y.; Tao, Z.W.; Tian, J.H.; Pei, Y.Y.; et al. A new coronavirus associated with human respiratory disease in China. Nature 2020, 579, 265–269. [Google Scholar] [CrossRef]
- Cheong, K.H.; Jones, M.C. Introducing the 21st Century’s New Four Horsemen of the Coronapocalypse. BioEssays 2020, 42, 2000063. [Google Scholar] [CrossRef] [PubMed]
- Akita, R.; Yoshihara, A.; Matsubara, T.; Uehara, K. Deep learning for stock prediction using numerical and textual information. In Proceedings of the 2016 IEEE/ACIS 15th International Conference on Computer and Information Science (ICIS), Okayama, Japan, 26–29 June 2016; pp. 1–6. [Google Scholar]
- Ali, M.; Lee, Y. CRM Sales Prediction Using Continuous Time-Evolving Classification. In Proceedings of the Thirty-Second AAAI Conference on Artificial Intelligence, New Orleans, LA, USA, 2–7 February 2018. [Google Scholar]
- Xiao, F.; Ai, Q. Data-driven multi-hidden markov model-based power quality disturbance prediction that incorporates weather conditions. IEEE Trans. Power Syst. 2018, 34, 402–412. [Google Scholar]
- Lu, Y.; Wang, S.; Wang, J.; Zhou, G.; Zhang, Q.; Zhou, X.; Niu, B.; Chen, Q.; Chou, K.C. An epidemic avian influenza prediction model based on google trends. Lett. Org. Chem. 2019, 16, 303–310. [Google Scholar] [CrossRef]
- Lin, A.X.; Ho, A.F.W.; Cheong, K.H.; Li, Z.; Cai, W.; Chee, M.L.; Ng, Y.Y.; Xiao, X.; Ong, M.E.H. Leveraging Machine Learning Techniques and Engineering of Multi-Nature Features for National Daily Regional Ambulance Demand Prediction. Int. J. Environ. Res. Public Health 2020, 17, 4179. [Google Scholar] [CrossRef] [PubMed]
- Tosepu, R.; Gunawan, J.; Effendy, D.S.; Lestari, H.; Bahar, H.; Asfian, P. Correlation between weather and Covid-19 pandemic in Jakarta, Indonesia. Sci. Total Environ. 2020, 725, 138436. [Google Scholar] [CrossRef]
- Gupta, S.; Raghuwanshi, G.S.; Chanda, A. Effect of weather on COVID-19 spread in the US: A prediction model for India in 2020. Sci. Total Environ. 2020, 728, 138860. [Google Scholar] [CrossRef]
- Şahin, M. Impact of weather on COVID-19 pandemic in Turkey. Sci. Total Environ. 2020, 728, 138810. [Google Scholar] [CrossRef] [PubMed]
- Jia, W.; Li, X.; Tan, K.; Xie, G. Predicting the outbreak of the hand-foot-mouth diseases in China using recurrent neural network. In Proceedings of the 2019 IEEE International Conference on Healthcare Informatics (ICHI), Xi’an, China, 10–13 June 2019; pp. 1–4. [Google Scholar]
- Hamer, W.B.; Birr, T.; Verreet, J.A.; Duttmann, R.; Klink, H. Spatio-Temporal Prediction of the Epidemic Spread of Dangerous Pathogens Using Machine Learning Methods. ISPRS Int. J. Geo-Inf. 2020, 9, 44. [Google Scholar] [CrossRef]
- Mezzatesta, S.; Torino, C.; De Meo, P.; Fiumara, G.; Vilasi, A. A machine learning-based approach for predicting the outbreak of cardiovascular diseases in patients on dialysis. Comput. Methods Programs Biomed. 2019, 177, 9–15. [Google Scholar] [CrossRef]
- Jhuo, S.L.; Hsieh, M.T.; Weng, T.C.; Chen, M.J.; Yang, C.M.; Yeh, C.H. Trend Prediction of Influenza and the Associated Pneumonia in Taiwan Using Machine Learning. In Proceedings of the 2019 International Symposium on Intelligent Signal Processing and Communication Systems (ISPACS), Taipei, Taiwan, 3–6 December 2019; pp. 1–2. [Google Scholar]
- Kumar, S.V.; Suresh, V.; Reddy, B.D.K.; Reddy, Y.J. Outbreak Predictions in Healthcare Domain using Machine learning & Artificial Intelligence. TEST Eng. Manag. 2020, 82, 11395–11400. [Google Scholar]
- Machado, G.; Vilalta, C.; Recamonde-Mendoza, M.; Corzo, C.; Torremorell, M.; Perez, A.; VanderWaal, K. Identifying outbreaks of Porcine Epidemic Diarrhea virus through animal movements and spatial neighborhoods. Sci. Rep. 2019, 9, 1–12. [Google Scholar] [CrossRef] [PubMed]
- Philemon, M.D.; Ismail, Z.; Dare, J. A Review of Epidemic Forecasting Using Artificial Neural Networks. Int. J. Epidemiol. Res. 2019, 6, 132–143. [Google Scholar]
- Abdulkareem, S.A.; Augustijn, E.W.; Filatova, T.; Musial, K.; Mustafa, Y.T. Risk perception and behavioral change during epidemics: Comparing models of individual and collective learning. PLoS ONE 2020, 15, e0226483. [Google Scholar] [CrossRef] [PubMed]
- Forna, A.; Nouvellet, P.; Dorigatti, I.; Donnelly, C. Case fatality ratio estimates for the 2013–2016 West African Ebola epidemic: Application of Boosted Regression Trees for imputation. Int. J. Infect. Dis. 2019, 79, 128. [Google Scholar] [CrossRef]
- Dallatomasina, S.; Crestani, R.; Sylvester Squire, J.; Declerk, H.; Caleo, G.M.; Wolz, A.; Stinson, K.; Patten, G.; Brechard, R.; Gbabai, O.B.M.; et al. Ebola outbreak in rural West Africa: Epidemiology, clinical features and outcomes. Trop. Med. Int. Health 2015, 20, 448–454. [Google Scholar] [CrossRef]
- Plowright, R.K.; Becker, D.J.; Crowley, D.E.; Washburne, A.D.; Huang, T.; Nameer, P.; Gurley, E.S.; Han, B.A. Prioritizing surveillance of Nipah virus in India. PLoS Negl. Trop. Dis. 2019, 13, e0007393. [Google Scholar] [CrossRef]
- Seetah, K.; LaBeaud, D.; Kumm, J.; Grossi-Soyster, E.; Anangwe, A.; Barry, M. Archaeology and contemporary emerging zoonosis: A framework for predicting future Rift Valley fever virus outbreaks. Int. J. Osteoarchaeol. 2020. [Google Scholar] [CrossRef]
- Rao, A.S.S.; Vazquez, J.A. Identification of COVID-19 Can be Quicker through Artificial Intelligence framework using a Mobile Phone-Based Survey in the Populations when Cities/Towns Are Under Quarantine. Infect. Control Hosp. Epidemiol. 2020, 41, 826–830. [Google Scholar] [CrossRef]
- Yan, L.; Zhang, H.T.; Xiao, Y.; Wang, M.; Sun, C.; Liang, J.; Li, S.; Zhang, M.; Guo, Y.; Xiao, Y.; et al. Prediction of criticality in patients with severe Covid-19 infection using three clinical features: A machine learning-based prognostic model with clinical data in Wuhan. medRxiv 2020. [Google Scholar] [CrossRef]
- Peng, L.; Yang, W.; Zhang, D.; Zhuge, C.; Hong, L. Epidemic analysis of COVID-19 in China by dynamical modeling. arXiv 2020, arXiv:2002.06563. [Google Scholar]
- Zhao, S.; Lin, Q.; Ran, J.; Musa, S.S.; Yang, G.; Wang, W.; Lou, Y.; Gao, D.; Yang, L.; He, D.; et al. Preliminary estimation of the basic reproduction number of novel coronavirus (2019-nCoV) in China, from 2019 to 2020: A data-driven analysis in the early phase of the outbreak. Int. J. Infect. Dis. 2020, 92, 214–217. [Google Scholar] [CrossRef] [PubMed]
- Chen, B.; Shi, M.; Ni, X.; Ruan, L.; Jiang, H.; Yao, H.; Wang, M.; Song, Z.; Zhou, Q.; Ge, T. Data Visualization Analysis and Simulation Prediction for COVID-19. arXiv 2020, arXiv:2002.07096. [Google Scholar]
- Li, M.; Chen, J.; Deng, Y. Scaling features in the spreading of COVID-19. arXiv 2020, arXiv:2002.09199. [Google Scholar]
- Hilton, J.; Keeling, M.J. Estimation of country-level basic reproductive ratios for novel Coronavirus (COVID-19) using synthetic contact matrices. medRxiv 2020. [Google Scholar] [CrossRef]
- Kastner, J.; Wei, H.; Samet, H. Viewing the Progression of the Novel Corona Virus (COVID-19) with NewsStand. arXiv 2020, arXiv:2003.00107. [Google Scholar]
- Jia, L.; Li, K.; Jiang, Y.; Guo, X. Prediction and analysis of Coronavirus Disease 2019. arXiv 2020, arXiv:2003.05447. [Google Scholar]
- Zhao, X.; Liu, X.; Li, X. Tracking the spread of novel coronavirus (2019-nCoV) based on big data. medRxiv 2020. [Google Scholar] [CrossRef]
- Zeng, T.; Zhang, Y.; Li, Z.; Liu, X.; Qiu, B. Predictions of 2019-ncov transmission ending via comprehensive methods. arXiv 2020, arXiv:2002.04945. [Google Scholar]
- Buizza, R. Probabilistic prediction of COVID-19 infections for China and Italy, using an ensemble of stochastically-perturbed logistic curves. arXiv 2020, arXiv:2003.06418. [Google Scholar]
- Fong, S.J.; Li, G.; Dey, N.; Crespo, R.G.; Herrera-Viedma, E. Finding an accurate early forecasting model from small dataset: A case of 2019-ncov novel coronavirus outbreak. Int. J. Interact. Multimed. Artif. Intell. 2020, 6, 51–61. [Google Scholar] [CrossRef]
- Santosh, K. AI-Driven Tools for Coronavirus Outbreak: Need of Active Learning and Cross-Population Train/Test Models on Multitudinal/Multimodal Data. J. Med. Syst. 2020, 44, 1–5. [Google Scholar] [CrossRef] [PubMed]
- Al-qaness, M.A.; Ewees, A.A.; Fan, H.; Abd El Aziz, M. Optimization Method for Forecasting Confirmed Cases of COVID-19 in China. J. Clin. Med. 2020, 9, 674. [Google Scholar] [CrossRef] [PubMed]
- Li, Y.; Liang, M.; Yin, X.; Liu, X.; Hao, M.; Hu, Z.; Wang, Y.; Jin, L. COVID-19 Epidemic Outside China: 34 Founders and Exponential Growth. medRxiv 2020. [Google Scholar] [CrossRef]
- Araujo, M.B.; Naimi, B. Spread of SARS-CoV-2 Coronavirus likely to be constrained by climate. medRxiv 2020. [Google Scholar] [CrossRef]
- Dong, M.; Sun, J. Partial Discharge Detection on Aerial Covered Conductors Using Time-Series Decomposition and Long Short-term Memory Network. arXiv 2020, arXiv:1907.03378. [Google Scholar] [CrossRef]
- Moews, B.; Herrmann, J.M.; Ibikunle, G. Lagged correlation-based deep learning for directional trend change prediction in financial time series. Expert Syst. Appl. 2019, 120, 197–206. [Google Scholar] [CrossRef]
- Thomas, K. Time Series Prediction for Stock Price and Opioid Incident Location. Ph.D. Thesis, Arizona State University, Tempe, AZ, USA, 2019. [Google Scholar]
- Lorenzo, A.; Olivas, J.A. Some Considerations on the Use of AI Techniques for Prediction and Forecasting in Political Elections and Stock Market. In Proceedings of the International Conference on Artificial Intelligence (ICAI), Las Vegas, Nevada, USA, 29 July–1 August 2019; pp. 403–407. [Google Scholar]
- Bandara, K.; Shi, P.; Bergmeir, C.; Hewamalage, H.; Tran, Q.; Seaman, B. Sales demand forecast in e-commerce using a long short-term memory neural network methodology. In Proceedings of the International Conference on Neural Information Processing, Sydney, NSW, Australia, 12–15 December 2019; pp. 462–474. [Google Scholar]
- Cui, Y.; Hou, H.; Sheng, G.; Jiang, X.; He, M.; Jiang, G.; Chi, J.; Tong, J. A prediction method for power transformer state parameters based on feature attention mechanism. In Proceedings of the 2019 IEEE PES Asia-Pacific Power and Energy Engineering Conference (APPEEC), Macao, China, 1–4 December 2019; pp. 1–5. [Google Scholar]
- Oh, S.L.; Ng, E.Y.; San Tan, R.; Acharya, U.R. Automated diagnosis of arrhythmia using combination of CNN and LSTM techniques with variable length heart beats. Comput. Biol. Med. 2018, 102, 278–287. [Google Scholar] [CrossRef]
- Ho, A.F.W.; To, B.Z.Y.S.; Koh, J.M.; Cheong, K.H. Forecasting Hospital Emergency Department Patient Volume Using Internet Search Data. IEEE Access 2019, 7, 93387–93395. [Google Scholar] [CrossRef]
- Jiménez, F.; Palma, J.; Sánchez, G.; Marín, D.; Palacios, F.; López, L. Feature Selection based Multivariate Time Series Forecasting: An Application to Antibiotic Resistance Outbreaks Prediction. Artif. Intell. Med. 2020, 104, 101818. [Google Scholar] [CrossRef]
- Tapak, L.; Hamidi, O.; Fathian, M.; Karami, M. Comparative evaluation of time series models for predicting influenza outbreaks: Application of influenza-like illness data from sentinel sites of healthcare centers in Iran. BMC Res. Notes 2019, 12, 353. [Google Scholar] [CrossRef] [PubMed]
- Su, K.; Xu, L.; Li, G.; Ruan, X.; Li, X.; Deng, P.; Li, X.; Li, Q.; Chen, X.; Xiong, Y.; et al. Forecasting influenza activity using self-adaptive AI model and multi-source data in Chongqing, China. EBioMedicine 2019, 47, 284–292. [Google Scholar] [CrossRef] [PubMed]
- Ochodek, M.; Kopczyńska, S.; Staron, M. Deep learning model for end-to-end approximation of COSMIC functional size based on use-case names. Inf. Softw. Technol. 2020, 123, 106310. [Google Scholar] [CrossRef]
- Hu, F.; Zhu, Y.; Liu, J.; Li, L. An efficient Long Short-Term Memory model based on Laplacian Eigenmap in artificial neural networks. Appl. Soft Comput. 2020, 91, 106218. [Google Scholar] [CrossRef]
- Wen, S.; Wang, Y.; Tang, Y.; Xu, Y.; Li, P.; Zhao, T. Real-Time Identification of Power Fluctuations Based on LSTM Recurrent Neural Network: A Case Study on Singapore Power System. IEEE Trans. Ind. Inform. 2019, 15, 5266–5275. [Google Scholar] [CrossRef]
- Yuan, J.; Wang, H.; Lin, C.; Liu, D.; Yu, D. A novel GRU-RNN network model for dynamic path planning of mobile robot. IEEE Access 2019, 7, 15140–15151. [Google Scholar] [CrossRef]
- Karim, F.; Majumdar, S.; Darabi, H.; Harford, S. Multivariate lstm-fcns for time series classification. Neural Netw. 2019, 116, 237–245. [Google Scholar] [CrossRef] [PubMed]
- Goel, H.; Melnyk, I.; Banerjee, A. R2N2: Residual recurrent neural networks for multivariate time series forecasting. arXiv 2017, arXiv:1709.03159. [Google Scholar]
- Althelaya, K.A.; El-Alfy, E.S.M.; Mohammed, S. Stock market forecast using multivariate analysis with bidirectional and stacked (LSTM, GRU). In Proceedings of the 2018 21st Saudi Computer Society National Computer Conference (NCC), Riyadh, Saudi Arabia, 25–26 April 2018; pp. 1–7. [Google Scholar]
- Hans, C. Elastic net regression modeling with the orthant normal prior. J. Am. Stat. Assoc. 2011, 106, 1383–1393. [Google Scholar] [CrossRef]


| Parameter | Description | Distribution/Selection | Values |
|---|---|---|---|
| Learning rate | Minimum learning rate | Log uniform | 1 × to 1 × 10 |
| Hidden layers | Number of layers in the network | Discrete numeric | 1 to 20 |
| Hidden state | Number of memory cell in each layer | Discrete numeric | 1 to 200 |
| Activation | Activation in each layer | Category | {ReLU, sigmoid, tanh} |
| Batch size | Batch size during training | Discrete numeric | 2 to 10 |
| Dropout | Dropout size before dense layer | Log uniform | 0 to 0.5 |
| Death Rate | Case Rate | Recovery Rate | Decision |
|---|---|---|---|
| High | High | Low | HR |
| Low | High | Low | HR |
| High | High | High | HR |
| Low | High | High | HR |
| High | Low | High | MR |
| High | Low | Low | MR |
| Low | Low | Low | MR |
| Low | Low | High | RE |
| Method | RMSE | ||
|---|---|---|---|
| COVID-19 Cases | Recovered | Death | |
| Liner Regression | 2705.6 | 856.6 | 427.2 |
| Lasso Linear Regression | 1905.9 | 333.4 | 175.3 |
| Ridge Regression | 2307.5 | 614.2 | 213.3 |
| Elastic Net [58] | 2307.3 | 2105.9 | 300.2 |
| LSTM-FCNS [55] | 2605.4 | 1305.3 | 269.5 |
| Recidual RNN [56] | 2905.4 | 1109.5 | 242.3 |
| GRU [57] | 2605.3 | 923.0 | 163.5 |
| GRU+Baysian | 1275.0 | 422.9 | 100.2 |
| Proposed | 1103.5 | 329.0 | 101.9 |
| High Risk (HR) | Low Risk (LR) | Recovering (RE) |
|---|---|---|
| India | Slovakia | Greenland |
| USA | Malta | Uruguay |
| Russia | Denmark | Zimbabwe |
| Brazil | Switzerland | Japan |
| Mexico | Germany | Norway |
© 2020 by the authors. Licensee MDPI, Basel, Switzerland. This article is an open access article distributed under the terms and conditions of the Creative Commons Attribution (CC BY) license (http://creativecommons.org/licenses/by/4.0/).
Share and Cite
Pal, R.; Sekh, A.A.; Kar, S.; Prasad, D.K. Neural Network Based Country Wise Risk Prediction of COVID-19. Appl. Sci. 2020, 10, 6448. https://doi.org/10.3390/app10186448
Pal R, Sekh AA, Kar S, Prasad DK. Neural Network Based Country Wise Risk Prediction of COVID-19. Applied Sciences. 2020; 10(18):6448. https://doi.org/10.3390/app10186448
Chicago/Turabian StylePal, Ratnabali, Arif Ahmed Sekh, Samarjit Kar, and Dilip K. Prasad. 2020. "Neural Network Based Country Wise Risk Prediction of COVID-19" Applied Sciences 10, no. 18: 6448. https://doi.org/10.3390/app10186448
APA StylePal, R., Sekh, A. A., Kar, S., & Prasad, D. K. (2020). Neural Network Based Country Wise Risk Prediction of COVID-19. Applied Sciences, 10(18), 6448. https://doi.org/10.3390/app10186448