Article

Large Gradient Micro-Structure Topography Measurement with Multi-Angle Stitching Digital Holographic Microscope

1
University of Chinese Academy of Sciences, Beijing 100049, China
2
Institute of Optics and Electronics, Chinese Academy of Science, Chengdu 610209, China
*
Author to whom correspondence should be addressed.
Appl. Sci. 2020, 10(17), 6110; https://doi.org/10.3390/app10176110
Submission received: 6 August 2020 / Revised: 26 August 2020 / Accepted: 27 August 2020 / Published: 3 September 2020
(This article belongs to the Section Optics and Lasers)

Abstract

:
We present an effective method for the topography characterization of large gradient micro-structure based on digital holographic microscope (DHM). Due to the limitation of numerical aperture of DHM system, high frequency information corresponding to large gradient regions of specimen is prohibited from entering the imaging system and the complete collection of specimen features cannot be implemented. To solve this problem, we use a common configuration of off-axis DHM system to capture the holograms from multiple angles of the sample, and the various object waves coming from the sample of different tilt angle is corrected and spliced into a fully topography by multi-angle stitching process. In this way, the measurement of large gradient topography of specimen can be realized. Experimental results of large gradient microlens demonstrate the practicability and precision of the presented method.

1. Introduction

Nowadays, micro-structures have acted as an element in various systems play an important role in measurement [1,2], optical fiber communication [3,4], display [5,6] and other fields [7,8]. In order to ensure the performance of the micro-structure, the characterization of surface topography of micro-structure is crucial. Digital holography microscopy (DHM) provides a high-efficiency and accuracy as a measuring tool for measurement of micro-structures which can achieve lateral resolution down to a few hundred nanometers and an axial resolution of less than λ / 150 , simultaneously [9,10]. Nevertheless, the conventional DHM system is not suitable for the measurement of micro-structures with large gradient topography, which can generate the object wave of large slope angle. When the largest slope angle of the object wave exceeds the range of angles that the microscopic objective (MO) of DHM system can receive, the corresponding large gradient regions cannot be measured effectively since the object wave is limited by the small numerical aperture (NA) of MO of the DHM system.
To solve the problem, some researchers introduced different illumination modes to the DHM system to achieve surface shapes of objects with large gradients. Generally, there are two typical solutions. The first solution is to use an illumination mode of multidirectional plane wave. Liżewski et al. [11] was inspired by the concept of super-resolution, in that the illumination mode was realized by introducing the sinusoidal grating, and three illumination beams are generated by the diffraction order (−1 0 +1) of grating. Therefore, the method has the problem of aliasing which needs to carry out the additional diffraction calculations for separation of beams. Moreover, the period and orientation of grating is fixed so that the grating provided only stationary direction and angle of illumination, so the measurement of multiple objects can only be implemented by replacing the corresponding grating, which is inefficient. This method, based on the super-resolution concept, was then developed by Józwik et al. [12]. They present a more flexible approach which replaces the sinusoidal grating with a blazed diffraction grating produced by the phase spatial light modulator (SLM) that can generate a grating of multiple periods and arbitrary direction, therefore, the introduction of SLM makes the method more practical and robust. However, the resolution of SLM, which cannot generate a blazed grating fringe smaller than pixel size, is finite, so the inclination angle of the illumination beam generated by the blazed grating from SLM is limited, and it cannot implement oblique illumination at an arbitrary angle of tilt. In this case, the measurable gradient of this method is restricted.
Another solution which utilize spherical wave illumination mode, which was proposed by Kozacki et al. [13], and this measuring system use the MO to generate the point source illumination, which can effectively decrease the NA of the object wave and extend the capabilities of transmission systems for characterization of large gradient objects. However, the application range of this method is only limited for focusing on micro-structures, such as: Spherical/aspherical surfaces. In addition, all of the above solutions based on different illumination modes have a common disadvantage, while the large steepness surface shape is measured in reflection configurations through the above solutions, the illumination wave of the large slope angle has the risk of being partially blocked by MO so that this form of illumination cannot be effectively implemented.
In our work, we introduce multi-angle stitching DHM to solve the problem of large gradient micro-structure measurement. In system configuration, we only need to replace the ordinary sample carrier platform with a four degrees of freedom stage in the conventional DHM system. The purpose of this modification is to provide rotation angle for the sample and decrease the relative gradient of partial region, and then the system can image the sample from multiple angles and obtain large gradient topography information in all directions. Furthermore, in the data processing procedure, we utilize a tilted local ray approximation algorithm to accurately recover the surface shape from multiple angles and a high precision stitching algorithm is used to correct the alignment error and merge the multiple angle 3D topography to get a complete surface shape. By doing so, the measuring capability of the system for large gradient surface shape is effectively improved. Moreover, the precision motion table can provide an angular deflection in an arbitrary direction for the sample, which makes our method more general and eliminates limitations of measurement imposed by the method based on different illumination modes. What is more, the modification of our method is small relative to the other methods for the general DHM configuration, moreover, it is confirmed that our method is low-cost and a convenient measuring tool for large gradient micro-structure.
In this experiment, a microlens as a sample, which cannot be fully reconstructed by the conventional DHM due to the existence of a large gradient region, is reconstructed accurately by our approach with transmission configuration, demonstrating the feasibility of our approach for measuring large gradient micro-structure topography. This method is suitable for measurement of various micro-structures with large gradients surface shape and extends the measurable gradient range of the DHM system without reducing the field of view.

2. Measurement Procedure

2.1. Experimental Setup

The presented DHM system in transmission mode based on the Mach–Zehnder interferometer configuration is built. As shown in Figure 1, a beam ( λ = 632.8 nm) generated by a He-Ne laser source was split by a beam splitter (BS1) into two beams perpendicular to each other. One of beams was used for illuminating the sample as the object beam, the other was the reference beam for recording the information about object beam. The neutral density filter (NF1, transmittance = 10 %) between the light source and BS1 decrease the intensity of beam to prevent overexposure of CCD. The object beam, which was reflected from a mirror (M1), was expanded and collimated by a beam expander (BE1) consisting of microscope, pinhole and collimator lens. Then, the beam passed through sample was collected by the microscope (MO, NA = 0.3, 10×). Meanwhile, the reference beam passed through a neutral density filter (NF2, transmittance = 50 %), which was able to adjust the intensity of reference beam for registering a high quality hologram, then, reflected from mirror (M2) after being expanded by a beam expander (BE2). The object and reference beam were combined by the beam splitter (BS2) with a slight angle and the image-plane hologram was recorded by CCD (Basler ace, resolution 1544 by 2064, pixels size 3.45 um).
In this configuration, high precision rotation operation was required for measuring the fully topography. At the same time, the center of rotary axis needed to be placed at the optical axis for preventing transverse displacement of the tested sample in the field of view during the rotation. Therefore, a four degrees of freedom stage with manual adjustment was designed to provide four-dimensional motion with high accuracy and repeatability for the tested sample. This stage consisted of two linear axes (X, Y) with the travel range of ±30 mm and two rotary axes (R_X, R_Y) with the rotation range of ±90°, as shown in the ovals of Figure 1. Two linear translators were used to move the absolute position of the intersection of the two rotary axes and assure its position coincident with the optical axis. The sample was fixed on two rotary translator which adjusts the precision tilt angle of tested sample. It was noted that the accuracy of four degree of freedom stage was so limited that every manual rotation operation carried an uncertain alignment error, so it was essential to execute the re-alignment procedure in the subsequent multi-angle stitching process.
Furthermore, the microscope, whose NA decides the frequency bandwidth of the whole measurement system, was just like a low pass filter and the object wave corresponding to the large gradient region of sample carried high frequency spatial information, so we can say the NA of MO severely restrict the capability to measure the large gradient topography. In conventional DHM, if the large gradient object whose NA is larger than the NA of MO then it is vertically transmitted by a plane wave, as shown in Figure 2a, only the red part of beam which carry the topography information of small gradient region of object can be received by MO. Meanwhile, the blue part of beam was lost and cannot generate a dark area without any surface information in hologram. However, in the multi-angle stitching method, the DHM system was improved by adding four degrees of freedom stage which can provide multiple inclination angle for the sample. By means of rotation, the angle between normal direction of the large gradient region of sample and direction of incident ray was decreased and the area’s surface feature can be captured by MO, as shown in Figure 2b,c and we can also measure shape surface with larger gradient while rotation angle was adjusted to be larger. Finally, the whole topography of sample was reconstructed by processing a group of holograms corresponding to multiple rotation angles, as illustrated in the following section.

2.2. Data Processing Procedure

In addition to the above-mentioned re-alignment procedure, the whole data processing method still has many details to be considered, such as the numerical aberration correction, construction of unified coordinates and high precision topography reconstruction. Figure 3 illustrate the integral flow of the data processing and it is elaborated in the Section 2.2.1 and Section 2.2.2.

2.2.1. Hologram Reconstruction

As long as the holograms have been captured, the numerical reconstruction should be performed to obtain its object waves. The recorded holograms are expressed as:
I ( x , y ) = ( O + R ) 2 = | O | 2 + | R | 2 + O * R + O R
where O is the object wave and R is the reference wave, * represent the complex conjugate operation.
We use the angular spectrum method [14] for numerical reconstruction. The object wave at a propagation distance d is expressed as:
U ( x , y ) = I F F T { F F T [ I ( x , y ) ] exp ( i k d 1 ( λ f x ) 2 ( λ f y ) 2 ) W ( f x , f y ) S ( f x , f y ) } Γ R C H H
where FFT and IFFT represent fast Fourier transform (FFT) and inverse fast Fourier transform (IFFT), respectively, and f x and f y is spatial frequencies in x and y direction, respectively. In order to get rid of the zero-order term and the twin image, a proper spectrum window W ( f x , f y ) is used to implement filter in the spatial frequency domain. Due to the existence of one-order phase aberration, this region is shifted into the center of the spectrum by a translation function S ( f x , f y ) . What is more, the optical element of this configuration can produce the high-order phase aberration, the calibration method called reference conjugated hologram [15] is used for removing the influence of phase aberration. In this method, the compensation term Γ R C H H can obtain by recording a blank hologram without sample.

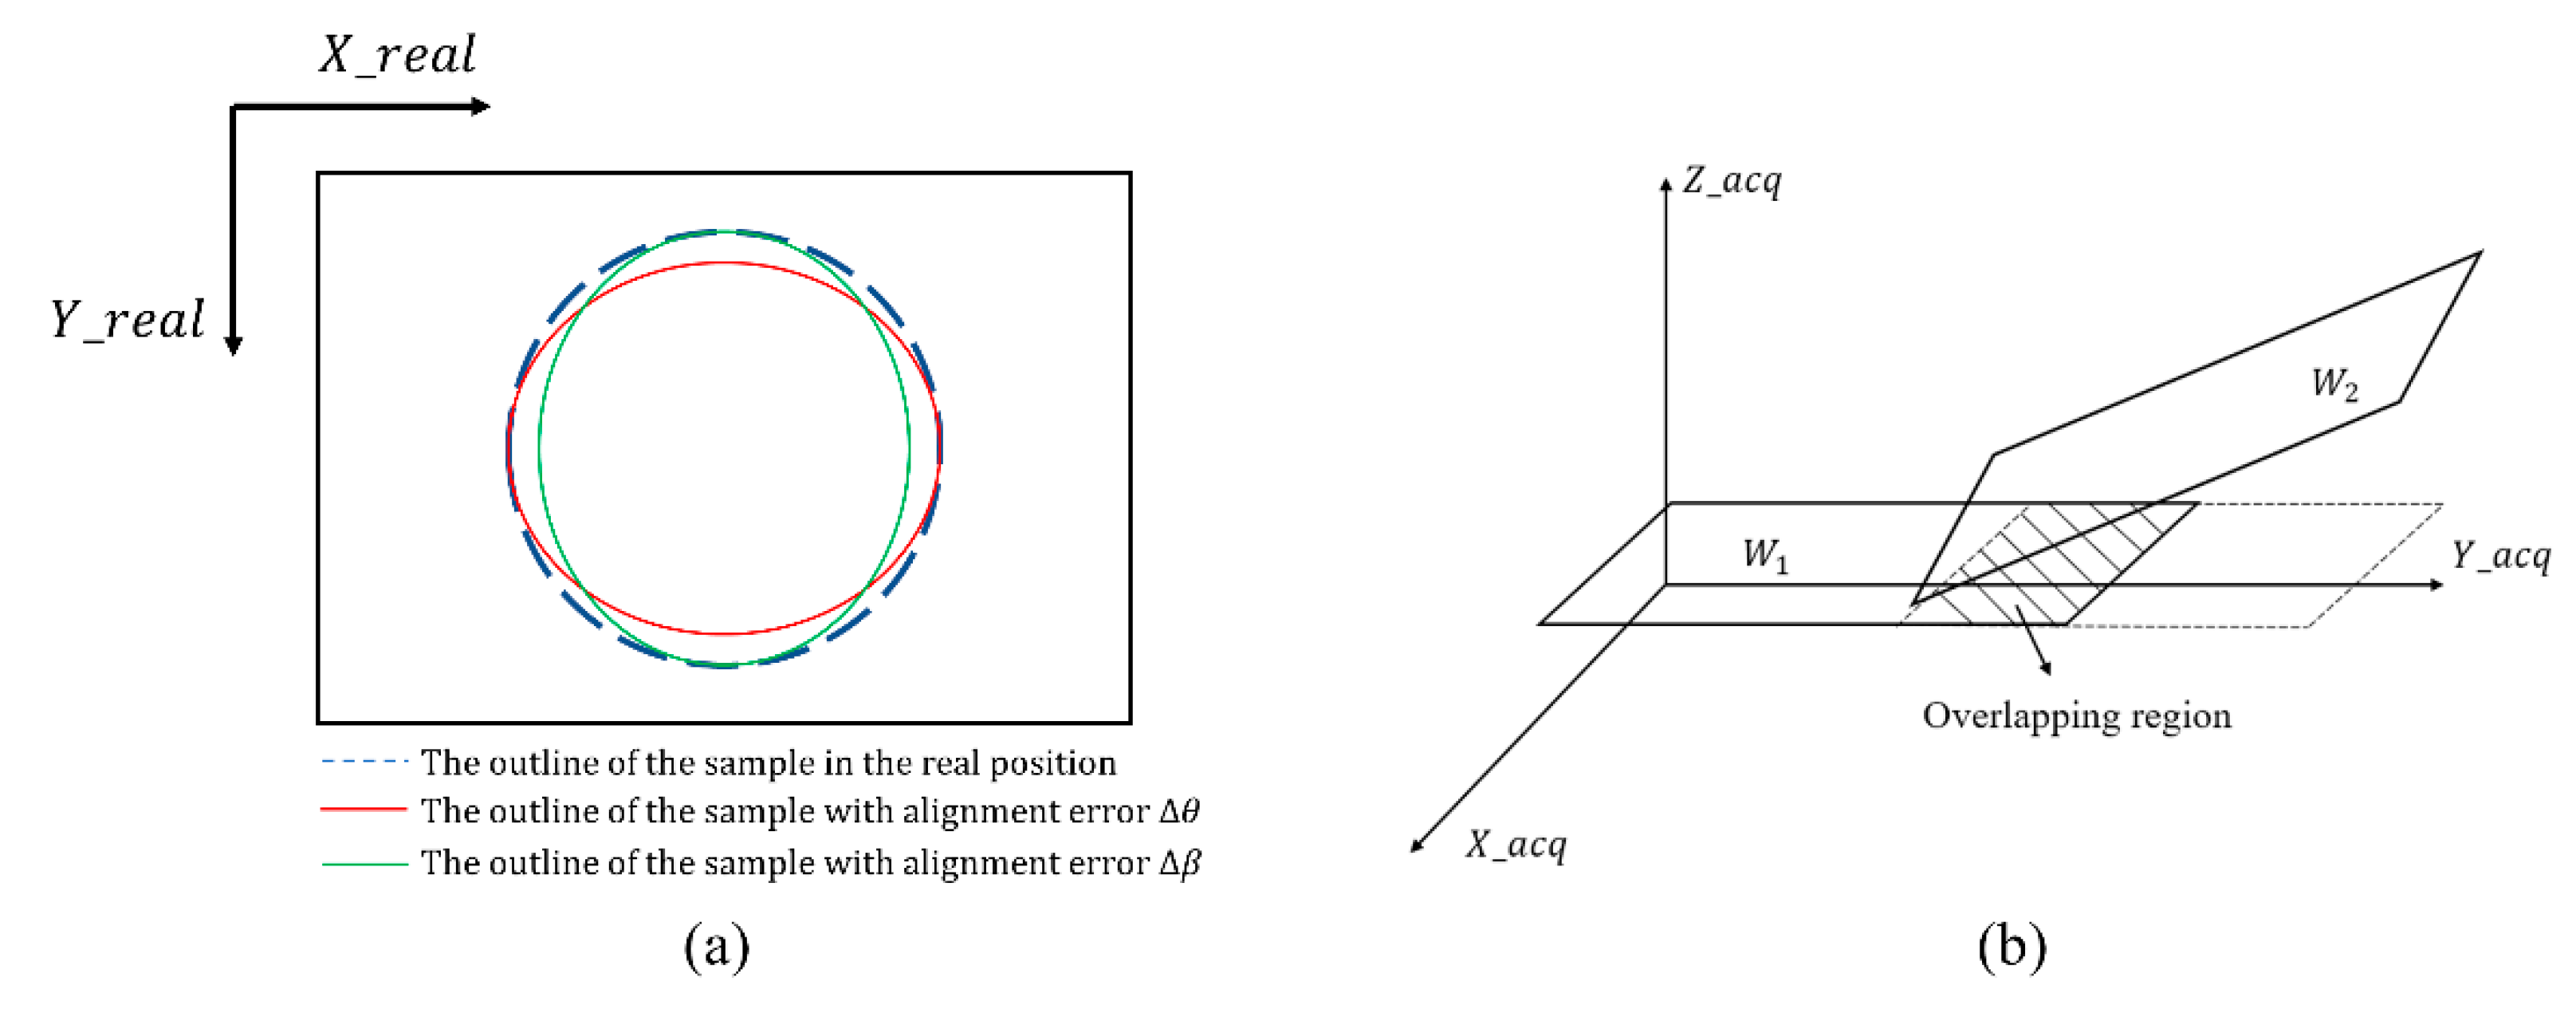
2.2.2. Multi-Angle Stitching Process

Furthermore, the following three steps which need to be completed to recover the surface shape of the large gradient micro-structure accurately. First, the acquired multiple object waves carry different rotation angles, so the coordinate system of these object waves must be unified by employing the diffraction calculation between tilted planes [16,17]. As is shown in Figure 4, the sample plane X2 which share the origin with the imaging plane X1 was tilted with respect to the imaging plane with the angle of β around the R_Y axis, and CCD can only capture the object wave in the imaging plane. The angular spectrum A ( f x 1 , f y 1 ) of wave distribution on the imaging plane is calculated by FFT:
A ( f x 1 , f y 1 ) = F F T { U ( x 1 , y 1 ) }
where U ( x 1 , y 1 ) the wave is distribution of the imaging plane. The spatial frequencies of sample plane ( f x 1 , f y 1 , f z 1 ) and imaging plane ( f x 2 , f y 2 , f z 2 ) satisfy the relation:
( f x 1 , f y 1 , f z 1 ) = ( cos β 0 sin β 0 1 0 sin β 0 cos β ) 1 ( f x 2 , f y 2 , f z 2 )
However, in the process of transformation, the origin of the imaging Fourier coordinates is shifted to ( sin β λ , 0 ) , so it is necessary to cancel the offset by shifting angular spectrum reversely. The reconstructed wave field U ( x 2 , y 2 ) on the sample plane can be calculated by inverse FFT as follows:
U ( x 2 , y 2 ) = I F F T [ A ( f x 2 sin β λ , f y 2 ) ] = I F F T [ A ( f x 2 , f y 2 ) ] exp [ i 2 π ( sin β λ ) x 2 ]
so, the phase maps of multi-angle holograms can be gained by φ = arg [ U ( x 2 , y 2 ) ] .
The second step was topography reconstruction algorithm with high accuracy. Generally, the unwrapped sample phase is converted to surface feature of sample by using thin element approximation method (TEA), but it cannot accurately recover the topography of large gradient micro-structure. Therefore, the tilted local ray approximation algorithm (TLRA) was developed for the topography reconstruction of the micro-structure of large gradient in inclined plane wave illumination [18].
The algorithm was derived from the analysis of relation of local ray’s optical path difference with the unwrapped sample phase. The principle of the TLRA algorithm for transmission configuration is shown in Figure 5 and the sample of height can be computed using the formula as follows:
h T L ( x + x s ) = φ ( x ) ( n k o x ( x ) k i x k 0 2 k o z ( x ) + k i z ) 1
x s = h T L ( x 2 ) k o x k o z = φ ( x ) ( n k i x k 0 2 k o x + n k i x k o z k o x ) 1
where φ is the unwrapped phase of specimen, x s = x 2 x is a transverse shift of imaging ray, n represent the refractive index of specimen material, k 0 is the wave number and k i and k o are the wave vectors of illumination and refracted ray, respectively:
k i = [ k i x , k i z ] = [ n k 0 sin a 1 , n k 0 cos a 1 ]
k o = [ k o x , k o z ] = [ φ ( x ) + k i x , ( k o 2 ( φ ( x ) k i x ) 2 ) 1 / 2 ]
The last step was stitching the algorithm based on overlapped region. We have got multiple sub-surfaces of sample at different angles of tilt through the above diffraction calculation and topography reconstruction algorithm. However, due to the existence of mechanical motion, it was impossible to assure precise position and pose parameters of the tested sample. As shown in Figure 6a, the alignment tolerance Δ θ , Δ β of two rotary axes R_X, R_Y is introduced, respectively, because of the addition of rotation angle of sample. So, the coordinate of the acquired sub-surfaces and the coordinate of the real sub-surfaces have the following relationship:
[ x r e a l y r e a l z r e a l ] = [ 1 0 0 0 cos Δ θ sin Δ θ 0 sin Δ θ cos Δ θ ] [ cos Δ β 0 sin Δ β 0 1 0 sin Δ β 0 cos Δ β ] [ x a c q y a c q z a c q ]
In the above formula, the alignment Δ θ , Δ β can be controlled within 10 , so sin Δ θ sin Δ β 0 , sin Δ θ Δ θ , sin Δ β Δ β , cos Δ θ 1 and cos Δ β 1 . After the proper simplification, this equation can be expressed as:
x r e a l = x a c q Δ β z a c q ( x a c q , y a c q ) y r e a l = y a c q + Δ θ z a c q ( x a c q , y a c q ) z r e a l ( x r e a l , y r e a l ) = Δ β x a c q Δ θ y a c q + z a c q ( x a c q , y a c q )
We can derive another expression of z r e a l ( x r e a l , y r e a l ) according to the first order Taylor formula, namely:
z r e a l ( x r e a l , y r e a l ) z r e a l ( x a c q , y a c q ) Δ β z a c q ( x a c q , y a c q ) z r e a l ( x a c q , y a c q ) x + Δ θ z a c q ( x a c q , y a c q ) z r e a l ( x a c q , y a c q ) y
Equation (11) is introduced into Equation (12), and the second order infinitely small quantity is ignored, and z r e a l ( x a c q , y a c q ) x can be approximated to z acq ( x a c q , y a c q ) x :
z r e a l ( x a c q , y a c q ) z a c q ( x a c q , y a c q ) + Δ β [ x a c q + z a c q ( x a c q , y a c q ) z a c q ( x a c q , y a c q ) x ] Δ θ [ y a c q + z a c q ( x a c q , y a c q ) z a c q ( x a c q , y a c q ) y ]
For simplifying the above equation, the details of z terms in parentheses is omitted, and the compensation factors of each sub-surfaces are expressed to f 1 _ i ( x a c q , y a c q ) , f 2 _ i ( x a c q , y a c q ) , i = 1…m, m is the number of sub-surfaces, namely:
z r e a l _ i z a c q _ i + Δ β i f 1 _ i ( x a c q , y a c q ) + Δ θ i f 2 _ i ( x a c q , y a c q )
In order to calculate the parameter Δ θ , Δ β of misalignment, the discrete data stitching algorithm based on overlapped regions is used between adjacent sub-surfaces and stitching the surface shapes together. As shown in Figure 6b, two adjacent sub-surfaces W 1 and W 2 , which have relative alignment error, are placed in the global coordinate ( x a c q , y a c q , z a c q ) . Therefore, the next equation can be established through adding the compensation terms:
z a c q _ 1 + Δ θ 1 f 1 _ 1 ( x a c q , y a c q ) + Δ β 1 f 2 _ 1 ( x a c q , y a c q ) z a c q _ 2 + Δ θ 2 f 1 _ 2 ( x a c q , y a c q ) + Δ β 2 f 2 _ 2 ( x a c q , y a c q )
Then, the least squared fitting is implemented by putting the data of overlapped area into the above equation:
k = 1 N { [ z a c q _ 1 + Δ θ 1 f 1 _ 1 ( x a c q _ k , y a c q _ k ) + Δ β 1 f 2 _ 1 ( x a c q _ k , y a c q _ k ) ] [ z a c q _ 2 + Δ θ 2 f 1 _ 2 ( x a c q _ k , y a c q _ k ) ( x a c q _ k , y a c q _ k ) + Δ β 2 f 2 _ 2 ( x a c q _ k , y a c q _ k ) ] } 2 min
where ( x a c q _ k , y a c q _ k ) is a sampling point of overlapped region, N is number of sampling points in the overlapped region. When more sub-surfaces need to be stitched, the fitting method can be generalized to minimize the deviation of all sub-surfaces, namely:
i = 1 m 1 j = 1 m 1 j i k ij = 1 N i j { [ z a c q _ i + Δ θ i f 1 _ i ( x a c q _ k i j , y a c q _ k i j ) + Δ β i f 2 _ i ( x a c q _ k i j , y a c q _ k i j ) [ z a c q _ j + + Δ θ j f 1 _ j ( x a c q _ k i j , y a c q _ k i j ) + Δ β j f 2 _ j ( x a c q _ k i j , y a c q _ k i j ) ] } 2 min
where m represent the number of sub-surfaces, ( x a c q _ k i j , y a c q _ k i j ) and N i j , respectively, is a sampling point and number of sampling points of overlapped region between the sub-surface W i and its adjacent sub-surface W j . The parameter Δ θ , Δ β of misalignment can be calculated by making the partial derivative of the above formula to 0:
E Δ θ i = 0 , E Δ β i = 0
After introducing the parameter Δ θ , Δ β into Equation (10), the real sub-surfaces z r e a l _ i without the alignment errors is obtained, and the fully surface of sample is recovered accurately by stitching this sub-surfaces with point-to-point.

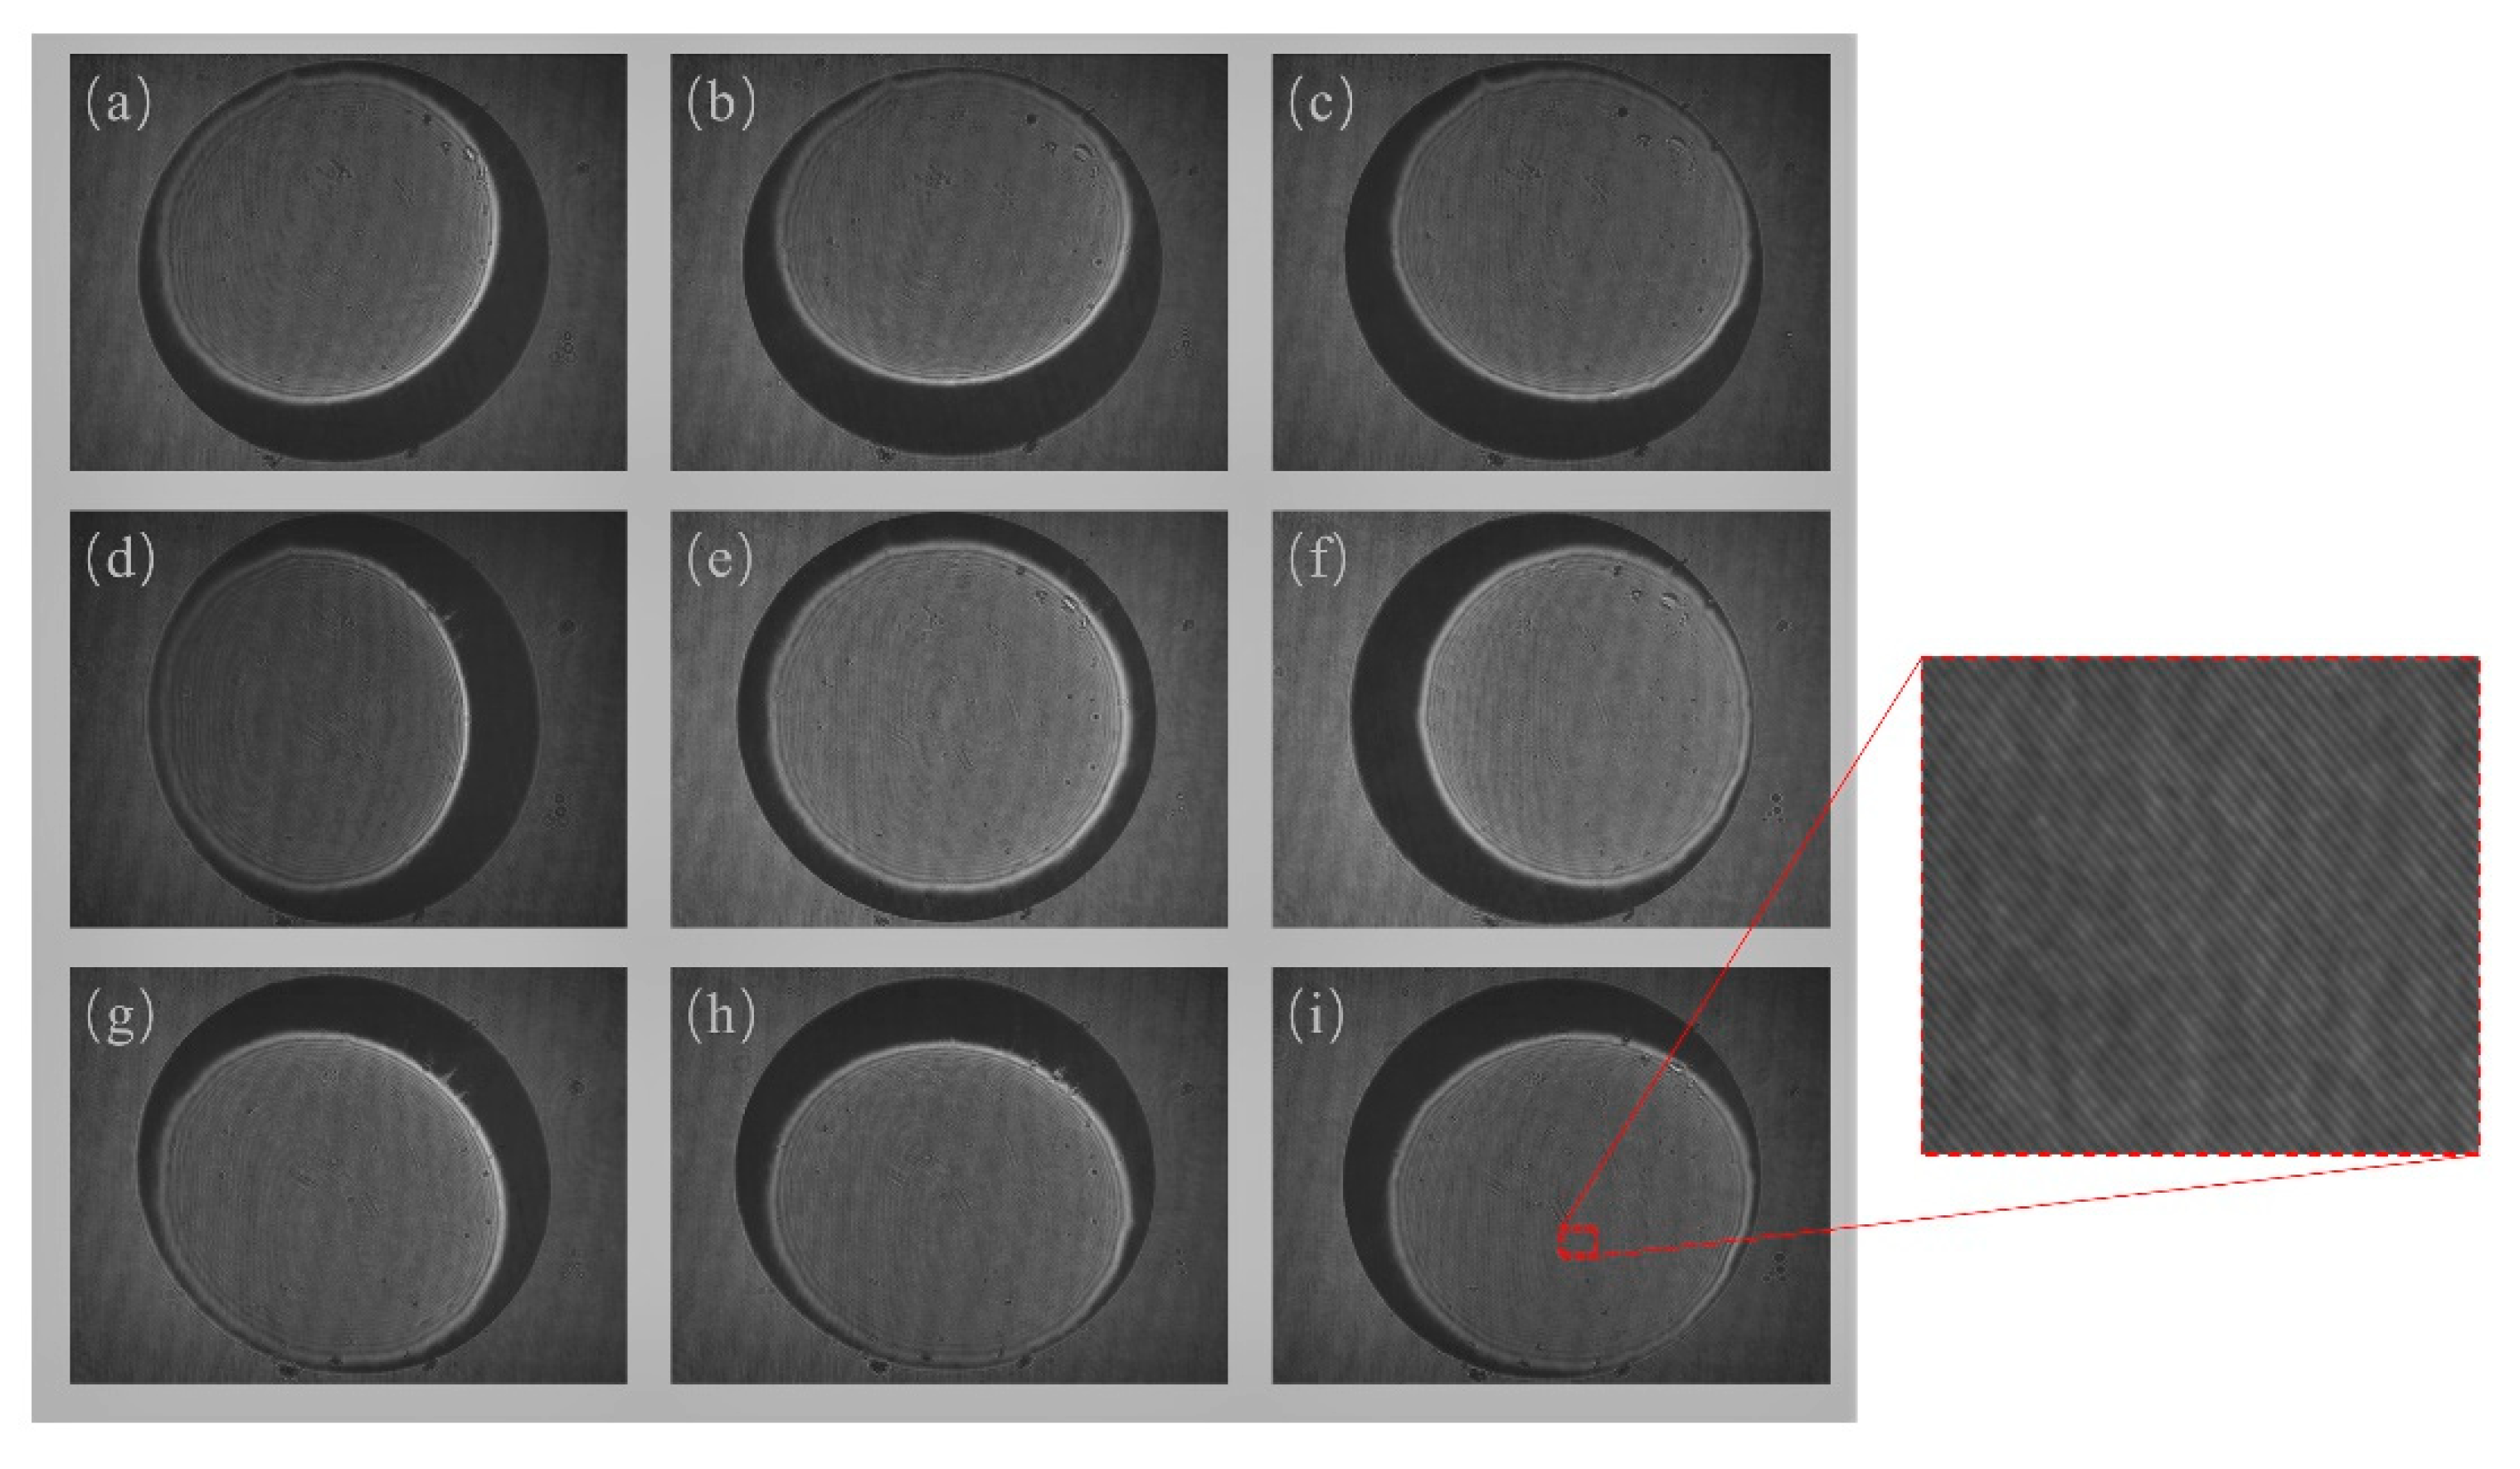
3. Experimental Results

To demonstrate the validity of the proposed method, we utilized the multi-angle stitching DHM system presented in Figure 1 to measure a large gradient convex microlens fabricated from fused silica with refractive index 1.458. The absolute height of the microlens measured by stylus profiler is 76.5 µm and the largest oblique angle of profile is 24.52°, as shown in Figure 7.
Before the measurement, the angle parameters of four degrees of freedom stage for measuring the whole sample are unknow quantities, so we need to adjust arbitrarily the angle of rotary axes (R_X, R_Y) and observe the variation of the bright region of hologram. In this process, we can find several holograms whose bright areas overlap each other, and the combination of these areas can cover the whole topography of microlens, while rotation angles corresponding to these holograms as the actual angle parameters are recorded. As shown in Figure 8, nine holograms are captured by controlling the four degrees of freedom stage that offers nine different rotation angles to microlens. It is assumed that θ , β represent the rotation angles around R_X and R_Y axis, respectively. For the conventional DHM system, only Figure 8e, have a black ring region without fringes in which the corresponding topography information is lost due to the limitation of MO, can be collected. With our method, the remaining hologram (Figure 8a–d,f–i) which contain the information of black ring area are captured by our system, a larger gradient micro-structure can be characterized by adding bigger rotation angle to the sample. To show the effect of the diffraction calculation between tilted planes proposed in Section 2.2.2, the difference between the unprocessed object wave ( θ = 20°, β = 0°) and the processed object wave by the algorithm is illustrated as shown in Figure 9. The acquired image from CCD in Figure 8a have an elliptical outline because of the rotation of microlens around R_X axis. After using the algorithm, the outline of the image is restored to a circle as is shown in Figure 9c. The significant correction effect is also reflected in the phase images (Figure 9b,d).
In addition to Figure 8e, the rest image is corrected by the diffraction calculation for correcting object waves and nine sub-surfaces is reconstructed by using the TLRA algorithm. After that, the sub-surface corresponding to Figure 8e is selected for reference sub-surface whose position is fixed, the coordinate of remaining eight sub-surface is adjusted according to the parameter of overlapping area between other sub-surface and reference sub-surface. The complete surface shape which fuses all topography information of nine holograms in Figure 8 is shown in Figure 10b, Figure 10a denote the topography recorded from the conventional DHM system with restricted NA. For comparison, Figure 10c illustrates the horizontal profile along the red line in Figure 10a,b at the same time. In theory, the MO (NA = 0.3) in our experiment have the ability of a collection beam whose largest angle of inclination is 17.5° according to the formula: N A = n sin θ M A X . Nevertheless, we successfully gather the slope of the 24.48° in multi-angle stitching process, which is in good agreement with the stylus profiler result. The error is mainly due to the random noise of optical element, the irregularity of micro-structure itself and the residual alignment error.
Although the measurement capability of our multi-angle stitching DHM has been demonstrated by the above experimental result, the precision of system is restricted by the freedom stage with manual operation. If a more advanced motion stage can be used in the measurement system, this system can be further enhanced. What is more, the acquisition speed of system can be further improved by some spatial multiplexing method [19,20] which can achieve holograms efficiently.

4. Conclusions

In this paper, a novel measurement method of large gradient micro-structure based on multi-angle stitching DHM system is proposed. The technique utilizes a four degrees of freedom stage to provide multiple rotation angle for measured sample, and the acquired image is used for reconstructing a complete topography through steps presented in Section 2.2. It is important that the alignment error from the rotation is suppressed by the stitching algorithm for assuring the measurement accuracy. The experiment in transmission configuration which recovers the fully surface shape of large gradient microlens and compare the reconstructed topography with measured data from the stylus profiler, demonstrates the feasibility and high-accuracy of this method. Multi-angle stitching DHM extends the measurable gradient range of DHM. Meanwhile, this method provides a strong versatility, low-cost and convenience measurement solution for large gradient micro-structure.

Author Contributions

C.J. developed the algorithm; C.J. and Y.H. conceived and designed the experiments; Y.T. and L.Z. performed the experiments; C.J., Z.X. and Y.H. analyzed the data and wrote the paper, S.H. applied for the funding and managed the project. All authors have read and agreed to the published version of the manuscript.

Funding

This work is supported by the National Natural Science Foundation of China (61705232, 61675206, 61875201, 61975211); Sichuan Science and Technology Program (18ZDZX0164, 2020JDJQ0005).

Conflicts of Interest

The authors declare no conflict of interest.

References

  1. Steiner, H.; Hortschitz, W.; Kainz, A.; Stifter, M.; Jachimowicz, A.; Schalko, J.; Keplinger, F.; Kohl, F. MOEMS transducer with a non-linear transfer characteristic for static displacement measurement applications on the example of an inclination sensor. Sens. Actuators A Phys. 2017, 263, 727–732. [Google Scholar] [CrossRef]
  2. Chourasia, R.K.; Prasad, S.; Singh, V. A novel Bragg fiber waveguide based narrow band inline optical filter. Optik 2018, 169, 269–276. [Google Scholar] [CrossRef]
  3. Carter, S.G.; Birkedal, V.; Wang, C.S.; Coldren, L.A.; Maslov, A.V.; Citrin, D.S.; Sherwin, M.S. Quantum Coherence in an Optical Modulator. Science 2005, 310, 4. [Google Scholar] [CrossRef] [PubMed] [Green Version]
  4. Haffner, C.; Heni, W.; Fedoryshyn, Y.; Niegemann, J.; Melikyan, A.; Elder, D.L.; Baeuerle, B.; Salamin, Y.; Josten, A.; Koch, U.; et al. All-plasmonic Mach–Zehnder modulator enabling optical high-speed communication at the microscale. Nat. Photon 2015, 9, 525–528. [Google Scholar] [CrossRef]
  5. Li, K.; Yöntem, A.Ö.; Deng, Y.; Shrestha, P.; Chu, D.; Zhou, J.; Yao, J. Full resolution auto-stereoscopic mobile display based on large scale uniform switchable liquid crystal micro-lens array. Opt. Express 2017, 25, 9654. [Google Scholar] [CrossRef] [PubMed]
  6. Takahashi, H.; Kureyama, N.; Chikayama, M.; Yamada, K. Flatbed-Type Three-Dimensional Display System as a Tool for Cooperation Working. In Proceedings of the 2008 3rd International Conference on Innovative Computing Information and Control, Dalian, China, 18–20 June 2008; p. 57. [Google Scholar]
  7. Seymour, J.P.; Wu, F.; Wise, K.D.; Yoon, E. State-of-the-art MEMS and microsystem tools for brain research. Microsyst. Nanoeng. 2017, 3, 16066. [Google Scholar] [CrossRef] [PubMed]
  8. Sheikhaleh, A.; Jafari, K.; Abedi, K. Design and Analysis of a Novel MOEMS Gyroscope Using an Electrostatic Comb-Drive Actuator and an Optical Sensing System. IEEE Sens. J. 2019, 19, 144–150. [Google Scholar] [CrossRef]
  9. Charrière, F.; Kühn, J.; Colomb, T.; Montfort, F.; Cuche, E.; Emery, Y.; Weible, K.; Marquet, P.; Depeursinge, C. Characterization of microlenses by digital holographic microscopy. Appl. Opt. 2006, 45, 829. [Google Scholar] [CrossRef] [PubMed] [Green Version]
  10. Kemper, B.; Bauwens, A.; Vollmer, A.; Ketelhut, S.; Langehanenberg, P. Label-free quantitative cell division monitoring of endothelial cells by digital holographic microscopy. J. Biomed. Opt. 2010, 15, 6. [Google Scholar] [CrossRef] [PubMed] [Green Version]
  11. Liżewski, K.; Kozacki, T.; Kostencka, J. Digital holographic microscope for measurement of high gradient deep topography object based on superresolution concept. Opt. Lett. 2013, 38, 1878. [Google Scholar] [CrossRef] [PubMed]
  12. Józwik, M.; Kozacki, T.; Liżewski, K.; Kostencka, J. Digital holography with multidirectional illumination by LCoS SLM for topography measurement of high gradient reflective microstructures. Appl. Opt. 2015, 54, 2283. [Google Scholar] [CrossRef] [PubMed]
  13. Kozacki, T.; Liżewski, K.; Kostencka, J. Absolute shape measurement of high NA focusing microobjects in digital holographic microscope with arbitrary spherical wave illumination. Opt. Express 2014, 22, 16991. [Google Scholar] [CrossRef] [PubMed]
  14. Kim, M.K. Principles and techniques of digital holographic microscopy. SPIE Rev. 2010, 018005. [Google Scholar] [CrossRef] [Green Version]
  15. Colomb, T.; Kühn, J.; Charrière, F.; Depeursinge, C.; Marquet, P.; Aspert, N. Total aberrations compensation in digital holographic microscopy with a reference conjugated hologram. Opt. Express 2006, 14, 4300. [Google Scholar] [CrossRef] [PubMed]
  16. Matsushima, K. Formulation of the rotational transformation of wave fields and their application to digital holography. Appl. Opt. 2008, 47, D110. [Google Scholar] [CrossRef] [PubMed] [Green Version]
  17. De Nicola, S.; Finizio, A.; Pierattini, G.; Ferraro, P.; Alfieri, D. Angular spectrum method with correction of anamorphism for numerical reconstruction of digital holograms on tilted planes. Opt. Express 2005, 13, 9935. [Google Scholar] [CrossRef] [PubMed]
  18. Kozacki, T.; Liżewski, K.; Kostencka, J. Holographic method for topography measurement of highly tilted and high numerical aperture micro structures. Opt. Laser Technol. 2013, 49, 38–46. [Google Scholar] [CrossRef]
  19. Kühn, J.; Colomb, T.; Montfort, F.; Charrière, F.; Emery, Y.; Cuche, E.; Marquet, P.; Depeursinge, C. Real-time dual-wavelength digital holographic microscopy with a single hologram acquisition. Opt. Express 2007, 15, 7231. [Google Scholar] [CrossRef] [PubMed]
  20. Lee, B.; Jang, C.; Kim, D.; Lee, B. Single Grating Reflective Digital Holography with Double Field of View. IEEE Trans. Ind. Inf. 2019, 15, 6155–6161. [Google Scholar] [CrossRef]
Figure 1. Schematic of the digital holography microscopy (DHM) system setup in transmission configuration with four degree of freedom stage.
Applsci 10 06110 g001
Figure 2. Schematic diagram of beam collection at multiple rotation angle. (a) the rotation angle is 0° around the R_X -axis, 0° around the R_Y-axis. (b) the rotation angle is 15° around the R_X-axis, 0° around the R_Y-axis. (c) the rotation angle is −15° around the R_X-axis, 0° around the R_Y-axis.
Applsci 10 06110 g002
Figure 3. The algorithm flow chart of the data processing.
Applsci 10 06110 g003
Figure 4. Schematic of the algorithm for diffraction calculation.
Applsci 10 06110 g004
Figure 5. Illustration of tilted local ray approximation algorithm (TLRA) algorithm for DHM system in transmission.
Applsci 10 06110 g005
Figure 6. (a) the profile of sample with alignment errors and without alignment errors. (b) illustration of the discrete data stitching algorithm based on overlapped region between the tilted planes.
Applsci 10 06110 g006
Figure 7. The outline of the sample measured by stylus profiler.
Applsci 10 06110 g007
Figure 8. Holograms of microlens with nine different rotation angles. (a) θ = 10°, β = 10°. (b) θ = 0°, β = 20°, (c) θ = −10°, β = 10°, (d) θ = 20°, β = 0°, (e) θ = 0°, β = 0°, (f) θ = −20°, β = 0°, (g) θ = 10°, β = −10°, (h) θ = 0°, β = −20°, (i) θ = −10°, β = −10°.
Applsci 10 06110 g008
Figure 9. Between the direct-collected wave front ( θ = 20°, β = 0°) and the wave front after employing the diffraction calculation (a) amplitude image of unprocessed wave front. (b) phase image of unprocessed wave front. (c) amplitude image of processed wave front by algorithm. (d) phase image of processed wave front by algorithm.
Applsci 10 06110 g009
Figure 10. Recovered large gradient convex microlens (a) 3D topography for the conventional DHM system. (b) 3D topography for the multi-angle stitching DHM system. (c) Profile along the red line of topography before stitching and after stitching.
Applsci 10 06110 g010

