Article

Compositional Modeling to Analyze the Effect of CH4 on Coupled Carbon Storage and Enhanced Oil Recovery Process

1
Severe Storm Research Center, Ewha Womans University, 52 Ewhayeodae-gil, Seodaemun-gu, Seoul 03760, Korea
2
Department of Climate and Energy Systems Engineering, Ewha Womans University, 52 Ewhayeodae-gil, Seodaemun-gu, Seoul 03760, Korea
3
Department of Earth Resources and Environmental Engineering, Hanyang University, 222 Wangsimni-ro, Seongdong-gu, Seoul 04763, Korea
*
Author to whom correspondence should be addressed.
Appl. Sci. 2020, 10(12), 4272; https://doi.org/10.3390/app10124272
Submission received: 5 June 2020 / Revised: 16 June 2020 / Accepted: 19 June 2020 / Published: 22 June 2020
(This article belongs to the Special Issue Advanced Oil Recovery Technologies)

Abstract

:
The present study is aimed at the development of compositional simulation models of the co-injection of CO2 and CH4 during the water-alternating-gas (WAG) process in order to assess the efficiency of carbon capture and storage in combination with enhanced oil recovery (CCS-EOR). The co-injection of CO2 and CH4 occupies more reservoir pore volume and causes higher reservoir pressure than CO2 WAG, thus leading to an enhanced early EOR performance. However, the overall EOR performance of the co-injection method becomes lower than that of CO2 WAG due to the reduced miscibility and sweep efficiency upon further CH4 addition. The decrease in gas displacement and sweep efficiency weaken the hysteresis effects upon the residual trapping mechanism. However, the solubility trapping mechanism takes effect because the co-injection generates higher average reservoir pressure than does the CO2 WAG. The index of global warming potential (GWP) in a mole unit is employed to quantify the carbon storage effects of CO2 and co-injection WAG cases. According to the index, 1 mole of CH4 sequestration has the same effects as that of 10 moles of CO2 for global warming mitigation. In conclusion, the carbon storage effects are enhanced as CH4 concentration in the WAG increases.

1. Introduction

Carbon capture and storage (CCS) has become well-known as a technology for reducing the emission of greenhouse gases from fossil fuels during power generation and industrial processes [1]. Projects involving the injection of carbon dioxide (CO2) for enhanced oil recovery (EOR) have been operating worldwide since the early 1970s [2] and EOR is expected to be a major driver for CCS by providing an additional revenue stream. Hence, combining the CO2-EOR and CCS into a coupled CCS-EOR approach provides a synergistic effect towards business and environmental protection by offering commercial opportunities to oilfield operators. Consequently, almost 80 million tons (Mt) of CO2 are already being used for CCS-EOR each year [3,4].
Methane (CH4) is generated as a by-product of oil extraction during primary and secondary oil production and EOR. As CH4 is a potent greenhouse gas (GHG), the operator often chooses to flare this by-product instead of releasing it directly to the atmosphere if there is little commercial opportunity or sufficient regulatory incentive to bring it to market [5]. Also, CH4 has been used as a re-injection gas for EOR [6,7]. Previous studies have examined the impacts of impurities in the CO2 stream upon the minimum miscibility pressure (MMP) to find that the presence of CH4 increases the MMP compared to that of CO2, thus negatively impacting upon EOR performance [8,9,10,11,12,13,14]. Moreover, since the global warming potential (GWP) of CH4 over 100 years is 28 times that of CO2 [15], it is worth considering the use of CH4 for CCS projects aimed at mitigating global warming and climate change. Although some studies on the geological storage of CO2 and CH4 in an aquifer have been conducted, there are insufficient studies examining the impact of CH4 on CCS-EOR [16,17,18,19]. Hence, it is necessary to store CH4 in reservoirs in order to mitigate gas flaring and release into the atmosphere by using a CCS-EOR approach that can consider energy security and climate change simultaneously. However, CH4 affects the miscibility as well as the hysteresis and solubility effects for residual and solubility trapping mechanisms and the ultimate EOR performance during CCS-EOR.
For this reason, compositional simulation models are developed in the present study in order to investigate the effects of CO2-CH4 co-injection upon the CCS-EOR mechanisms and performance. The multiple-mixing-cell method is applied to calculate the MMP of the injected gases (i.e., a mixture of CO2 and CH4) and the reservoir oil. Of the four main CO2 trapping mechanisms (namely: structural, residual, solubility, and mineral trapping), structural and mineral trapping are excluded from the scope of the present study due to their negligible effects upon CCS-EOR in a relatively short period [20]. Here, CO2 can be stored in the reservoir by hysteresis and dissolution in water during the water-alternating-gas (WAG) process, thus indicating residual and solubility trapping mechanisms. A three-phase hysteresis model and Henry’s law are applied for the residual trapping and solubility trapping, respectively.

2. Methodology

2.1. Calculation of Minimum Miscibility Pressure (MMP)

Carbon dioxide (CO2) is the most common type of gas used in gas injection and has been widely used in the EOR method for light oils. Injected CO2 acts as a solvent to reduce oil viscosity and expand oil volume in reservoirs. These phenomena occur more frequently under miscible conditions than they do under immiscible conditions [21]. As shown schematically in Figure 1, miscibility conditions during CO2-EOR can be achieved via multiple contact processes that make use of condensing and vaporizing gas drives. At the injected CO2 front, intermediate molecular weight hydrocarbons evaporate from the reservoir oil into the CO2, where they equilibrate with the CO2 to take part in the next contact with the reservoir oil in a phenomenon called the vaporizing gas drive or the forward multiple contact process. After each contact, however, the equilibrated reservoir oil behind the injected CO2 close to the injector is continuously mixed with fresh CO2 in a process called the condensing gas drive or the backward multiple contact process [22,23]. Due to the mass transfer of intermediate hydrocarbons between CO2 and oil, the composition and properties, such as the density and viscosity, of the reservoir oil and injected gases are changed. This, in turn, leads to a difference in the interfacial tension (IFT) between the equilibrated oil and gas at each location. As the reservoir approaches the miscible condition, the oil viscosity and IFT decrease, such that the IFT tends towards zero and the miscible condition is reached with a reservoir pressure higher than the MMP [24].
A variety of methods, such as the slim-tube, vanishing interfacial tension, and rising bubble technique, have been conventionally employed to estimate the MMP [25,26,27]. However, since these methods are time-consuming, expensive, and occasionally less accurate, it is often beneficial to implement computational methods for calculating the MMP. For this purpose, the multiple-mixing-cell method using the cubic equation of state (EOS) is one of the most prevalent methods [28]. In the present study, this method is applied according to the following steps:
  • The system temperature is defined and the starting pressure for the process is estimated.
  • A calculation is performed for the displacing gas and the displaced oil to obtain the new equilibrium compositions of liquid and vapor after the first contact.
  • Step 2 is repeated for each contact using the previous and new equilibrium compositions, injected gas, and reservoir oil to obtain the updated compositions until the lengths of all key tie-lines converge to a tolerance of 10−8.
  • The tie-line length is computed for the pressure and the minimum tie-line length (TL) is saved.
  • The pressure is increased and Steps 2–4 are repeated.
  • A multiple-parameter TL regression is performed to determine the exponent n , the slope m , and the constant b in the equation TL n = m p + b (power-law extrapolation), and the resulting function is plotted.
  • The MMP is determined when the power-law extrapolation gives zero to within the desired accuracy of 20 psia at the latest three pressures.

2.2. The Three-Phase Hysteresis Model for Residual Trapping

Although conventional two-phase hysteresis models assume the reversibility of permeability during the drainage process following the previous imbibition cycle, this assumption is invalid for three-phase fluid flow because the relative permeability of gas is lower when displacing a water-oil mixture than when displacing oil only [29]. The three-phase hysteresis model proposed by Larsen and Skauge [30] is adopted in the present study and has shown better matching to experimental data than the two-phase model [31,32].
The gas permeability during the drainage process is calculated using Equation (1):
k r g drain ( S g ,   S w I , S g start ) = [ k r g input ( S g ) k r g input ( S g start ) ] ( S w i S w I ) α + k r g imb ( S g start )
We clarify that a list of symbols is given in the Nomenclature.
The relative permeability of the gas with decreasing gas saturation (i.e., non-wetting phase in the imbibition process) is denoted by S g f and is estimated by Equations (2) and (3):
k r g imb ( S g ) = k r g drain ( S g f + S g end )
S g f = 1 2 { ( S g S g r ) + ( S g S g r ) 2 + 4 C ( S g S g r ) }
where the trapped gas saturation, S g r , and Land’s parameter [33], C , are estimated from Equations (4) and (5), respectively:
S g r = S g c + S g m S g c 1 + C ( S g m S g c )  
C = 1 S g r , max S g c 1 S g , max S g c  
S g r , max   is the maximum trapped gas saturation and can be approximated using an empirical correlation with the porosity, ϕ [34], in accordance with Equation (6):
S g r , max = 0.5473 0.9696 ϕ
To determine the relative permeability of the oil, the Stone’s first model modified by Aziz and Settari [35] is applied. The minimum residual oil saturation, designated S o m , is modified to reflect the effect of trapped gas on oil relative permeability, as shown in Equation (7):
S o m mod = S o m a ( S g S g f )
where S g and S g f are the total and free gas saturations respectively, and a is input parameter of 0.68 for mimicking a strongly water-wet condition [36].

2.3. Solubility Model

Carbon dioxide (CO2) is also trapped by the solubility trapping mechanism due to contact with water. The mole fraction of CO2 in each phase is determined from the thermodynamic equilibrium condition according to Equation (8):
f i , o = f i , g = f i , w   with   i = 1 , ,   n c
where f i , o , f i , g , and f i , w denote the fugacity of the i-th component in the oil, gas, and water phase, respectively.
f i , o and f i , g are calculated using Peng-Robinson EOS [37,38]. By contrast, f i , w is given by Henry’s law [39] in accordance with Equation (9):
f i , w = y i , w H i   with   i = 1 , ,   n c
where H i and y i , w are Henry’s constant and the mole fraction of the i-th component in the water phase, respectively. Henry’s constant is calculated using Equations (10) and (11) under isothermal conditions [40,41]:
ln H i = ln H i S + 1 R T p H 2 O s p v i ¯ d p
where R is the gas constant and T is the temperature in Kelvin. Then,
ln H i s = ln p H 2 O s D ( T r , H 2 O ) 1 + E ( 1 T r , H 2 O ) 0.355 ( T r , H 2 O ) 1 + F exp ( 1 T r , H 2 O ) ( T r , H 2 O ) 0.41
where D , E , and F are constants with values of −9.4234, 4.0087, and 10.3199, respectively, for CO2, and v i ¯ is the partial molar volume of the i-th component at infinite dilution (cm3·mol−1), which is computed using Equation (12) [42]:
v ¯ CO 2 = 47.75418 + 4.336154 × 10 1 T 5.945771 × 10 4 T 2
where T is the reservoir temperature in K.

3. Results

3.1. Fluid Modeling

Weyburn W3 fluid data [43,44] is used as the experimental data for fluid modeling in the present study. Since the Weyburn Field in Saskatchewan, Canada, reached the economic limit of waterflooding and became a target for CO2-EOR, extensive experiments have been conducted to investigate the interactions between oil and CO2 for CO2-EOR and CCS purposes [43,45].
The fluid composition of W3 experimental data and corresponding input EOS parameters used for fluid modeling are summarized in Table 1, while Table 2 presents the oil properties calculated via a regression method using the Peng-Robinson Equation of State (PR-EOS) and matched against the experimental data to increase the reliability of the compositional reservoir simulation [37,38]. The MMP is then estimated using the multiple-mixing-cell method [28]. An examination of the bottom row of Table 2 indicates that the MMP datum associated with CO2 in W3 fluid at a reservoir temperature of 63 ºC is 14,196 kPa (second column, Table 2), while the calculated value is 13,872 kPa (third column, Table 2), thus indicating a 2.3% error against the W3 data.
The MMPs calculated using the multiple-mixing-cell method with varying mole fraction ratios of CO2 to CH4 are presented in Table 3. Here, it can be seen that the MMP increases with increasing mole fraction of CH4 in the CO2 injection stream, thus indicating that CH4 reduces the displacement efficiency compared to that of pure CO2 injection, in agreement with previous experimental studies [13,14].

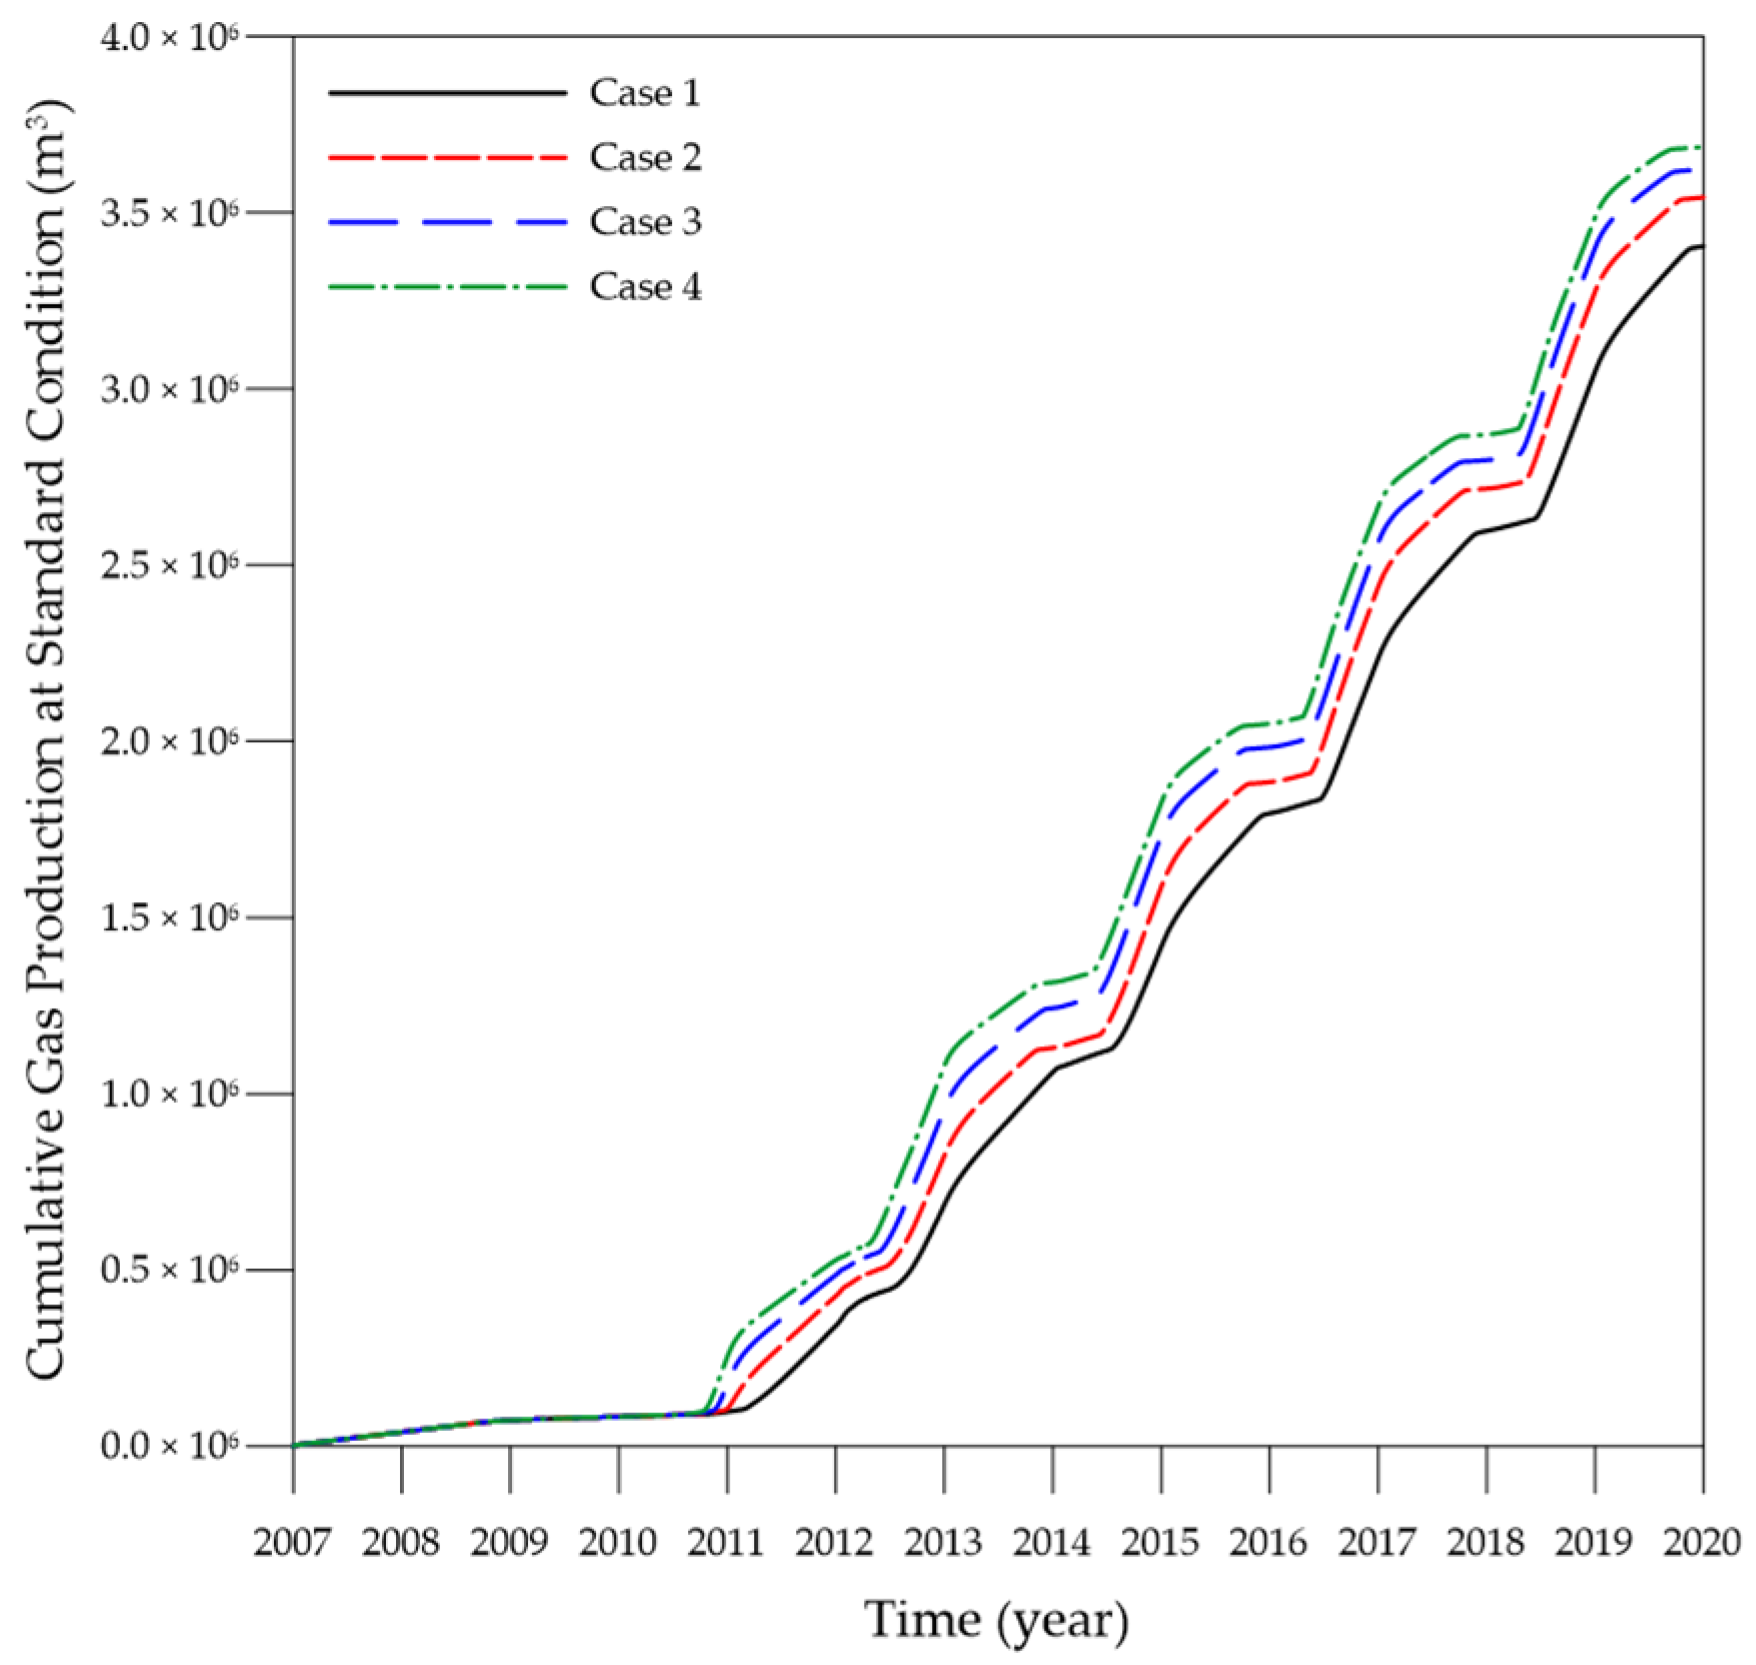
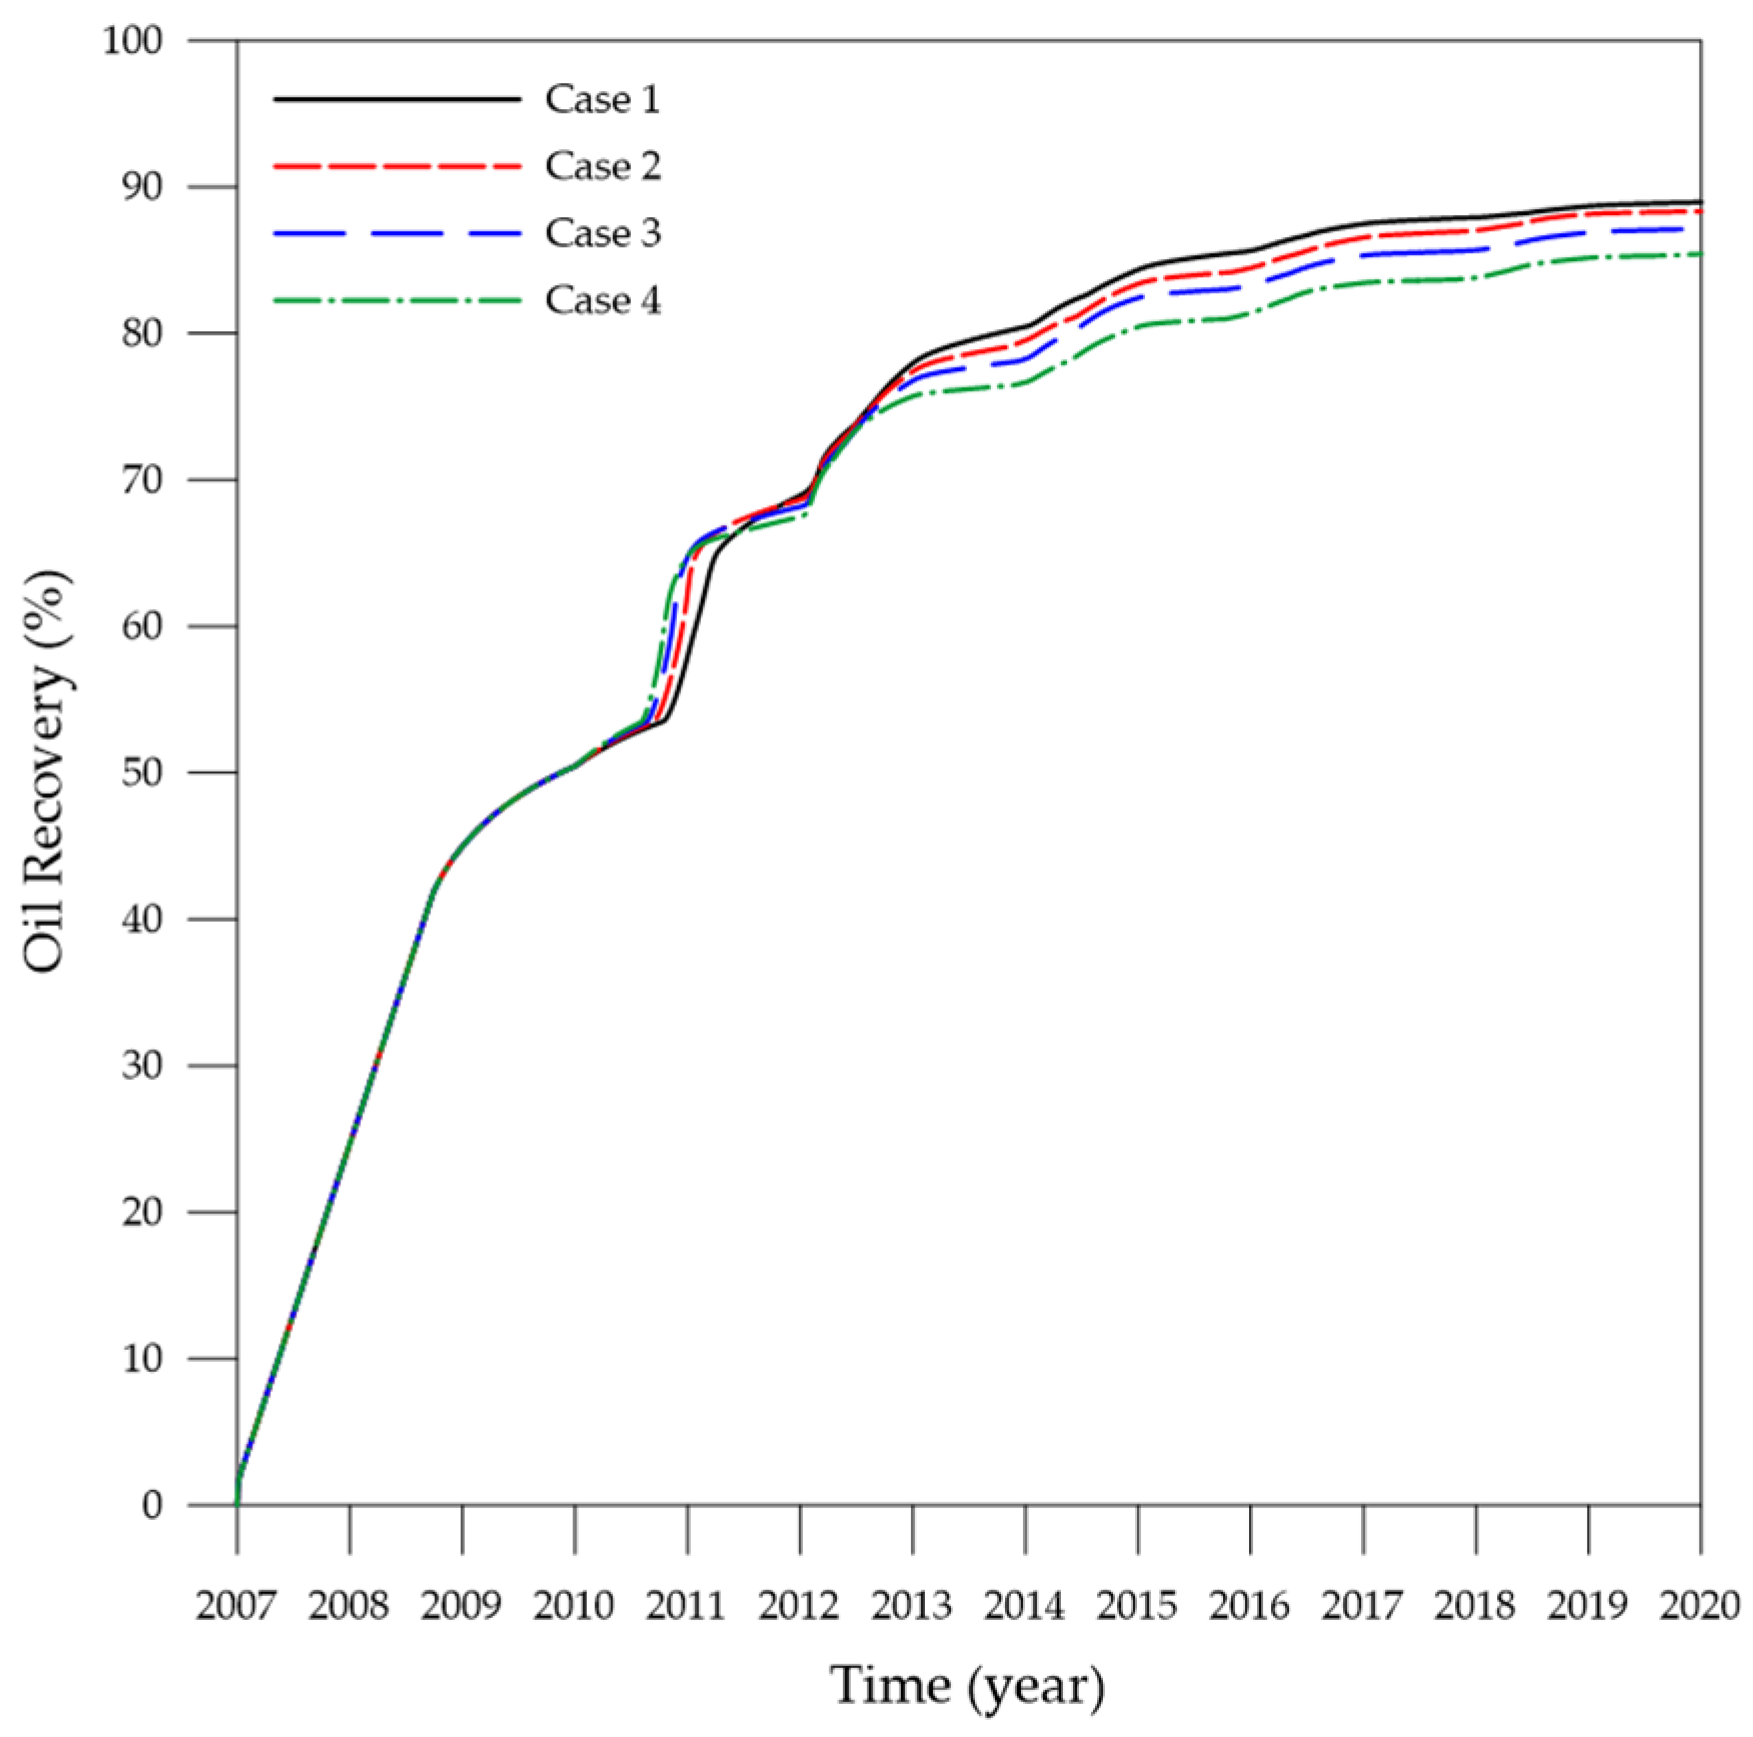
3.2. Effects of CH4 Injection on EOR Efficiency

A two-dimensional (2D) homogeneous model based on the work of Cho et al. [19] is designed to focus on investigating the miscibility and sweep efficiency without gravity override during WAG simulations. This reservoir model is discretized into 33 × 33 × 1 grid blocks of volume 3 × 3 × 3 m3 each. A quarter of a 10-acre five-spot well pattern (i.e., CO2 injector and oil producer) is set up for the reservoir model. Thus, the EOR and CCS performances are mainly governed by the displacement and sweep efficiencies. The total simulation period is 13 years (2007–2020), beginning with 3 years of waterflooding followed by 10 years of WAG, as shown schematically in Figure 2. The WAG consists of five cycles, in each of which water and gas are injected sequentially. Four WAG model simulation cases are analyzed, namely: 100% CO2 + 0% CH4 (Case 1), 90% CO2 + 10% CH4 (Case 2), 80% CO2 + 20% CH4 (Case 3), and 70% CO2 + 30% CH4 (Case 4). The gas injection rate for each case is a constant 2265 m3/day under surface conditions to determine the effects of CO2 and CH4 compressibility upon EOR performance while excluding the effect of any difference in injection rate. The initial conditions for the reservoir model are presented in Table 4. Thus, the producing bottom hole pressure is fixed at 13,789 kPa, while the initial reservoir pressure and temperature are computed on the basis of hydrostatic and geothermal gradients.
The decrease in displacement efficiency due to CO2-CH4 co-injection is described in terms of the IFT between the displacing and displaced fluids in the middle of the reservoir (grid block co-ordinates (17, 17, 1)) during the 13-year WAG in Figure 3. Due to the lower molecular weight of CH4 compared to CO2, the addition of CH4 makes the displacing fluid lighter and the IFT of the gas mixture higher compared to that of Case 1, as indicated in Figure 3a. In addition, the IFT after the multiple contact with the initial oil (2010–2011) is examined more closely in Figure 3b. Here, Case 1 gives the lowest IFT value of 0.08 mN/m between the CO2 and reservoir oil, while Cases 2, 3, and 4 give 225%, 588%, and 1000% higher values of 0.26, 0.55, and 0.88 mN/m, respectively.
Meanwhile, the decrease in displacement efficiency due to CO2-CH4 co-injection is described in terms of the 2D change in oil viscosity when 0.15 PV of gas is injected in Figure 4. The blue swept area in Figure 4a indicates that the injected fluids make maximum contact with the reservoir oil in Case 1, and that the minimum oil viscosity in this Case is 0.46 mPa·s. When 20% mole fraction of CH4 is added into the CO2 injection stream (Case 3), the deep blue region of Figure 4a changes to the light blue area of Figure 4b, indicating a 23.9% increase in the oil viscosity from 0.46 mPa·s to 0.57 mPa·s. The injected gas displaces the light and intermediate oil components from the initial oil, thereby increasing the oil viscosity after the multiple contact. For Case 1, the oil viscosity near the gas injector is zero because the oil is displaced by the high injection pressure and is miscible with the CO2. In addition, Figure 4 shows that the injection gas front in Case 3 is more convex than that in Case 1. This is because less gas is acting as a solvent to reduce the oil viscosity, while the fraction of injected gas that does not come into contact with the oil creates a gas channel that leads to early breakthrough of produced gas, as indicated in Figure 5.
The cumulative gas injection under the reservoir condition obtained from the four CO2-CH4 WAG cases is indicated in Figure 6. Note that although the gas injection rate at the surface is constant, the volume occupied by gas differs in each case because CH4 is less compressible than CO2; hence, the more CH4 is added, the higher the gas injection rate at the reservoir (Jin et al., 2017). In addition, the average gas saturation in each of the four cases for the ten-year WAG period is indicated in Figure 7. In the first WAG cycle (2010–2012), Case 1 displays the lowest average gas saturation, while Cases 2 to 4 indicate that the average gas saturation increases with increasing addition of CH4 to the gas stream as CH4 occupies more reservoir pore volume than does CO2. Interestingly, this trend is reversed in the subsequent WAG cycles due to the poor sweep efficiency resulting from the CH4 addition, so that the average gas saturation eventually becomes the lowest for Case 4 by the end of the final WAG cycle (2019). Meanwhile, the average reservoir pressure obtained from the four CO2-CH4 WAG cases is indicated in Figure 8, where the greater pore occupation by CH4 is seen to increase the average reservoir pressure due to the lower compressibility of CH4 relative to CO2. As a result, the co-injection of CO2-CH4 generates higher oil recovery than the pure CO2 WAG during the early stages of WAG (2010–2012), but reduces the overall oil recovery at the end of the WAG process, as indicated in Figure 9. This is because the effects of displacement and reduction in sweep efficiency become more dominant than that of compressibility as the WAG proceeds.

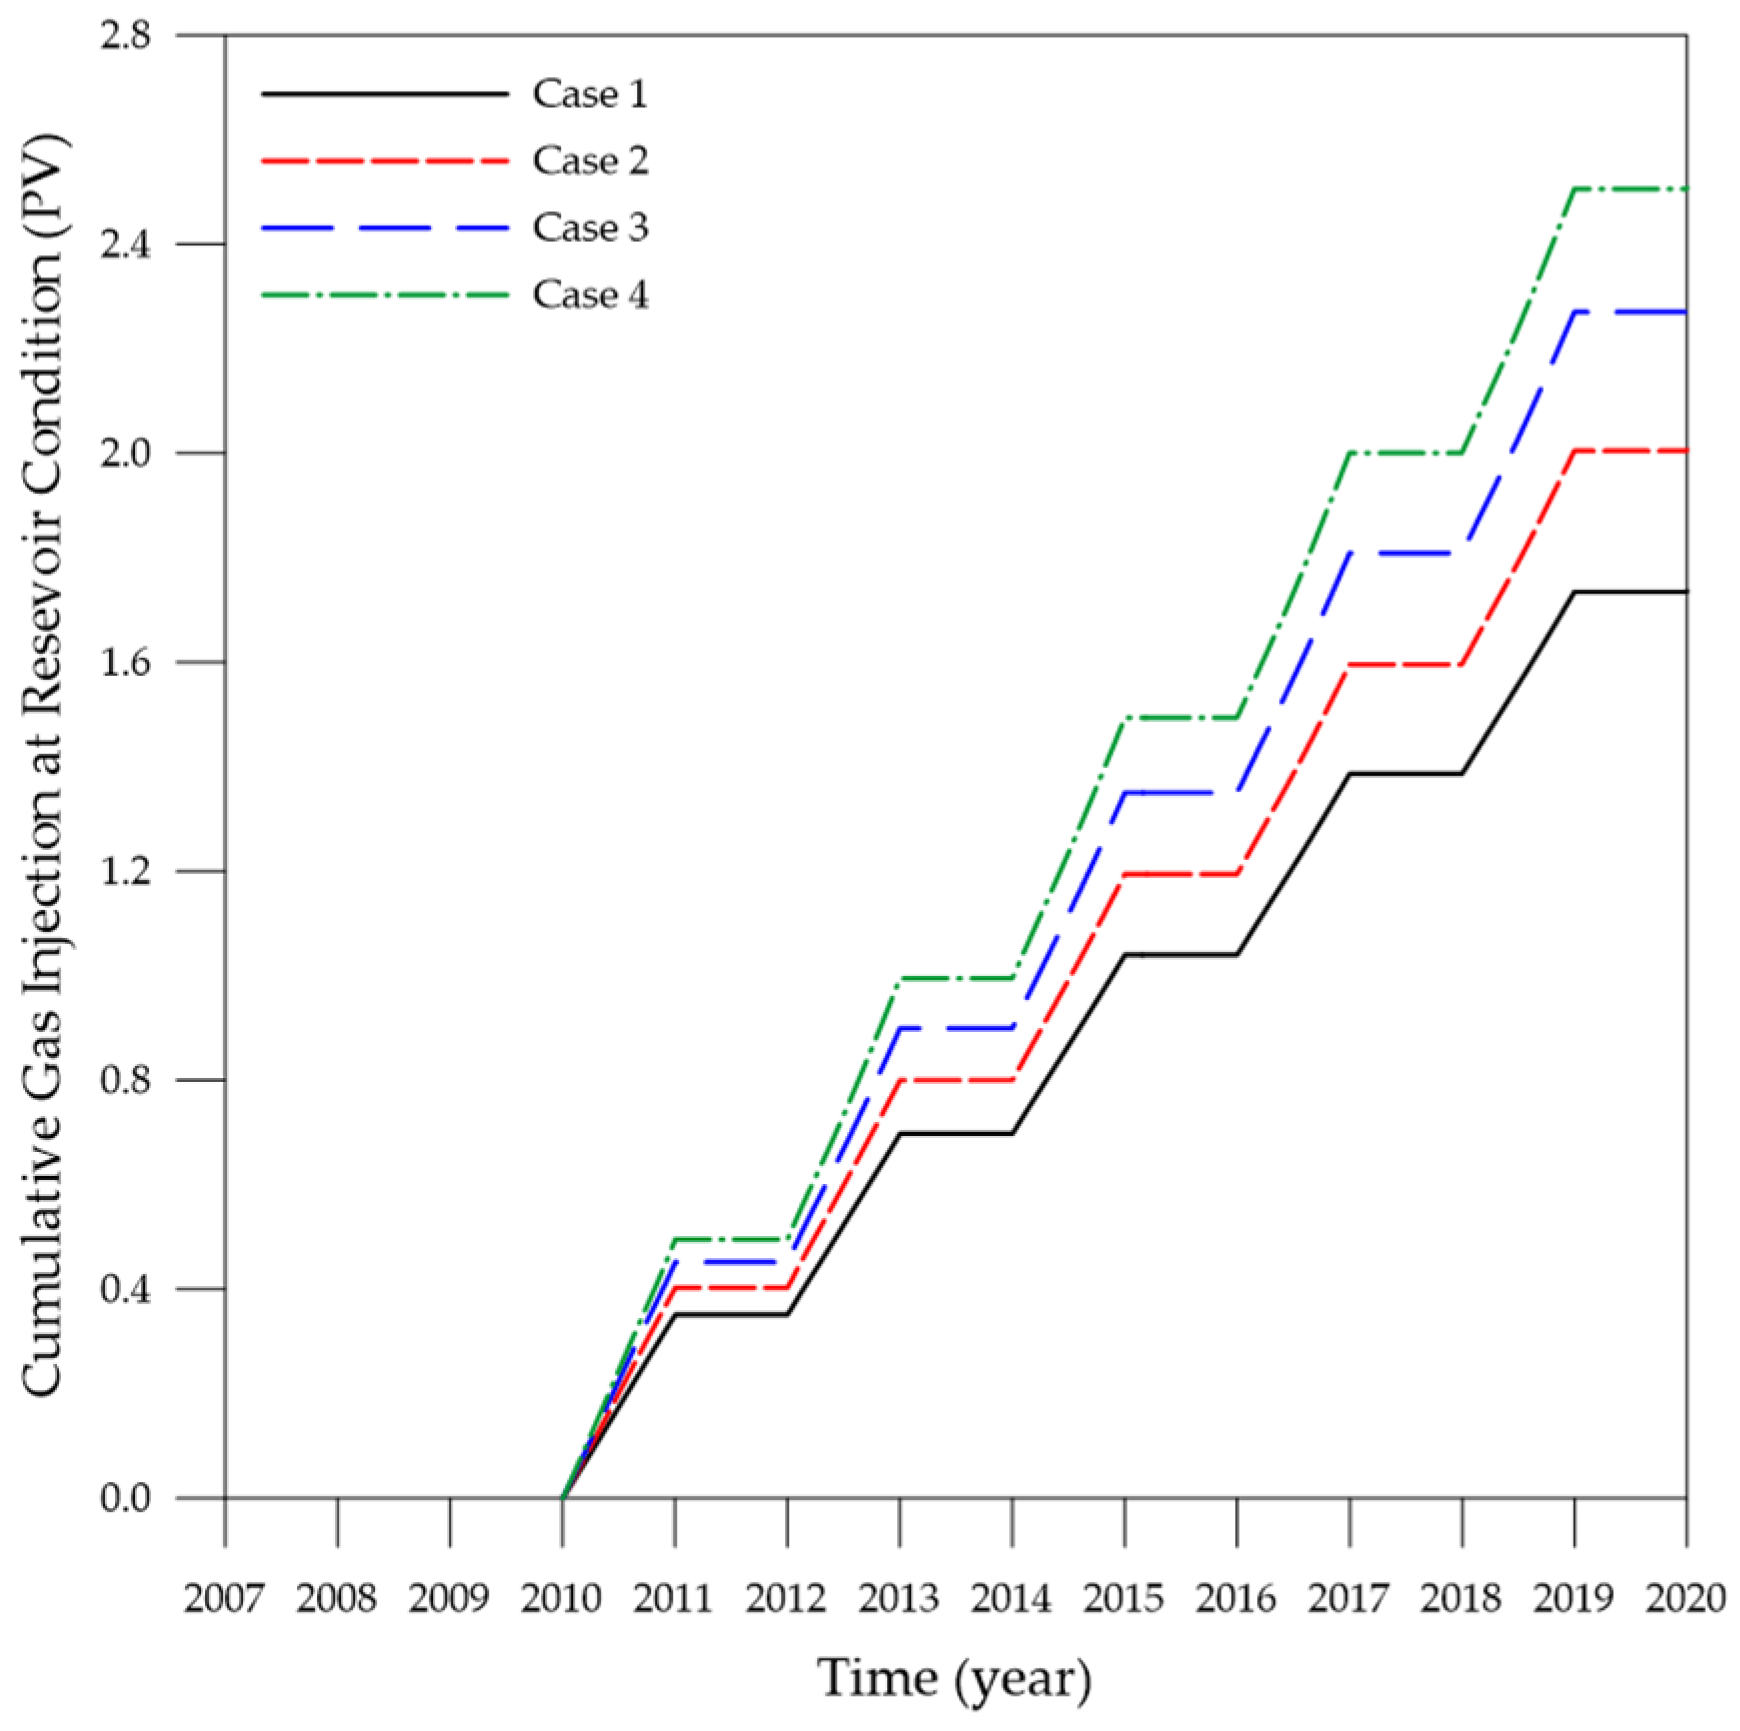
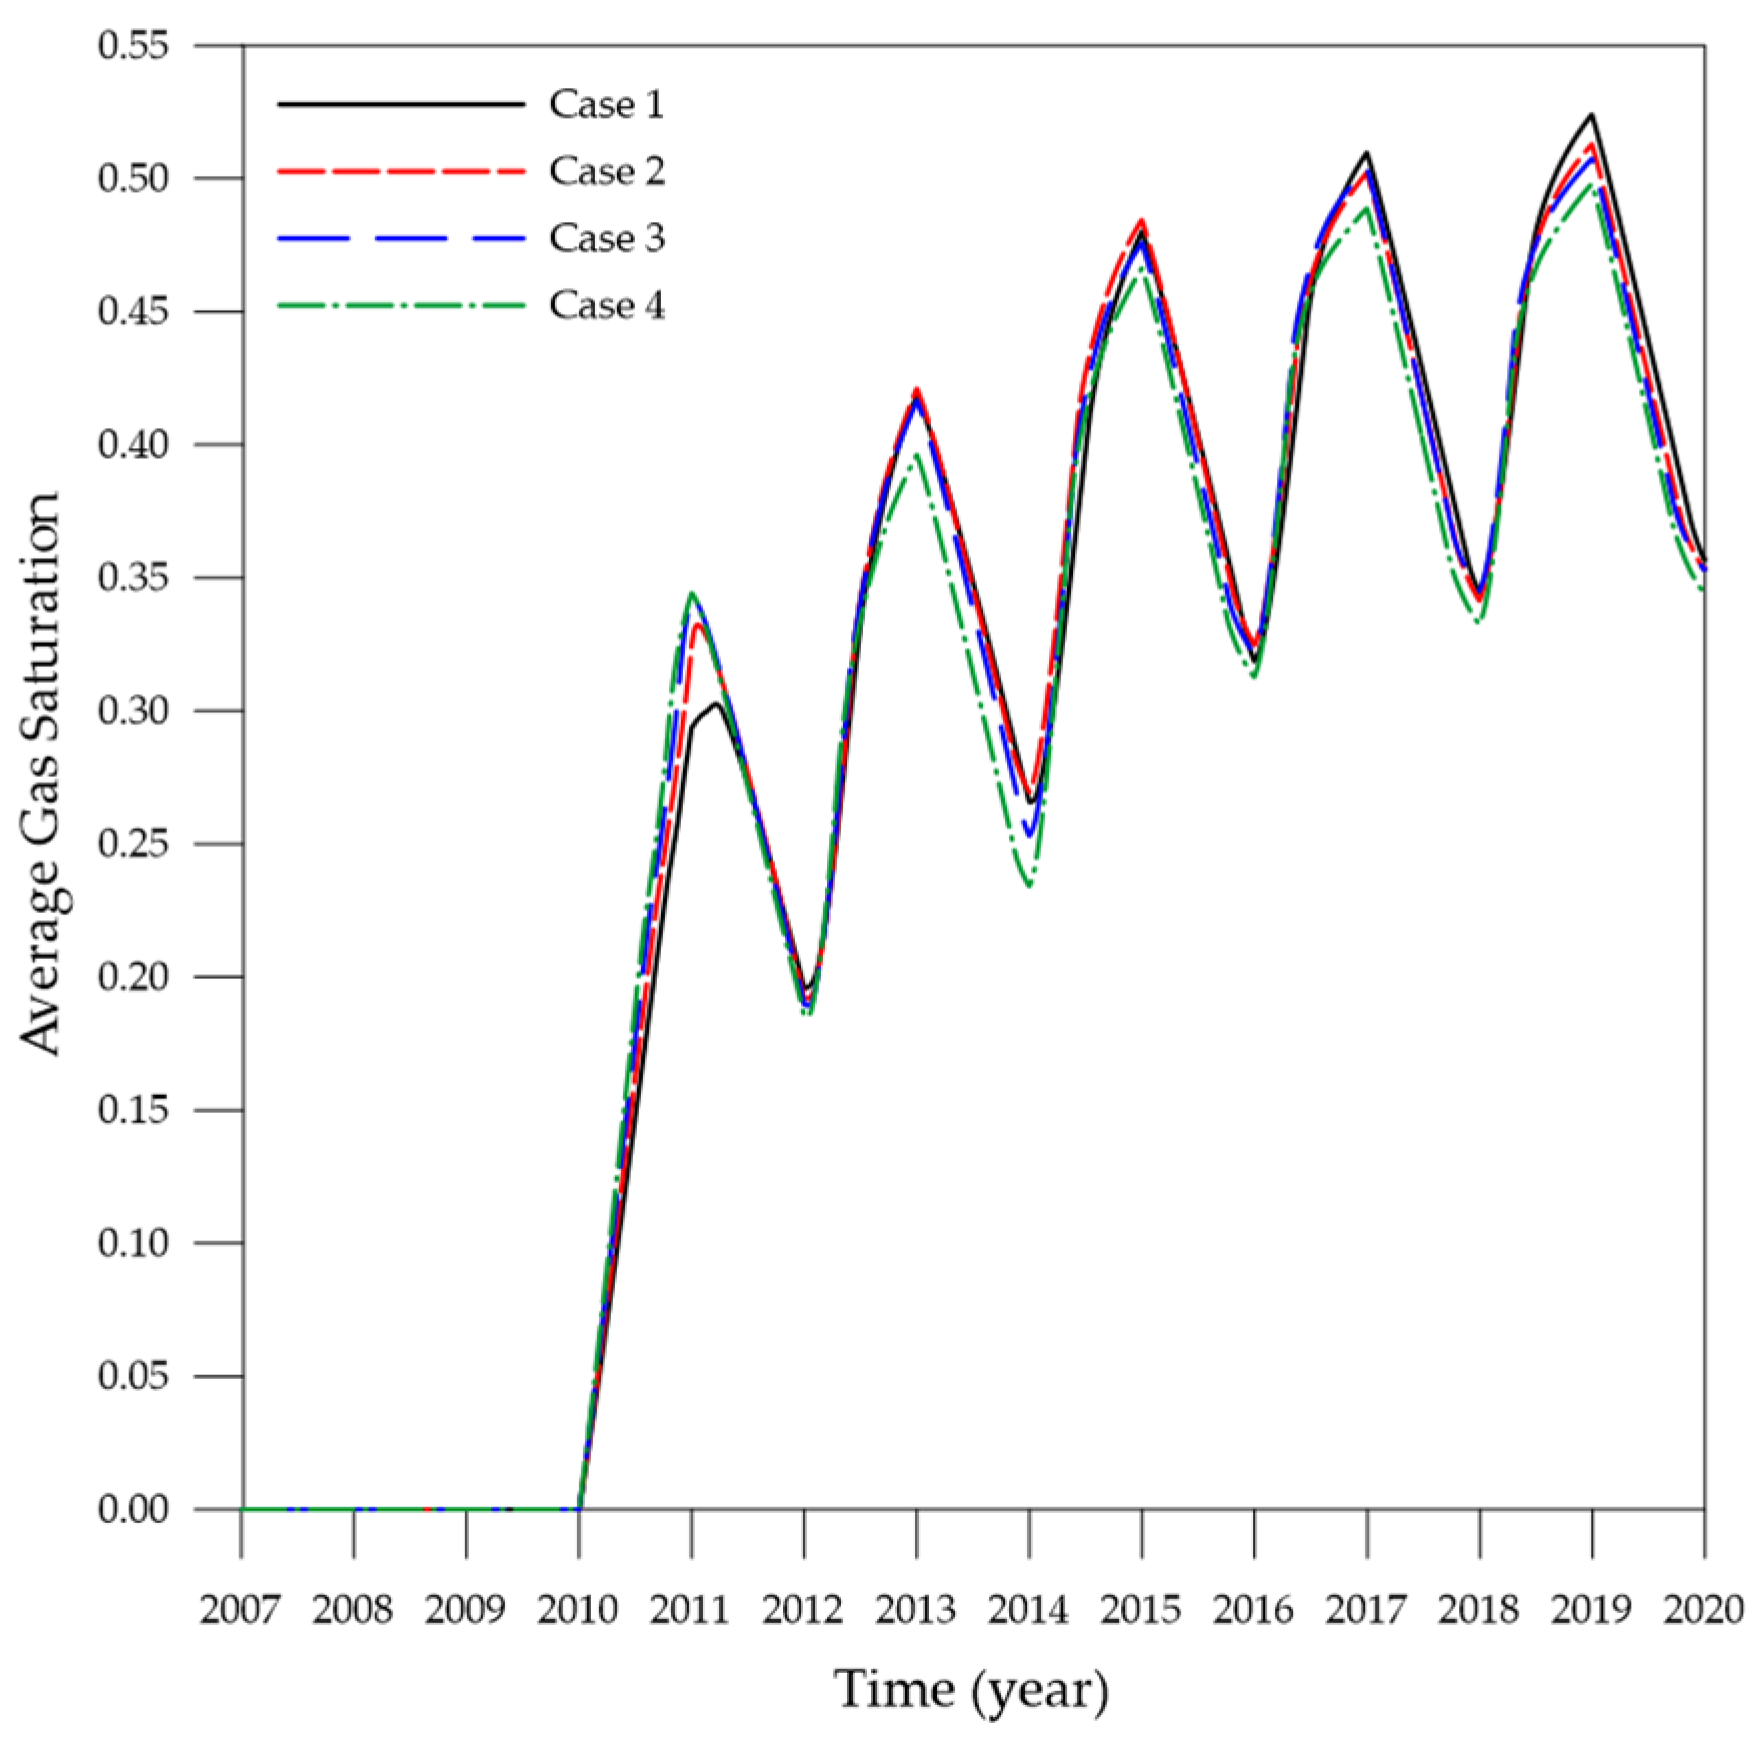
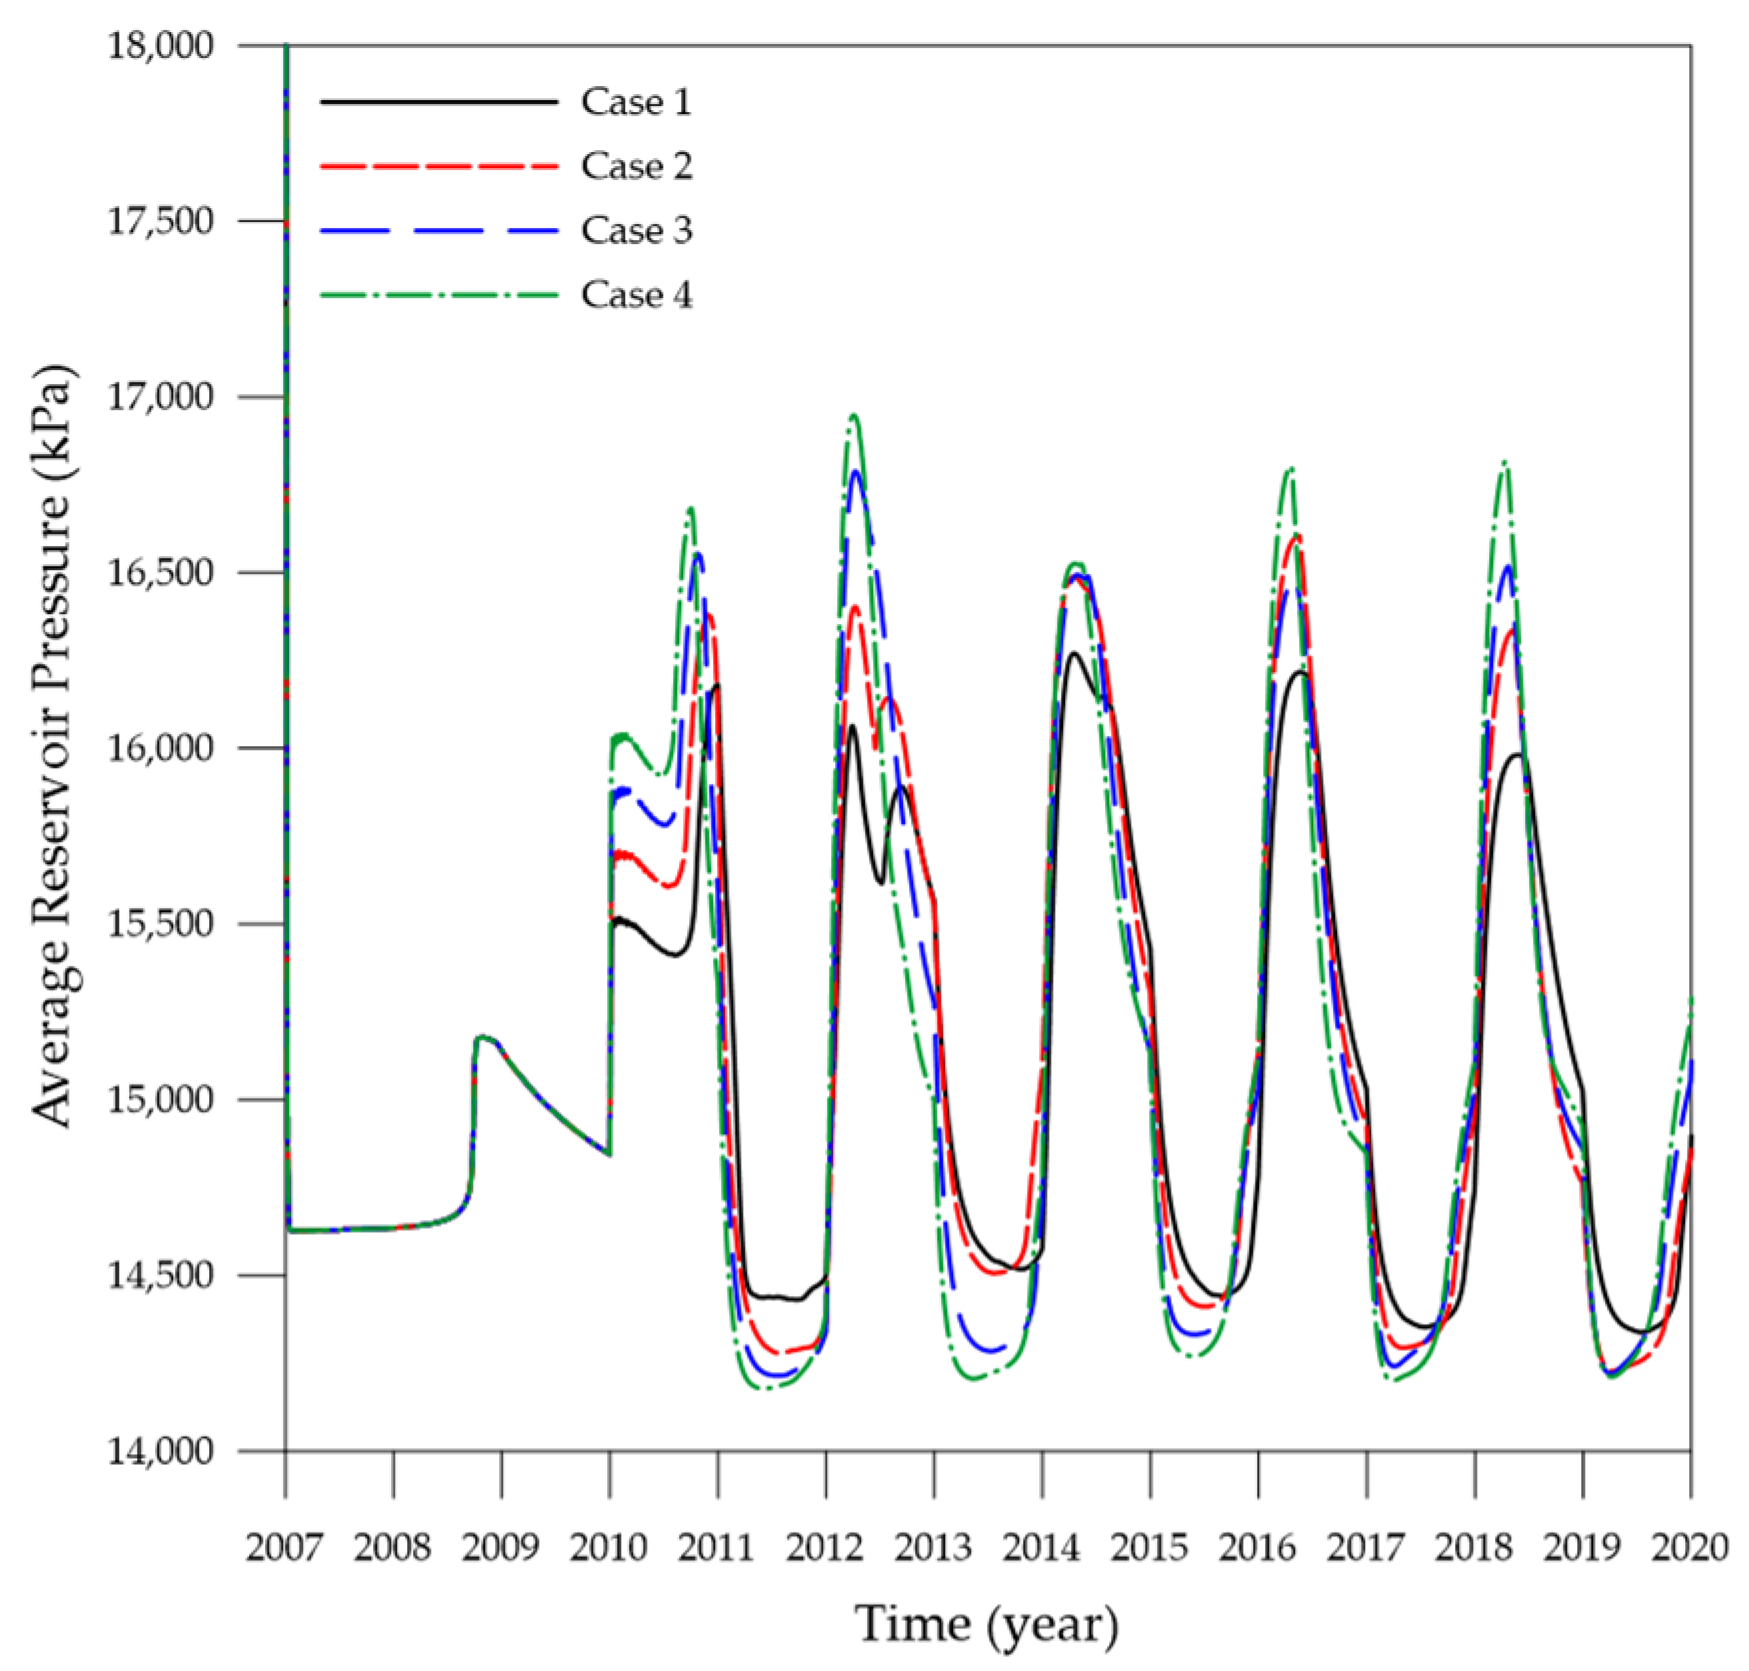
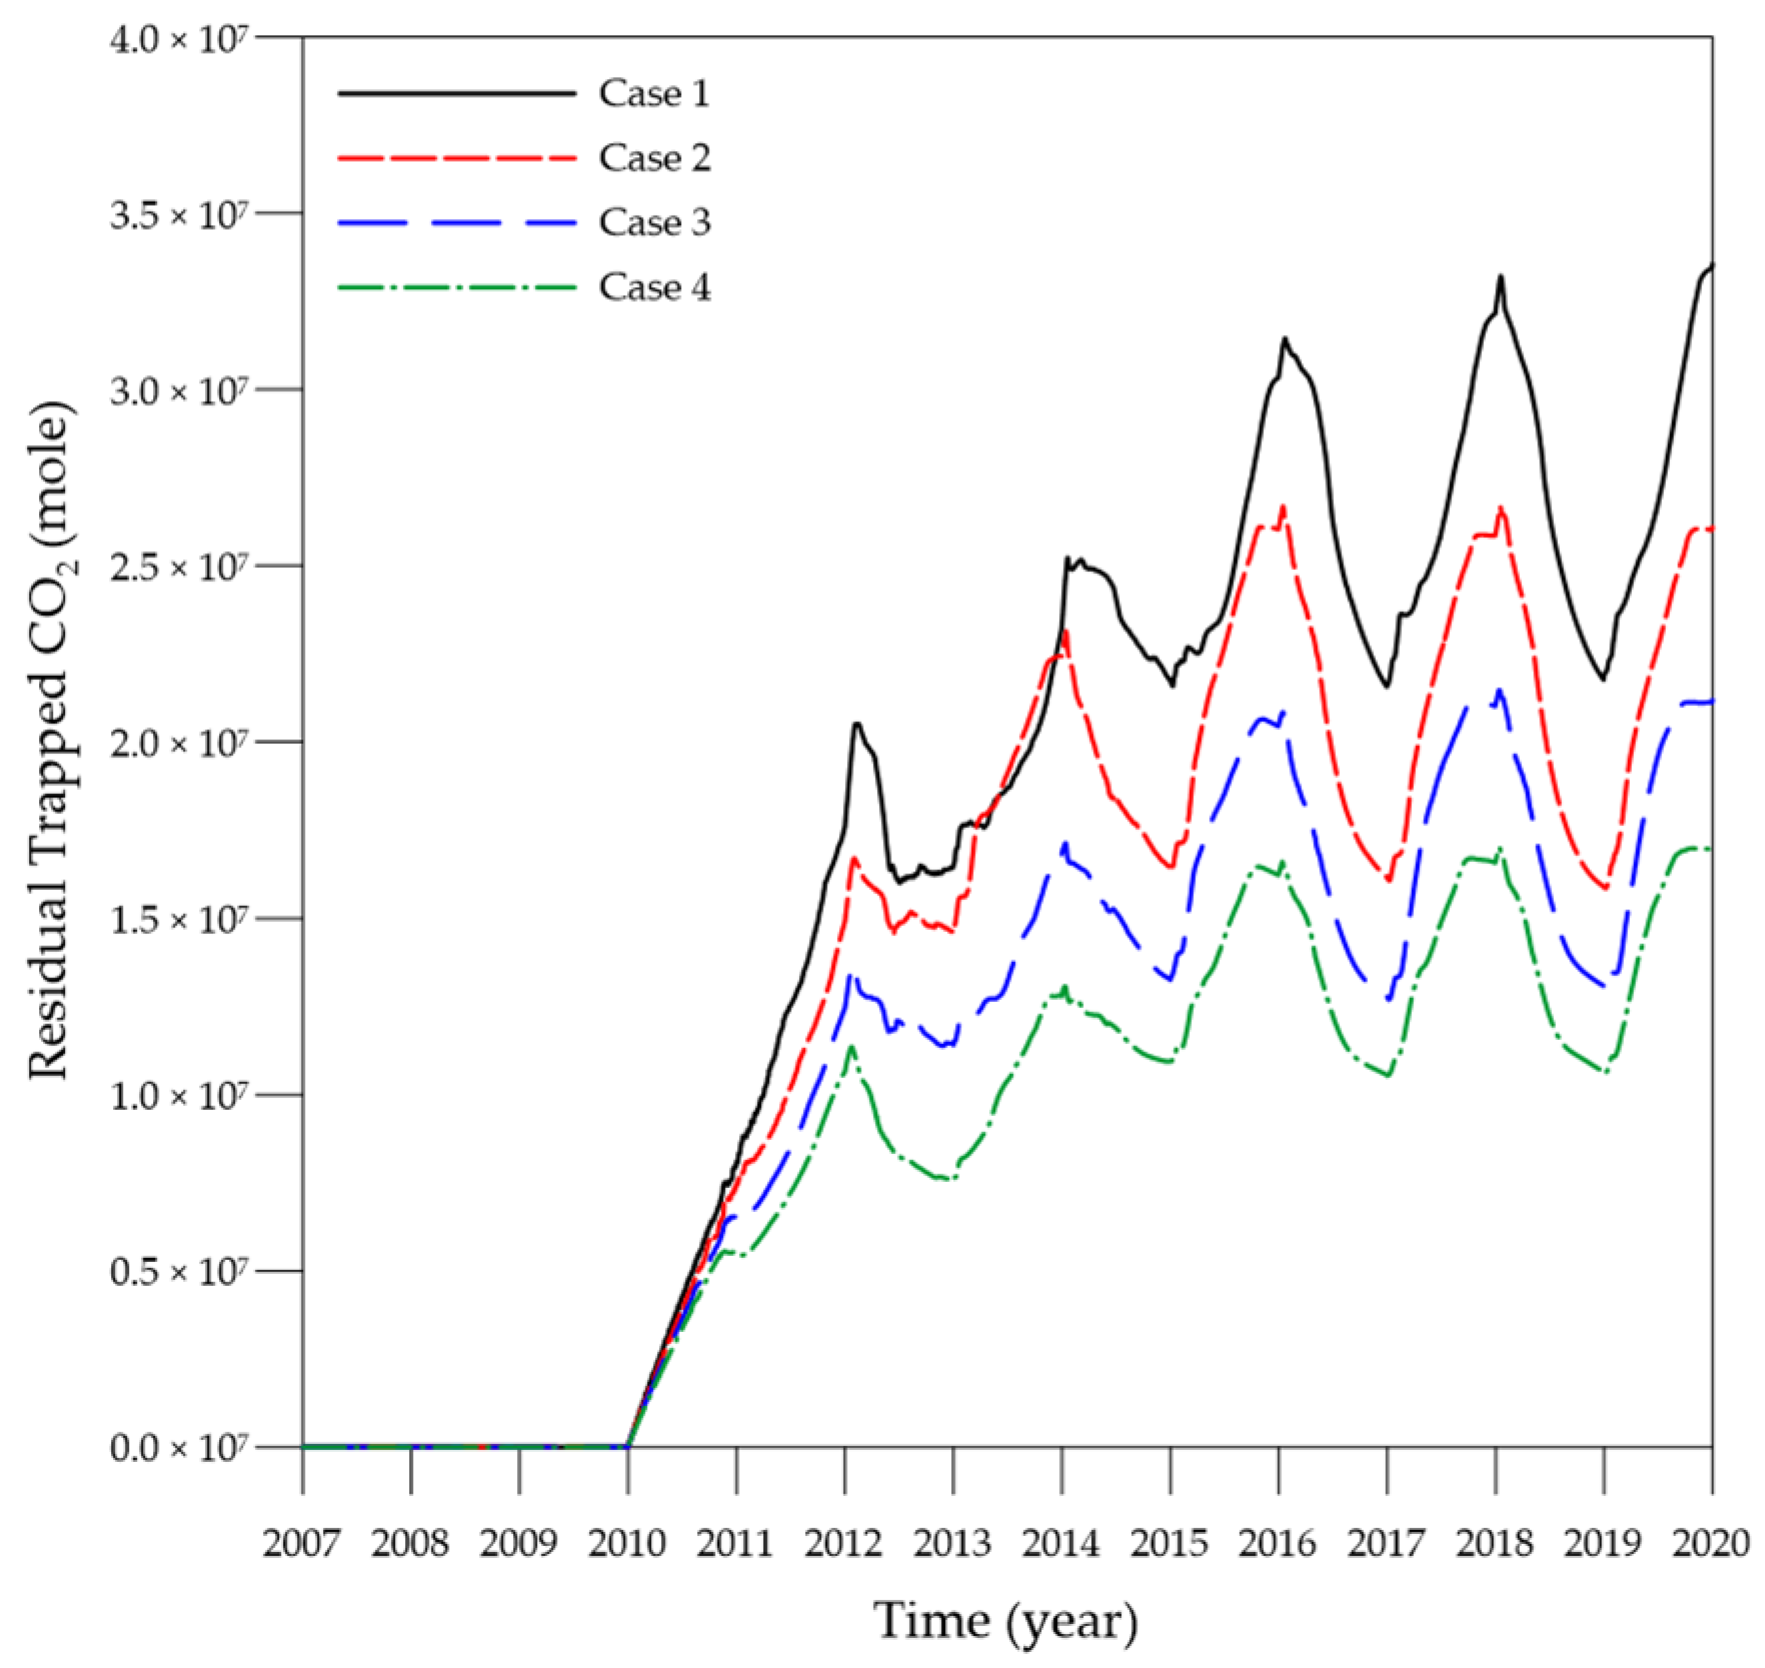
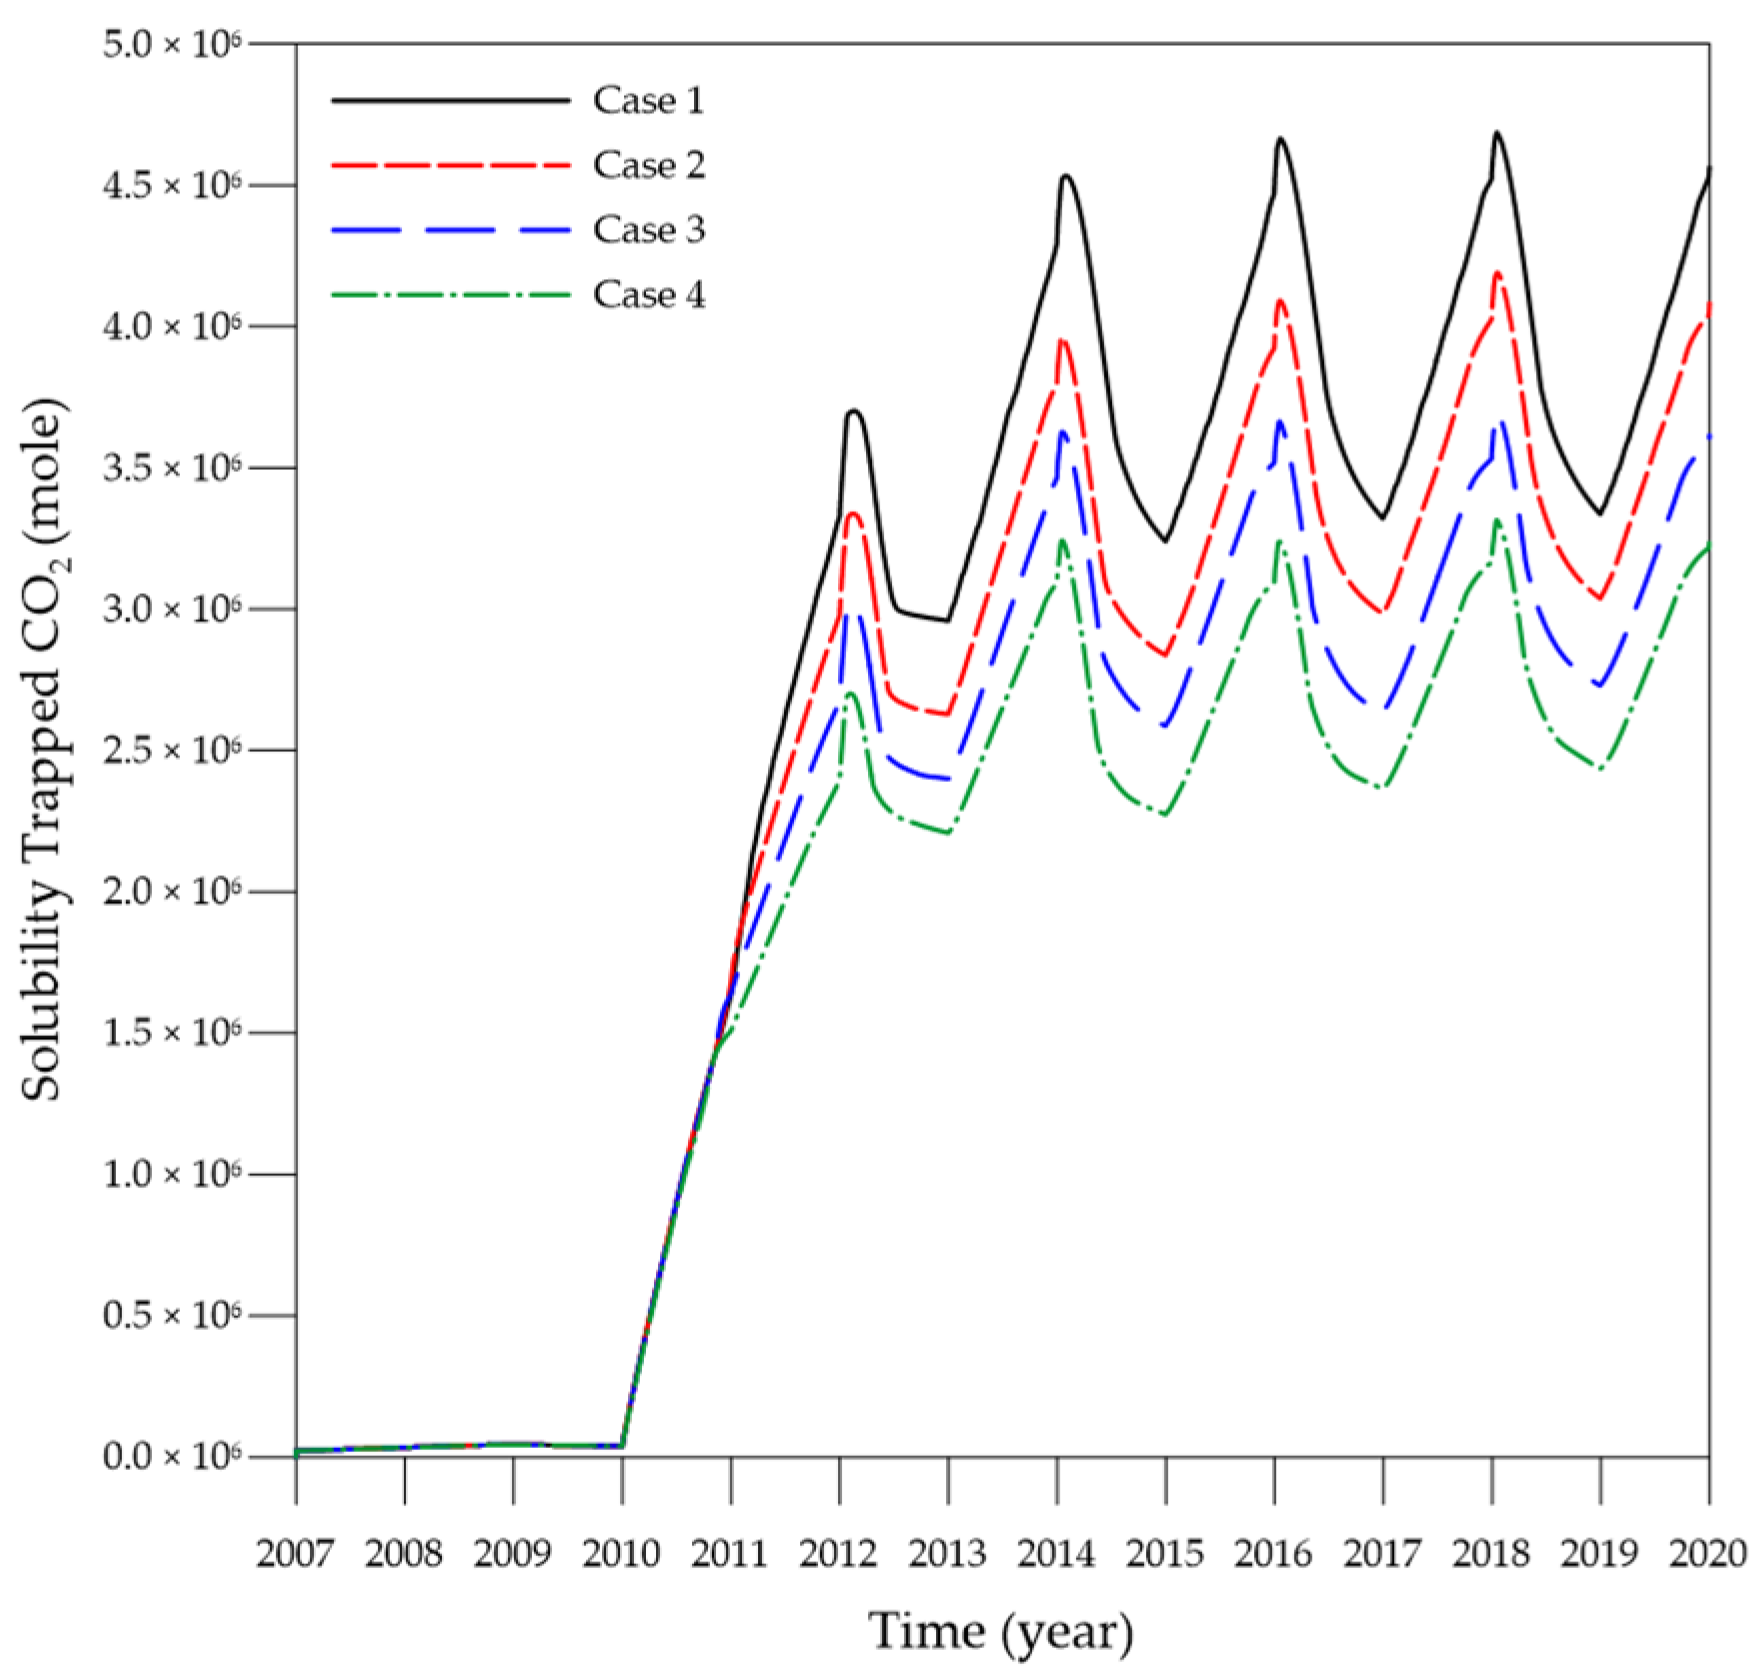
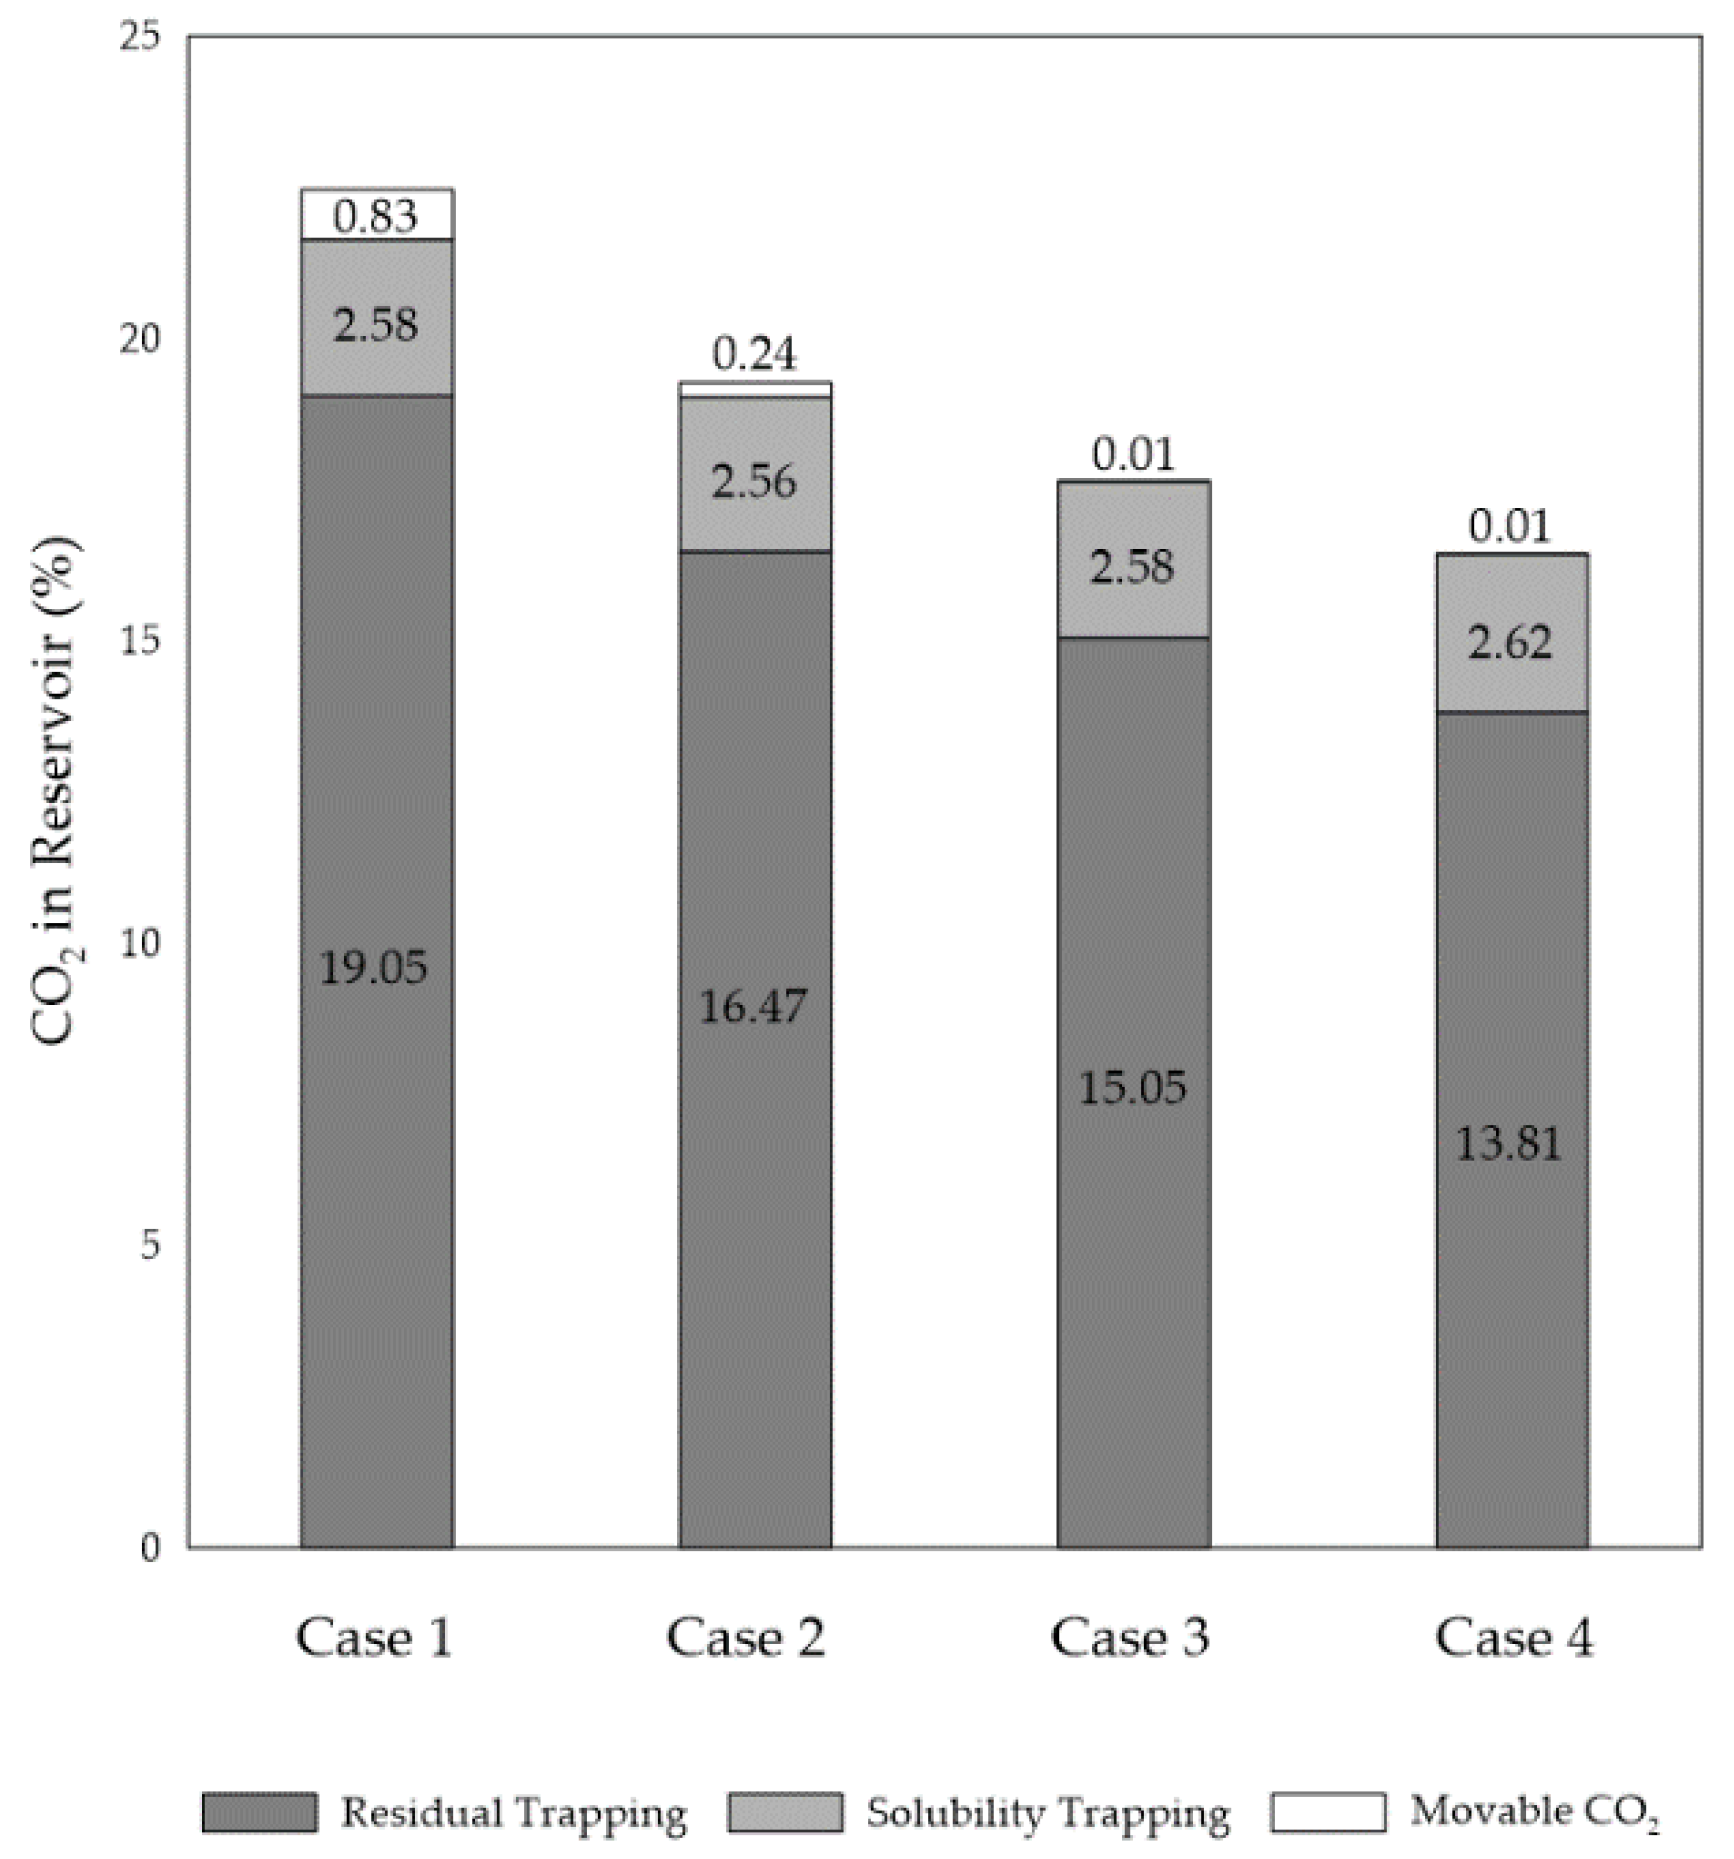
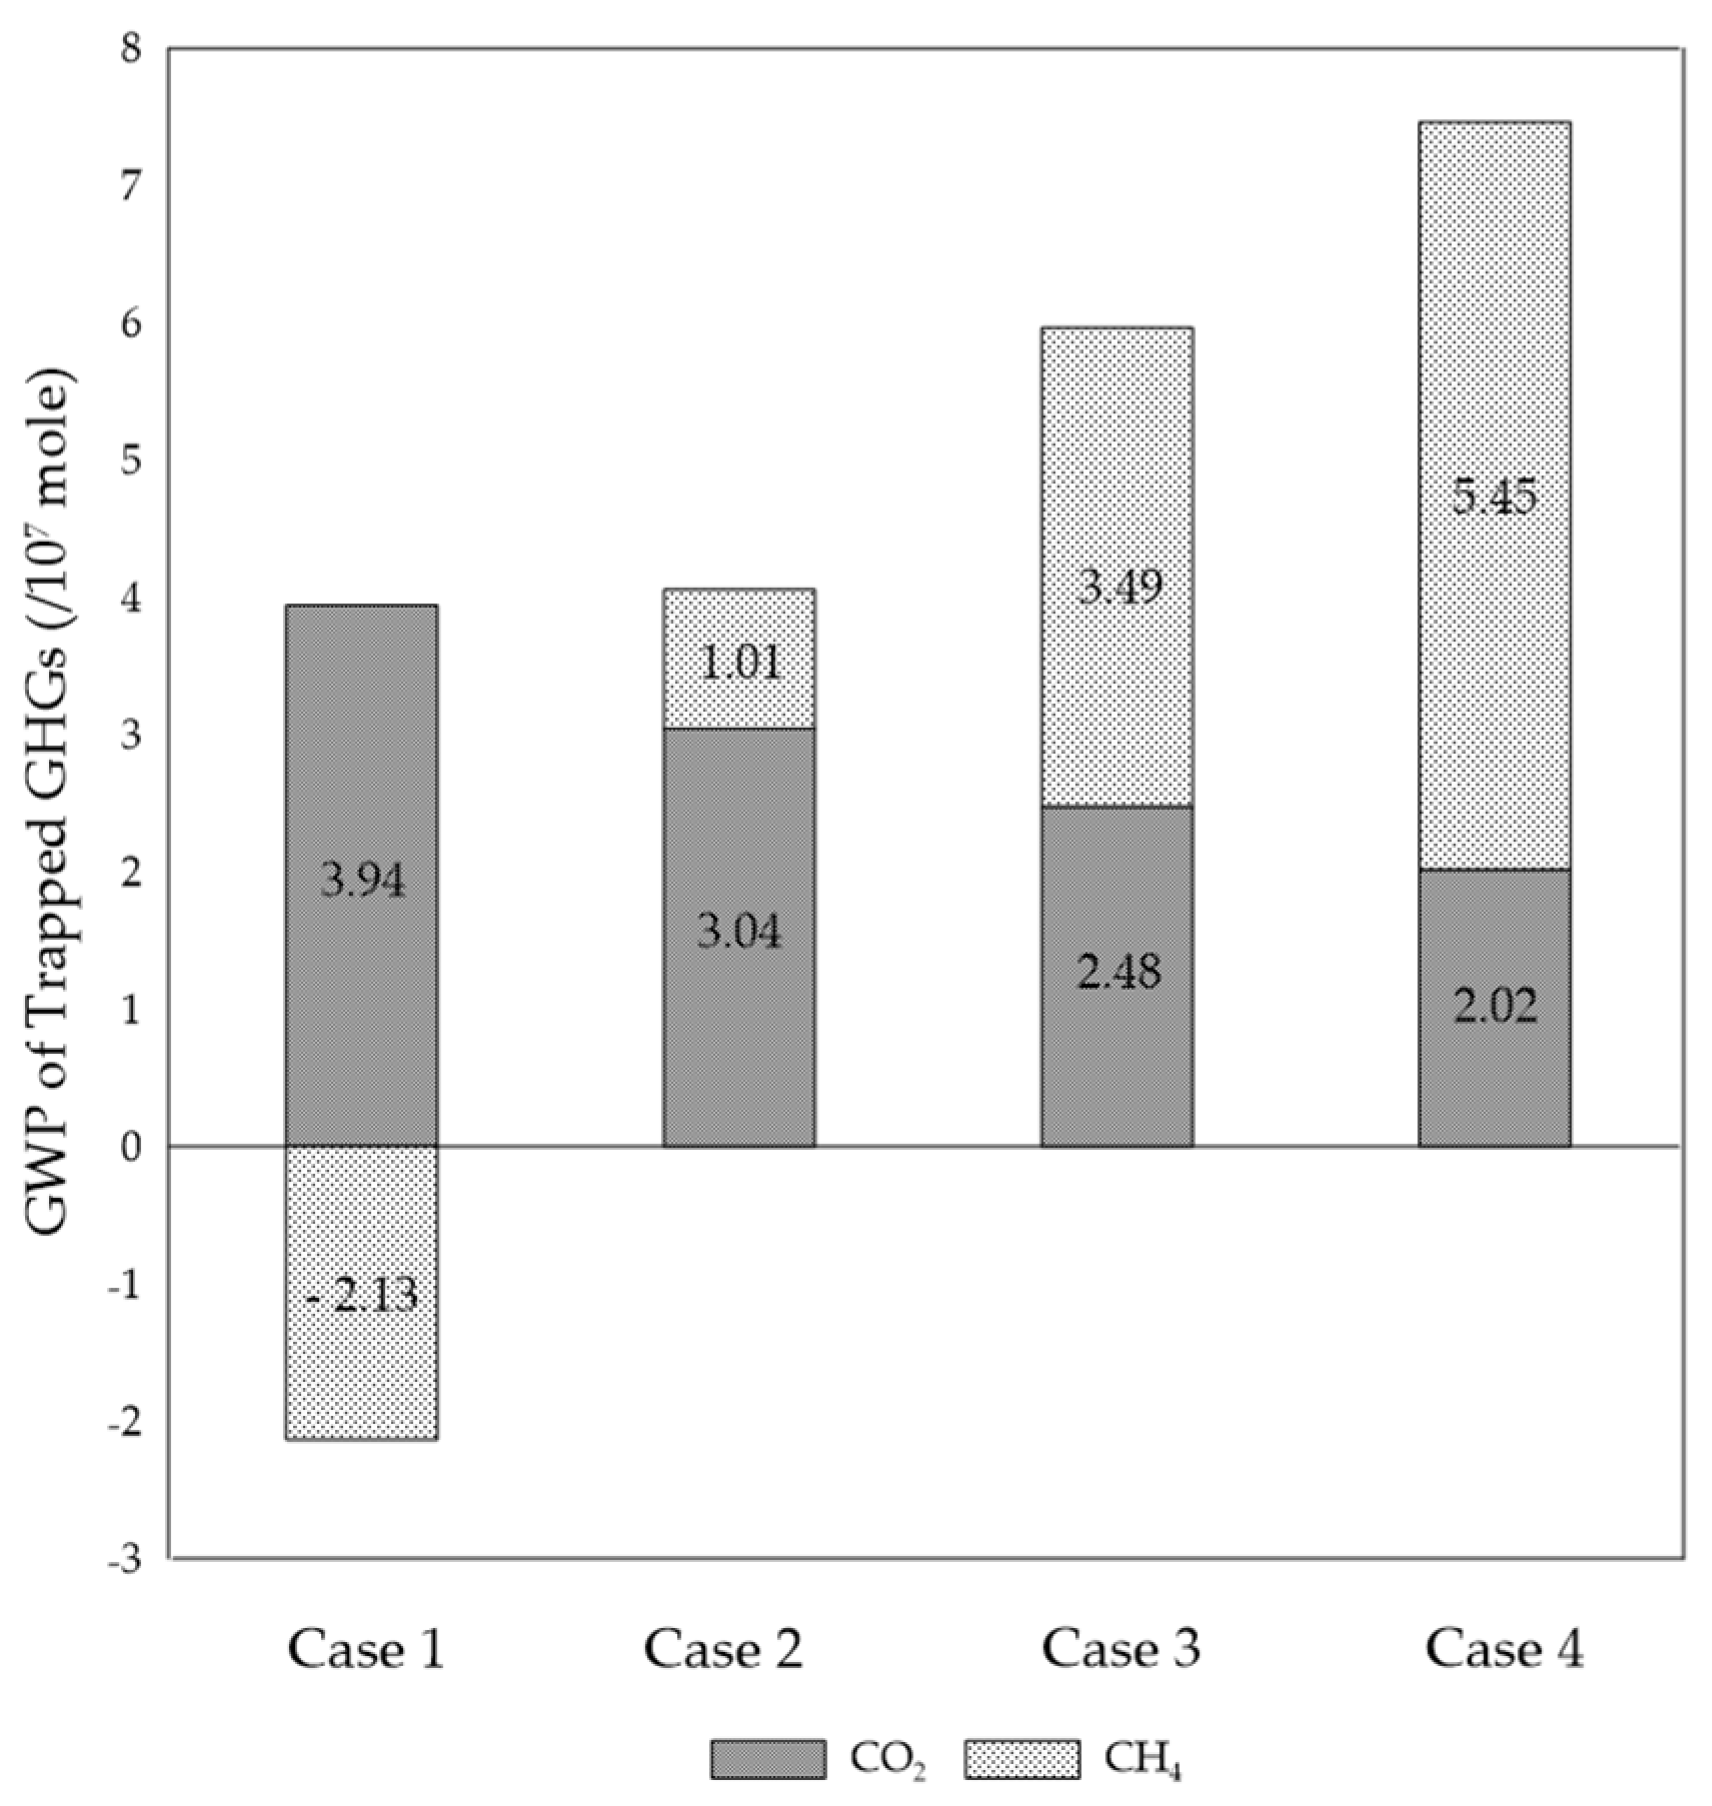
3.3. Effects of CH4 Injection on Carbon Storage Efficiency

As indicated in Figure 7, the addition of CH4 to the CO2 stream reduces the WAG sweep efficiency and gas saturation, thus decreasing the S g m (Equation (4)) to lower the trapped gas saturation, S g r . As a result, the residual trapped CO2 by hysteresis (Figure 10) is seen to decrease as the ratio of CH4 to CO2 in the gas stream increases. In addition, the amount of solubility-trapped CO2 decreases as the concentration of CH4 increases, as indicated in Figure 11. However, this decrease is primarily due to the reduced volume of injected CO2 and does not mean that the addition of CH4 lowers the performance of solubility trapping. As mentioned in Section 3.2., the injected total gas rate is set to a constant of 2,265 m3/day, so that the amount of injected CO2 decreases with increasing CH4 addition.
The contributions of the residual trapping and solubility trapping mechanisms to geological carbon sequestration is examined in Figure 12 by comparing the mole proportions of injected and remaining CO2. Note that movable CO2 also has the potential to be trapped over time. Thus, compared to Case 1, the residual trapping performances of Cases 2, 3, and 4 are seen to decrease by 13.2%, 20.5%, and 27.4% respectively, due to the lower hysteresis effect and gas saturation. By contrast, the solubility trapping efficiencies remain relatively constant as the amount of injected CO2 is reduced with CH4 addition. This is because the CO2 solubility trapping is affected not only by gas saturation but also by reservoir pressure. Since the added CH4 increases the reservoir pressure, as indicated in Figure 8, this balances out the negative effect of the reduced CO2 injection, thereby resulting in the similar CO2 solubility trapping performance. Meanwhile, the amount of movable CO2 remaining in the reservoir decreases with increasing concentration of CH4 due to the gas breakthrough effect.
Although the above results elucidate the aspect of CO2 sequestration, it is also necessary to consider the contribution of CH4 storage because the GWP of CH4 is about 28 times that of CO2. The GWP is an index of the relative amount of heat trapped by a unit mass of other GHGs compared to CO2. In the present study, the GWP is transformed into the index per 107 moles of GHG. GWP of CH4 per 107 moles is ten times higher than that of CO2 with consideration for the molecular weight of each gas. In other words, the effect of 1 mole of CH4 sequestration upon the prevention of global warming is the same as that of 10 moles of CO2 sequestration. Thus, the relative amounts of trapped GHGs are presented in Figure 13, where 107 moles of trapped CO2 and CH4 are quantified as 1 and 10, respectively. For Case 1, the net GWP of trapped gases is 3.94 − 2.13 = 1.81, under the assumption that CH4 is only produced without re-injection into the reservoir. As the CH4 concentration increases, the trapped GWPs for the co-injection cases are increased by 123%, 230%, and 313% respectively, compared with Case 1 due to the CH4 sequestration effect in spite of the reduction in CH4 storage.

4. Discussions

This study investigated the effects of CO2-CH4 co-injection on CCS-EOR performance and mechanisms using the compositional 2D reservoir simulation. The 2D homogeneous plane model was designed in order to focus on the miscibility and sweep efficiency without gravity override during WAG simulations. We anticipate that the proposed compositional model can be extended to a three-dimensional (3D) heterogeneous model for real field applications. Adding CH4 into the CO2 stream may affect the vertical sweep efficiency, resulting in the change of the CCS-EOR performance because the density of CH4 is much lighter than that of CO2. Also, reservoirs are heterogeneous in reality. The effects of heterogeneity on the performance are under investigation as future works.
Moreover, it is essential for the technically, economically, and environmentally sustainable development of CO2-EOR fields to analyze both oil recovery and carbon storage efficiencies in an integrated way. For an actual field application, the optimal CO2-CH4 injection design should be developed with consideration for economic factors, such as the volatile oil price, CO2 and CH4 purchase and recycle prices, operating costs, and tax credits for CCS. Ettehadtavakkol et al. [46] focused on the sensitivity of economic parameters with various WAG ratios during CCS-EOR, but no study has been conducted in the CO2-CH4 co-injection system to the best of our knowledge. Since the optimum operating conditions enhancing the performance of CCS-EOR depend on reservoir characteristics, it is necessary to develop a site-specific design based on economic analysis for the field application.
Gas injection changes the stability of asphaltene precipitation and deposition, and formation damages by asphaltene deposition affect CCS-EOR performance. The effects of asphaltene deposition on CCS-EOR in the CO2 WAG process have been investigated in Cho et al. [19], while the effect of CH4 addition has not been studied yet. We clarify that the CO2-CH4 co-injection model considering asphaltene deposition is being developed as our on-going work.

5. Conclusions

A compositional numerical simulation was conducted to investigate the effects of CH4 additions upon the coupled CO2-enhanced oil recovery (EOR) and carbon storage process. The oil properties were matched to the reference data from Weyburn W3 via the equation of state (EOS) parameter tuning. The minimum miscibility pressure (MMP) between the CO2/CH4 mixture and the reservoir oil was estimated using the multiple-mixing-cell method. Based on the fluid model, the three-phase hysteresis model and Henry’s law were applied for accurate simulation of WAG injection under dynamic conditions. The following conclusions were drawn from this study.
Because adding CH4 to the CO2 stream increased the MMP, the interfacial tension (IFT) between the co-injected gases and the reservoir oil had a higher value than that of CO2 alone. Further, the addition of CH4 resulted in a less pronounced reduction in oil viscosity after multiple contacts with the gas stream, thus indicating the lower displacement efficiency. Since CH4 is less compressible than CO2, the CO2/CH4 mixture occupied more pore volume than CO2 in the first WAG cycle, but the reduction in sweep efficiency due to CH4 addition reversed this tendency in subsequent cycles. Hence, although the CH4 addition resulted in a higher EOR performance in the early stages due to the compressibility effect, the EOR performance was subsequently reduced due to the lower displacement and sweep efficiencies. The diminished sweep efficiency due to CH4 addition led, in turn, to a reduction in the residual trapping performance of CO2. By contrast, the increased reservoir pressure acted to offset the lower sweep efficiency for CO2 solubility trapping, thus maintaining the performance even with increasing amounts of CH4 addition. Taking the global warming potentials (GWPs) of the respective gases into consideration, the overall carbon capture and storage (CCS) effects were improved by 123%, 230%, and 313% by the use of CH4 to CO2 ratios of 0.1, 0.2, and 0.3 respectively, compared to the use of CO2 alone. In conclusion, the developed model demonstrates that CH4 has the combined effect of reducing EOR performance but increasing CCS performance. The above results indicate the significance of the integrated analysis for accurate CO2 sequestration in depleted or depleting hydrocarbon reservoirs under EOR.

Author Contributions

Conceptualization, J.C. and K.S.L.; methodology, software, and validation, J.C., K.S.L., and B.M.; formal analysis and investigation, J.C.; writing—original draft preparation, J.C.; writing—review and editing, B.M., G.P., S.K., and H.S.L.; supervision, project administration, and funding acquisition, B.M. All authors have read and agreed to the published version of the manuscript.

Funding

This research was supported by the National Research Foundation of Korea (NRF) grants (No. 2018R1A6A1A08025520 and No. 2019R1C1C1002574). Jinhyung Cho was partially supported by the NRF grant (No. 2020R1I1A1A01067015).

Acknowledgments

The authors are grateful to the Computer Modelling Group Ltd. (CMG) for technical support.

Conflicts of Interest

The authors declare no conflict of interest.

Nomenclature

αReduction exponent
fi,oFugacity of the i-th component in the oil phase
fi,gFugacity of the i-th component in the gas phase
fi,wFugacity of the i-th component in the water phase
H i S Henry’s constant for the i-th component at the saturation pressure of water, MPa
k r g drain Relative permeability of the gas during the secondary and following drainage processes
k r g input Input relative permeability of gas
k r g imb Relative permeability of gas imbibition process
ncNumber of components
pReservoir pressure, MPa
pcCritical pressure, kPa
p H 2 O s Saturation pressure of water at temperature T, MPa
RGas constant
S w I Water saturation at the start of the drainage process
S g s t a r t Gas saturation at the start of the drainage process (end of previous imbibition)
SwiInitial water saturation
SgfFree gas saturation
S g e n d Endpoint gas saturation of imbibition
SgcCritical gas saturation in the input relative permeability table
SgmMaximum gas saturation reached by drainage
Sg,maxMaximum gas saturation associated with the imbibition
S o m m o d Modified minimum residual oil saturation
TcCritical temperature, K
T r , H 2 O Reduced temperature of water
v ¯ C O 2 Partial molar volume of CO2 at infinite dilution (cm3·mol−1)

References

  1. Arvanitis, A.; Koutsovitis, P.; Koukouzas, N.; Tyrologou, P.; Karapanos, D.; Karkalis, C.; Pomonis, P. Potential Sites for Underground Energy and CO2 Storage in Greece: A Geological and Petrological Approach. Energies 2020, 13, 2707. [Google Scholar] [CrossRef]
  2. International Energy Agency (IEA). 20 Years of Carbon Capture and Storage: Accelerating Future Deployment; IEA Publications: Paris, France, 2016. [Google Scholar]
  3. International Energy Agency (IEA). Storing CO2 through Enhanced Oil Recovery; IEA Publications: Paris, France, 2015. [Google Scholar]
  4. International Energy Agency (IEA). Transforming Industry through CCUS; IEA Publications: Paris, France, 2019. [Google Scholar]
  5. International Energy Agency (IEA). Tracking Fuel Supply; IEA Publications: Paris, France, 2019. [Google Scholar]
  6. Zanganeh, P.; Dashti, H.; Ayatollahi, S. Comparing the effects of CH4, CO2, and N2 injection on asphaltene precipitation and deposition at reservoir condition: A visual and modeling study. Fuel 2018, 217, 633–641. [Google Scholar] [CrossRef]
  7. Zhang, Y.; Di, Y.; Shi, Y.; Hu, J. Cyclic CH4 injection for enhanced oil recovery in the Eagle Ford shale reservoirs. Energies 2018, 11, 3094. [Google Scholar] [CrossRef] [Green Version]
  8. Kumar, N.; Von Gonten, W.D. An investigation of oil recovery by injecting CO2 and LPG mixtures. In Proceedings of the Fall Meeting of the Society of Petroleum Engineers of AIME, Las Vegas, NV, USA, 30 September–3 October 1973. [Google Scholar]
  9. Sebastian, H.M.; Wenger, R.S.; Renner, T.A. Correlation of minimum miscibility pressure for impure CO2 streams. J. Pet. Technol. 1985, 37, 2076–2082. [Google Scholar] [CrossRef]
  10. Zhang, P.Y.; Huang, S.; Sayegh, S.; Zhou, X.L. Effect of CO2 impurities on gas-injection EOR processes. In Proceedings of the SPE/DOE Symposium on Improved Oil Recovery, Tulsa, OK, USA, 17–21 April 2004. [Google Scholar]
  11. Shokir, E.M.E.-M. CO2–oil minimum miscibility pressure model for impure and pure CO2 streams. J. Petrol. Sci. Eng. 2007, 58, 173–185. [Google Scholar] [CrossRef]
  12. Teklu, T.W.; Alharthy, N.; Kazemi, H.; Yin, X.; Graves, R.M. Hydrocarbon and non-hydrocarbon gas miscibility with light oil in shale reservoirs. In Proceedings of the SPE Improved Oil Recovery Symposium, Tulsa, OK, USA, 12–16 April 2014. [Google Scholar]
  13. Jin, L.; Pekot, L.J.; Hawthorne, S.B.; Gobran, B.; Greeves, A.; Bosshart, N.W.; Jiang, T.; Hamling, J.A.; Gorecki, C.D. Impact of CO2 impurity on MMP and oil recovery performance of the Bell Creek oil field. Energy Procedia 2017, 114, 6997–7008. [Google Scholar] [CrossRef]
  14. He, C.; Mu, L.; Xu, A.; Zhao, L.; He, J.; Zhang, A.; Shan, F.; Luo, E. Phase behavior and miscible mechanism in the displacement of crude oil with associated sour gas. Oil Gas Sci. Technol. – Rev. d’IFP 2019, 74, 54. [Google Scholar] [CrossRef]
  15. The Intergovernmental Panel on Climate Change. Climate Change 2014: Mitigation of Climate Change: Working Group III Contribution to the IPCC Fifth Assessment Report. Cambridge University Press: New York, NY, USA, 2014. [Google Scholar]
  16. Blanco, S.T.; Rivas, C.; Fernández, J.; Artal, M.; Velasco, I. Influence of methane in CO2 transport and storage for CCS technology. Environ. Sci. Technol. 2012, 46, 13016–13023. [Google Scholar] [CrossRef]
  17. Blanco, S.T.; Rivas, C.; Bravo, R.; Fernández, J.; Artal, M.; Velasco, I. Discussion of the influence of CO and CH4 in CO2 transport, injection, and storage for CCS technology. Environ. Sci. Technol. 2014, 48, 10984–10992. [Google Scholar] [CrossRef]
  18. Soltanian, M.R.; Amooie, M.A.; Cole, D.R.; Darrah, T.H.; Graham, D.E.; Pfiffner, S.M.; Phelps, T.J.; Moortgat, J. Impacts of Methane on Carbon Dioxide Storage in Brine Formations. Ground Water 2018, 56, 176–186. [Google Scholar] [CrossRef] [PubMed]
  19. Gimeno, B.; Martínez-Casasnovas, S.; Velasco, I.; Blanco, S.T.; Fernández, J. Thermodynamic properties of CO2 + SO2 + CH4 mixtures over wide ranges of temperature and pressure. Evaluation of CO2/SO2 co-capture in presence of CH4 for CCS. Fuel 2019, 255, 115800. [Google Scholar] [CrossRef]
  20. Cho, J.; Kim, T.H.; Chang, N.; Lee, K.S. Effects of asphaltene deposition-derived formation damage on three-phase hysteretic models for prediction of coupled CO2 enhanced oil recovery and storage performance. J. Petrol. Sci. Eng. 2019, 172, 988–997. [Google Scholar] [CrossRef]
  21. Makimura, D.; Kunieda, M.; Liang, Y.; Matsuoka, T.; Takahashi, S.; Okabe, H. Application of molecular simulations to CO2-enhanced oil recovery: Phase equilibria and interfacial phenomena. SPE J. 2013, 18, 319–330. [Google Scholar] [CrossRef]
  22. Stalkup, F., Jr. I. Miscible Displacement; Society of Petroleum Engineers of AIME: Dallas, TX, USA, 1984. [Google Scholar]
  23. Razak, W.N.A.W.; Daud, W.A.W.; Faisal, A.H.; Zakaria, N.A. Multi component mass transfer in multiple contact miscibility test; Forward and backward method. In Proceedings of the SPE/EAGE Reservoir Characterization and Simulation Conference, Abu Dhabi, UAE, 19–21 October 2009. [Google Scholar]
  24. Jessen, K.; Orr, F.M. On interfacial-tension measurements to estimate minimum miscibility pressures. SPE Reserv. Eval. Eng. 2008, 11, 933–939. [Google Scholar] [CrossRef]
  25. Yellig, W.F.; Metcalfe, R.S. Determination and prediction of CO2 minimum miscibility pressures (includes associated paper 8876). J. Pet. Technol. 1980, 32, 160–168. [Google Scholar] [CrossRef]
  26. Christiansen, R.L.; Haines, H.K. Rapid measurement of minimum miscibility pressure with the rising-bubble apparatus. SPE Reserv. Eng. 1987, 2, 523–527. [Google Scholar] [CrossRef]
  27. Rao, D.N. A new technique of vanishing interfacial tension for miscibility determination. Fluid Phase Equilib. 1997, 139, 311–324. [Google Scholar] [CrossRef]
  28. Ahmadi, K.; Johns, R.T. Multiple-mixing-cell method for MMP calculations. SPE J. 2011, 16, 732–742. [Google Scholar] [CrossRef]
  29. Spiteri, E.J.; Juanes, R. Impact of relative permeability hysteresis on the numerical simulation of WAG injection. J. Pet. Sci. Eng. 2006, 50, 115–139. [Google Scholar] [CrossRef]
  30. Larsen, J.A.; Skauge, A. Methodology for numerical simulation with cycle-dependent relative permeabilities. SPE J. 1998, 3, 163–173. [Google Scholar] [CrossRef] [Green Version]
  31. Shahrokhi, O.; Fatemi, M.; Sohrabi, M.; Ireland, S.; Ahmed, K. Assessment of three phase relative permeability and hysteresis models for simulation of water-alternating-gas (WAG) injection in water-wet and mixed-wet systems. In Proceedings of the SPE Improved Oil Recovery Symposium, Tulsa, OK, USA, 12–16 April 2014. [Google Scholar]
  32. Chen, Y.; Wu, S.; Zhou, D.; Chawathe, A.; Inouye, A. Impact of relative permeability hysteresis on water-alternating-gas WAG injectivity: Modeling and experimental study. In Proceedings of the SPE Annual Technical Conference and Exhibition, San Antonio, TX, USA, 9–11 October 2017. [Google Scholar]
  33. Land, C.S. Calculation of imbibition relative permeability for two- and three-phase flow from rock properties. SPE J. 1968, 8, 149–156. [Google Scholar] [CrossRef]
  34. Holtz, M.H. Residual gas saturation to aquifer influx: A calculation method for 3-D computer reservoir model donstruction. In Proceedings of the SPE Gas Technology Symposium, Calgary, AB, Canada, 30 April–2 May 2002. [Google Scholar]
  35. Aziz, K.; Settari, A. Petroleum reservoir simulation; Applied Science Publishers: London, UK, 1979. [Google Scholar]
  36. Mahzari, P.; Sohrabi, M. An improved approach for estimation of flow and hysteresis parameters applicable to WAG experiments. Fuel 2017, 197, 359–372. [Google Scholar] [CrossRef]
  37. Peng, D.Y.; Robinson, D.B. A new two-constant equation of state. Ind. Eng. Chem. Fundam. 1976, 15, 59–64. [Google Scholar] [CrossRef]
  38. Robinson, D.B.; Peng, D.Y. The Characterization of the Heptanes and Heavier Fractions for the GPA Peng-Robinson Programs; Research Report 28; Gas Processors Association: Tulsa, OK, USA, 1978. [Google Scholar]
  39. Nghiem, L.X.; Li, Y.K. Effect of phase behavior on CO2 displacement efficiency at low temperatures: Model studies with an equation of state. SPE Reserv. Eng. 1986, 1, 414–422. [Google Scholar] [CrossRef]
  40. Saul, A.; Wagner, W. International equations for the saturation properties of ordinary water substance. J. Phys. Chem. Ref. Data 1987, 16, 893–901. [Google Scholar] [CrossRef]
  41. Harvey, A.H. Semiempirical correlation for Henry’s constants over large temperature ranges. AIChE J. 1996, 42, 1491–1494. [Google Scholar] [CrossRef]
  42. Duan, Z.; Sun, R. An improved model calculating CO2 solubility in pure water and aqueous NaCl solutions from 273 to 533 K and from 0 to 2000 bar. Chem. Geol. 2003, 193, 257–271. [Google Scholar] [CrossRef]
  43. Srivastava, R.K.; Huang, S.S.; Dong, M. Laboratory investigation of Weyburn CO2 miscible flooding. J. Can. Petrol. Technol. 2000, 39, 41–51. [Google Scholar]
  44. White, D.J. Geophysical monitoring of the Weyburn CO2 flood: Results during 10 years of injection. Energy Procedia 2011, 4, 3628–3635. [Google Scholar] [CrossRef] [Green Version]
  45. Srivastava, R.K.; Huang, S.S.; Dong, M. Asphaltene deposition during CO2 flooding. SPE Prod. Facil. 1999, 14, 235–245. [Google Scholar] [CrossRef]
  46. Ettehadtavakkol, A.; Lake, L.W.; Bryant, S.L. CO2 EOR and Storage Design Optimization. Int. J. Greenh. Gas Control. 2014, 25, 79–92. [Google Scholar] [CrossRef]
Figure 1. Schematic diagram of the multiple contact miscibility process during CO2-enhanced oil recovery (EOR).
Applsci 10 04272 g001
Figure 2. Schematic diagram of the water alternating gas (WAG) injection model.
Applsci 10 04272 g002
Figure 3. Interfacial tension (IFT) with CH4 addition into the CO2 stream during the WAG process under reservoir conditions (T = 63 °C) for (a) 2007–2020, (b) 2010–2011.
Applsci 10 04272 g003
Figure 4. WAG models of oil viscosity at 0.15 PV injection for (a) Case 1, (b) Case 3.
Applsci 10 04272 g004
Figure 5. Cumulative gas production obtained from the four CO2-CH4 WAG cases under standard conditions.
Applsci 10 04272 g005
Figure 6. Cumulative gas injection obtained from the four CO2-CH4 WAG cases at the reservoir condition (T = 63 °C).
Applsci 10 04272 g006
Figure 7. Average gas saturation obtained from the four CO2-CH4 WAG cases.
Applsci 10 04272 g007
Figure 8. Average reservoir pressure obtained from the four CO2-CH4 WAG cases.
Applsci 10 04272 g008
Figure 9. Oil recovery factor obtained from the four CO2-CH4 WAG cases.
Applsci 10 04272 g009
Figure 10. Residual CO2 trapped by hysteresis obtained from the four CO2-CH4 WAG cases.
Applsci 10 04272 g010
Figure 11. Solubility-trapped CO2 obtained from the four CO2-CH4 WAG cases.
Applsci 10 04272 g011
Figure 12. The proportion of CO2 remaining in the reservoir relative to the injected volume of CO2 for the four CO2-CH4 WAG cases depending on the trapping mechanisms.
Applsci 10 04272 g012
Figure 13. The GWP of trapped greenhouse gases obtained from the four CO2-CH4 WAG cases.
Applsci 10 04272 g013
Table 1. Fluid composition of W3 experimental data and properties of each component used for the EOS calculation.
ComponentCompositionCritical Pressure
p c   ( kPa )
Critical Temperature
T c   ( K )
Acentric FactorMolecular Weight
N20.02073394.4126.20.04028.0
CO20.00747376.5304.20.22544.0
H2S0.00128936.9373.20.10034.1
Methane, C10.07494600.2190.60.00816.0
Ethane, C20.04224883.9305.40.09830.1
Propane, C30.07854245.5369.80.15244.1
Butane, C40.06553722.7416.50.18558.1
Pentane, C50.04593379.4464.90.23972.1
C6-90.21563019.6556.30.331102.5
C10-170.22022017.5692.20.584184.0
C18-270.10271327.0808.40.893306.2
C28+0.12521155.1915.51.100565.6
Table 2. Comparison of the W3 experimental data and fluid model properties.
ParametersW3Fluid ModelDifference (%)
Saturation pressure (kPa)492047802.85
Oil density at saturation pressure (kg/m3)806.4806.8−0.05
Viscosity at saturation pressure (mPa·s)1.761.750.57
Formation volume factor (m3/m3)1.121.110.89
API (°)3134.8−12.26
MMP with CO2 (kPa)14,19613,8722.28
Table 3. Minimum miscibility pressures (MMPs) calculated using the multiple mixing cell method with various mole fraction ratios of CO2 to CH4.
ComponentsMMP (kPa)
CO2 100%13,872
CO2 90% + CH4 10%21,346
CO2 80% + CH4 20%22,015
CO2 70% + CH4 30%22,622
Table 4. Initial and operating conditions used for the reservoir simulation.
ParametersValues
Depth (m)2811
Initial reservoir pressure (kPa)27,579
Reservoir temperature (°C)63
Permeability (m2)1.0 × 10⁻¹³
Porosity (%)0.25
Initial oil saturation, So (fraction)0.7
Connate water saturation, Sw (fraction)0.3
Producing bottom hole pressure (kPa)13,789

