Abstract
To address the energy shortage problem in rural areas, significant attention has been paid to off-grid solar power plants. However, ensuring the security of these plants, improving the utilization rate of energy and, finally, proposing a sustainable energy development scheme for rural areas are still challenges. Under this, this work proposes a novel regression model-based stand-alone power plant load management system. This not only shows great potential in increasing load prediction in the real-time process but also provides effective anomaly detection for improving energy efficiency. The proposed predictor is a hybrid model that can effectively reduce the influence of fitting problems. Meanwhile, the proposed detector exhibits an efficient pattern matching process. That is, for the first time, a support vector machine (SVM) and the fruit fly optimization algorithm (FOA) are combined and applied to the field of energy consumption anomaly detection. This method was applied to manage the load of an off-grid solar power plant in a rural area in Tanzania with more than 50 households. In this paper, both the prediction and detection of our method are proven to exhibit better results than those of some previous works, and a comprehensive discussion on the establishment of a real-time energy management system has also been proposed.
1. Introduction
Because of the general poverty in the rural areas of Africa, the most common pattern of settlement is small villages that are unable to access electricity [1,2]. To improve the quality of life of these local residents as quickly as possible, significant attention has been paid to off-grid solar power plants, which are easy to install and inexpensive. These off-grid power plants can help to reduce energy scarcity; however, there are two limitations to the application of off-grid solar power plants. (1) Different from on-line power plants, the supply of a stand-alone power plant is limited, and it is difficult to know how much power has been used and how long a battery can provide support, especially at night; (2) electrical load leakages and theft are notable problems all around the world [3,4].
Benefiting from the development of data science, machine learning technology-based smart energy management systems have become an emerging solution for this problem. A smart energy management system can not only protect the safety of the power grid, but also solve the long-term issue of well-skilled manpower shortages in Africa. To establish an effective and comprehensive energy management system, two critical functions are as follow: (1) effective anomaly detection. Detecting whether the current power usage is normal, and whether the system has any nontechnology loss or potential dangers is the crucial function to ensure the security of the power plant; (2) real-time electrical load prediction. With the development of demand-side management, to reduce energy waste and improve the utilization rate of energy, meeting the real-time balance between power generation and consumption has become the most ideal situation of energy use [5]. Therefore, a comprehensive power management framework should not only detect the current power usage but also provide future power consumption information.
Among all the machine learning algorithms applied in power girds, our previous study demonstrated the structure of the regression model-based power management method is a potential one that can satisfy power consumption forecasting and nontechnology loss detection at the same time, providing an effective solution for improving the development of smart grids [5]. However, three intrinsic problems in this method are as follows: (1) considering the effectiveness of the energy arrangement system in time, and the diversity of human life affected on power consumption data, general prediction models may not be accurate enough to precisely forecast future power usage in real time; (2) given that the prediction result might be imprecise, it seems not reasonable to use it as the only reference to detect nontechnical losses; and (3) a comprehensive energy management system is expected to not only manage the system but also provide the results with appropriate references to explain. These limitations obstacle the application of this method.
To address these gaps, this work proposes a new instructive off-grid power plant load management system that is based on a regression model; the method includes a real-time load predictor and a pattern matching-based load detector. The contributions of this study are as follows.
- As the proposed predictor is employed to forecast the electrical load of an off-grid power plant applied in a rural area of Africa, to improve the prediction accuracy in real-time processes and reduce the training cost, the proposed predictor is combined with an autoregressive integrated moving average (ARIMA) approach and the Bayesian information criterion (BIC), where BIC is used to achieve automatic model optimization in each step.
- The proposed anomaly detector integrates a support vector machine (SVM), the fruit fly optimization algorithm (FOA), and the cross-entropy loss function to create an independent and sample efficient detection approach to assess the correctness of load data.
- In this paper, a comprehensive analysis of the comparison results is proposed, and the practicability of each model in both prediction and detection is explained and discussed in detail, which provides a reference value for follow-up research.
- Our method is applied to detect the load of a standalone solar power plant in rural areas in Tanzania with more than 50 households (longitude: 36.908853, latitude −3.323141). The proposed system not only ensures the security of this power plant, but also brings the possibility of providing uninterrupted energy.
The rest of this paper is organized as follows. Section 2 discusses the previous works, and Section 3 provides the system overview and data exploration process. Section 4 and Section 5 introduce the proposed load predictor and anomaly detector. Section 6 discusses the experimental results and comparisons, and Section 7 provides a summary.
2. Related Work
Based on a previous study, the current electrical load management and detection methods can be categorized into two categories: (1) regression model-based and (2) classification model-based.
Different from the classification method that classifies the training data into different patterns to detect the data, the regression model-based method uses the data to learn the relationship of power consumption data with other variables or mine the intrinsic relationship of the data itself. After fitting the historical data, the model forecasts the future power consumption value. These prediction results serve as a baseline, and any data with large deviations from this line are identified as anomalies. By analyzing the relationship between the temperature and power usage of residents, Zhang et al. proposed a regression method-based anomaly detector [6]. Based on the view that the power consumption of users is affected by environmental factors, this work develops a novel approach to forecast the residential power load; however, the linear regression model used seems too simple to fit the complex load series well. Desouky et al. (2010) proposed a hybrid time series data prediction model, cascading ARIMA and Artificial neural networks (ANN) together for electrical load forecasting, which aims to address the prediction error of ARIMA associated with nonlinear regression [7]. This model combines the advantages of both linear and nonlinear models, which are widely used in the prediction of other time series data, such as temperature, stock, commodity prices and wind speed prediction [8,9,10,11]. One problem of this hybrid model is that ARIMA is a statistical model. Previous works only show how to apply it with ANN, which improves the shortages of ARIMA in nonlinear regression without giving a reasonable parameter selection process and ignores the impact of parameter selection on the results. With the development of deep learning technology, many deep learning-based methods have been developed and applied in electrical load anomaly detection. Fenza et al. developed a framework for using a long short-term memory (LSTM) network to detect the consumer profile [12]. Compared with general regression model-based detection methods, the developed deep learning prediction model displayed high prediction accuracy; however, the training cost and interpretability were not discussed.
The classification model-based method is another widely used method, which can be further classified into supervised classification model-based, unsupervised classification model-based and semi-supervised classification model-based methods.
Jokar et al. proposed supervised classification-based anomaly detector targets to detect electricity thefts in advanced metering infrastructure [13]. In the training phase, to decide the optimal number of patterns in the training dataset, K-means and the silhouette score are employed. The advantage of the supervised classification model-based method is that its results are referable. The model groups the data into different patterns, and any data are screened out to belong to a malicious pattern. It can easy to conclude that it is an anomaly. However, this approach is limited by its high training cost and low feasibility.
To overcome the limitation of the general supervised method in training cost and extend the feasibility of the classification model-based method, the unsupervised classification model is widely used in anomaly detection [5]. Fan et al. developed an unsupervised classification-based building electrical load monitoring system [14]. In the data exploration phase, the spectral density estimation and decision tree are introduced to identify the dominant periods of each appliance. Then, by using an autoencoder model to calculate the anomaly score for each observation, the data with anomaly scores higher than the threshold are identified as potential threats. Targeting the detection of anomalies in the outputs of a solar power plant, Pereora et al. developed an autoencoder-based anomaly detection framework [15]. The autoencoder model in their work has been improved by introducing a variational self-attention mechanism. In view of reducing the training cost of model, the unsupervised-classification-based method shows great potencies; however, that also means that the real application of this method can be limited, because of the absence of rational references.
Under this, a semi-supervised classification-based detection method is proposed to balance supervised classification and unsupervised classification. This approach addresses the training cost problem of supervised classification and improves the interpretability of the model [16]. Iwayemi and Zhou invented a semi-supervised classification-based residential appliance annotator [16]. Only a small amount of data is labeled, and dynamic time warping is employed to calculate the distance between these unlabeled data and all the labeled data. Wang et al. developed a semi-SVM-based load anomaly detector for detecting anomalies in home power usage [17]. By using the semi-supervised method to reduce the training cost of the method, this work also proposed a two-dimensional detection approach with improved monitoring performance with respect to electricity usage and the usage habits of home owners by providing detailed feedback. Semi-supervised classification-based anomaly detection methods not only reduce the training cost but also ensure a high detection accuracy; however, the limitations of such methods are as follows. First, the relationship between unlabeled data and labeled data needs to be known in advance. Second, compared with regression model-based methods, which can provide power consumption information to improve the energy efficiency of the system, the application of semi-supervised methods is limited. Table 1 exhibits the advantages and limitations of each method.

Table 1.
Summary of power consumption anomaly detection works.
3. System Overview
The proposed method is an upgrade that is based on our previous study. It is designed to share the same structure of management, containing a real-time predictor and a pattern matching-based anomaly detector, and be engined by a moving window in each step [5].To realize the real-time automatic model optimization, balance the prediction accuracy and calculation speed requirements, the moving window is designed to select the real-time load data (t) and the historical load data from the previous 24 h of data data(24 h) as the inputs of the predictor and to update the prediction model [5]. Figure 1 illustrates the framework of this method. After obtaining the prediction result, the proposed pattern matching-based anomaly detector classifies the data(t) and the prediction result. The final output is composed of the prediction result for the next step and the classification result of data(t).
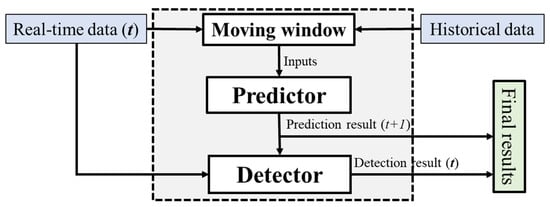
Figure 1.
The framework for the proposed power management system.
Routine Analysis
Our method is applied to manage the power usage of an off-grid power plant built in a rural village in Tanzania. This supplies the power usage of the whole area. After our practical investigation, the development of this village is relatively slow, and there is a large gap between the rich and the poor. Only a few families have basic amenities, such as lighting and speaker. Most families do not yet have electricity and lack a relatively basic understanding of electricity. Therefore, the supply to this village was powered by two sets of 150 W × 32 ea solar panels, equivalent to a total power of 9.6 kW. The energy generated by the solar panels is stored in two sets of 200 ah × 16 ea. batteries through two controllers. Figure 2a shows the five-day power plant load. According to our previous study, while the power usage data of a residential community can effectively reflect the living routine of residents, there are also tremendous irregular vibrations in the data series that reflect the diversity of residents’ lives [5]. Routine analysis is proposed based on the features of the time series.
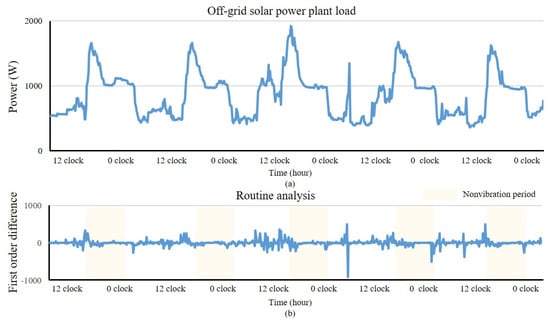
Figure 2.
The results of routine analysis. (a) Off-grid solar power plant load; (b) Routine analysis. As our method is applied in a rural area of Tanzania, the power consumption of the entire village is relatively low.
The residential load series changes dynamically over time. To better analyze load series characteristics from the perspective of a stationary state, routine analysis first calculates the x-order difference of the target series and employs the augmented Dickey–Fuller (ADF) to test whether the transformed x-order series is stationary [18]. Generally, x increases from 1 [19].
According to the ADF results, the first-order difference of the series (i.e., x = 1) is stationary, as shown in Figure 2b. Here, the period when the power usage of residents tends to be stable, is from 10 p.m. to 6 a.m., which can be considered a routine of residents in the village. During this period, most residents tend to sleep, so the effect of random events on power consumption is small. The anomaly detection rule in this period should be more rigorous than that in other periods. Therefore, in this study, routine analysis identifies this period as the non-vibration period. According to the results of routine analysis, the detection parameter is set to a variable value with time.
4. Real-Time Load Predictor
The proposed real-time load predictor is based on a part of our previous work, which employs ARIMA as its main regression model and uses BIC to avoid the over- or underfitting problems in real-time processes caused by the general training approach of ARIMA [5]. ARIMA (p, d, q) is an improved regression model, and its related initial model is the autoregressive moving average (ARMA). An ARMA (p, q) model can be expressed as Equation (1) [19]:
where , the value at time t, is a function of the previous p values, i.e.,. The errors at times are . p is the number of autoregressive terms; are the autoregressive coefficients; q is the lagged forecast error; and are the moving average coefficients.
ARIMA is used to address the limitation of ARMA that can only be applied in stationary series regression [19]. Therefore, in this study instead of fitting the data directly, ARIMA first transforms the nonstationary time series data into a stationary d-order difference series, where d is the order of the difference. Then, the obtained stationary d-order difference series is obtained and used for forecasting. In this study, based on the results of the routine analysis, d is set to 1.
However, according to our previous research and the results of routine analysis, even though the d-order difference series of the initial time series is stationary, in real-time time series prediction, ARIMA still has difficulty avoiding overfitting or underfitting problems in the real-time prediction process. The preset values of p and q may lead the ARIMA model to fail to precisely fit the latest historical load data in each step, which eventually led to a decline in prediction accuracy. Because of the nonstationary characteristics of the time series, any prior training and preset parameters of the model will lead to a decrease in the fitting degree. Therefore, BIC is introduced into real-time prediction to provide a real-time optimal regression model selection function, avoiding over- or underfitting problems caused by preset parameters [5].
The general idea of BIC is to reduce unrestricted models to accurate benchmarks by using prior information knowledge, reducing parameter uncertainty and improving prediction accuracy [19]. After scoring the fitting results of all the candidate models, the model with the lowest BIC score is selected as an indicator of the best fitting result. We assume that the maximum values of both p and q are n, yielding regression scenarios numbered from 1 to . We obtain BIC scores and then select the regression with the lowest BIC [5]. The BIC is [20]:
where is the maximum value of the model likelihood function, m is the sample size, and k is the number of model parameters. In this study, the sample size m is equal to , and k is equal to 2 (p and q). is set as , where U is a vector [0, k], i.e., [0,2] [5].
To improve the fitting degree and applicability of the ARIMA model in real-time prediction, the BIC is introduced for automatic model optimization. In each prediction step, the moving window selects the historical data from the past 24 h to update the ARIMA model, and the BIC is simultaneously utilized to select the optimal parameter set for the ARIMA model.
5. Pattern Matching-Based Load Anomaly Detector
The anomaly detector proposed in this study is designed to ensure the security of the stand-alone system. To both overcome the shortcomings of general regression model-based detection methods and the imprecision of the traditional supervised learning method, the detector is proposed with a hybrid combination construction [5]. Meanwhile, to further improve the detection accuracy, the detection threshold is designed to be automatically adjusted over time. The pattern matching model used in this study is an improved SVM composed of an SVM and the FOA.
5.1. Benign Data Training
The pattern matching-based load anomaly detector is developed with a “binary” rule, i.e., the patterns that do not match the defined normal behaviors are detected [21]. If the test data do not correspond to a learned power consumption pattern, the detector identifies the data as an anomaly. To reduce the training cost, the autoclustering method is introduced. The autoclustering method proposed in this study includes the k-means method with silhouette coefficients [17]. The k-means clustering is a widely used clustering method that is fast and simple [22]. Under the premise of knowing the number of target groups k, k-means can assign the data to k disjoint clusters. However, for new data when k is unknown, the application of k-means has limitations [5]. To overcome this limitation, the clustering evaluation method silhouette coefficient is employed. The silhouette coefficient can effectively reflect the similarity between objects in the same cluster and objects in other clusters. The silhouette coefficient ranges from −1 to +1, and the larger the value is, the higher the similarity. The silhouette coefficient is defined as [17]:
where a(k) is the mean intracluster distance and b(k) is the mean nearest-cluster distance for k. In this study, to verify the data efficiency of the proposed method, we only use five-day data for training, as shown in Figure 2a. We assume that the maximum number of groups is m and label clustering scenarios from 2 to m. For each scenario, k-means is used to cluster the data, and the silhouette coefficient is used to evaluate the result. After m clustering epochs, we obtain m silhouette coefficients, and the maximum value of the silhouette coefficient is selected to identify the best clustering result [22].
According to the autoclustering results shown in Figure 3, there are 4 patterns in the training data, labeled from 0 to 3. Patterns 2 and 3 mainly occur during the non-variation period; however, during the daytime, the patterns are irregular. The results of autoclustering are used as the training set for our method, and any data detected that are not associated with one of these patterns are identified as an anomaly.
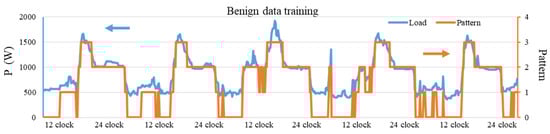
Figure 3.
The results of benign data training.
5.2. Pattern Matching Scheme
To reduce the influence of random events on predictions and further improve the detection accuracy, the pattern matching-based anomaly detector is composed of three parts: (1) result pattern matching, (2) the classification of pattern matching results, and (3) the evaluation of pattern matching results.
5.2.1. Result Pattern Matching
General regression model-based anomaly detectors detect anomalies by comparing the differences between the prediction result and real data. This approach cannot avoid the influence of prediction error on the detection results and lacks a reasonable interpretation process. In this study, pattern matching for the results is designed to first determine whether the prediction result and the real data can be classified into the same benign pattern. The classification model used is an SVM; such models have been widely used in many classification studies and flexibly strengthened by the kernel method. Notably, because the SVM operates locally and does not need to have the same functional form for all the data, the computational cost can be reduced [17].
However, in addition to the kernel function, the penalty factor C of the SVM also seriously affects its classification performance, and it is difficult to select due to the lack of a corresponding theoretical basis [21,23]. Therefore, to address this issue, the FOA is introduced to select the best C for the SVM according to the training data.
Fruit Fly Optimization Algorithm
The FOA is a swarm intelligence method that was first proposed by Pan [23]. The FOA provides a new method for global optimization by imitating the food-finding behavior of fruit flies. Fruit flies have superior vision compared to that of other species. The food-finding process of fruit flies can be summarized as follows. First, one fly smells the food source using its osphresis organ, and it flies to the food location. Second, after the fly gets close to the food, sensitive vision is used to find food and the locations of flocks of fruit flies. The fruit fly then travels in the optimal direction. To the food-finding process, the FOA can be divided into several steps, as follows [24]:
- Step 1.
- Randomly initialize the following parameters: initial location of fly {, }, maximum iteration number , population size , and random flight distance range .
- Step 2.
- Give the random flight direction and the distance for food searching for each individual fruit fly in a swarm.
- Step 3.
- Initially, the food cannot be seen; therefore, the distance to the origin is estimated (Dist), and the smell concentration judgment value (S) is calculated, which is the reciprocal of the distance:
- Step 4.
- Substitute the smell concentration judgment value (S) into the smell concentration judgment function to determine the smell concentration (Smelli) for a given location of the fruit fly:
- Step 5.
- The fruit fly with the maximum smell concentration among those in a fruit fly group is screened:
- Step 6.
- The best smell concentration value and coordinate (X, Y) are retained. The fruit fly group will use vision to fly toward this location:
- Step 7.
- Repeat the implementation of Steps 2–5 and then determine if the smell concentration is superior to the previous iterative smell concentration; if so, implement Step 6.
Fruit Fly Optimization Algorithm for Optimal Penalty Factor Selection of SVM
The FOA is used to select the best penalty factor for the SVM and to effectively improve the classification accuracy. The process of optimizing the SVM penalty factor with the FOA can be described as follows [21,23].
- Step 1.
- Generate the initial parameters: {, }, maximum iteration number , population size , and random flight distance range . Set the iteration variable t = 0, and perform the training process from Step 2 to Step 6.
- Step 2.
- Set the iteration variable: t = t + 1.
- Step 3.
- There are three substeps for this step.
- Step 3.1.
- Calculate the flight distance of food searching for fruit fly i, and calculate the smell concentration judgment value.
- Step 3.2.
- Input Si into the SVM to learn the training data (the processed data obtained in the benign data training phase). Use the trained SVM to reclassify the training data and obtain the prediction result series .
- Step 3.3.
- Compare the prediction result series with the real labeling of the training data . Calculate the smell concentration Smelli. The smell concentration judgment function used here is an accumulation function. L is the length of ; therefore, u ranges from 0 to L, and the function compares each term in the prediction result series with the real label of the training data . Initialize an initial integer a = 0; when , a = a + 1. Finally, return a as the smell concentration Smelli.
- Step 4.
- The offspring are generated according to Equations (4)–(6). Then, the offspring are input into the SVM, and the smell concentration value is recalculated.
- Step 5.
- If t = , the stop criterion is satisfied, and the best penalty factor for the SVM can be obtained. Otherwise, return to Step 2.
In this study, the SVM with the optimal penalty factor obtained from the FOA is called FOA–SVM, and in the implementation phase, both the prediction result and the real load value are classified by FOA–SVM.
5.2.2. Comparison of the Classification Results
According to the classification results obtained from the improved SVM, there are two cases.
- If the prediction result and the real load exhibit the same pattern (i.e., ), then the current load data are labeled normal.
- If and exhibit different learned patterns, there are three potential reasons for the difference: (1) the real data are still normal, but it is affected by daily random events, which is unpredictable; (2) a classification error occurs; or (3) the real data are abnormal, and nontechnology loss exists. Regardless of the reason for the difference, the algorithm uses a cross-entropy loss function to assess the classification result of real load data. Because the pattern-matching-based anomaly detector is designed to identify the normal power usage of the off-grid power plant, only the real value of the load is redetected. If no error is observed, then the classification result is determined to be acceptable.
5.2.3. Global Re-Evaluation Process
This step is developed from the perspective of global optimization [5]. The cross-entropy loss function is employed to determine whether the classification result of the real load is acceptable. The cross-entropy loss function is a popular classification/clustering result evaluation method that is simple, accurate, and adaptable for global optimization. The cross-entropy loss function is defined as [25]:
where y is a real label in the training dataset, is the classification of the model, and L is the size of the training dataset. The lower the cross-entropy loss is, the better the classification results. The steps in the function are as follows [5].
- Use the cross-entropy loss function to calculate the loss of the benign training data.
- Input the real load data and the matched pattern obtained from the improved SVM model into the training dataset (to build a new dataset), and use the (new) cross-entropy loss function to recalculate the loss.
- Calculate the difference in the losses ε and compare the difference with the thresholdc. If ε is smaller than the thresholdc, the classification result of the improved SVM is acceptable, and the load is benign. Otherwise, even if the improved SVM indicates that the load is associated with a learned pattern, the algorithm considers the load to be abnormal. Considering the normal power usage of humans over time, according to the results of variation analysis, the thresholdc in this study is set as a changeable constant that varies with time. The influence of this variable threshold on the detection accuracy will be discussed later. Figure 4 shows a flowchart of the pattern-matching-based anomaly detector.
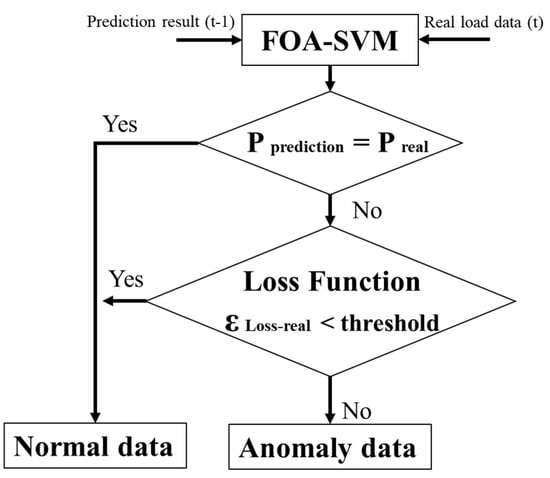 Figure 4. Flowchart of the pattern-matching-based anomaly detector.
6. Experimental Results and Comparison
We previously built three off-grid solar power plants in different rural areas of Tanzania [1,5,17]. Considering that these three off-grid power supply systems need to operate in harsh environments with limited skilled manpower for operation and maintenance, a power plant remote monitoring system was designed and implemented in each village to realize remote data transmission and control from Tanzania to South Korea. According to our previous study, the communication interval between Tanzania and South Korea, i.e., the prediction interval of the predictor, is 15 min [5].
In South Korea, to ensure the normal operation of these three power plants, three different kinds of power management systems were developed to detect the power usage of each power plant separately in real time. To further discuss the feasibility of each proposed method in future work, all the proposed methods were implemented in the same desktop computer with a 3.4 GHz Intel Core i5 processor, 4 GB RAM, and the Windows 10 operating system [5,17]. The proposed system in this work was applied to manage the load of the third off-grid solar power plant. The wiring diagram for this village is shown in Figure 5. In each step, if the method finds that the real-time load does not match any learned pattern, a warning will be issued to the manager of the system to remotely control the power plant in Tanzania.
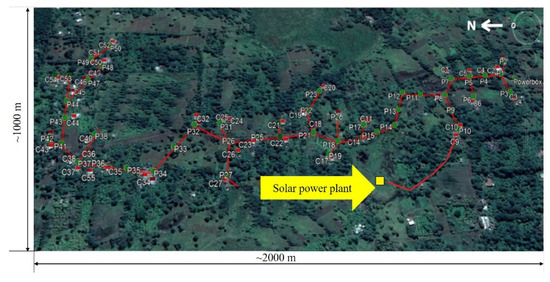
Figure 5.
Wiring diagram of the third village (from Google Maps). The third village is a rural area in Tanzania with more than 50 households and nearly 150 occupants.
To comprehensively demonstrate the contributions of this study, the experimental results and comparison sections illustrate and discuss the performance of the proposed method from three perspectives. The experimental results Section 6.1 presents the practical operation process of the method and shows how the proposed method achieves real-time electrical load prediction and high-accuracy anomaly detection. The comparison and evaluation Section 6.2 discusses the effect of the BIC on real-time prediction, the improvement of introducing FOA in the pattern matching process, and the influence of using a variable detection threshold on the detection results. To further evaluate the performance from the perspectives of prediction and detection, in the previous work comparison of evaluation Section 6.3, the proposed system is compared with some advanced methods discussed in the related work section.
6.1. Experimental Results
Our system is designed to propose an automatic and efficient electrical load management process. Through investigating the value of cross-entropy loss in normal power consumption over time, to balance the accuracy and sensitivity of detection, the thresholdc is set to a variable parameter with time. In the non-variation period it is set to 1, and in other periods, it is set to 3.
6.1.1. Test A
Figure 6 shows the user interface (UI) of this system. The current load is 976 W. In the previous step (t−1), the predictor forecasted the next load to be 947 W (yellow point), i.e., 479 W. Therefore, according to the results of the proposed pattern matching-based anomaly detector, both the real load of 976 W and the prediction result of 947 W are associated with pattern 1. Therefore, the power usage was normal. Moreover, a moving window was used to select the historical load data over the previous 24 h and update the predictor; the prediction indicated that the load at the next step would be 967 W. The prediction results first be used to check the remaining power of the battery to decide if it is necessary to shut off the power of some households. Then, it can also serve as a reference for the next detection step.
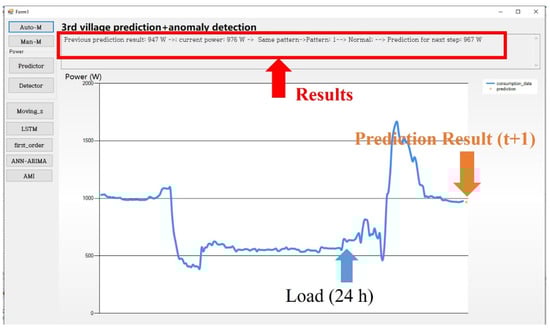
Figure 6.
The UI of the proposed method—test A.
6.1.2. Test B
Figure 7 shows another test result in the normal monitoring case, in which the prediction result was affected by normal random events in daily life. In this test, the previous prediction result was 751 W, but the current load (t) was 561 W. The two results exhibit two different patterns. Therefore, according to the detection rule of the proposed pattern matching-based anomaly detector, the cross-entropy loss function is employed to evaluate the classification result of the real load. The loss difference is smaller than 3. Therefore, the result is verified as acceptable. The difference between the prediction result and the real load is caused by normal variations in the residential electrical load. Finally, the predictor forecasts a prediction for the next step (t + 1) to be 596 W.
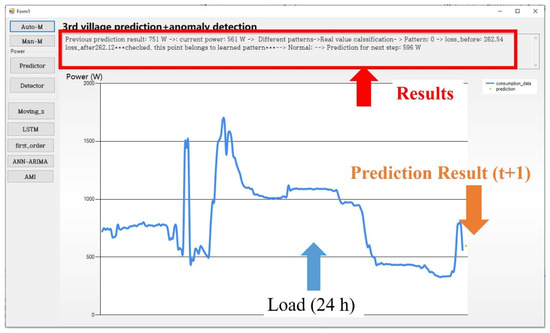
Figure 7.
The UI of the proposed method—test B.
6.1.3. Test C
Test C is designed to detect abnormal data. The results are shown in Figure 8. The prediction result in the previous step (t − 1) was 1679 W. However, the processed load (t) was 1085.7 W, which is associated with a different pattern than that for the previous prediction result. Then, the method calculates the classification loss difference for the processed load and finally determines that it is larger than the threshold in the non-variation period, i.e., the processed data do not constitute a benign sample. In this case, the system issues a warning and does not predict the load for the next step.
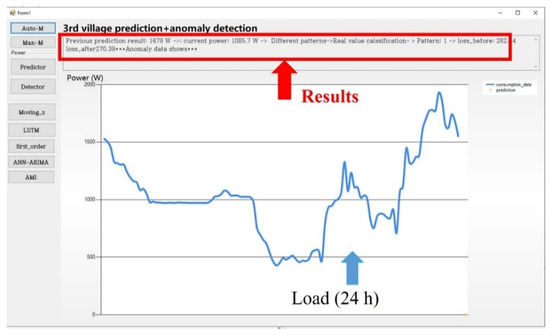
Figure 8.
The UI of the proposed method—test C.
6.2. Comparison and Evaluation
The main contributions of this study include the proposal of a comprehensive framework that improves both the prediction and anomaly detection performance of traditional methods. For predictions, we propose the BIC to improve the fitting degree of the ARIMA model and mitigate the over- or underfitting problems caused by fixed parameters. This approach not only improves the prediction accuracy of the model but also reduces the training cost of the ARIMA process. This new design approach combines different models to overcome their individual limitations. For anomaly detection, we developed an independent anomaly detection process. The advantages of this method are as follows. First, only a small amount of data is used to train the model and achieve a high detection accuracy. This approach reduces the training cost and provides useful guidelines for the application of machine learning technology. Second, this method overcomes the main issue of general methods of regression model-based anomaly detection, which over rely on the outputs of prediction models, by proposing a rational and reference-based detection process. To assess these contributions, a comparison is performed from two perspectives: (1) for prediction, a comparison of the original ARIMA model and the BIC-improved ARIMA model is made; (2) for anomaly detection, a comparison of a general SVM with a fixed detection threshold and the FOA–SVM approach with a variable detection threshold is made. The test data used in the comparisons are 5-day raw power plant data, and the training data used are the benign data introduced in Section 5.1 benign data training.
6.2.1. Prediction Results of Comparisons
After five days of uninterrupted operation, 24-h real-time electrical load predictions of the power plant load in our third village are obtained; the prediction results of the initial ARIMA model and the BIC-improved ARIMA model are evaluated and reported in Table 2. To comprehensively assess the performance of each model, we employed two goodness-of-fit regression measures. The common R-squared (R2) goodness-of-fit regression measure is employed to reflect how well observations are replicated by a model according to the proportion of the total variation in the outcome. R2 ranges from 0 to 1; the higher the score is, the better the fit [26]. The root-mean-square deviation (RMSD) is another widely used measure of the differences between values predicted by a model and observed values. Unlike R2, a low RMSD indicates a good fit [27].
Table 2.
Comparison of the results of the improved an autoregressive integrated moving average (ARIMA) model and the original ARIMA model.
Both the R2 and RMSD results show that the improved model proposed in this study displays better prediction performance than the single models. The design of a moving window and the use of the BIC in each step to automatically select the best parameters provide an efficient method of fitting the most recent historical data and compensating for prediction errors. This approach not only improves the prediction accuracy of the proposed predictor but also provides a novel training method to reduce the training cost of the model. Figure 9 shows the 5-day real-time prediction results for each method.
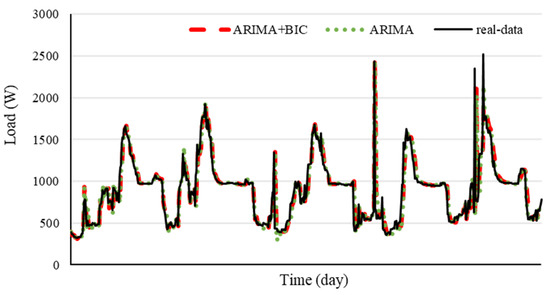
Figure 9.
Five-day real-time prediction results of each method.
6.2.2. Comparison of Anomaly Detection Results
The anomaly detection results are compared to discuss the effect of introducing the FOA to improve the classification performance of the SVM and the reasonability of using a variable detection threshold in the detection process. The detection results of the general SVM model with a fixed penalty factor and FOA–SVM with an optimized penalty factor are reported in Table 3.
Table 3.
Comparison of the results of the fruit fly optimization algorithm (FOA)-improved support vector machine (SVM) with variable parameters and the SVM model with fixed parameters.
The measure introduced is the F1 score, which provides a balanced evaluation of the overall performance of a classifier. The F1 score consists of precision p and recall r, which were developed by the information retrieval community. p, r, and the F1 score are defined as follows [17]:
where TP represents the number of time points at which normal data were correctly classified, FP represents the number of time points at which anomalous data were classified as normal, TN represents the number of time points at which anomalous data were considered abnormal, and FN represents the number of time points at which normal data were labeled abnormal [17].
The results show that FOA–SVM with variable parameters outperforms the general SVM with fixed parameters. In particular, according to the characteristics of residential electrical power usage, using variable parameters to increase the detection accuracy not only improves the performance of anomaly detection but also provides a rational detection approach that can be used as a reference for future research.
6.3. Previous Work Comparison and Evaluation
In this comparison, the improved scheme presented in this work for the original models is discussed, and the relevant contributions are noted. The comparison with previous work and corresponding evaluation are designed to further assess the contribution of our work in a comprehensive way by comparing our method with more advanced methods. Specifically, the results of IRLAD were compared with the results of Chou et al. [28], Jokar et al. [13], and Fenza et al. [12].
Chou et al. used a hybrid prediction model forecasting. In this comparison, the result of Chou et al. is also updated by the proposed moving window in each step, but the parameters are preset to 1. The Jokar et al. result is a classification model-based detector, and the classification model used is an SVM. The result of Fenza et al. result is a LSTM network-based anomaly detector. The structure of LSTM used is consistent with their work [22]. To further discuss the sample efficiency of each detection method, all the methods are designed to use the same training datasets. After one month of uninterrupted, 24-h real-time detection of the power plant load in the third village (from September 1, 2019, to October 1, 2019), the results of each detector are evaluated and reported in Table 4.
Table 4.
Comparison of the results between the proposed method and previously reported methods.
6.3.1. Prediction Accuracy
The similarity between the proposed real-time predictor and the results of Chou et al. is that the main regression models are all ARIMAs. However, for the optimization of prediction results, the two works choose totally different methods. The proposed predictor employs BIC to constitute a timely prediction error feedback mechanism and finally improves the prediction accuracy [5]. This improvement only aims at the linear regression part and does not explain the deficiency of the nonlinear part. By comparison, the results of Chou et al. introduced ANN to overcome the shortage of ARIMA in nonlinear regression, which provides a more complex structure of the prediction model. However, in terms of prediction accuracy, both R2 results and the RMSD values indicate that the proposed predictor outperforms the results of Chou et al.
The prediction model of the result of Fenza et al. is more complex and advanced. The LSTM provides higher prediction results than the hybrid model Chou et al. used. However, in terms of residential power consumption data, the traditional prediction model training method does not consider the influence of random events on model training, which may inevitably lead to an overfitting phenomenon. By comparison, the design of the moving window and the BIC provide an effective combination that minimizes the discrepancy between the observed values and the values obtained with the model.
6.3.2. Anomaly Detection Accuracy
As far as the prediction results are concerned, the results of either model are not satisfactory. This reflects the challenge of residential power consumption prediction. Therefore, because the prediction results are the main basis for detection with the results of Chou et al. and Fenza et al., the results are not accurate enough. However, it should be pointed out that the main purpose of the Fenza et al. method is to detect the change in the trend of users’ usage, not nontechnical loss.
In terms of classification-based methods, the work of Jokar et al. exhibits a lower F1 score than our method, which verifies the necessarily of introducing the pattern matching-based detection part and the sampling efficiency of the proposed method. Introducing an independent anomaly detection design into a general regression model-based load management framework not only improves the accuracy of detection that future increases the security of the system but also enhances the interpretability of this method. More importantly, for the same training set size, the accuracy of the proposed pattern matching-based anomaly detector is higher than that of the general supervised learning method, which proves that this combination of FOA–SVM and the cross-entropy loss function provides a novel detection approach that can effectively reduce the training cost and improve the detection accuracy. Finally, we conclude that the proposed method in this study yields the best prediction and anomaly detection performance among all the anomaly detectors.
7. Conclusions
To address the inherent limitation of the regression model-based detection method, this work proposed an improved scheme. While inheriting the advantages of the structure of the original model, both the performance of anomaly detection and prediction have been improved. From the perspective of load forecasting, the proposed predictor employs a moving window and an optimal regression model criterion to provide a prediction error feedback mechanism. This reduces the influence of the over- or underfitting problem in the real-time process. Through comparison with other advanced forecasting methods, it is proven that the proposed predictor has a simpler structure and better optimization effect and is more suitable for real-time prediction. Meanwhile, from the standpoint of anomaly detection, the proposed pattern matching-based anomaly detector is not only an independent but also a sample efficient detection method. By referring to a small amount of data, this method can effectively identify anomalies, save training cost, and improve the sample efficiency of the traditional classification model. Additionally, to simplify the operations and expand the application of machine learning technology, the proposed method is designed with visual display and function selection mechanisms, and it has low hardware requirements.
At the end of this work, by exhibiting a comprehensive comparison result, the limitations, advantages, and practicability of each method in the application of real-time load forecasting and detection process have been discussed. This provides a reference value for follow-up research. The proposed method is believed to be used not only in off-grid rural areas but also in developed areas to improve the energy utilization rate and ensure the safety of the power grid.
This work is our third study on electrical load anomaly detection of off-grid power plants in Africa. Our future work will also focus on comparing these different methods applied to various power plants. We hope to identify the best anomaly detection scheme for off-grid power plant loads as soon as possible and further improve the development of demand side management research.
Author Contributions
This work is designed, installed, tested, and completed by X.W., the first author of this article. The second author, H.S.R., and the corresponding author, S.-H.A. are responsible for supervision. Meanwhile, H.S.R. is also the project manager and the chief of the Innovative Technology and Energy Center. All authors have read and agreed to the published version of the manuscript.
Funding
This research was supported by the International S&T Cooperation Program through the National Research Foundation of Korea (NRF) funded by the Ministry of Science, ICT & Future Planning (MSIP) (NRF-2017K1A3A9A04013801) and the Basic Research Lab Program through the NRF funded by the MSIT (2018R1A4A1059976).
Conflicts of Interest
The authors Xinlin Wang, Herb S. Rhee, and Sung-Hoon Ahn certify that they have NO affiliations with or involvement in any organization or entity with any financial interest, or non-financial in the subject matter or materials discussed in this manuscript.
References
- Wang, X.; Ha, B. Low-cost far-field wireless electrical load monitoring system applied in an off-grid rural area of Tanzania. Sustain. Cities Soc. 2020, 59, 102209. [Google Scholar] [CrossRef]
- Energy Information Administration (US). International Energy Outlook 2016, with Projections to 2040; Government Printing Office: Washington, WA, USA, 2016.
- Hansen, U.E.; Pedersen, M.B.; Nygaard, I. Review of solar PV policies, interventions and diffusion in East Africa. Renew. Sustain. Energy Rev. 2015, 46, 236–248. [Google Scholar] [CrossRef]
- World Loses $89.3 Billion to Electricity Theft Annually, $58.7 Billion in Emerging Markets. Available online: https://www.prnewswire.com/news-releases/world-loses-893-billion-to-electricity-theft-annually-587-billion-in-emerging-markets-300006515.html/ (accessed on 17 June 2020).
- Wang, X.; Ahn, S.H. Real-time prediction and anomaly detection of electrical load in a residential community. Appl. Energy 2020, 259, 114145. [Google Scholar] [CrossRef]
- Zhang, Y.; Chen, W.W.; Black, J. Anomaly detection in premise energy consumption data. In Proceedings of the 2011 IEEE Power and Energy Society General Meeting, Quebec, QC, Canada, 2–6 August 2011. [Google Scholar]
- El Desouky MMEK, A.A. Hybrid adaptive techniques for electric-load forecast using ANN and ARIMA. IEE Proc. Gener. Transm. Distrib. 2010, 147, 213–217. [Google Scholar] [CrossRef]
- Hippert, H.S.; Pedreira, C.E.; Souza, R.C. Combining neural networks and ARIMA models for hourly temperature forecast. IEEE Comput. Soc. 2000, 4, 414–419. [Google Scholar]
- Adebiyi, A.A.; Adewumi, A.O.; Ayo, C.K. Comparison of ARIMA and artificial neural networks models for stock price prediction. J. Appl. Math. 2014, 2014, 7. [Google Scholar] [CrossRef]
- Liu, H.; Tian, H.; Li, Y. Comparison of two new ARIMA ANN and ARIMA-Kalman hybrid methods for wind speed prediction. Appl. Energy 2012, 98, 415–424. [Google Scholar] [CrossRef]
- Naveena, K.; Singh, S.; Rathod, S.; Singh, A. Abhishek Singh Hybrid ARIMA-ANN Modelling for Forecasting the Price of Robusta Coffee in India. Int. J. Curr. Microbiol. Appl. Sci. 2017, 6, 1721–1726. [Google Scholar] [CrossRef]
- Fenza, G.; Gallo, M.; Loia, V. Drift-aware methodology for anomaly detection in smart grid. IEEE Access 2019, 7, 9645–9657. [Google Scholar] [CrossRef]
- Jokar, P.; Arianpoo, N.; Leung, V.C. Electricity theft detection in AMI using customers’ consumption patterns. IEEE Trans. Smart Grid 2015, 7, 216–226. [Google Scholar] [CrossRef]
- Fan, C.; Xiao, F.; Zhao, Y.; Wang, J.Y. Analytical investigation of autoencoder-based methods for unsupervised anomaly detection in building energy data. Appl Energy 2018, 211, 1123–1135. [Google Scholar] [CrossRef]
- Pereira, J.; Margarida, S. Unsupervised anomaly detection in energy time series data using variational recurrent autoencoders with attention. In Proceedings of the 17th IEEE International Conference on Machine Learning and Applications, Orlando, FL, USA, 17–20 December 2018. [Google Scholar]
- Iwayemi, A.; Zhou, C. SARAA: Semi-supervised learning for automated residential appliance annotation. IEEE Trans. Smart Grid 2015, 8, 779–786. [Google Scholar] [CrossRef]
- Wang, X.; Yang, I.; Ahn, S.H. Sample Efficient Home Power Anomaly Detection in Real Time Using Semi-Supervised Learning. IEEE Access 2019, 7, 139712–139725. [Google Scholar] [CrossRef]
- Owoye, O. The causal relationship between taxes and expenditures in the G7 countries: Cointegration and error-correction models. Appl. Econ. Lett. 1995, 2, 19–22. [Google Scholar] [CrossRef]
- Nie, H.; Liu, G.; Liu, X.; Wang, Y. Hybrid of ARIMA and SVMs for short-term load forecasting. Energy Procedia 2012, 16, 1455–1460. [Google Scholar] [CrossRef]
- Findley, D.F. Counterexamples to parsimony and BIC. Ann. Inst. Stat. Math. 1991, 43, 505–514. [Google Scholar] [CrossRef]
- Chandola, V.; Banerjee, A.; Kumar, V. Anomaly detection: A survey. ACM Comput. Surv. 2009, 41, 1–58. [Google Scholar] [CrossRef]
- Amorim, R.C.; Hennig, C. Recovering the number of clusters in data sets with noise features using feature rescaling factors. Inf. Sci. 2015, 324, 126–145. [Google Scholar] [CrossRef]
- Zhang, Q.; Fang, L.; Su, S.; Lv, Y. Parameters Optimization of SVMBased on Improved FOA and Its Application in Fault Diagnosis. JSW 2015, 10, 1301–1309. [Google Scholar] [CrossRef]
- Pan, W.T. A new fruit fly optimization algorithm: Taking the financial distress model as an example. Knowl. Based Syst. 2012, 26, 69–74. [Google Scholar] [CrossRef]
- Kroese, D.P.; Rubinstein, R.Y.; Taimre, T. Application of the cross-entropy method to clustering and vector quantization. J. Glob. Optim. 2007, 37, 137–157. [Google Scholar] [CrossRef]
- Glantz, S.A.; Slinker, B.K.; Neilands, T.B. Primer of Applied Regression and Analysis of Variance; McGraw-Hill: New York, NY, USA, 1990. [Google Scholar]
- Pontius, R.G.; Thontteh, O.; Chen, H. Components of information for multiple resolution comparison between maps that share a real variable. Environ. Ecol. Stat. 2008, 15, 111–142. [Google Scholar] [CrossRef]
- Chou, J.S.; Telaga, A.S. Real-time detection of anomalous power consumption. Renew. Sustain. Energy Rev. 2014, 33, 400–411. [Google Scholar] [CrossRef]
© 2020 by the authors. Licensee MDPI, Basel, Switzerland. This article is an open access article distributed under the terms and conditions of the Creative Commons Attribution (CC BY) license (http://creativecommons.org/licenses/by/4.0/).