Abstract
This study evaluates the operational efficiency of accredited private healthcare facilities in Italy, a sector increasingly complementing the public National Health Service. Unlike previous studies that aggregate public and private providers, this research focuses exclusively on private facilities, providing a consistent and detailed evaluation of their performance. Utilizing game-theoretic cross-efficiency Data Envelopment Analysis (DEA) combined with Classification and Regression Tree (CART) analysis, this study identifies endogenous and exogenous efficiency drivers. Results indicate that private facilities operate at high efficiency levels (mean cross-efficiency = 0.923), with smaller facilities outperforming larger ones, though resources remain underutilized. Inactive ward and bed non-occupancy rates emerge as key inefficiency factors. Regional analysis highlights minimal disparities between the north–center and south, but significant local variations persist, shaped by governance, funding allocation, and institutional frameworks. This study also identifies an “efficiency paradox”, as in deficit regions, private expenditure correlates with higher efficiency, whereas in surplus regions, greater spending does not necessarily improve performance. These findings provide actionable insights for healthcare managers and policymakers, emphasizing the need to maximize capacity utilization, optimize staffing, and structure public–private partnerships strategically. Methodologically, integrating game cross-efficiency DEA with CART strengthens accuracy, offering a robust tool for benchmarking and improving private healthcare performance.
1. Introduction
1.1. Background and Main Focus
This paper focuses on the Italian private healthcare sector. Evaluating the performance of private healthcare facilities has become an important policy issue, as they play a crucial role in the overall functioning of the national healthcare system.
Italy has a significant number of private healthcare facilities (Signorelli et al., 2020). In recent years, there has been a trend towards their expansion and modernization (Felisini & Salsano, 2024). Investment in new technologies, improved patient services, and the development of private hospital chains are part of this trend. The COVID-19 pandemic has also influenced the private healthcare sector, with increased demand for private services in some areas and greater collaboration between public and private facilities to manage the crisis. Private facilities play an important role in complementing the public healthcare system, the National Health Service (Servizio Sanitario Nazionale, SSN) (Delai, 2023). The Italian government’s decision to reduce funding for its health system in the recent years has resulted in a significant decrease in the SSN’s capacities, particularly in the number of beds and doctors available in public facilities (Buzelli & Boyce, 2021). In 2012, the number of hospital care facilities was 1091, while the number of hospital beds amounted to 232,652 units (Ministero della Salute, 2015). In 2021, hospital care utilized 996 facilities, with 51.3 percent being public and the remaining 48.7 percent being accredited private. The SSN had over 203,800 beds for ordinary inpatient care, with 20.8% located in accredited private facilities. Additionally, there were 11,906 day-hospital beds, almost entirely public (89.1%), and 8253 day-surgery beds, predominantly public (76.9%) (Ministero della Salute, 2023). Larger facilities are primarily concentrated in Lazio and Lombardy, regions where 39 out of the 64 facilities with more than 200 beds are located (57%) (Bobini et al., 2020). Thus, in Italy, several people opt for private healthcare services, especially for elective procedures, specialized care, or to avoid long waiting times in the public system.
Private facilities often offer shorter wait times, more personalized care, and amenities that attract patients who can afford to pay for these services, either out-of-pocket or through private insurance (Bjorvatn, 2018; Garavaglia et al., 2011; Kruse et al., 2018). While the SSN provides comprehensive coverage for essential healthcare services, private facilities often fill gaps in the system, particularly in areas like elective surgery, specialist consultations, and advanced diagnostics. They also contribute to reducing the burden on public hospitals by providing alternative options for patients, which can help to manage demand and reduce waiting times in the public sector (de Belvis et al., 2022; Maietti et al., 2023; Toth, 2020).
1.2. The Healthcare Regulatory Context in Italy
The Italian National Health Service is a publicly funded system that ensures all citizens and residents have access to essential healthcare. It is funded mainly through general taxation and is based on principles of universality, equity, and solidarity. Indeed, Article 32 of the Italian Constitution states the following: “The Republic safeguards health as a fundamental right of the individual and as a collective interest, and guarantees free care to the indigent. No one may be obliged to undergo a specific medical treatment except by law. In no case may the law violate the limits imposed by respect for the human person”. In 2023, the state contributed EUR 128.87 billion to the SSN, with EUR 864 million allocated specifically for innovative and oncology drugs. The 2022 Budget Law outlined an annual increase of EUR 2 billion (approximately 1.6%) for the period of 2022–2024 (AGENAS, 2024).
The SSN was formally established in 1978, following a major healthcare reform that unified a fragmented system of social and mutual aid schemes into a single, national service (Law No. 833 of 23 December 1978 “Establishment of the National Health Service”) (Mapelli, 1999). This reform guaranteed universal access to essential healthcare and laid the foundation for a publicly funded, regionally administered system. Subsequent reforms, particularly in the 1990s and 2000s, strengthened regional autonomy, clarified the responsibilities of central and local authorities, and introduced mechanisms for quality control and efficiency monitoring (Delegation Law No. 421 of 23 October 1992 “Health System Reform and Regional Decentralization” and Legislative Decree No. 229 of 19 June 1999 “Reorganization of Local Health Authorities and Strengthening of Managerial Autonomy”).
The SSN follows a decentralized structure. While the central government sets national health objectives, defines essential services, and establishes regulatory frameworks, regional authorities are responsible for planning, financing, and delivering healthcare services. They manage public hospitals, primary care networks, community health services, and emergency care and oversee staffing and resource allocation. At the local level, Local Health Authorities (ASL) coordinate primary care, preventive programs, and patient pathways. General practitioners and pediatricians act as “gatekeepers”, referring patients to specialist doctors or hospitals when needed. Hospitals vary in size and specialization, from local facilities offering basic care to large regional and university hospitals providing highly specialized services. Quality control and performance monitoring are integral to the SSN. Hospitals and clinics must meet established standards, and regional authorities track key indicators such as patient outcomes, waiting times, and resource efficiency. Regional flexibility in implementation can lead to differences in access, quality, and efficiency across the country. Additional information on the reform of the SSN can be found in Barbetta et al. (2007), who discuss the change in hospital funding since 1978, transitioning from cost-based and bed-day payments to a prospective payment system (PPS) to enhance efficiency and decrease costs in both public and private hospitals.
Although the SSN is primarily a public entity, it collaborates with accredited private facilities that provide services reimbursed under SSN regulations. This integration allows private providers to complement public care, improve efficiency, and help regions meet healthcare objectives while remaining under regulatory oversight. The accredited private healthcare sector is a unique component of the Italian healthcare system. Private facilities that are authorized through regional accreditation provide services on behalf of the SSN, operating under the same conditions as public providers while maintaining managerial flexibility. Unlike social insurance-based models in countries like Germany or Switzerland, in Italy these facilities operate within a universal, tax-funded system, with accreditation serving as both a quality standard and a regional planning tool. Accredited private providers significantly contribute to hospital beds and specialist services, with regional variations, and play a crucial role in ensuring access to Essential Levels of Care (LEA), reducing waiting lists, and supporting public services throughout the territory.
Private healthcare facilities in Italy vary in size and scope, ranging from small clinics to large hospitals, and they offer a wide range of medical services, including specialized care, diagnostic services, and elective surgeries. A significant proportion of private healthcare facilities in Italy are accredited by the SSN, meaning they meet specific quality standards and can provide services that are reimbursed by the public healthcare system (Ministero della Salute, 2023). This allows patients to access care in private facilities without bearing the full cost, as the SSN covers part or all of the expenses, depending on the service and the patient’s circumstances. The distribution and prevalence of private healthcare facilities vary significantly across Italy. Northern and central regions, such as Lombardy, Emilia-Romagna, Tuscany, and Lazio, tend to have a higher concentration of private healthcare providers (de Belvis et al., 2022; Ministero della Salute, 2023). This is partly due to the wealthier populations in these areas, which can support a more extensive private healthcare sector. In contrast, southern regions and rural areas may have fewer private facilities, although they still play an essential role in the local healthcare ecosystem.
Against this backdrop, the main objective of this study is to evaluate the operational efficiency of private healthcare facilities accredited by the SSN in Italy. Specifically, the aim is to assess how resources are utilized, identify differences in efficiency among facilities, and highlight the main factors that influence their performance.
1.3. Measuring Efficiency in Private Healthcare Facilities
Measuring efficiency in private healthcare facilities is crucial for several reasons (Cantor & Poh, 2018). Efficiency measurement helps private healthcare facilities manage and control costs (Choi et al., 2017). Healthcare is resource-intensive, and inefficiencies can lead to unnecessary expenses. By identifying and addressing inefficiencies, facilities can reduce costs and improve their financial performance. Private healthcare facilities operate in a competitive environment where profitability is essential. Efficient operations lead to better resource utilization, higher patient volumes, and improved financial outcomes, all of which contribute to the bottom line (Flokou et al., 2011). Efficiency is key to the long-term sustainability of a private healthcare facility (Martini et al., 2014). It ensures that the facility can continue to operate effectively, grow, and adapt to changes in the healthcare landscape. For private healthcare facilities looking to expand, measuring and improving efficiency is crucial. Efficient operations provide a solid foundation for scaling services to new locations or increasing capacity. Efficient healthcare delivery can enhance the quality of care. By streamlining processes, reducing wait times, and ensuring that resources are used effectively, private healthcare facilities can provide better care, leading to improved patient outcomes and satisfaction. Measuring efficiency often involves assessing compliance with clinical guidelines and standards, which are directly linked to the quality of care. This ensures that patients receive appropriate and timely care, reducing the likelihood of errors or complications. Patients in private healthcare facilities often expect high standards of service (Toth, 2020). Efficient operations mean shorter waiting times, better coordination of care, and a smoother patient experience, which are key factors in patient satisfaction (Domenighetti et al., 2010; Pianori et al., 2020). Patient satisfaction is closely tied to the reputation of a healthcare facility. Efficient services contribute to a positive reputation, which is essential for attracting and retaining patients in a competitive market. Efficiency measurement helps ensure that resources such as staff, equipment, and facilities are used optimally (Grosskopf & Valdmanis, 1993). This is particularly important in private healthcare, where resources are often more limited than in public systems. By understanding where efficiency can be gained, private healthcare facilities can make informed decisions about where to invest in new technologies, training, or infrastructure improvements. Private healthcare facilities are often subject to stringent regulatory requirements. Measuring efficiency can help ensure compliance with these standards, avoiding potential penalties or legal issues. Efficiency metrics are often part of reporting requirements to stakeholders, including investors, insurers, and accreditation bodies.
In numerous studies, Data Envelopment Analysis (DEA) has been the most frequently utilized method for quantifying efficiency in the healthcare sector (Kohl et al., 2019; Puiu & Bîlbîie, 2025). DEA is a powerful and widely used non-parametric method for benchmarking healthcare facilities due to its ability to evaluate the relative efficiency of decision-making units (DMUs), such as hospitals, clinics, or departments, which are modeled through a production function (Dyson & Shale, 2010; Jung et al., 2023; Kohl et al., 2019; Y. A. Ozcan, 2014). Compared to other methods used to estimate efficiency, such as parametric methods like Stochastic Frontier Analysis, DEA has the advantage of being able to model production functions with multiple inputs and outputs without requiring any prior information about the relationship between them (Zhu, 2003). In DEA, the efficiency of a DMU is defined as the ratio of the weighted sum of outputs to the weighted sum of inputs. It is computed by comparing it to a “best practice” frontier formed by the most efficient DMUs in the dataset. An optimization problem for each DMU is solved by finding the optimal weights for inputs and outputs that maximize the efficiency score.
Specifically, scholars have employed DEA to evaluate the operational efficiency of hospitals by comparing resources (e.g., doctors, beds, and equipment) to outputs (e.g., number of patient admissions) (Nayar et al., 2013), to assess the performance of primary care units or general practitioners by analyzing the relationship between resources utilized and the health outcomes achieved (Oikonomou et al., 2016; Ramírez-Valdivia et al., 2011; Salinas-Jiménez & Smith, 1996), to analyze the efficiency of public health initiatives, such as vaccination campaigns or disease prevention programs by examining costs against health benefits (Maragos et al., 2021; Klumpp et al., 2022), to track efficiency changes over time within the healthcare sector (Mitropoulos, 2022; Valdmanis et al., 2017), to assess the impact of policy changes or technological advancements (Chern & Wan, 2000; Tiemann & Schreyögg, 2012), to benchmark best practices identifying efficient units that can serve as benchmarks for less efficient units, enabling targeted improvements (Bayley et al., 2022; Li & Dong, 2015), and to provide support to policymakers in understanding how well resources are utilized and where improvements or reallocations are needed (Campos et al., 2016; Jordi et al., 2020).
Systematic reviews of the literature on healthcare efficiency and productivity have highlighted that the examination of the impacts of privatization on hospital efficiency is one of the most commonly studied topics by scholars (Andrews & Emvalomatis, 2024; Giancotti et al., 2017; Nepomuceno et al., 2022; Puiu & Bîlbîie, 2025). Particularly, they have tried to understand whether private healthcare facilities are more efficient than public ones or vice versa (Cantor & Poh, 2018; Kruse et al., 2018; Molander, 2025; Tiemann & Schreyögg, 2012; Tynkkynen & Vrangbæk, 2018). However, the results reported in the literature are often inconsistent. Some scholars have found that private hospitals are more efficient than public hospitals (Chang et al., 2004). Conversely, other scholars have found that public hospitals are more efficient than private ones (Chen et al., 2019; Nayar et al., 2013). In some studies, no important efficiency difference between privately and publicly owned hospitals emerged (Gruca & Nath, 2001; Kruse et al., 2018). As Barbetta et al. (2007) emphasized, variations in economic performance across different ownership typologies are more influenced by the institutional environments in which they operate than by the incentive structures inherent in their ownership models. In addition, because of their distinct goals and operational strategies, comparing public and private healthcare facilities may not always be a straightforward task, as a different set of input and output variables should be used for the two types of facilities (Cavalieri et al., 2018).
Despite the increasing focus on efficiency and productivity in healthcare, the private sector of the system has not been the sole focus of scholarly investigation. This limited focus represents a gap in the literature because the private sector plays a distinctive and increasingly relevant role in shaping the performance of healthcare systems, particularly in Italy. Therefore, this study focuses solely on private healthcare facilities to ensure a more consistent assessment of their efficiency.
Moving to the national context, several studies have estimated the efficiency of the Italian healthcare system by implementing DEA, taking in account its specific institutional and organizational features. Daidone and D’Amico (2009) investigated the relationship between specialization and technical efficiency considering a sample of hospitals in the Latium region by analyzing a six-year panel database from 2000 to 2005, taking into account case-mix and environmental variables. Differences between private, public, and not-for-profit facilities were considered. Nuti et al. (2011) evaluated the technical efficiency of 12 Tuscan Local Health Authorities and examined its relationship with quality, appropriateness, and costs of care. Their analysis covered services such as prevention, primary care, pediatrics, diagnostics, outpatient, and hospital care, using data from 2005 to 2007, with a specific focus on 2007. De Nicola et al. (2014) employed a two-stage bootstrapped DEA to assess the impact that changes in the Italian health system induced by the national reform of the sector had on the efficiency of the regional healthcare services in Italy and identified organizational models achieving the best performance. Mancuso and Valdmanis (2016) employed a two-stage DEA bootstrapped procedure to investigate the relationship between care appropriateness and productivity evolution in public hospital services across the 20 Italian Regional Health Systems for the period 2008–2012. Guerrini et al. (2018) investigated the determinants of efficiency of the regional health system in the Veneto region between 2011 and 2012, differentiating between private and public hospitals. Giancotti et al. (2018) calculated the technical and scale efficiency scores for a sample of 41 Italian public hospitals during the period 2010–2013 and assessed the effect of size on hospital efficiency. Sapienza and Matranga (2018) evaluated the variation of efficiency and organizational appropriateness of healthcare delivery in 118 short-term, acute-care, non-teaching-and-research Sicilian hospitals from 2008 to 2010 before and after the regional reform of the healthcare sector, and showed patterns associated with different types of healthcare delivery organizations. Piubello Orsini et al. (2021) estimated the efficiency of 43 public hospitals in the Veneto region, including quality outputs in model specification and explored inefficiency determinants, and efficiency changes over time between 2018 and 2019. Guccio et al. (2024) employed DEA and a counterfactual design to evaluate the effects of austerity measures in Italy introduced in 2007 (recovery plans) to reduce regional healthcare budget deficits; their sample included administrative data from a large panel of hospitals covering the period 2003–2010. Giuliani and Gitto (2025) analyzed the link between hospital specialization and efficiency in Italy using data from 2000 to 2019; they applied a two-stage DEA procedure with truncated regression to four hospital types (hospital enterprises, teaching hospitals, directly managed hospitals, and institutes for scientific research and treatment). Even among Italian scholars, although several studies have compared the efficiency of public and private healthcare facilities, little attention has been devoted to assessing the performance of private facilities alone and to identifying the specific factors driving their performance. This study seeks to address this specific gap.
Scholars employing a non-parametric DEA-based approach have primarily relied on traditional DEA methods, where each healthcare facility is assigned personalized weights for inputs and outputs to present itself as efficiently as possible while also complying with constraints that ensure no facility is perceived more efficient than others. In this sense, the efficiency evaluation of healthcare facilities in traditional DEA is self-referential, and they may receive “inflated” efficiency scores, leading to an upward bias. To avoid such bias, this study implements a game cross-efficiency DEA approach, adding peer evaluation to self-evaluation (Liang et al., 2008). In game cross-efficiency DEA, each facility is evaluated using the optimal weights of other facilities, giving an average score that is more discriminatory and reduces bias by considering multiple perspectives instead of just self-optimized weights (Wu et al., 2009). Additionally, the game model explicitly blends self-interest with mutual agreement. Borrowing from game theory, this model treats each healthcare facility as a player in a competitive game in search of the “strategic equilibrium”. Facilities choose weights not only to maximize their own efficiency but also considering how others will respond. The resulting efficiency scores are then less sensitive to extreme or manipulative weight choices, leading to rankings that are often more stable and credible for healthcare policy. Healthcare policy typically aims to achieve multiple objectives simultaneously, including ensuring high quality, promoting efficient resource utilization, and maintaining sufficient capacity to meet demand, rather than focusing solely on one aspect. In traditional DEA models, there is no assurance that all these objectives will be given equal consideration, as the weighting system may neglect important dimensions. In contrast, game cross-efficiency DEA seeks to find a strategic balance by ensuring that the weights reflect both individual performance priorities and overall system acceptability. By applying the game cross-efficiency DEA approach, this study provides a more robust assessment of private healthcare facilities.
Like other studies, this paper aims to identify the factors that have the greatest impact on efficiency levels. However, unlike previous studies, it considers both exogenous and endogenous factors. Exogenous factors are those outside the control of facility managers, while endogenous factors are controlled by them and are used in the DEA model. Classification and Regression Tree (CART) analysis was utilized to identify the most influential endogenous factors, while the non-parametric Kruskal–Wallis test was used to evaluate the impact of exogenous factors on efficiency.
In summary, this study aims to make several contributions to the existing literature on efficiency analysis in the healthcare sector. First, it is the first research work that focuses exclusively on evaluating private healthcare efficiency. Second, from a methodological perspective, this paper measures the efficiency of healthcare facilities using the game cross-efficiency approach, highlighting the limitations of traditional DEA techniques. Third, it identifies both endogenous and exogenous non-controllable factors that could affect the efficiency of healthcare facilities. Finally, this study provides an updated performance analysis of accredited private healthcare facilities in Italy. By examining efficiency at both the facility and regional levels, it offers more nuanced insights and a stronger contribution to policymaking and the management of private healthcare facilities.
The rest of this paper is organized as follows. Section 2 illustrates the game cross-efficiency DEA method and presents both the endogenous variables used in the specification of healthcare facility production technology and the exogenous variables that may impact facility efficiency. In the same section, the sample and data sources are introduced. Section 3 and Section 4 describe and discuss the main results of this study, as well as policy and management implications, respectively. Finally, Section 5 summarizes the main findings and limitations of this study.
2. Materials and Methods
2.1. The DEA Game Cross-Efficiency Methodology
DEA is particularly useful in measuring efficiency in the healthcare sector for several reasons (Ferreira et al., 2023; Y. A. Ozcan, 2009). First, it can handle multiple inputs (e.g., staff, equipment, and financial resources) and outputs (e.g., patient outcomes and service quality) simultaneously, providing a comprehensive efficiency assessment. Second, it evaluates facility efficiency relative to the best-performing peers, offering clear benchmarks. Third, it identifies sources of inefficiency, guiding targeted improvements in resource management and operations. Fourth, DEA does not require a predefined production function, which is advantageous given the complexity of healthcare processes. Finally, it supports policy and management decisions by highlighting areas for efficiency gains and can be applied in both cross-sectional and longitudinal analyses to monitor performance over time.
In this study, each healthcare facility is linked to a production function that produces s outputs by combining m inputs. For example, inputs may include beds, doctors, and nurses, while outputs could be patient admissions and hospitalization days. Traditionally, each production unit is referred to as a DMU. The ability of a DMU to generate certain amounts of outputs with minimal consumption of inputs, or to produce the maximum amounts of outputs while using the same amounts of inputs, regardless of input and output prices, is known as technical efficiency (Cook & Seiford, 2009). DEA calculates the efficiency of DMU k as the maximum ratio of weighted outputs to weighted inputs, under the condition that other DMU efficiencies are less than or equal to 1. The DEA algorithm determines the weights for all outputs and inputs that maximize DMU efficiencies through a self-evaluation process. DEA employees a linear program to identify efficient DMUs from the entire sample of DMUs under evaluation. These efficient DMUs are then combined to generate an efficient frontier that is used as a benchmark to measure the relative efficiency of inefficient units (Cooper et al., 2007).
While basic DEA is effective in identifying the best DMU from a set and ranking those under the efficiency frontier, it lacks discriminating power. In basic DEA, each DMU is evaluated with its most favorable weights, heavily weighting inputs and outputs favorable to a particular DMU, while less favorable ones are given lower weight or ignored. As a result, more than one DMU is often evaluated as efficient and cannot be further distinguished. Additionally, weights determined by self-evaluation may not always be realistic (Sexton et al., 1986). DEA discriminating capability can be improved by calculating the DMU cross-efficiency scores (Doyle & Green, 1994; Angulo-Meza & Lins, 2002). Cross-efficiency improves upon traditional DEA by not only evaluating DMUs based on their own optimized weights (self-evaluation) but also by considering how each DMU performs under the optimal weights of other DMUs. It provides a more discriminating and fairer efficiency score since it involves both self-evaluation and peer evaluation (Adler et al., 2002; Angulo-Meza & Lins, 2002). The calculation of cross-efficiency values occurs in two steps. In the first step, basic DEA is performed to calculate the optimal weights assigned to every DMU’s inputs and outputs. In the second step, the optimal weights obtained from the solution of a particular DMU are then applied to the inputs and outputs of every other DMU, recalculating the efficiencies of all DMUs using the weights optimized for the individual DMU. However, this two-step approach can lead to several optimal solutions, where DMU cross-efficiencies scores are arbitrarily calculated (Doyle & Green, 1994; Wang & Chin, 2010). Scholars have proposed modeling approaches that incorporate secondary goals, such as minimizing or maximizing the difference between self-evaluation and peer evaluation scores (Doyle & Green, 1994). This helps balance the influence of self-interest and peer assessments. Some approaches use game theory to balance out the competitive and cooperative aspects of weight selection. These approaches attempt to prevent DMUs from gaming the system to artificially inflate their efficiency scores (Liang et al., 2008). By introducing game theory into cross-efficiency computation, DEA models consider the strategic interactions between DMUs. Each DMU is seen as a “player” in a game, where the objective is to maximize its efficiency score while also accounting for the behavior and strategies of other DMUs, and each DMU tries to choose its weights in a way that maximizes its efficiency while considering how other DMUs might react. Typically, DEA game cross-efficiency results in a more nuanced ranking of DMUs because it considers how each DMU’s optimal weights affect others, leading to a more balanced assessment. Wu et al. (2009) expanded the Liang et al. (2008) model by incorporating variable returns to scale (VRS) and developed a modified DEA game cross-efficiency model. They added an additional constraint to avoid negative cross-efficiency under VRS. In this case, to calculate the cross-efficiency of DMU k compared to DMU j, a set of weights is established to optimize the efficiency of DMU k while ensuring that the efficiency of DMU j does not decrease.
If there are n DMUs that need to be evaluated, and each DMU j (j = 1, …, n) produces s different outputs yrj (r = 1, …, s) by consuming m different inputs xij (i = 1, …, m), adopting a noncooperative game approach, assuming output-orientation and variable returns to scale (VRS), the cross-efficiency of DMU k related to DMU j can be easily measured as follows:
where and are optimal weights that are calculated solving the linear program (2) (Liang et al., 2008; Wu et al., 2009).
where is a parameter that in the algorithm proposed by Liang et al. (2008) to solve the linear program initially takes the value given by the average original cross-efficiency of DMU k, the constraint ensures that the cross-efficiency scores cannot be greater than . For each DMU k, model (2) is solved n times, once for each k = 1, …, n.
2.2. Sample and Data
The data used in this study were collected from various sources. Specifically, data used to measure the variables in the DEA model were retrieved from the Ministry of Health website and pertain to the year 2021. The dataset represents the most recent available data at the time of data collection in 2024. The Ministry of Health typically releases data with a time lag of two to three years, which is standard for national-level healthcare statistics (Ministero della Salute, 2024a). Data related to regional expenditure are available in Armeni et al. (2022) and Giudice et al. (2022).
Table 1 shows key financial and structural indicators of the regional healthcare system in 2021. Regions facing healthcare deficits are subject to strict financial constraints, which include recovery plans and limits on personnel, investments, and spending. These restrictions also apply to private healthcare, as new facilities can only be accredited if the region can demonstrate available financial margins. Even already accredited service providers may face delayed or reduced payments, ceilings on reimbursable services, and stricter monitoring to ensure cost control and prioritization of essential LEA services. On the other hand, regions with surpluses have greater flexibility in managing resources, allowing them to invest in infrastructure and innovation. They can also more easily expand agreements with private providers. Consequently, access to private healthcare services and integration with the public system varies significantly across regions, highlighting a key source of regional disparities. A negative sign in the second column of the table (“Regional budget deficit”) indicates a budget surplus, while a positive sign indicates a deficit. In 2021, nine regions recorded a deficit. The variable in the third column measures the per capita SSN expenditure on accredited private providers in the regional territory. This variable refers to the amount of money spent by the SSN on accredited private providers for each person in the region. “Regional SSN funding allocation” refers to the process by which the State distributes the National Health Fund (FSN) among regions based on demographic, social, and performance-related criteria. This is performed to ensure fairness and efficiency in the distribution of healthcare resources. FSN is primarily funded through VAT shares and other national taxes. According to data from 2019 to 2021, transfers from the FSN cover between 92% and 94% of regional expenditures necessary to guarantee the LEA services at the national level (Di Stefano, 2023). While FSN covers most essential public healthcare costs (around 92–94% for the LEA), when considering total healthcare expenditure—including co-payments, supplementary health insurance, and private spending—the State covers about three-quarters of the total amount. As shown in the last two columns, the number of healthcare facilities tends to increase with population size, indicating the necessity to ensure adequate access to healthcare services.

Table 1.
Financial and structural indicators of the regional healthcare system, 2021.
The sample consists of 444 private healthcare facilities accredited under the SSN, which represents just over 91% of the facilities included in the Ministry of Health database (a total of 485 units in 2021). Forty-one facilities (8.45%) were excluded from the analysis due to missing or inconsistent data across all variables. These facilities comprise (a) hospitals that offer a range of medical services such as surgery, emergency care, and specialized treatments, with some focusing on specific types of care like cardiac, orthopedic, maternity, or cancer treatment. These specialized hospitals provide advanced technology and highly trained staff; (b) private nursing homes and long-term care facilities that offer long-term care and rehabilitation services to elderly or chronically ill patients; and (c) private rehabilitation centers that focus on helping patients recover from injuries, surgeries, or chronic conditions through physical therapy, exercise, and rehabilitation programs. In terms of geographical location, there are 166 facilities in northern Italy, 90 facilities in central Italy, and 188 facilities in southern Italy and the islands.
2.3. Variables of the Healthcare Facility’s Production Model
2.3.1. Endogenous Variables
The selection of input and output variables was guided by previous empirical studies that applied DEA in healthcare performance assessment. Variables commonly used in the literature—such as staff, beds, and wards, and measures of service volume and quality as outputs—were considered to ensure comparability with established approaches (Kohl et al., 2019; Nepomuceno et al., 2022; Y. A. Ozcan, 2009, 2014). Only variables with complete and comparable records across all facilities were retained to maintain statistical integrity and avoid bias from missing data.
Figure 1 illustrates a schematic representation of the production function that models the production process of a healthcare facility. Specifically, the production function consists of five inputs and five outputs, categorized as either good or bad. The inclusion of bad outputs in the healthcare facility production function accounts for undesirable outputs that are produced alongside desirable ones. These may include underutilization of resources, leading to wasted capacity and missed opportunities to effectively treat more patients. Modeling only the desirable outputs would present an incomplete and misleading view of the healthcare facility production process. This is because a facility could appear efficient solely based on high levels of desirable outputs, even if it also produces high levels of bad outputs. By incorporating bad outputs, the DEA model provides a more accurate reflection of the facility performance, offering a comprehensive and balanced assessment. Ideally, undesirable outputs should be minimized rather than maximized. The inclusion of bad outputs not only helps identify inefficiencies in producing desirable outputs but also highlights inefficiencies in minimizing undesirable outputs.
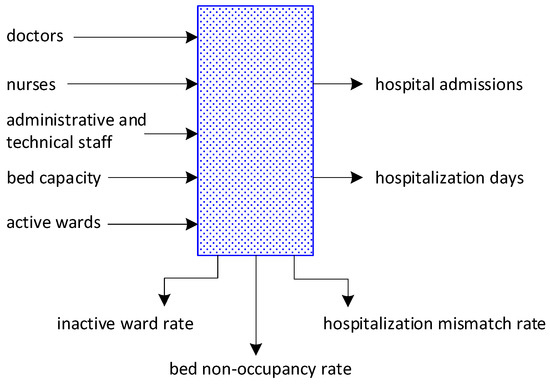
Figure 1.
The healthcare facility production function.
Inputs are as follows:
Bed capacity measures the total number of healthcare facility beds available for patient use (Nayar et al., 2013; Valdmanis et al., 2017). It directly impacts the quality of care, operational efficiency, and the ability of a facility to meet patient demand (Matranga & Sapienza, 2015). Adequate bed capacity ensures that patients can access timely care when they need it. If a facility runs out of beds, patients might experience delays in treatment, leading to poor outcomes, overcrowding in emergency departments, or even patient diversion to other facilities. However, a high number of beds may be an important determinant of healthcare inefficiency due to the increase in overhead costs (Rebba & Rizzi, 2001).
Active wards refer to specific areas or units within a healthcare facility where patients are accommodated and cared for (Søndergaard et al., 2023). Each ward is typically designated for specific types of care or patient needs, such as general medical care, surgical operations, rehabilitation, chemotherapy, and radiation therapy. The number of wards directly impacts a facility’s capacity to accommodate patients. Adequate ward availability contributes to a better patient experience. Patients are more likely to receive individualized care and attention when wards are not overcrowded, which can lead to higher satisfaction rates. However, an increase in the number of wards in a facility may lead to a decrease in efficiency for several reasons. These reasons are related to operational complexity, resource allocation, and management challenges. A higher number of wards means a higher need for coordination across wards, potentially leading to communication bottlenecks, delays, and overlapping and redundancies of functions (e.g., administrative tasks, lab work) (La Rocca & Hoholm, 2017). Opening and maintaining additional wards increases fixed costs (e.g., utilities, maintenance, and building depreciation). Every ward requires management, record-keeping, scheduling, and other administrative functions (Furukawa et al., 2010). An increase in the number of wards can lead to a disproportionate rise in administrative tasks, diverting focus from core healthcare delivery. Creating wards for narrowly focused specialties can lead to inefficiencies if the patient flow is insufficient to justify the resource allocation. Increasing the number of wards might strain shared resources like labs, diagnostic facilities, or operating theaters, causing delays.
Doctors are medical professionals who provide clinical care, diagnose and treat illnesses, and oversee patient management within a healthcare facility. This category includes various types of physicians, such as general practitioners, specialists, and surgeons. The number of doctors impacts healthcare capacity to meet patient demand. A shortage of doctors can result in longer waiting times and reduced access to care. A higher number of doctors generally leads to a better patient-to-care provider ratio, allowing for more individualized attention and timely care (Perrin & Valvona, 1986). However, the number of doctors also affects healthcare facility budgeting and financial planning, as doctor salaries are a significant part of the facility’s operating expenses (Ferreira et al., 2018; Piubello Orsini et al., 2021).
Nurses play a critical role in providing patient care and support within healthcare settings. They are responsible for administering medications, monitoring vital signs, providing basic care to patients, performing assessments to identify changes in patients’ conditions, and responding accordingly. Nurses also act as a liaison between patients, families, and doctors to ensure that patient needs and preferences are communicated and respected. Having an adequate number of nurses is crucial for meeting patient demand and ensuring timely interventions. Insufficient nursing coverage can lead to errors in medication administration, inadequate monitoring, and an increased risk of adverse events. However, similarly to doctors, nurse salaries constitute a significant portion of healthcare facility operating expenses. Therefore, the number of nurses may affect the efficiency and demand of healthcare facilities (Cheng et al., 2016; Matranga & Sapienza, 2015).
Administrative and technical staff refers to the personnel who support the operational, managerial, and technical functions of a healthcare facility (Cheng et al., 2016; Mahate et al., 2016). The administrative staff includes administrative assistants, quality assurance managers, and financial managers, while the technical staff includes mostly medical technologists and radiologic technologists. Administrative staff play a role in maintaining compliance with healthcare regulations and standards, which can directly impact the quality of care. Administrative staff often serve as the first point of contact for patients, influencing their overall experience. Technical staff, through accurate testing and imaging, provide essential information for diagnosis and treatment. Administrative and technical staff represent a significant portion of hospital expenses, as well. Overstaffing of the administrative and technical staff can drive up costs without adding proportional value to patient care (Czypionka et al., 2014; Fragkiadakis et al., 2016).
The group of good outputs includes the following variables:
Hospital admissions refer to the process by which patients are formally admitted to a healthcare facility for treatment or care (Cantor & Poh, 2018). Admissions data provides insight into bed occupancy rates and the overall capacity of the facility. Additionally, they can reflect the healthcare facility’s ability to attract and handle patient cases, showcasing its capacity utilization and reputation. A high number of admissions may indicate its ability to meet demand. Healthcare facilities that admit more patients (outputs) while using fewer resources (inputs) could score higher in efficiency (Auteri et al., 2019; Zarrin et al., 2022). Admissions are directly linked to healthcare facility revenue because each admission often generates billing for services rendered. Thus, admissions can be introduced in model specification as an output when assessing the healthcare facility’s effectiveness in serving the community (Su et al., 2023). This perspective on admissions as an output of the healthcare facility’s production function aligns with the private ownership of these facilities, as they must boost admissions to maintain financial stability.
Hospitalization days measure the total number of days that patients spend in a healthcare facility during a specific period. These days are directly linked to the length of stay for patients. While longer hospitalization days can increase healthcare costs for both the facility and patients (Dimas et al., 2012; Staat, 2006), they also result in higher revenues that help cover fixed costs associated with staff and physical structure. On the other hand, shorter stays can be even more challenging and costly. Discharging a patient prematurely, before they have properly healed, may result in their re-hospitalization and, ultimately, higher healthcare expenses (Stefko et al., 2018).
The group of undesirable outputs includes the variables listed below:
The bed non-occupancy rate refers to the percentage of healthcare facility beds that are not occupied by patients at a given time (Lee et al., 2021). It is measured by the ratio of the number of non-occupied beds to the total number of beds. A high bed non-occupancy rate may indicate underutilization of hospital resources, suggesting that the hospital has more capacity than is needed based on current patient demand (Bosque-Mercader & Siciliani, 2023). Healthcare facilities incur fixed costs associated with maintaining beds, regardless of occupancy. A high non-occupancy rate can lead to financial strain, as the facility may not be generating enough revenue to cover these costs. While some level of non-occupancy can be deemed acceptable for flexibility in managing surges in patient demand, excessive non-occupancy may suggest barriers to patient access or problems with the facility’s services. An excess of unused beds may signal over-resourcing or inefficiency.
The inactive ward rate indicates the percentage of healthcare facility wards that are vacant or closed and not being used for patient care during a specific time period compared to the total number of wards available in the facility. A high inactive ward rate may signal underutilization of healthcare facilities (Gallaher et al., 2021). Maintaining inactive wards incurs costs, such as maintenance and utilities, without generating revenue (Baker et al., 2004). A high inactive ward rate can lead to financial strain, as the facility may not be utilizing its resources effectively. Inactive wards can limit the facility’s ability to accommodate patients, particularly during peak demand periods (Trerise et al., 2001).
The hospitalization mismatch rate refers to the difference between the expected number of hospitalizations and the actual number that occurs within a specified time interval. This metric is calculated by comparing the planned number of hospitalizations to the actual number, expressed as a ratio. A high mismatch rate suggests that the facility may not be accurately predicting patient needs, resulting in underutilization (Li et al., 2021). This discrepancy can cause unexpected financial challenges, resulting in missed revenue opportunities (Scott et al., 1993; Stone et al., 2022).
Table 2 displays the main statistics for input and output variables.
Table 2.
Main statistics of variables used in DEA model specification.
Mean values of selected structural variables aggregated at the regional level are displayed in Table 3. Figures reveal significant heterogeneity in the structural characteristics of accredited private healthcare facilities across Italian regions, with no apparent geographic patterns. Facility size varies greatly, from an average of 40 beds in Basilicata to 130.4 beds in Lombardy. Southern regions like Sardinia (107.9 beds) and Abruzzo (115.1 beds) have larger facilities than northern regions such as Piedmont (86.6 beds) and Emilia-Romagna (90.8 beds). Human resource allocation shows extreme variability, as the number of medical staff ranges from 10 doctors per facility in Basilicata to 99.3 in Friuli Venezia-Giulia, while nursing staff varies from 20.6 (Umbria) to 97.1 (Lombardy). Administrative staffing also presents significant disparities, with Basilicata’s unusually high 198 administrative personnel contrasting sharply with other regions. Ward complexity also varies regardless of facility size, with Sardinia having 9.0 active wards per facility compared to Molise’s 2.0. This extensive heterogeneity suggests that organizational models are primarily influenced by region-specific factors rather than national standardization, posing significant challenges for comparative efficiency analysis and highlighting the need for context-specific evaluation frameworks.
Table 3.
Mean values of selected structural variables aggregated at the regional level.
2.3.2. Exogenous Variables
The efficiency of healthcare facility production processes also depends on variables that are beyond management control (Blank & Valdmanis, 2010; Kaya & Cafrı, 2016). Therefore, the influence of these exogenous variables should be taken into account when evaluating healthcare facility performance. The literature shows that one particularly important exogenous variable is regional heterogeneity, which often creates constraints that hinder the achievement of satisfactory performance. Italy is one of the countries where, over time, regional heterogeneities have led to high regional disparities in the healthcare sector (Bruzzi et al., 2022; van Doorslaer & Koolman, 2004). Such disparities are particularly relevant between the southern and northern regions (Bianchi et al., 2024). We examine the influence on the healthcare facility efficiency of exogenous variables such as geographical localization and size (Kohl et al., 2019; Matranga et al., 2014). In the healthcare sector, it makes sense to consider size as an exogenous variable (Piubello Orsini et al., 2021). This is because, on one hand, size may often be a constraint imposed by the external environment (i.e., a predetermined number of beds). On the other hand, some facilities may operate on a scale that cannot be changed in the short term. The level of specialization may also make the dimension exogenous, as it is determined by the mission and type of services offered rather than by a management choice of scale. For example, facilities specializing in the treatment of oncological diseases may have larger facilities to handle specific complex treatments, but they cannot change their operational scale to offer general services.
These two variables were measured as follows.
Geographical area. The sample was divided into three sub-samples, consisting of health facilities located in northern Italy (N), central Italy (C), and southern and island Italy (S), corresponding to the three macro-regions of the country. The geographical distribution of facilities is uneven, with the largest number of facilities located in the southern and island regions (188), the smallest number in the central regions (90), and the rest in the northern regions (166).
Size. The sample was divided into four quartiles based on the total number of employees in the facility, with quartile cutoff values of 84, 141, and 255. Table A1 and Table A2 in Appendix A display the average values of input and output variables relative to the three geographic sub-samples and the four size-based quartiles.
3. Results
The results are analyzed at two levels: the individual healthcare facility level and the regional level. This latter analysis is performed by aggregating the cross-efficiency scores of facilities within each region. While this aggregation method may partially reduce robustness by masking within-region variability, potentially introducing representativeness bias, and lowering statistical power, it does allow for comparisons using information available only at the regional level. This includes healthcare expenditure or aggregated outcomes, providing a more comprehensive view of performance.
3.1. Healthcare Facilities Performance
Model (2) was utilized to calculate the cross-efficiency values of healthcare facilities. Initially, the three undesirable outputs were transformed into desirable outputs using the linear transformation method developed by Seiford and Zhu (2002). This method involves converting each undesirable output (for a decision-making unit, DMU) into a desirable output by subtracting it from a constant, effectively reversing the direction of desirability. This constant must be greater than the maximum observed value of the undesirable output across all DMUs. This transformation ensures that the output value remains positive and meaningful for comparison across DMUs. The super-efficiency DEA model was applied to identify outliers in the sample that should be eliminated to achieve a better approximation of the production frontier (Andersen & Petersen, 1993; Banker & Chang, 2006; Wilson, 1995). However, no outlier was detected.
The estimated cross-efficiency measurements of healthcare facilities are reported in Table A3 in Appendix B. Thirty-five facilities achieved a cross-efficiency of 1.000 (i.e., 100 percent), and fifty-nine facilities achieved a cross-efficiency of 0.999, under a three-decimal-place approximation. Contrary to expectations, the model based on the game cross-efficiency measure fails to effectively discriminate facilities with high efficiency values. Discrimination among facilities improves when efficiency values are below 0.865. The value of cross-efficiency ranges between 0.290 and 1.000, with a mean cross-efficiency of 0.923. The efficiency value in this study is higher than that estimated in other studies conducted in the healthcare sector in Italy. For instance, Cavalieri et al. (2018), using a sample of 492 hospitals, found that between 1999 and 2010, the average efficiency value of healthcare facilities (public and private) ranged from 0.655 to 0.759. Barra et al. (2022) estimated an average efficiency value for hospitals across the country for 2007 and 2016 as 0.778 and 0.784, respectively. Similarly, Campanella et al. (2017) calculated an average efficiency of 0.770 using a sample of 50 public hospital trusts. The average (cross-)efficiency value calculated in this study seems to align with the value determined by Piubello Orsini et al. (2021), who studied a sample of 43 hospitals in the Veneto Region and measured average efficiency values of 0.984 and 0.966 for the years 2018 and 2019. However, it is important to note that the studies used different DEA techniques and model specifications of the production function. For instance, Barra et al. (2022) utilized the SFA methodology, while Cavalieri et al. (2018) employed a smoothed homogeneous bootstrap procedure to estimate efficiency. Piubello Orsini et al. (2021) conducted a study that calculated static technical efficiency and the Malmquist productivity index to track changes in efficiency over time, using the classic input-oriented DEA-BCC model (Banker et al., 1984). Additionally, the samples used in previous studies were generally not homogeneous, as they included healthcare facilities with different types of ownership.
The graph in Figure 2 displays the absolute frequencies of healthcare facilities, broken down by bands of cross-efficiency values. The graph reveals a somewhat skewed distribution of cross-efficiency values. The largest number of facilities in the sample have cross-efficiency measurements between 0.949 and 1.000, totaling 283 facilities, which corresponds to approximately 64% of the healthcare facilities in the sample. Conversely, a small number of facilities achieve cross-efficiency values below 0.747 (40 facilities with performance 25% lower than highly ranked ones, approximately 9% of the sample). This suggests that these healthcare facilities still have room for improvement.
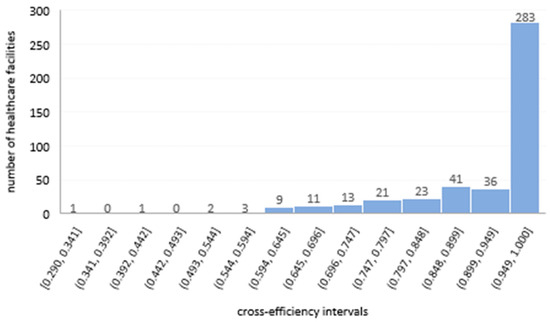
Figure 2.
Frequency of healthcare facilities’ cross-efficiency scores. Source: own elaboration based on data from Ministero della Salute (2024a).
Table 4 provides a detailed overview of the cross-efficiency of private healthcare facilities across the 20 Italian regions. The regional efficiency indicators were calculated as the average of the cross-efficiency scores of all private healthcare facilities within each region.
Table 4.
Regional statistics of private healthcare facility cross-efficiency.
The mean cross-efficiency scores show that most regions operate at relatively high efficiency levels, with values generally above 0.90. Regions like Basilicata (0.998) and Aosta Valley (0.994) demonstrate the highest average efficiency, indicating consistent high performance across facilities. Conversely, Friuli Venezia-Giulia (0.832) and Sicily (0.861) display the lowest mean cross-efficiency, suggesting more variability or underperformance in these regions. The median values consistently surpass the means, emphasizing that lower-performing facilities bring down the regional averages. The maximum efficiency values are nearly 1 in all regions, indicating that some facilities operate at full efficiency, although this is relatively uncommon. Thirteen regions have facilities that have achieved full efficiency, with the highest numbers in Apulia and Latium, each with six facilities, and Lombardy and Sicily, each with four facilities.
Minimum values point out the presence of underperforming facilities in almost all regions, with the lowest in Lombardy (0.290) and Tuscany (0.505). While many private healthcare facilities are making strides towards operating more efficiently, achieving full efficiency is still rare. Regional variations suggest specific areas where performance can be improved through targeted enhancements.
3.2. Variables Affecting the Cross-Efficiency Value of Healthcare Facilities
3.2.1. Production Model (Endogenous) Variables
In order to unveil the relationship between cross-efficiency and the input and output variables, the Classification and Regression Tree (CART) technique was applied. The CART technique, introduced by Breiman et al. (1984), employes a recursive binary-splitting approach to create homogeneous subsets within a decision tree structure. This process continues until minimal differences are achieved (Sala-Garrido et al., 2022). This non-parametric technique does not assume any predefined probability distribution of data or relationship between variables (Lemon et al., 2003). Additionally, it enables the handling of heavily skewed data without the need for data transformation and is robust to outliers. The Gini coefficient was adopted as a criterion for choosing the best split at each node. The best split is the one that minimizes the weighted average of the Gini indices of the child nodes as the CART technique tries to create nodes that are as pure as possible, thereby reducing the uncertainty in the data (M. Ozcan & Peker, 2023). To avoid having an excessively large tree over-fitting the data, the pruning procedure was used.
The CART-based analysis was performed in two steps. In the first step, the classification tree was generated without implementing any validation procedure. The CART yielded a tree comprising of four levels, 13 nodes in total and 7 terminal nodes (this tree is reported in Figure A1 in Appendix C). The analysis shows that the inactive ward rate is the most influential variable affecting the cross-efficiency level, followed by the bed non-occupancy rate. Less significant is the weight of the bed capacity. In the second step, a split-sample validation procedure was used to evaluate the tree model. This procedure allows for assessing the model performance and generalizability on unseen data. Indeed, CART models, like many other machine learning algorithms, often tend to overfit the training data by capturing noise rather than meaningful patterns. The split-sample validation procedure helps reduce this risk and provides insights into how well the model is expected to perform on new data (Zimmerman et al., 2016). Particularly, the dataset was divided into two separate sets, a training set and a testing set, each including 50% of healthcare facilities. The model was trained on the training set and then tested on the test set. This allowed for an unbiased assessment of the model predictive accuracy, as the test data was not seen during training.
Table 5 and Table 6 provide information regarding the robustness and accuracy of the results obtained in the analysis. Table 5 shows the summary of the gain for the nodes in the predictive decision tree structures. It shows that node 3 has a higher gain than the other nodes at 65.3%, which is an indication of the level of influence of variable in node 3 on the predictive analysis of the healthcare facilities cross-efficiency value. The gain summary values obtained for nodes 3, 4, 5, and 6 in the test model are consistent with those obtained in the training model.
Table 5.
Gain summary for nodes.
Table 6.
Risk associated with the tree model.
Table 6 displays the risk associated with the tree model. This risk represents the overall percentage of cases that were misclassified by the model. It evaluates how well the model fits both the training set it was built on and the test data used for evaluation. The risk for the training set is 0.002, while the risk estimate for the test set is only 0.001. This suggests that the risk of overfitting the data is low, and the model’s insights can be applied to other data sets. The proportion of variance explained by the model is equal to . The high value of the proportion of variance explained indicates that the model has a strong ability to generalize results. The standard errors for both data sets are the same.
Figure 3 shows the architecture of the testing tree obtained from the CART analysis performed in the second step. Not all variables are used to build the decision tree model, and the same variable is used at different levels of the decision tree model. The 0.009 improvement in the first variable selected for splitting the testing sample, the inactive ward rate, means that this variable contributes 0.009 to the level of cross-efficiency in discriminating across healthcare facilities. This improvement measures the increase in the effect of a child node on the dependent variable. This variable splits into two categories, less than or equal to 13.81% or higher than 13.81%. When the non-occupancy rate of healthcare facility wards is at or below the threshold of 13.81%, the average expected value of cross-efficiency for the facilities is 0.975. However, when it exceeds this threshold, the average drops to 0.763. The second important variable in the tree model is bed non-occupancy rate. This variable begins to have an impact when the inactive ward rate exceeds the threshold of 13.81%. Specifically, if the inactive ward rate of a healthcare facility surpasses 13.81% and the bed non-occupancy rate goes over 17.712%, the predicted average value of cross-efficiency for the facilities will decrease to 0.665. Conversely, reducing the bed non-occupancy rate, even with high ward non-occupancy rates, results in an increase in the average cross-efficiency value. For bed non-occupancy rate values at or below the 17.712% threshold, the expected mean value of cross-efficiency is 0.834. Nodes 3 and 4 in the tree show that when the inactive ward rate is very low, at or below the 3.33% threshold, the expected mean value of cross-efficiency rises to 0.989. Conversely, when it falls between 3.33% and 13.81%, the average expected value of the cross-efficiency is 0.897.
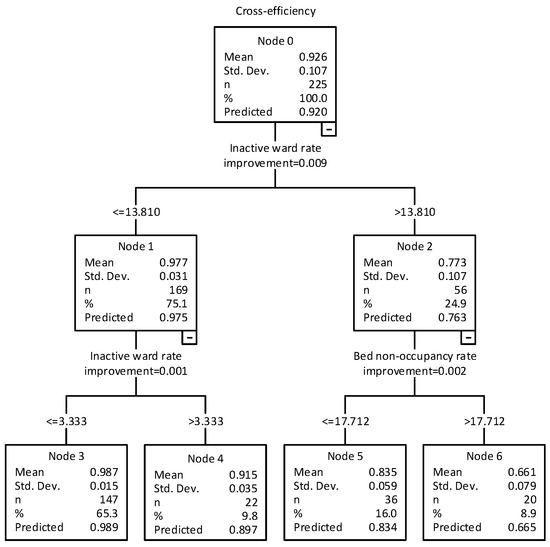
Figure 3.
Test tree. Source: own elaboration.
Figure 4 presents a graph illustrating the normalized importance of each predictor variable. The variables “inactive ward rate” and “bed non-occupancy rate” are the most important predictors of healthcare facility cross-efficiency measurement. The graph clearly shows that these variables have the most significant impact on the value of cross-efficiency. This indicates that undesirable outputs, such as the inactive ward rate and bed non-occupancy rate, have a greater influence on decreasing the efficiency of healthcare facilities compared to desirable outputs and inputs. Therefore, the differences in cross-efficiency between facilities are primarily due to these undesirable outputs rather than desirable outputs like hospital admissions and hospitalization days or inputs. Among the inputs, only bed capacity has some significance, although it is limited (this variable is only present in the tree obtained without splitting the sample into two groups, so this finding may not be generalizable. See Appendix C). It is also important to note that inputs related to staff, including doctors, nurses, and administrative-technical staff, seem to have little impact on determining efficiency variations between healthcare facilities.
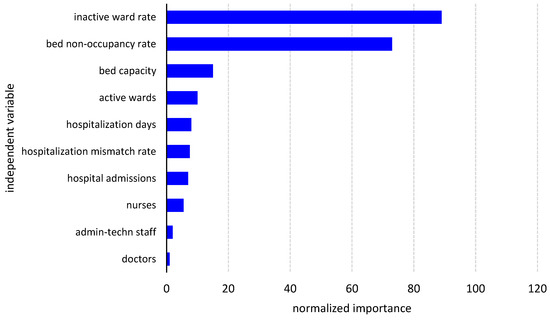
Figure 4.
Normalized importance of predictor variables. Source: own elaboration based on data from Ministero della Salute (2024a).
To further investigate the factors influencing the efficiency of the healthcare facilities, Figure 5 and Figure 6 illustrate the relationship between cross-efficiency scores and the two key indicators of resource utilization: inactive ward rate and bed non-occupancy rate.
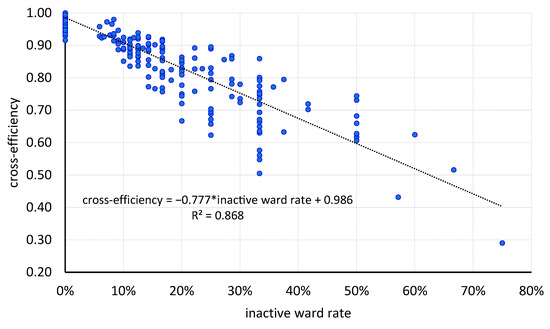
Figure 5.
Scatter plot: cross-efficiency vs. inactive ward rate. Source: own elaboration based on data from Ministero della Salute (2024a).
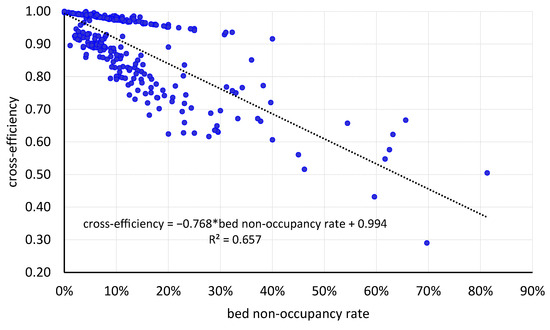
Figure 6.
Scatter plot: cross-efficiency vs. bed non-occupancy rate. Source: own elaboration based on data from Ministero della Salute (2024a).
In Figure 5, the scatter plot illustrates a strong negative relationship between the inactive ward rate and cross-efficiency in private healthcare facilities. The regression line shows that as the percentage of inactive wards increases, operational efficiency, as measured by cross-efficiency, significantly declines. The high R2 value of 0.868 suggests that approximately 87% of the variability in cross-efficiency can be explained by the inactive ward rate alone, highlighting it as a critical determinant of operational inefficiency. This finding is consistent with the results from the CART analysis and suggests that facilities with a larger share of unused wards are significantly less efficient. This is likely due to underutilized infrastructure and fixed costs not translating into active service delivery. Figure 6 illustrates the relationship between bed non-occupancy rate and cross-efficiency. As with the previous figure, there is a noticeable negative correlation, suggesting that higher bed non-occupancy is linked to lower operational efficiency. However, the relationship is slightly weaker than in Figure 5, with an R2 of 0.657. This means that approximately 66% of the variation in cross-efficiency can be explained by this variable. While still significant, it implies that bed usage is an important factor in determining efficiency, but not the only one. This could be due to beds being underutilized even when wards are active, or fluctuations in patient inflow. Both figures highlight the critical impact of resource underutilization on operational efficiency. However, the rate of inactive wards seems to have a stronger explanatory power than bed non-occupancy. This could be due to the fact that inactive wards involve broader systemic inefficiencies, such as the under-deployment of staff, equipment, and fixed operational costs, whereas bed underutilization may be a temporary or seasonal issue.
Moving from the facility level to the regional level, scatter plots were constructed to examine the relationship between cross-efficiency and some performance indicators expressed as ratios between selected inputs. These indicators were chosen for their relevance in capturing staffing structure and resource allocation. For reasons of clarity and space, only scatter plots including doctor-to-nurse and doctor-to-bed capacity ratios have been reported, as other indicators did not yield meaningful patterns. Although there are no shared standards for these indicators, unlike the nurse-to-patient ratio, which is necessary to ensure safety and quality of care, the utilization of doctor-to-nurse and doctor-to-bed capacity ratios offers additional analytical tools to pinpoint potential sources of inefficiency in healthcare facilities (Sasso et al., 2017). In order to ensure comparability across variables in the scatter plots, a preliminary normalization was applied using a min–max transformation.
In Figure 7, the analysis of the relationship between cross-efficiency and the doctor-to-bed capacity ratio reveals a varied distribution among Italian regions. Significant outliers, such as Basilicata and Aosta Valley (high efficiency with low doctor-to-bed capacity ratio) and Trentino–South Tyrol (high efficiency with high doctor-to-bed capacity ratio), emerge.
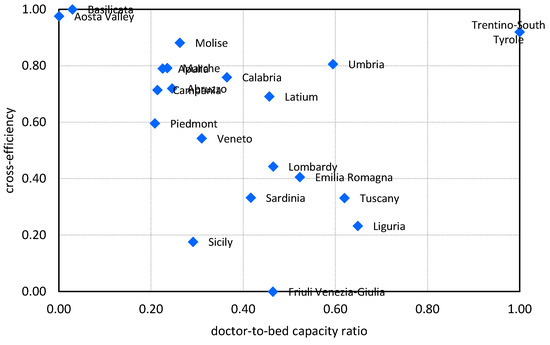
Figure 7.
Scatter plot: cross-efficiency vs. doctor-to-bed capacity ratio. Source: own elaboration based on data from Ministero della Salute (2024a).
Excluding some special statute regions (Sicily, Trentino–South Tyrole, and Friuli Venezia-Giulia), a weak negative relationship is observed, indicating that a high doctor-to-bed ratio may suggest organizational inefficiencies or underutilization of facilities. Southern regions generally perform better with lower doctor-to-bed capacity ratios, while northern regions show intermediate values for both variables.
The doctor-to-nurse ratio shows a more pronounced and consistent negative relationship with cross-efficiency compared to the previous graph (see Figure 8). Regions with lower doctor-to-nurse ratios (0.00–0.40) consistently exhibit higher efficiency levels (0.70–1.00), while regions with higher ratios (0.50–0.80) demonstrate decreasing efficiency. This trend suggests that a balanced healthcare team with a greater emphasis on nursing supports operational efficiency, possibly through improved care continuity and process optimization. The doctor-to-nurse ratio emerges as a more reliable predictor of efficiency compared to other organizational variables.
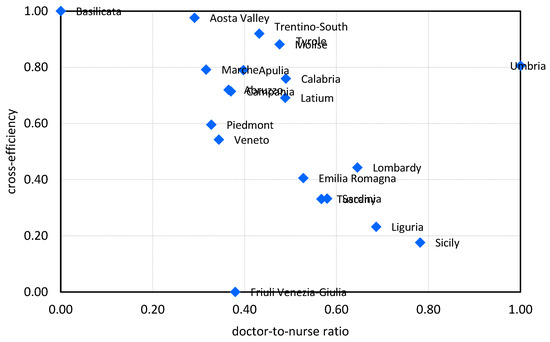
Figure 8.
Scatter plot: cross-efficiency vs. doctor-to-nurse ratio. Source: own elaboration based on data from Ministero della Salute (2024a).
3.2.2. Impact of Exogenous Variables on Efficiency
Table 7 displays cross-efficiency main statistics relative to the different sub-samples. The nonparametric H Kruskal–Wallis hypothesis test was conducted to determine if the geographical area and size of healthcare facilities impact their cross-efficiency levels (Table 8 and Table 9). Compared to linear regression analysis, the Kruskal–Wallis test has several strengths (Chan & Walmsley, 1997; Conover, 1999). The test does not assume normality of the data, making it more suitable for skewed datasets, while regression analysis assumes that residuals are normally distributed and often requires homoscedasticity (equal variances across groups). If these assumptions are violated, results from regression can be biased or less reliable. Since the Kruskal–Wallis test relies on ranks rather than raw data values, it is less sensitive to extreme values or outliers within groups. Additionally, it does not assume a linear relationship between the independent grouping variable and the dependent variable.
Table 7.
Cross-efficiency statistics relative to sub-samples.
Table 8.
Kruskal–Wallis test for differences in cross-efficiency measurements: effect of geographical area.
Table 9.
Kruskal–Wallis test for differences in cross-efficiency measurements: effect of size.
In Table 8, the Kruskal–Wallis H test (H = 1.252, prob. 0.535) indicates that there is no significant difference in the cross-efficiency score between the various sub-samples when the effect of geographical area is taken into account. Conversely, when examining the impact of size in Table 9, the Kruskal–Wallis H test shows a significant difference in cross-efficiency across the sub-samples, with χ2(3) = 29.213, prob. < 0.001. Specifically, the first sub-sample (Q1) differs significantly from the other sub-samples. Indeed, the Post-Hoc Dunn’s test using a Bonferroni corrected alpha of 0.0083 indicates that the mean ranks of the following pairs are significantly different: Q1–Q2, Q1–Q3, and Q1–Q4. Therefore, the results suggest that smaller healthcare facilities are slightly more efficient than larger ones.
To further investigate the effect of exogenous variables on cross-efficiency, distributional analysis based on kernel density estimates (KDEs) was used to explore the underlying distribution of cross-efficiency scores in sub-samples in a flexible and non-parametric manner. Specifically, KDE provides a smooth, continuous estimate of the data’s probability density function without assuming a specific distributional form (e.g., normal or uniform) (Sheather, 2004; Silverman, 1998). This flexibility makes it well-suited for data with unknown or skewed distributions. KDE can effectively reveal key features of data distribution, such as peaks, valleys, and spread, better than traditional histograms or parametric models. This is particularly useful for detecting modes, identifying outliers, and understanding the tails of the distribution. Additionally, KDE allows for easy visual and quantitative comparison of multiple distributions on the same scale, making it ideal for comparing distributions across different groups. Therefore, overlapping KDE plots can demonstrate where two distributions converge or diverge, aiding in understanding group differences without formal testing. The KDE analysis was conducted by adopting a second-order Gaussian kernel, with bandwidth selection following Silverman (1998)’s rule of thumb. The results are presented in Figure 9 and Figure 10, with a dashed black line representing the Gaussian curve for reference.
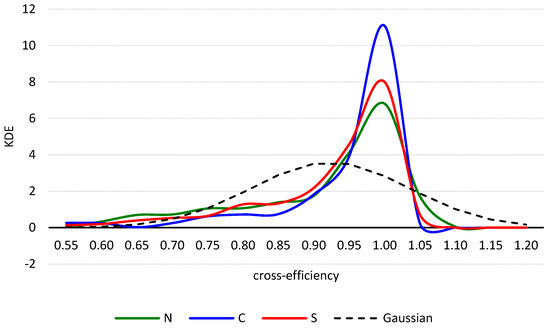
Figure 9.
Kernel density estimation: effect of geographical area. Source: own elaboration based on data from Ministero della Salute (2024a).
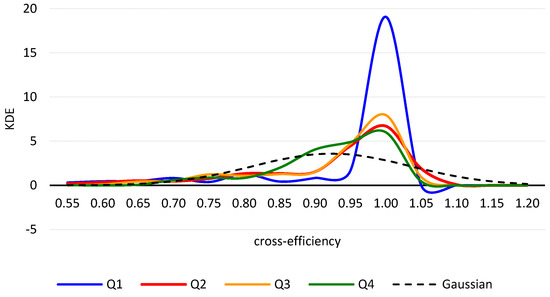
Figure 10.
Kernel density estimation: effect of size. Source: own elaboration based on data from Ministero della Salute (2024a).
Figure 9 illustrates that the estimated density curves for cross-efficiency scores in the N, C, and S sub-samples exhibit a unimodal shape, indicating that healthcare facilities are concentrated within a single group. The density distribution for the C sub-sample shows a notably higher peak (around KDE = 11) at a cross-efficiency score of 0.980 compared to the other sub-samples. Since the height of the curve reflects the likelihood of a healthcare facility reaching a specific cross-efficiency level, a more peaked and narrowed curve suggests that a larger number of facilities are likely to achieve higher performance. Overall, the curves share a very similar shape, supporting the findings from the H test. These findings do not support what emerged from previous studies.
Research conducted by Barra et al. (2022) using a SFA meta-frontier method revealed an efficiency gap between southern and northern hospitals, with the latter achieving higher levels of efficiency. However, the results of their study are not directly comparable to those of this study. Indeed, scholars used a different methodology and a sample that was predominantly composed of public hospitals, making up just over 80% of the total.
Examination of the estimated density curves for cross-efficiency scores in the Q1, Q2, Q3, and Q4 quartile sub-samples reveals a distinct pattern (see Figure 10). While the curves for quartiles Q2 and Q3 are nearly identical, the density curves for quartiles Q1 and Q4 exhibit different shapes. Specifically, Q1 displays a prominent peak (KDE is just over 19). This behavior of the Q1 density curve suggests that smaller healthcare facilities in the Q1 quartile tend to achieve higher cross-efficiency values, as indicated by the medians and the results of the Kruskal–Wallis test (refer to Table 9). These findings confirm that smaller healthcare facilities are indeed more efficient. The shape of the density curve for quartile Q4 indicates that as the size of facilities increases, the dispersion of efficiency values widens, leading to more heterogeneity in behavior. The curve appears to have a bimodal distribution, with a concentration of healthcare facilities with lower cross-efficiency values to the left of the density peak. These results partially confirm findings from previous studies. For instance, Giancotti et al. (2018) discovered that the efficiency of Italian hospitals tends to decrease after reaching 200 beds. However, Varabyova et al.’s (2017) study, which utilized a nonparametric conditional approach based on the partial frontier, indicates that smaller hospitals are actually less efficient than larger hospitals.
3.3. Healthcare Facility Efficiency and Regional Spending Patterns
The following analysis aims to explore how regional differences in funding, spending, and structural characteristics relate to the average cross-efficiency of healthcare facilities, providing a broader perspective on the factors that influence healthcare performance at the regional level.
Efficiency was previously measured at the individual healthcare facility level, highlighting performance discrepancies among them. The focus has now shifted to the regional level. As financial data are not available for individual facilities and are only reported at the regional level, efficiency can only be connected to expenditure through regional aggregation. However, this approach is highly relevant for policy purposes, as it allows for comparisons across regions and provides insights into broader healthcare performance trends.
Table 10 displays correlations between cross-efficiency scores and financial indicators, such as regional budget deficit, total SSN expenditure for accredited private care, and regional SSN funding allocation, as well as structural variables, including resident population and the total number of healthcare facilities. The correlation matrix utilizes both Pearson and Spearman coefficients, enhancing the methodological robustness of the analysis. The consistency between these two measures for most variables indicates that the relationships are not significantly affected by outliers. Only 3 out of 15 correlation pairs achieve statistical significance (p < 0.05). This suggests either limitations in sample size or the presence of more complex and non-linear relationships between variables.
Table 10.
Correlations between cross-efficiencies and financial and structural indicators of the regional healthcare system.
The cross-efficiency measure exhibits weak to moderate negative correlations with most variables, especially population size. This indicates that larger healthcare systems may face challenges in efficiency due to potential incomplete realization of economies of scale, as well as increased administrative complexity and structural and managerial complexities inherent in larger systems. The notable differences between Spearman and Pearson correlations, particularly in relation to population and facilities, suggest possible non-linear relationships that merit additional investigation. However, given that the correlations are not statistically significant, it is crucial to approach the interpretation of the results with caution.
The most significant finding is the strong positive correlation between resident population and the total number of healthcare facilities, with Pearson and Spearman’s rank correlations being 0.883 and 0.925 (significant at p < 0.05). This correlation is intuitive, as regions with larger populations require a more developed healthcare infrastructure. Additionally, there is a moderately strong positive correlation between total SSN expenditure for accredited private care and resident population, with Pearson and Spearman coefficients being 0.684 and 0.707. This implies that regions with larger populations also have higher private healthcare expenditures relative to their population size.
The negative correlation between total regional SSN funding allocation and the number of private facilities (Pearson coefficient = −0.660 and Spearman rho = −0.679, significant) highlights a potential substitution effect between public and private healthcare provision. Regions that receive higher SSN funding generally sustain stronger public systems, which, in turn, reduces the market opportunity for private providers. On the contrary, regions with lower SSN allocations appear to rely more heavily on private facilities to fill gaps in provision. Thus, a paradox emerges. While overall SSN funding is negatively associated with the number of private facilities, SSN expenditure on accredited private care shows a positive and significant correlation with population. This suggests that, in populous regions, even well-funded public systems may turn to private providers to supplement healthcare service capacity. Taken together, these findings indicate that regional healthcare systems adopt different strategies, as some strengthen public provision, while others rely more on public-private partnerships. From a policy perspective, these dynamics reflect both structural substitution—where limited public resources create space for private providers—and capacity supplementation, whereby private facilities complement public services in meeting regional demand.
To delve deeper into the relationship between efficiency and financial resources, Figure 11 and Figure 12 display scatter plots of regional cross-efficiency scores plotted against per capita SSN expenditure on accredited private care, differentiating between regions with a healthcare budget surplus and those with a budget deficit. The data have been rescaled to the interval [0, 1] using min–max transformation.
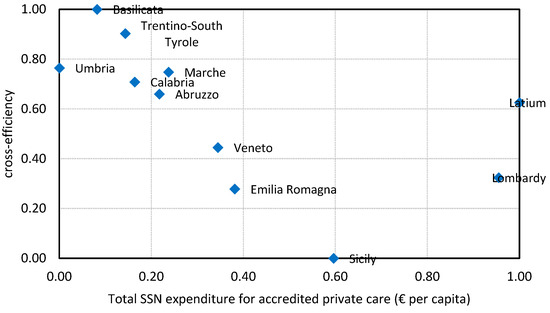
Figure 11.
Scatter plot of cross-efficiency vs. per capita SSN expenditure on accredited private care in regions with a budget surplus. Source: own elaboration based on data from Ministero della Salute (2024a) and Giudice et al. (2022).
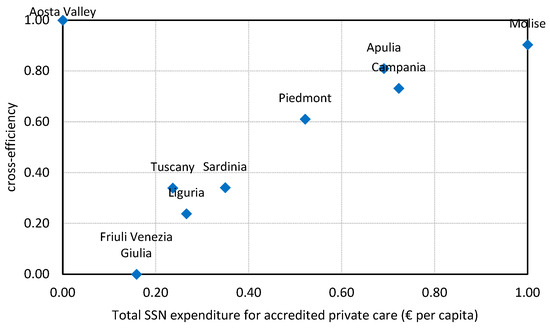
Figure 12.
Scatter plot of cross-efficiency vs. per capita SSN expenditure on accredited private care in regions with a budget deficit. Source: own elaboration based on data from Ministero della Salute (2024a) and Giudice et al. (2022).
In surplus regions (Figure 11), most points are concentrated at high efficiency levels with relatively low to moderate expenditure. For example, Basilicata and Trentino–South Tyrol show very high efficiency with modest expenditure, while Emilia-Romagna and Sicily combine higher expenditure with lower efficiency.
In deficit regions (Figure 12), the distribution is more dispersed. Apulia and Campania combine higher expenditure with relatively high efficiency, while Friuli Venezia-Giulia, Liguria, and Sardinia show both lower expenditure and lower efficiency.
When comparing the two scatter plots, an opposite pattern emerges between surplus and deficit regions. In surplus regions, higher SSN expenditure on accredited private care is often associated with lower efficiency, while in deficit regions higher expenditure tends to coincide with higher efficiency.
4. Discussion
This study advances the literature on healthcare efficiency by examining the performance patterns of private healthcare facilities in Italy. It contributes to efficiency measurement research while also deepening the understanding of private providers in mixed health systems. The results challenge established assumptions providing evidence with direct implications for healthcare policy and managerial practice at multiple levels of the system.
4.1. Theoretical Contributions
4.1.1. Research Focus
By examining accredited private healthcare facilities in isolation, this analysis provides a more homogeneous perspective than studies that aggregated public and private providers. The mean cross-efficiency score of 0.923—well above the values reported in earlier Italian studies—indicates that private facilities exhibit comparatively strong performance. This evidence challenges the assumption that public and private providers face similar efficiency constraints and highlights ownership-specific dynamics as suggested by Barbetta et al. (2007).
4.1.2. Methodological Advancement in Healthcare Efficiency Measurement
The application of the cross-efficiency DEA methodology to private healthcare facilities represents a notable theoretical advancement. Unlike traditional DEA approaches, which often yield multiple efficient units with limited discrimination, the cross-efficiency approach reveals meaningful performance variations. Additionally, calculating cross-efficiency within a game-theory framework enables managers and policymakers to account for both cooperative and competitive dynamics among DMUs, thereby enhancing its value as a decision support tool (Zare et al., 2019). Specifically, this study has shown that 35 facilities achieved full cross-efficiency (a score equal to 1.000) while maintaining discrimination below 0.865, demonstrating the method’s superior discriminatory capacity.
Furthermore, integrating undesirable outputs, such as the inactive ward rate and bed non-occupancy rate, into a linear transformation enhances understanding of how resource underutilization impacts efficiency. The results indicate that undesirable outputs explain efficiency variations more effectively than conventional inputs or desirable outputs, contributing to the literature on incorporating negative externalities in efficiency measurement. The variables “inactive ward rate” and “bed non-occupancy rate” have been identified as the most significant predictors of inefficiency in healthcare facilities. These findings are consistent with previous research. For example, Antunes et al. (2021) conducted a study on 93 intensive care units in the Brazilian healthcare sector and found that more efficient units typically have higher bed occupancy rates.
However, some scholars caution that while a high bed occupancy rate is often associated with greater efficiency, excessively increasing occupancy may negatively affect healthcare effectiveness and quality of care, particularly in terms of patient comfort (Medarević & Vuković, 2021). Supporting this concern, Madsen et al. (2014) found that elevated bed occupancy rates were linked to a significant 9% increase in in-hospital mortality. Jones (2011) suggests that bed occupancy should not exceed the threshold of 85% to reduce the risk of infections that could compromise patient safety.
4.1.3. Reconceptualization of Scale Effects in Healthcare
The results challenge conventional assumptions about economies of scale in healthcare. Previous research found a positive correlation between size and efficiency (Giuliani & Gitto, 2025; Vitaliano, 1987). Conversely, this study shows that smaller facilities (Q1 quartile) exhibit significantly higher efficiency than larger ones, contradicting the traditional view that scale inherently confers advantages. The bimodal efficiency distribution observed in the largest facilities (Q4 quartile) suggests a threshold beyond which scale disadvantages—likely stemming from organizational complexity and coordination costs—emerge. These findings contribute to healthcare economics by indicating that optimal facility size may be smaller than previously assumed, particularly in specialized private settings where flexibility and responsiveness outweigh scale benefits. The organizational complexity that is typical of larger facilities may compromise the potential efficiency gains associated with economies of scale. Additionally, it should be considered that the relationship between the size and efficiency of healthcare facilities can vary significantly depending on their type, location, population needs, and policy choices (Asmild et al., 2013; Giancotti et al., 2017).
4.1.4. Geographic Efficiency Patterns and Regional Healthcare Systems
The absence of significant geographical differences in efficiency (north–center–south) contradicts established literature and contributes to theoretical debates about regional healthcare performance. Contrarily to previous studies which identified efficiency gaps between northern and southern Italian healthcare facilities (Boffardi, 2022; Matranga et al., 2014), our focus on private facilities reveals a more homogeneous efficiency landscape. This suggests that private healthcare markets may operate under different efficiency dynamics compared to public systems, potentially due to market-driven selection effects and standardized operational practices.
The regional-level analysis highlights the interplay between systemic funding structures and efficiency. The negative correlation between SSN funding allocation and the number of private facilities (Pearson = –0.660, Spearman = –0.679, both significant at p < 0.05) illustrates a substitution effect, whereby strong public systems reduce space for private provision. Conversely, in deficit regions, higher per capita expenditure on accredited private care was associated with higher efficiency, while in surplus regions the opposite pattern emerged. However, these findings contradict earlier studies. For example, Guccio et al. (2024) found that austerity policies had a negative effect on the technical efficiency of hospitals in Italy.
These results suggest two complementary interpretations. Structurally, they provide theoretical support for a contingency perspective: The efficiency effects of private expenditure are not universal but depend on the fiscal and institutional context (Boffardi, 2022). In well-funded regional systems, additional resources directed to private providers may lead to duplication and inefficiencies, while in fiscally constrained contexts, private providers complement public capacity and enhance efficiency. At the same time, a behavioral explanation is also plausible, as efficiency gains in deficit regions may partly reflect adaptive responses of private facilities to financial pressure (Cox et al., 2016; Ramanuj et al., 2018). When resources are limited, providers may reorganize processes, reduce slack, and optimize utilization to preserve financial sustainability (Anderson et al., 2020). Conversely, resource abundance may reduce efficiency by creating slack and duplication. This dual interpretation links the findings to both contingency theories, emphasizing context-dependence (Huybrechts et al., 2024), and to organizational theories of slack, which highlight how scarcity can discipline operations (Zinn & Flood, 2009).
Moreover, the inverse relationship observed between surplus and deficit regions can be explained by institutional differences. Deficit regions operate under central government recovery plans, where additional funding is conditional on meeting efficiency targets. This stricter governance framework creates strong incentives for providers to align higher expenditure with efficiency improvements. In surplus regions, by contrast, managerial autonomy and the absence of externally imposed efficiency constraints may allow higher spending without proportional efficiency gains. Thus, efficiency outcomes are shaped not only by fiscal conditions but also by the governance regimes attached to them, reinforcing the contingency perspective and linking the findings to institutional theories of regulation and control (Burnett et al., 2016).
4.1.5. Resource Utilization in Healthcare Settings
The integration of DEA cross-efficiency and CART analysis represents a methodological advance. The CART model exhibited high predictive validity, with a misclassification risk of 0.001 in the test set. Quantitatively, the inactive ward rate emerged as the dominant efficiency predictor, explaining 87% of the variation in cross-efficiency scores (R2 = 0.868), while the bed non-occupancy rate accounted for 66% (R2 = 0.657). These findings support the view that inefficiency in healthcare is primarily driven by underutilization of fixed resources rather than staff or input shortages. Thus, the hierarchical importance revealed by CART provides theoretical insights. Capacity utilization indicators exert far greater influence on efficiency than traditional input measures, challenging production function assumptions that treat all inputs equally. The weak effect of staffing variables (doctors, nurses, and administrative staff) suggests that human resource allocation plays a lesser role in efficiency differences within private healthcare contexts.
Regional-level analysis revealed a weak correlation between facility efficiency and the doctor-to-bed ratio, while a stronger correlation was observed between efficiency and the doctor-to-nurse ratio. Efficiency tends to decrease as these ratios increase, with a greater sensitivity in the case of the doctor-to-nurse ratio. This might suggest either an underutilization of the facility infrastructure (e.g., bed capacity) or, conversely, an excessive number of doctors. Similarly, Antunes et al. (2021), in their systematic review on the use of DEA in the benchmarking of intense care units, found that less efficient units have a higher median doctors-to-bed ratio. They also discovered that more efficient units have a higher proportion of nurses. In their study on scale inefficiency among medical staff in Portuguese hospitals, Ferreira et al. (2018) discovered that the optimal scale was approximately 274 doctors and 475 nurses. Taken together, these results suggest that careful management of staff composition in relation to infrastructure can greatly enhance healthcare performance. This highlights that efficiency relies more on the proper balance of personnel types rather than the sheer number of doctors. However, while optimizing staff numbers is essential for improving efficiency, it is equally crucial to ensure that staff reductions do not compromise the quality of care. Maintaining an adequate staffing level, particularly in critical areas, is vital to ensure patient safety and standards of care. While some studies suggest that increasing workload does not necessarily reduce quality of care, others indicate that high workload and staff shortages can lead to adverse outcomes. For instance, Elliott et al. (2014) found that an increased workload for specialized doctors was associated with longer hospital stays and higher costs, suggesting potential negative effects on care quality and efficiency.
4.2. Policy and Managerial Implications
The quantitative results provide actionable insights for managers and policymakers, with practical implications that extend across various levels of healthcare management and policy.
4.2.1. Facility-Level Management Strategies
At the facility level, the findings highlight the critical role of capacity utilization. The identification of inactive ward rate and bed non-occupancy rate as primary efficiency drivers offers clear guidance for managers. Facilities should prioritize:
Resource utilization optimization. Maintaining inactive ward rates below 13.81% emerges as a critical threshold. Facilities exceeding this threshold show average efficiency drops from 0.975 to 0.763, representing substantial performance deterioration. Managers should implement dynamic capacity management systems to minimize ward closures and optimize resource deployment.
Bed management enhancement. The 17.712% threshold for bed non-occupancy rate provides a concrete target for improvement. Facilities should develop sophisticated patient flow management systems, demand forecasting models, and flexible scheduling practices to maintain optimal bed utilization rates. Results indicate that even modest improvements in resource use can yield substantial efficiency gains.
4.2.2. Regional Healthcare Policy Implications
At the regional level, efficiency varies significantly, with Basilicata and Aosta Valley ranking at the top and Friuli Venezia-Giulia and Sicily at the bottom. The significant diversity across all structural dimensions indicates that accredited private healthcare facilities operate in highly localized contexts with minimal standardization. This variability likely results from various factors, such as regional regulatory frameworks, local healthcare demand patterns, historical development paths, and levels of market competition. The lack of consistent patterns suggests that organizational models are mainly influenced by region-specific factors rather than national healthcare policies or geographic macro-trends. This diversity presents significant challenges for comparative efficiency analysis and highlights the necessity for context-specific evaluation frameworks.
Nonetheless, the regional analysis provides crucial insights for healthcare policymakers and regional health authorities as follows.
Targeted regional interventions. Regions like Friuli Venezia-Giulia and Sicily with below-average efficiency scores (0.832 and 0.861) require focused policy interventions. The concentration of high-performing facilities in certain regions suggests that best practices can be transferred through inter-regional knowledge sharing programs, particularly identifying organizational models that optimize resource utilization. Moreover, since small facilities outperform larger ones, policies promoting consolidation should be reconsidered. Instead, fostering networks of small-to-medium facilities may maintain efficiency while ensuring adequate coverage.
Resource allocation strategies. The negative correlation between total SSN funding allocation and private facility numbers (−0.660) reveals important policy trade-offs. Regions should balance public system strengthening with private sector development to optimize overall system efficiency.
Budget management approaches. The contrasting patterns between surplus and deficit regions regarding private care expenditure suggest different optimal strategies. Surplus regions should focus on efficiency improvement before expanding private care expenditure, while deficit regions may benefit from strategic private sector partnerships to enhance capacity.
4.2.3. Healthcare System Design Implications
At the system level, funding dynamics indicate that increased spending on private providers does not always lead to efficiency improvements. However, this should not be interpreted as a recommendation to systematically reduce expenditure for accredited private facilities. While scarcity may encourage adaptive efficiency behaviors, underfunding could jeopardize equity and quality of care. A more balanced approach would involve designing performance-based contracting mechanisms and efficiency-oriented incentives that replicate the positive effects of scarcity without compromising service accessibility.
Optimal facility sizing. The superior performance of smaller facilities suggests that healthcare system planners should reconsider facility sizing strategies. Rather than pursuing large-scale facilities, healthcare systems may benefit from networks of smaller, more agile facilities which can respond quickly to demand fluctuations and maintain higher utilization rates. The findings also suggest that investment decisions should prioritize enhancing capacity utilization over expanding scale. This means focusing on technologies and processes that maximize the deployment of existing resources instead of increasing physical capacity.
Staffing strategy reorientation. The finding that the doctor-to-nurse ratio (0.00–0.40) correlates with higher efficiency (0.70–1.00) provides practical guidance for human resource management. Healthcare systems should emphasize nursing-centered care models that optimize care continuity and process efficiency.
Public–Private Partnership design. The relationship between public funding and private facility distribution suggests that healthcare systems should develop sophisticated public–private partnership models that leverage private sector efficiency while maintaining public oversight and accessibility.
4.2.4. The Efficiency Paradox
The observed patterns also reveal an efficiency paradox. Some regions suffering from budget deficits (e.g., Molise and Apulia regions) achieve high efficiency levels despite tight budget constraints. This suggests that efficiency is not solely determined by resource availability but is influenced by governance, institutional discipline, and the ability to adapt to changing circumstances in healthcare facilities. Conversely, in surplus regions like Latium and Lombardy, high private expenditure often coexists with lower efficiency, possibly due to factors such as patient preferences, market maturity, or gaps in public service provision despite financial stability.
This highlights a crucial policy insight, as the same level of private expenditure can have different implications based on the fiscal balance of the regional system. In deficit regions, private care serves as a compensatory measure, filling gaps during financial strain, while in surplus regions, it acts more as a complementary enhancement driven by consumer choices. Policymakers should therefore avoid one-size-fits-all approaches and instead customize interventions to these unique contexts, balancing efficiency goals with equity and sustainability considerations.
5. Conclusions
5.1. Summary of Main Findings
This study highlights several significant findings regarding the efficiency of accredited private healthcare facilities in Italy, with implications at both the micro- and system levels.
First, the results show that private facilities operate at relatively high efficiency levels on average (mean cross-efficiency score of 0.923), exceeding values reported in previous studies on mixed public–private samples. However, only a limited proportion of facilities achieve full efficiency (about 8%), and approximately 9% perform substantially below the top-ranked units, indicating that there is room for improvement.
In terms of determining factors that contribute to inefficiency, the analysis identified resource underutilization indicators—particularly the inactive ward rate and bed non-occupancy rate—as the most influential factors negatively affecting efficiency. These elements were far more relevant in discriminating efficiency levels than traditional input measures or output volumes. This suggests that inefficiency in private facilities is primarily driven by underused productive capacity rather than shortages of human or material resources.
At the regional level, private facilities show generally high and relatively homogeneous efficiency scores, without the north–center–south disparities that are typically observed in public hospitals. However, significant inter-regional differences persist, with regions such as Basilicata and Aosta Valley demonstrating very high performance, while Friuli Venezia-Giulia and Sicily lag behind.
The analysis also revealed that facility size is a critical factor. Indeed, smaller facilities tend to be more efficient on average, whereas larger facilities exhibit signs of diseconomies of scale and greater variability in outcomes. Staff composition also affects efficiency, as a more balanced doctor-to-nurse ratio is associated with better performance, confirming the importance of team-based nursing-oriented organizational models.
At the systemic level, a complex relationship emerged between public funding and the role of private providers. High levels of public resource allocation tend to restrict the opportunities for private provision. In budget-deficit regions, spending on accredited private healthcare services is more strongly linked to increased efficiency. Conversely, in surplus regions, the relationship is reversed. This “efficiency paradox” reflects the fact that the impact of private accredited spending is strongly conditioned by the regional institutional and financial context.
Overall, the findings indicate that the efficiency of accredited private healthcare facilities depends less on overall resource availability and more on their optimal use, organizational size, and integration with the regional healthcare system.
5.2. Limitations and Future Research
While this study offers valuable theoretical and practical contributions, it is important to acknowledge several limitations that also present promising avenues for future research.
First, this study is based on a cross-sectional analysis using data from 2021, which was the only year for which complete and comparable information was available. While this provides a robust snapshot of efficiency in the Italian private accredited healthcare sector, efficiency is inherently dynamic and may evolve over time. Thus, results may reflect short-term conditions rather than structural performance patterns.
Several factors might have influenced efficiency measurements in subsequent years. During the COVID-19 pandemic, regulatory derogations (e.g., Decree-Law No. 18 of 17 March 2020 “Cura Italia”, Decree-Law No. 41 of 22 March 2021 “Sostegni”, and Decree-Law No. 73 of 25 May 2021 “Sostegni-bis”) allowed regions to purchase services from private providers beyond established expenditure caps, mitigating service interruptions. It is likely that they altered the input–output relationships and may have depressed efficiency relative to non-crisis periods. According to official data from the Ministry of Health, the number of hospital admissions recorded in accredited private facilities has steadily increased from 2021 to 2023. There was an increase of about 4.5% from 2021 to 2022 and a further 4.1% increase from 2022 to 2023 (Ministero della Salute, 2024b, 2025). These temporal dynamics suggest that operational and organizational adjustments occurred post-pandemic and efficiency scores may have changed since 2021. Moreover, the implementation of Ministerial Decree 77/2022, which aims to restructure territorial healthcare services, along with the gradual digitalization of healthcare processes, the diffusion of telemedicine, and innovative care models, might have enhanced efficiency over time, particularly for the facilities that were initially lagging behind. Thus, efficiency levels observed in more recent years may differ from those reported in this study, with the potential for higher average efficiency and reduced variability across private accredited facilities as the system stabilizes. Future research using multi-year data could apply dynamic DEA methods to assess efficiency changes and the long-term effects of policy or technological interventions.
Second, while the model includes important inputs and outputs, it only partially considers external factors, such as the spending constraints imposed by recovery plans. Other significant dimensions, such as socioeconomic conditions, regulatory frameworks, and the adoption of new technologies, were omitted from the analysis. Future research could explicitly link efficiency measurement with characteristics of the social and economic context, policy interventions, and technological innovations, assessing, for instance, the impact of regulatory reforms, the National Recovery and Resilience Plan (PNRR), the diffusion of digital health tools on the performance of accredited private providers by implementing two-stages analysis approaches (Matranga et al., 2014; Paraschi, 2023), or the robust conditional order-m estimation method (Gearhart & Michieka, 2018).
Third, the lack of access to facility-level cost data constrained our ability to explore the efficiency–cost relationship at the level of individual healthcare facilities. Despite our repeated efforts to obtain financial information, private facility managers were reluctant to share economic data. As a result, this study is unable to assess how operating costs influence the efficiency outcomes of individual facilities. Future research should aim to incorporate financial variables. This would enable a more thorough evaluation of performance drivers and policy trade-offs.
Fourth, the game cross-efficiency DEA model (Liang et al., 2008) provides robust comparative benchmarking and overcomes limitations of traditional DEA. However, it does have some methodological constraints. As a radial model, it does not explicitly consider input/output slacks, which could decrease the accuracy in identifying particular inefficiencies. Additionally, it has shown limited discriminative power when evaluating highly efficient facilities. Future studies could tackle these limitations by utilizing enhanced formulations like the SBM game cross-efficiency model (Huang et al., 2024) or by integrating DEA with other techniques to enhance differentiation.
Fifth, the heterogeneity of the sample is an additional limitation. The category of private accredited healthcare facilities includes a wide range of providers, from small clinics to large hospitals, offering various services like specialized care, diagnostic procedures, and elective surgeries. This diversity in structure and function could impact efficiency assessments because facilities with different services and sizes face unique constraints and goals. While DEA can handle multiple inputs and outputs, comparing highly diverse units may result in efficiency scores that reflect structural differences rather than just managerial performance. Future research could address this issue by using methodological extensions like the meta-frontier approach, which allows for estimating group-specific frontiers while ensuring comparability across diverse providers (Battese et al., 2004), or by categorizing facilities into more homogeneous subgroups (Nayar & Ozcan, 2008).
Sixth, desirable outputs were not adjusted using a case-mix factor due to the absence of this information for private providers in the database of the Ministry of Health. While prior literature suggests that the impact of case-mix adjustment may be limited (Rosko & Chilingerian, 1999), future studies could integrate this indicator, if available, to obtain a more refined efficiency estimation. Relying solely on efficiency indicators provides an incomplete picture of healthcare performance. While efficiency is a critical dimension, improvements should not come at the expense of patient outcomes. For instance, overemphasis on bed occupancy may result in unintended consequences such as overcrowding, staff burnout, and worse clinical results. Ideally, future research should integrate quality, equity, and patient-centered indicators—including clinical outcomes, patient safety, and satisfaction measures—into efficiency analyses, enabling a more holistic evaluation of healthcare performance and supporting sustainable, patient-oriented policy recommendations. However, in the Italian context, such data are not systematically available at the facility level for private accredited providers, as the Ministry of Health database focuses mainly on structural and activity-related indicators (e.g., hospital discharges, beds, and staff). A similar limitation applies to cost information. While aggregate expenditure data on accredited private providers are published at the regional or corporate level by the Ministry of Health and the State General Accounting Department, detailed cost data are not available for individual facilities. This lack of granularity underscores the need for improved transparency and data integration to make future multidimensional and cost-sensitive assessments feasible.
Finally, the exclusive focus of this study on private healthcare facilities limits the generalizability of findings to public or mixed health systems. Extending the methodological framework to other contexts would allow researchers to test the applicability of the substitution–supplementation dynamic and to assess potential adaptive responses of public and private providers facing resource constraints. Comparative studies across ownership models could also clarify the role of market mechanisms in driving efficiency.
Funding
This research received no external funding.
Institutional Review Board Statement
Not applicable.
Informed Consent Statement
Not applicable.
Data Availability Statement
The original data used in this study are publicly available from the Italian Ministry of Health database and can be accessed through their official portal. All datasets used are properly cited and were obtained in compliance with applicable data use policies. The datasets generated through the implementation of the DEA model and analyzed during the current study are not publicly available but are available from the author upon specific request.
Acknowledgments
The author gratefully acknowledges the insightful comments and suggestions provided by the anonymous referees, which have significantly contributed to improving this work.
Conflicts of Interest
The author declared no potential conflicts of interest with respect to the research, authorship, and/or publication of this article. The author received no financial support for the research, authorship, and/or publication of this article.
Appendix A
Table A1.
Mean values of input and output variables in geographic subgroups.
Table A2.
Mean values of input and output variables in different size-based quartiles.
Appendix B
Table A3.
Cross-efficiency values.
Appendix C

Figure A1.
Classification tree (no validation procedure). Source: own elaboration.

References
- Adler, N., Friedman, L., & Sinuany-Stern, Z. (2002). Review of ranking methods in the data envelopment analysis context. European Journal of Operational Research, 140, 249–265. [Google Scholar] [CrossRef]
- AGENAS. (2024). Monitoraggio spesa sanitaria: Andamento finanziamento SSN 2021–2024. Available online: https://www.agenas.gov.it/images/agenas/monitoraggio/spesa_sanitaria/dati_economici/Andamento_finanziamento_SSN_2001-2024.pdf (accessed on 16 August 2025).
- Andersen, P., & Petersen, N. C. (1993). A procedure for ranking efficient units in data envelopment analysis. Management Science, 39, 1261–1264. [Google Scholar] [CrossRef]
- Anderson, J. E., Ross, A. J., Macrae, C., & Wiig, S. (2020). Defining adaptive capacity in healthcare: A new framework for researching resilient performance. Applied Ergonomics, 87, 103111. [Google Scholar] [CrossRef] [PubMed]
- Andrews, A., & Emvalomatis, G. (2024). Efficiency measurement in healthcare: The foundations, variables, and models—A narrative literature review. Economics, 18, 20220062. [Google Scholar] [CrossRef]
- Angulo-Meza, L. A., & Lins, M. P. E. (2002). Review of methods for increasing discrimination in data envelopment analysis. Annals of Operations Research, 116, 225–242. [Google Scholar] [CrossRef]
- Antunes, B. B. P., Bastos, L. S. L., Hamacher, S., & Bozza, F. A. (2021). Using data envelopment analysis to perform benchmarking in intensive care units. PLoS ONE, 16(11), e0260025. [Google Scholar] [CrossRef]
- Armeni, P., Borsoi, L., Notarnicola, E., & Rota, S. (2022). La spesa sanitaria: Composizione ed evoluzione nella prospettiva nazionale, regionale ed aziendale. In CERGAS (Ed.), Rapporto OASI 2022: Osservatorio sulle aziende e sul sistema sanitario italiano (pp. 93–150). EGEA. Available online: https://cergas.unibocconi.eu/observatories/oasi_/oasi-report-2022 (accessed on 16 August 2025).
- Asmild, M., Hollingsworth, B., & Birch, S. (2013). The scale of hospital production in different settings: One size does not fit all. Journal of Productivity Analysis, 40, 197–206. [Google Scholar] [CrossRef]
- Auteri, M., Guccio, C., Pammolli, F., Pignataro, G., & Vidoli, F. (2019). Spatial heterogeneity in non-parametric efficiency: An application to Italian hospitals. Social Science and Medicine, 239, 112544. [Google Scholar] [CrossRef]
- Baker, L. C., Phibbs, C. S., Guarino, C., Supina, D., & Reynolds, J. L. (2004). Within-year variation in hospital utilization and its implications for hospital costs. Journal of Health Economics, 23(1), 191–211. [Google Scholar] [CrossRef]
- Banker, R. D., & Chang, H. (2006). The super-efficiency procedure for outlier identification, not for ranking efficient units. European Journal of Operational Research, 175(2), 1311–1320. [Google Scholar] [CrossRef]
- Banker, R. D., Charnes, R. F., & Cooper, W. W. (1984). Some models for estimating technical and scale inefficiencies in data envelopment analysis. Management Science, 30, 1078–1092. [Google Scholar] [CrossRef]
- Barbetta, G. P., Turati, G., & Zago, M. A. (2007). Behavioral differences between public and private not-for-profit hospitals in the Italian national health service. Health Economics, 16, 75–96. [Google Scholar] [CrossRef] [PubMed]
- Barra, C., Lagravinese, R., & Zotti, R. (2022). Exploring hospital efficiency within and between Italian regions: New empirical evidence. Journal of Productivity Analysis, 57, 269–284. [Google Scholar] [CrossRef]
- Battese, G. E., Rao, D. S. P., & O’Donnell, C. J. A. (2004). Metafrontier production function for estimation of technical efficiencies and technology gaps for firms operating under different technologies. Journal of Productivity Analysis, 21, 91–103. [Google Scholar] [CrossRef]
- Bayley, T., Begen, M. A., Rodrigues, F. F., & Barrett, D. (2022). Relative efficiency of radiation treatment centers: An application of data envelopment analysis. Healthcare, 10(6), 1033. [Google Scholar] [CrossRef]
- Bianchi, L., Caravella, S., & Petraglia, C. (2024). Un Paese due cure. I divari Nord-Sud nel diritto alla salute. Informazioni Svimez. Available online: https://www.astrid-online.it/static/upload/sani/sanitai_informazioni_web_ok.pdf (accessed on 22 March 2025).
- Bjorvatn, A. (2018). Private or public hospital ownership: Does it really matter? Social Science & Medicine, 196, 166–174. [Google Scholar] [CrossRef] [PubMed]
- Blank, J. L., & Valdmanis, V. G. (2010). Environmental factors and productivity on Dutch hospitals: A semi-parametric approach. Health Care Management Science, 13(1), 27–34. [Google Scholar] [CrossRef]
- Bobini, M., Longo, F., & Ricci, A. (2020). Gli erogatori privati accreditati: Inquadramento e ruolo nella risposta del SSN al COVID-19. In CERGAS-Bocconi (Ed.), Rapporto OASI 2020. EGEA. [Google Scholar]
- Boffardi, R. (2022). How efficient is the Italian health system? Evidence on the role of political-institutional dynamics. Socio-Economic Planning Sciences, 84, 101388. [Google Scholar] [CrossRef]
- Bosque-Mercader, L., & Siciliani, L. (2023). The association between bed occupancy rates and hospital quality in the English national health service. European Journal of Health Economics, 24, 209–236. [Google Scholar] [CrossRef]
- Breiman, L., Friedman, J. H., Olshen, R. A., & Stone, C. J. (1984). Classification and regression trees. Chapman and Hall, Wadsworth Inc. [Google Scholar]
- Bruzzi, S., Ivaldi, E., & Santagata, M. (2022). Measuring regional performance in the Italian NHS: Are disparities decreasing? Social Indicators Research, 159, 1057–1084. [Google Scholar] [CrossRef]
- Burnett, S., Mendel, P., Nunes, F., Wiig, S., van den Bovenkamp, H., Karltun, A., Robert, G., Anderson, J., Vincent, C., & Fulop, N. (2016). Using institutional theory to analyse hospital responses to external demands for finance and quality in five European countries. Journal of Health Services Research and Policy, 21(2), 109–117. [Google Scholar] [CrossRef]
- Buzelli, M. L., & Boyce, T. (2021). The privatization of the Italian national health system and its impact on health emergency preparedness and response: The COVID-19 case. International Journal of Health Services, 51(4), 501–508. [Google Scholar] [CrossRef]
- Campanella, P., Azzolini, E., Izzi, A., Pelone, F., De Meo, C., La Milia, D., Specchia, M. L., & Ricciardi, W. (2017). Hospital efficiency: How to spend less maintaining quality? Annali dell’Istituto Superiore di Sanità, 53(1), 46–53. [Google Scholar]
- Campos, M. S., Fernández-Montes, A., Gavilan, J. M., & Velasco, F. (2016). Public resource usage in health systems: A data envelopment analysis of the efficiency of health systems of autonomous communities in Spain. Public Health, 138, 33–40. [Google Scholar] [CrossRef]
- Cantor, V. J. M., & Poh, K. L. (2018). Integrated analysis of healthcare efficiency: A systematic review. Journal of Medical Systems, 42(1), 8. [Google Scholar] [CrossRef] [PubMed]
- Cavalieri, M., Guccio, C., Lisi, D., & Pignataro, G. (2018). Does the extent of per case payment system affect hospital efficiency?: Evidence from the Italian NHS. Public Finance Review, 46(1), 117–149. [Google Scholar] [CrossRef]
- Chan, Y., & Walmsley, R. P. (1997). Learning and understanding the Kruskal-Wallis one-way analysis-of-variance-by-ranks test for differences among three or more independent groups. Physical Therapy & Rehabilitation Journal, 77(12), 1755–1762. [Google Scholar]
- Chang, H., Cheng, M.-A., & Das, S. (2004). Hospital ownership and operating efficiency: Evidence from Taiwan. European Journal of Operational Research, 159, 513–527. [Google Scholar] [CrossRef]
- Chen, K. C., Chen, H. M., Chien, L. N., & Yu, M. M. (2019). Productivity growth and quality changes of hospitals in Taiwan: Does ownership matter? Health Care Management Science, 22, 451–461. [Google Scholar] [CrossRef]
- Cheng, Z., Cai, M., Tao, H., He, Z., Lin, X., Lin, H., & Zuo, Y. (2016). Efficiency and productivity measurement of rural township hospitals in China: A bootstrapping data envelopment analysis. BMJ Open, 6(11), e011911. [Google Scholar] [CrossRef]
- Chern, J. Y., & Wan, T. T. H. (2000). The impact of the prospective payment system on the technical efficiency of hospitals. Journal of Medical Systems, 24, 159–172. [Google Scholar] [CrossRef] [PubMed]
- Choi, J. H., Park, I., Jung, I., & Dey, A. (2017). Complementary effect of patient volume and quality of care on hospital cost efficiency. Health Care Management Science, 20, 221–231. [Google Scholar] [CrossRef] [PubMed]
- Conover, W. J. (1999). Practical nonparametric statistics (3rd ed.). John Wiley & Sons. [Google Scholar]
- Cook, W. D., & Seiford, L. M. (2009). Data envelopment analysis (DEA)—Thirty years on. European Journal of Operational Research, 192(1), 1–17. [Google Scholar] [CrossRef]
- Cooper, W. W., Seiford, L. M., & Tone, K. (2007). Data envelopment analysis: A comprehensive text with models, applications, references and DEA-Solver software. Springer-Verlag US. [Google Scholar]
- Cox, J. C., Green, E. P., & Hennig-Schmidt, H. (2016). Experimental and behavioral economics of healthcare. Journal of Economic Behavior & Organization, 131 Part B, A1–A4. [Google Scholar] [CrossRef]
- Czypionka, T., Kraus, M., Mayer, S., & Röhrling, G. (2014). Efficiency, ownership, and financing of hospitals: The case of Austria. Health Care Management Science, 17(4), 331–347. [Google Scholar] [CrossRef]
- Daidone, S., & D’Amico, F. (2009). Technical efficiency, specialization and ownership form: Evidences from a pooling of Italian hospitals. Journal of Productivity Analysis, 32, 203–216. [Google Scholar] [CrossRef]
- de Belvis, A. G., Meregaglia, M., Morsella, A., Adduci, A., Perilli, A., Cascini, F., Solipaca, A., Fattore, G., Ricciardi, W., Maresso, A., & Scarpetti, G. (2022). Italy: Health system review. Health Systems in Transition, 24(4), 1–236. [Google Scholar]
- Delai, N. (Ed.). (2023). Health & hospitals in Italy, 20th annual report 2022. Franco Angeli. [Google Scholar]
- De Nicola, A., Gitto, S., Mancuso, P., & Valdmanis, V. (2014). Healthcare reform in Italy: An analysis of efficiency based on nonparametric methods. International Journal of Health Planning Management, 29(1), e48–e63. [Google Scholar] [CrossRef]
- Dimas, G., Goula, A., & Soulis, S. (2012). Productive performance and its components in Greek public hospitals. Operational Research, 12(1), 15–27. [Google Scholar] [CrossRef]
- Di Stefano, R. (2023). L’impatto dell’emergenza sanitaria da COVID-19 sulla spesa sanitaria regionale negli anni 2019–2021. Economia e Politica, 1–6. Available online: https://www.economiaepolitica.it/_pdfs/pdf-14556.pdf (accessed on 17 August 2025).
- Domenighetti, G., Vineis, P., De Pietro, C., & Tomada, A. (2010). Ability to pay and equity in access to Italian and British national health services. European Journal of Public Health, 20, 500–503. [Google Scholar] [CrossRef]
- Doyle, J. R., & Green, R. H. (1994). Efficiency and cross-efficiency in DEA: Derivations, meanings and uses. Journal of the Operational Research Society, 45(5), 567–578. [Google Scholar] [CrossRef]
- Dyson, R. G., & Shale, E. (2010). Data envelopment analysis, operational research and uncertainty. Journal of the Operational Research Society, 61(1), 25–34. [Google Scholar] [CrossRef]
- Elliott, D. J., Young, R. S., Brice, J., Aguiar, R., & Kolm, P. (2014). Effect of hospitalist workload on the quality and efficiency of care. JAMA Internal Medicine, 174(5), 786–793. [Google Scholar] [CrossRef] [PubMed]
- Felisini, D., & Salsano, F. (2024). Between public and private: The business history of hospitals in Italy (1968–2018). In P. Fernández Pérez (Ed.), Business history of hospitals in the 20th century (Frontiers in Economic History). Springer Nature Switzerland. [Google Scholar]
- Ferreira, D. C., Figueira, J. R., Greco, S., & Marques, R. C. (2023). Data envelopment analysis models with imperfect knowledge of input and output values: An application to Portuguese public hospitals. Expert Systems with Applications, 231, 120543. [Google Scholar] [CrossRef]
- Ferreira, D. C., Nunes, A. M., & Marques, R. C. (2018). Doctors, nurses, and the optimal scale size in the Portuguese public hospitals. Health Policy, 122, 1093–1100. [Google Scholar] [CrossRef] [PubMed]
- Flokou, A., Kontodimopoulos, N., & Niakas, D. (2011). Employing post-DEA cross-evaluation and cluster analysis in a sample of Greek NHS hospitals. Journal of Medical Systems, 35(5), 1001–1014. [Google Scholar] [CrossRef]
- Fragkiadakis, G., Doumpos, M., Zopounidis, C., & Germain, C. (2016). Operational and economic efficiency analysis of public hospitals in Greece. Annals of Operational Research, 247(2), 787–806. [Google Scholar] [CrossRef]
- Furukawa, M. F., Raghu, T. S., & Shao, B. B. M. (2010). Electronic medical records and cost efficiency in hospital medical-surgical units. INQUIRY: The Journal of Health Care Organization, Provision, and Financing, 47(2), 110–123. [Google Scholar] [CrossRef]
- Gallaher, J. R., Chise, Y., Reiss, R., Purcell, L. N., Manjolo, M., & Charles, A. (2021). Underutilization of operative capacity at the district hospital level in a resource-limited setting. Journal of Surgical Research, 259, 130–136. [Google Scholar] [CrossRef]
- Garavaglia, G., Lettieri, E., Agasisti, T., & Lopez, S. (2011). Efficiency and quality of care in nursing homes: An Italian case study. Health Care Management Science, 14(1), 22–35. [Google Scholar] [CrossRef]
- Gearhart, R., & Michieka, N. (2018). A comparison of the robust conditional order-m estimation and two stage DEA in measuring healthcare efficiency among California counties. Economic Modelling, 73, 395–406. [Google Scholar] [CrossRef]
- Giancotti, M., Guglielmo, A., & Mauro, M. (2017). Efficiency and optimal size of hospitals: Results of a systematic search. PLoS ONE, 12(3), e0174533. [Google Scholar] [CrossRef]
- Giancotti, M., Rotundo, G., Pipitone, V., & Mauro, M. (2018). Efficiency and optimal size of Italian public hospitals: Results from data envelopment analysis. Epidemiology, Biostatistics and Public Health, 15(4), e12929-1. [Google Scholar] [CrossRef]
- Giudice, L., Preti, L. M., & Ricci, A. (2022). Gli erogatori privati accreditati: Inquadramento e ruolo potenziale nell’implementazione del Piano Nazionale di Ripresa e Resilienza. In CERGAS (Ed.), Rapporto OASI 2022: Osservatorio sulle aziende e sul sistema sanitario italiano (pp. 151–198). EGEA. Available online: https://cergas.unibocconi.eu/observatories/oasi_/oasi-report-2022 (accessed on 15 January 2025).
- Giuliani, G., & Gitto, S. (2025). What is the difference between specialisation and diversity in hospitals? Investigating their relationship with efficiency. Socio-Economic Planning Sciences, 100, 102251. [Google Scholar] [CrossRef]
- Grosskopf, S., & Valdmanis, V. (1993). Evaluating hospital performance with case-mix adjusted outputs. Medical Care, 31(6), 525–532. [Google Scholar] [CrossRef] [PubMed]
- Gruca, T. S., & Nath, D. (2001). The technical efficiency of hospitals under a single payer system: The case of Ontario community hospitals. Health Care Management Science, 4, 91–101. [Google Scholar] [CrossRef]
- Guccio, C., Pignataro, G., Romeo, D., & Vidoli, F. (2024). Is austerity good for efficiency, at least? A counterfactual assessment for the Italian NHS. Socio-Economic Planning Sciences, 92, 101798. [Google Scholar] [CrossRef]
- Guerrini, A., Romano, G., Campedelli, B., Moggi, S., & Leardini, C. (2018). Public vs. private in hospital efficiency: Exploring determinants in a competitive environment. International Journal of Public Administration, 41(3), 181–189. [Google Scholar] [CrossRef]
- Huang, T., Li, S., Liu, F., & Diao, H. (2024). A slacks-based measure model for computing game cross-efficiency. Systems, 12(3), 78. [Google Scholar] [CrossRef]
- Huybrechts, I., Declercq, A., Verté, E., Raeymaeckers, P., & Anthierens, S. (2024). How does the external context affect an implementation processes? A qualitative study investigating the impact of macro-level variables on the implementation of goal-oriented primary care. Implement Science, 19(1), 32. [Google Scholar] [CrossRef]
- Jones, R. (2011). Hospital bed occupancy demystified. British Journal of Healthcare Management, 17(6), 242–248. [Google Scholar] [CrossRef]
- Jordi, E., Pley, C., Jowett, M., Jaoude, G. J. A., & Haghparast-Bidgoli, H. (2020). Assessing the efficiency of countries in making progress towards universal health coverage: A data envelopment analysis of 172 countries. BMJ Global Health, 5, e002992. [Google Scholar] [CrossRef] [PubMed]
- Jung, S., Son, J., Kim, C., & Chung, K. (2023). Efficiency measurement using Data Envelopment Analysis (DEA) in public healthcare: Research trends from 2017 to 2022. Processes, 11(3), 811. [Google Scholar] [CrossRef]
- Kaya, S., & Cafrı, R. (2016). Analysis of the efficiency determinants of health systems in OECD countries by DEA and panel Tobit. Social Indicators Research, 129, 113–132. [Google Scholar] [CrossRef]
- Klumpp, M., Loske, D., & Bicciato, S. (2022). COVID-19 health policy evaluation: Integrating health and economic perspectives with a data envelopment analysis approach. European Journal of Health Economics, 23, 1263–1285. [Google Scholar] [CrossRef]
- Kohl, S., Schoenfelder, J., Fügener, A., & Brunner, J. O. (2019). The use of Data Envelopment Analysis (DEA) in healthcare with a focus on hospitals. Health Care Management Science, 22, 245–286. [Google Scholar] [CrossRef]
- Kruse, F. M., Stadhouders, N. W., Adang, E. M., Groenewoud, S., & Jeurissen, P. P. T. (2018). Do private hospitals outperform public hospitals regarding efficiency, accessibility, and quality of care in the European Union? A literature review. International Journal of Health Planning and Management, 33(2), e434–e453. [Google Scholar] [CrossRef]
- La Rocca, A., & Hoholm, T. (2017). Coordination between primary and secondary care: The role of electronic messages and economic incentives. BMC Health Services Research, 17, 149. [Google Scholar] [CrossRef]
- Lee, S.-Y., Chinnam, R. B., Dalkiran, E., Krupp, S., & Nauss, M. (2021). Proactive coordination of inpatient bed management to reduce emergency department patient boarding. International Journal of Production Economics, 231, 107842. [Google Scholar] [CrossRef]
- Lemon, S. C., Roy, J., Clark, M. A., Friedmann, P. D., & Rakowski, W. (2003). Classification and regression tree analysis in public health: Methodological review and comparison with logistic regression. Annals of Behavioral Medicine, 26(3), 172–181. [Google Scholar] [CrossRef]
- Li, H., & Dong, S. (2015). Measuring and benchmarking technical efficiency of public hospitals in Tianjin, China: A bootstrap–data envelopment analysis approach. INQUIRY: Journal of Health Care Organization, Provision, and Financing, 52, 0046958015605487. [Google Scholar] [CrossRef]
- Li, H., Tao, H., & Li, G. (2021). Predictors and reasons for inappropriate hospitalization days for surgical patients in a tertiary hospital in Wuhan, China: A retrospective study. BMC Health Services Research, 21, 900. [Google Scholar] [CrossRef]
- Liang, L., Wu, J., Cook, W. D., & Zhu, J. (2008). The DEA game cross-efficiency model and its Nash equilibrium. Operations Research, 56, 1278–1288. [Google Scholar] [CrossRef]
- Madsen, F., Ladelund, S., & Linneberg, A. (2014). High levels of bed occupancy associated with increased inpatient and thirty-day hospital mortality in Denmark. Health Affairs, 33(7), 1236–1244. [Google Scholar] [CrossRef] [PubMed]
- Mahate, A., Hamidi, S., & Akinci, F. (2016). Measuring the effect of size on technical efficiency of the United Arab Emirates hospitals. Global Journal of Health Science, 9(3), 116. [Google Scholar] [CrossRef]
- Maietti, E., Sanmarchi, F., Toth, F., de Pietro, C., Fantini, M. P., & Golinelli, D. (2023). Changes in private health service utilisation and access to the Italian National Health Service between 2006 and 2019: A cross-sectional comparative study. BMJ Open, 13(5), e070975. [Google Scholar] [CrossRef]
- Mancuso, P., & Valdmanis, V. G. (2016). Care appropriateness and health productivity evolution: A non-parametric analysis of the Italian regional health systems. Applied Health Economics and Health Policy, 14(5), 595–607. [Google Scholar] [CrossRef]
- Mapelli, V. (1999). Il sistema sanitario italiano. Il Mulino. [Google Scholar]
- Maragos, E. K., Maravelakis, P. E., & Linardis, A. I. (2021). A DEA evaluation of the successful implementation of HEALTH2020 policies. Socio-Economic Planning Sciences, 76, 100968. [Google Scholar] [CrossRef]
- Martini, G., Berta, P., Mullahy, J., & Vittadini, G. (2014). The effectiveness–efficiency trade-off in health care: The case of hospitals in Lombardy, Italy. Regional Science and Urban Economics, 49, 217–231. [Google Scholar] [CrossRef]
- Matranga, D., Bono, F., Casuccio, A., Firenze, A., Marsala, L., Giaimo, R., Sapienza, F., & Vitale, F. (2014). Evaluating the effect of organization and context on technical efficiency: A second-stage DEA analysis of Italian hospitals. Epidemiology, Biostatistics, and Public Health, 11(1), e8785.1–e8785.11. [Google Scholar] [CrossRef] [PubMed]
- Matranga, D., & Sapienza, F. (2015). Congestion analysis to evaluate the efficiency and appropriateness of hospitals in Sicily. Health Policy, 119, 324–332. [Google Scholar] [CrossRef]
- Medarević, A., & Vuković, D. (2021). Efficiency and productivity of public hospitals in serbia using DEA-Malmquist model and Tobit regression model, 2015–2019. International Journal of Environmental Research and Public Health, 18(23), 12475. [Google Scholar] [CrossRef] [PubMed]
- Ministero della Salute. (2015). Annuario statistico del Servizio Sanitario Nazionale: Assetto organizzativo, attività e fattori produttivi del SSN, anno 2012. Available online: https://www.quotidianosanita.it/allegati/allegato3094452.pdf (accessed on 11 December 2024).
- Ministero della Salute. (2023). Annuario statistico del Servizio Sanitario Nazionale: Assetto organizzativo, attività e fattori produttivi del SSN, anno 2022. Available online: https://www.salute.gov.it/imgs/C_17_pubblicazioni_3425_allegato.pdf (accessed on 25 February 2025).
- Ministero della Salute. (2024a). Banca dati. Available online: https://www.salute.gov.it/new/it/banche-dati/banca-dati-del-servizio-sanitario-nazionale (accessed on 17 August 2024).
- Ministero della Salute. (2024b). Rapporto annuale sull’attività di ricovero ospedaliero—DATI SDO 2022. Available online: https://www.salute.gov.it/new/it/pubblicazione/rapporto-annuale-sullattivita-di-ricovero-ospedaliero-dati-sdo-2022 (accessed on 18 August 2025).
- Ministero della Salute. (2025). Rapporto annuale sull’attività di ricovero ospedaliero—DATI SDO 2023. Available online: https://www.salute.gov.it/new/it/pubblicazione/rapporto-annuale-sullattivita-di-ricovero-ospedaliero-dati-sdo-2023 (accessed on 18 August 2025).
- Mitropoulos, P. (2022). A metafrontier Global Malmquist framework for hospitals productivity and quality measurement: Evidence from the Greek economic recession. EURO Journal on Decision Processes, 10, 100018. [Google Scholar] [CrossRef]
- Molander, P. (2025). Public versus private healthcare systems in the OECD area—A broad evaluation of performance. European Journal of Health Economics. (in press).
- Nayar, P., & Ozcan, Y. A. (2008). Data envelopment analysis comparison of hospital efficiency and quality. Journal of Medical Systems, 32, 193–199. [Google Scholar] [CrossRef]
- Nayar, P., Ozcan, Y. A., Yu, F., & Nguyen, A. T. (2013). Benchmarking urban acute care hospitals: Efficiency and quality perspectives. Health Care Management Review, 38(2), 137–145. [Google Scholar] [CrossRef]
- Nepomuceno, T. C. C., Piubello Orsini, L., de Carvalho, V. D. H., Poleto, T., & Leardini, C. (2022). The core of healthcare efficiency: A comprehensive bibliometric review on frontier analysis of hospitals. Healthcare, 10, 1316. [Google Scholar] [CrossRef]
- Nuti, S., Daraio, C., Speroni, C., & Vainieri, M. (2011). Relationships between technical efficiency and the quality and costs of health care in Italy. International Journal for Quality in Health Care, 23(3), 324–330. [Google Scholar] [CrossRef][Green Version]
- Oikonomou, N., Tountas, Y., Mariolis, A., Souliotis, K., Athanasakis, K., & Kyriopoulos, J. (2016). Measuring the efficiency of the Greek rural primary health care using a restricted DEA model: The case of southern and western Greece. Health Care Management Science, 19(4), 313–325. [Google Scholar] [CrossRef]
- Ozcan, M., & Peker, S. (2023). A classification and regression tree algorithm for heart disease modeling and prediction. Healthcare Analytics, 3, 100130. [Google Scholar] [CrossRef]
- Ozcan, Y. A. (2009). Quantitative methods in health care management: Techniques and applications (2nd ed.). Jossey-Bass Wiley. [Google Scholar]
- Ozcan, Y. A. (2014). Health care benchmarking and performance evaluation (2nd ed.). Springer. [Google Scholar]
- Paraschi, E. P. (2023). Healthcare efficiency assessment in the southeastern european countries using two-stage DEA analysis. In N. Persiani, I. E. Vannini, A. Romiti, A. Karasavvoglou, & P. Polychronidou (Eds.), Challenges of healthcare systems in the era of COVID-19. Contributions to Management Science. [Google Scholar]
- Perrin, J. M., & Valvona, J. (1986). Does increased physician supply affect quality of care? Health Affairs, 5, 63–72. [Google Scholar] [CrossRef][Green Version]
- Pianori, D., Maietti, E., Lenzi, J., Quargnolo, M., Guicciardi, S., Adja, K. Y. C., Fantini, M. P., & Toth, F. (2020). Sociodemographic and health service organizational factors associated with the choice of the private versus public sector for specialty visits: Evidence from a national survey in Italy. PLoS ONE, 15, e0232827. [Google Scholar] [CrossRef]
- Piubello Orsini, L., Leardini, C., Vernizzi, S., & Campedelli, B. (2021). Inefficiency of public hospitals: A multistage data envelopment analysis in an Italian region. BMC Health Services Research, 21, 1281. [Google Scholar] [CrossRef] [PubMed]
- Puiu, I. A., & Bîlbîie, A. (2025). Measuring productivity in the healthcare sector: A bibliometric and content analysis. Health Economics Review, 15, 24. [Google Scholar] [CrossRef] [PubMed]
- Ramanuj, P. P., Scharf, D. M., Ferenchick, E., Spaeth-Rublee, B., & Pincus, H. A. (2018). Measuring efficiency at the interface of behavioral and physical health care. The Journal of Mental Health Policy and Economics, 21(2), 79–86. [Google Scholar] [PubMed]
- Ramírez-Valdivia, M. T., Maturana, S., & Salvo-Garrido, S. (2011). A multiple stage approach for performance improvement of primary healthcare practice. Journal of Medical Systems, 35(5), 1015–1028. [Google Scholar] [CrossRef]
- Rebba, V., & Rizzi, D. (2001). Analisi dell’efficienza relativa delle strutture di ricovero con il metodo DEA: Il caso degli ospedali del Veneto. Politiche Sanitarie, 2(1), 23–43. [Google Scholar]
- Rosko, M. D., & Chilingerian, J. A. (1999). Estimating hospital inefficiency: Does case mix matter? Journal of Medical Systems, 23, 57–71. [Google Scholar] [CrossRef]
- Sala-Garrido, R., Mocholi-Arce, M., Molinos-Senante, M., & Maziotis, A. (2022). Measuring technical, environmental and eco-efficiency in municipal solid waste management in Chile. International Journal of Sustainable Engineering, 15(1), 71–85. [Google Scholar] [CrossRef]
- Salinas-Jiménez, J., & Smith, P. (1996). Data envelopment analysis applied to quality in primary health care. Annals of Operations Research, 67, 141–161. [Google Scholar] [CrossRef]
- Sapienza, F., & Matranga, D. (2018). Evaluating the reform of the healthcare system in Sicily: Variations of efficiency and appropriateness between 2008 and 2010. Epidemiology Biostatistics and Public Health, 15(1), e12593-1–e12593-10. [Google Scholar] [CrossRef]
- Sasso, L., Bagnasco, A., Zanini, M., Catania, G., Aleo, G., Santullo, A., Spandonaro, F., Icardi, G., Watson, R., & Sermeus, W. (2017). The general results of the RN4CAST survey in Italy. Journal of Advanced Nursing, 73, 2028–2030. [Google Scholar] [CrossRef]
- Scott, A., Shiell, A., & Farnworth, M. G. (1993). The value of early discharge: Dispelling some myths. Health Policy, 26(2), 81–91. [Google Scholar] [CrossRef]
- Seiford, L. M., & Zhu, J. (2002). Modeling undesirable factors in efficiency evaluation. European Journal of Operational Research, 142(1), 16–20. [Google Scholar] [CrossRef]
- Sexton, T. R., Silkman, R. H., & Hogan, A. J. (1986). Data envelopment analysis: Critique and extensions. In R. H. Silkman (Ed.), Measuring efficiency: An assessment of data envelopment analysis (pp. 73–105). Jossey-Bass. [Google Scholar]
- Sheather, S. J. (2004). Density estimation. Statistical Science, 19(4), 588–597. [Google Scholar] [CrossRef]
- Signorelli, C., Odone, A., Oradini-Alacreu, A., & Pelissero, G. (2020). Universal health coverage in Italy: Lights and shades of the Italian National Health Service which celebrated its 40th anniversary. Health Policy, 124(1), 69–74. [Google Scholar] [CrossRef]
- Silverman, B. W. (1998). Density estimation for statistics and data analysis (1st ed.). Routledge. [Google Scholar]
- Søndergaard, S. F., Rasmussen, B., Kerr, D., Frederiksen, K., Redley, B., Trueman, M., Kolbaek, R., Laursen, H. S., & Bloomer, M. J. (2023). Nurses’ work experiences in hospital wards with single rooms: An integrative review. Journal of Clinical Nursing, 32(19–20), 7036–7049. [Google Scholar] [CrossRef] [PubMed]
- Staat, M. (2006). Efficiency of hospitals in Germany: A DEA–bootstrap approach. Applied Economics, 38(19), 2255–2263. [Google Scholar] [CrossRef]
- Stefko, R., Gavurova, B., & Kocisova, K. (2018). Healthcare efficiency assessment using DEA analysis in the Slovak Republic. Health Economic Review, 8, 6. [Google Scholar] [CrossRef] [PubMed]
- Stone, K., Zwiggelaar, R., Jones, P., & Mac Parthaláin, N. (2022). A systematic review of the prediction of hospital length of stay: Towards a unified framework. PLOS Digital Health, 1(4), e0000017. [Google Scholar] [CrossRef]
- Su, W., Hou, Y., Huang, M., Xu, J., Du, Q., & Wang, P. (2023). Evaluating the efficiency of primary health care institutions in China: An improved three-stage data envelopment analysis approach. BMC Health Services Research, 23(1), 995. [Google Scholar] [CrossRef]
- Tiemann, O., & Schreyögg, J. (2012). Changes in hospital efficiency after privatization. Health Care Management Science, 15, 310–326. [Google Scholar] [CrossRef]
- Toth, F. (2020). Reducing waiting times in the Italian NHS: The case of Emilia-Romagna. Social Policy and Administration, 54, 1110–1122. [Google Scholar] [CrossRef]
- Trerise, B., Dodek, P., Leung, A., & Spinelli, J. J. (2001). Underutilization of acute care settings in a tertiary care hospital. International Journal for Quality in Health Care, 13(1), 27–32. [Google Scholar] [CrossRef] [PubMed][Green Version]
- Tynkkynen, L. K., & Vrangbæk, K. (2018). Comparing public and private providers: A scoping review of hospital services in Europe. BMC Health Services Research, 18, 141. [Google Scholar] [CrossRef]
- Valdmanis, V., Rosko, M., Mancuso, P., Tavakoli, M., & Farrar, S. (2017). Measuring performance change in Scottish hospitals: A Malmquist and time-series approach. Health Services and Outcomes Research Methodology, 17, 113–126. [Google Scholar] [CrossRef][Green Version]
- van Doorslaer, E., & Koolman, X. (2004). Explaining the differences in income-related health inequalities across European countries. Health Economics, 13(7), 609–628. [Google Scholar] [CrossRef]
- Varabyova, Y., Blankart, C. R., Torbica, A., & Schreyögg, J. (2017). Comparing the efficiency of hospitals in Italy and Germany: Nonparametric conditional approach based on partial frontier. Health Care Management Science, 20(3), 379–394. [Google Scholar] [CrossRef]
- Vitaliano, D. F. (1987). On the estimation of hospital cost-functions. Journal of Health Economics, 6, 305–318. [Google Scholar] [CrossRef]
- Wang, Y. M., & Chin, K. S. (2010). Some alternative models for DEA cross-efficiency evaluation. International Journal of Production Economics, 128, 332–338. [Google Scholar] [CrossRef]
- Wilson, P. (1995). Detecting influential observations in data envelopment analysis. Journal of Productivity Analysis, 6(1), 27–45. [Google Scholar] [CrossRef]
- Wu, J., Liang, L., & Chen, Y. (2009). DEA game cross-efficiency approach to Olympic rankings. Omega, 37, 909–918. [Google Scholar] [CrossRef]
- Zare, H., Tavana, M., Mardani, A., Masoudian, S., & Saraji, M. K. (2019). A hybrid data envelopment analysis and game theory model for performance measurement in healthcare. Health Care Management Science, 22, 475–488. [Google Scholar] [CrossRef]
- Zarrin, M., Schoenfelder, J., & Brunner, J. O. (2022). Homogeneity and best practice analyses in hospital performance management: An analytical framework. Health Care Management Science, 25, 406–425. [Google Scholar] [CrossRef]
- Zhu, J. (2003). Quantitative models for performance evaluation and benchmarking: Data envelopment analysis with spreadsheets and DEA Excel solver. Kluwer Academic Publishers. [Google Scholar]
- Zimmerman, R. K., Balasubramani, G. K., Nowalk, M. P., Eng, H., Urbanski, L., Jackson, M. L., Jackson, L. A., McLean, H. Q., Belongia, E. A., Monto, A. S., Malosh, R. E., Gaglani, M., Clipper, L., Flannery, B., & Wisniewski, S. R. (2016). Classification and regression tree (CART) analysis to predict influenza in primary care patients. BMC Infectious Disease, 16(1), 503. [Google Scholar] [CrossRef]
- Zinn, J., & Flood, A. B. (2009). Commentary: Slack resources in health care organizations--fat to be trimmed or muscle to be exercised? Health Services Research, 44(3), 812–820. [Google Scholar] [CrossRef]


Disclaimer/Publisher’s Note: The statements, opinions and data contained in all publications are solely those of the individual author(s) and contributor(s) and not of MDPI and/or the editor(s). MDPI and/or the editor(s) disclaim responsibility for any injury to people or property resulting from any ideas, methods, instructions or products referred to in the content. |
© 2025 by the author. Licensee MDPI, Basel, Switzerland. This article is an open access article distributed under the terms and conditions of the Creative Commons Attribution (CC BY) license (https://creativecommons.org/licenses/by/4.0/).