Abstract
A deeper understanding of the relationships between the local and landscape scales in herbivore foraging should place the management of rangeland production systems on a firmer footing. The objective was to test whether local-scale landscape features modulate the coupling between locomotion and eating, thereby altering the pattern of landscape-scale grazing pressure. We studied shepherded small-ruminant herds on hilly semiarid rangeland by integrating acoustic monitoring to detect jaw movements, GPS to track location and movement, and GIS to link location to landscape attributes. Based on 69 one-day foraging routes, minutely rate of jaw movement (RJM) as a function of time-into-foraging-route showed a unimodal concave shape but did not respond to path angle. Minutely movement velocity responded convexly to time-into-foraging-route, and the quadratic term for path angle was negative and highly significant. The response to path angle was concave and symmetrical for uphill and downhill travel. Based on the empirical evidence that increasing path angle reduces velocity but not RJM and a set of reasonable associated assumptions, it is inferred that more jaw movements are performed per unit area scanned by the animal. It is further inferred abductively that more bites are removed per unit area and that more mass is removed per unit area, and hence, grazing pressure is more intense on sloping terrain than on level areas. For a given duration of foraging route, an increase in density of bite placement at the local behavioral scale implies a contraction in the surface area of the daily herd footprint at the landscape scale. This has implications for how carrying capacity of such areas should be defined.
1. Introduction
Grazing behavior lies at the hub of the relationships that connect the abundance of forage resources, animal productivity, and impact on the landscape [1,2,3]. On extensive rangelands, the moment-to-moment local-scale grazing behavior of an individual animal aggregates over an entire herd and integrates over time to emerge as the landscape-scale spatial distribution of grazing pressure [4,5,6]. Identifying and quantifying cause–effect and feedback relationships between these two scales is integral to our understanding of rangeland ecology and has the potential to underpin improvements in the management of rangeland production systems [7,8].
Reduced to its essentials, grazing behavior is about the placement and removal of bites, coupled in some way to locomotion. For the animal, what matters primarily is the cumulative quantity and quality of vegetation ingested by all bites removed (most commonly considered on a daily time scale); for the vegetation, what matters primarily is the 2D horizontal spatial density of the bites removed (most commonly considered on a seasonal time scale). So, at the local spatial scale, locomotion can be viewed, in a certain sense, as a primary regulator of bite placement density, while, at the landscape scale, it regulates the area over which all bites are spread, which is integral to the definition of grazing pressure [9,10]. Thus, a lot depends on how tightly or loosely these two facets of grazing behavior—locomotion and bite removal—are coupled. Given that locomotion ultimately serves bite removal, the causal chain is expected to operate from the vegetation to bite removal to locomotion. But what happens to that coupling when external factors exist that might be expected to “interfere” with locomotion? Studying grazing behavior on hilly landscapes presents an excellent opportunity to examine such an effect.
A typical small-ruminant herd on extensive hilly rangelands moves across the landscape under the guidance of a shepherd who maintains the herd as a fairly coherent spatial unit [11]. Locomotion of an individual animal within that spatial envelope is influenced, first and foremost, by the basic mechanics of the ingestive process and the availability of preferred bites in its immediate scan area [12]. But it is also influenced by the movement of surrounding conspecifics in its sensory field, the crawl pace of the herd as a whole, and interventions by the shepherd [13]. Those additional factors are random effects that introduce noise and will tend to average out with respect to any locality. However, as an exploratory hypothesis, a landscape feature that has a systematic effect on locomotion at the local scale might modulate the coupling between locomotion and the mechanics of the ingestive process. That is, in turn, expected to shape grazing pressure at the landscape scale, as reasoned above.
Studying the components of grazing behavior at this mechanistic resolution is methodologically challenging. The truism that not everything we wish to know is measurable, and not all measurables have the accuracy we wish, is particularly apt. The cardinal things we wish to know about grazing behavior are timelines that define where the animal is (both for locomotion and for the link to landscape features), what the animal is doing, and, when grazing, its rate of intake. But these differ in their measurability, as we consider in turn.
In principle, a global positioning system (GPS) solves the geolocation problem. It has been exploited in numerous animal-tracking studies (e.g., [4,14,15,16,17,18]) and, as noted by Wade et al. [19], is currently the best technology for tracking small ruminants over extensive rangelands. In practice, battery capacity and field logistics can force compromises in tracking mode and fix interval that degrade the quality of the data [20]. These constraints were absent in the present study, and it was possible to use the best operating settings, which yield a positional error of multiple meters [21]. That is certainly adequate for the purposes of tracking an animal at the landscape (km) scale. But, at the local scale involving relatively small displacements, which was the focus here, it was an open question as to whether the positional error would drown out the signal in statistical analysis.
The timeline of an animal’s activity on rangeland is far more challenging to determine than that of its location, and this remains an active area of research and development [22,23]. Activity is defined as a class or category that applies to a slice of time in the order of minutes. This requires the relevant classes of activity to be enumerated and defined, together with transition criteria that, for some classes, have an arbitrary element. Required also is a wearable sensor, subject to constraints of dimensions and weight, which enables activity to be inferred from the signal it provides. Activity classification can be binary–grazing versus not grazing [16], three-way: Graze, Rest, Travel [24], or four-way: as Graze, Stand, Lie, Travel [25] or as Grazing, Lying, Ruminating, Steady standing [26]. Approaches based on GPS have some resolving power in a 3-way Graze–Rest–Travel classification, although the separation between Graze and Rest can be poor because animals move quite slowly when they graze, they can move (loiter) when they rest standing, and there is GPS error [25,27]. But with respect to the fundamental binary distinction between grazing and not grazing—our focus here—the most direct and accurate approaches monitor jaw movements [28].
The individual jaw movement (JM)—the cycle of opening and closing of the jaws—is the most fundamental behavioral unit related to foraging. Herbivores perform JMs to gather and sever vegetation as bites and to chew during ingestion and rumination. The rhythmic activity of the jaws implies grazing or ruminating, while a dearth of JMs suggests traveling (i.e., walking without grazing) or resting without ruminating [29,30]. Furthermore, if the sequence of JMs during grazing can be classified accurately, it is possible to quantify the bite rate and ingestive chewing requirements. Aside from the total absence of bites, rumination bouts have a distinctive temporal jaw-movement pattern, which enables them to be identified and separated from ingestive jaw-movement bouts [31]. The timeline of chews performed over the course of a single rumination bout reveals a highly regular pattern of repeating runs of regularly-spaced chew events, separated by regularly-spaced breaks in jaw activity during which time the animal swallows the current bolus and regurgitates a new one (see Figures 1 and 3 in [32]).
A variety of methods have been devised to monitor jaw movements in grazing animals [33,34], of which perhaps the most promising to emerge over recent decades has been acoustic monitoring [35,36]. The acoustic signal is the least mediated and most reliable way for a human to detect the occurrence of jaw movements that generate bite or chew sounds (strictly speaking, and as reported in [37], under certain sward conditions, cattle can intersperse pure-manipulative jaw movements into the jaw-movement stream, which would not generate a characteristic sound). Under ideal conditions, false negative and false positive JM identifications are essentially zero, and classification of each sound burst as a pure bite, a pure chew or a chew-bite can be performed with low error rate, at least in cattle grazing abundant herbaceous vegetation [29,38]. But for both JM identification and classification, having to sequence recordings manually/aurally strongly limits the scope of any study. In order to generate the desired timeline of jaw activity in larger studies, it is essential to perform the signal processing automatically [39], as was done here (for identification only).
Regarding the third timeline—moment-to-moment intake rate during active grazing—this is not currently measurable on open rangeland, and, to our knowledge, there is no such technology on the horizon. While it is true that under highly controlled conditions the potential exists to predict intake from chewing sounds [40], or even chew counts [41], there is a large gulf to bridge before that can be applied to open rangeland. This presents a serious problem for the present study: knowing activity without knowing intake-when-grazing is of little value. That is because casual observation shows that animals constrained to four to six hours of foraging daily, as in the present study, essentially graze the whole time. However, precise observation that generates the timeline of jaw movement events (bite and chew actions) enables the key behavior that is mechanistically related to intake rate to be quantified. For that reason, acoustic monitoring goes much beyond simply recognizing whether the animal is grazing or not. As will be argued here, the timeline of jaw movement activity provided by acoustic monitoring brings us much closer to the as-yet-unattainable instantaneous intake rate than does a binary activity state.
To test our hypothesis that local-scale landscape features modulate the coupling between locomotion and the mechanics of the ingestive process, we integrated acoustic monitoring to provide jaw activity, with high-fix-frequency GPS tracking to characterize locomotion, and geographic information system (GIS) mapping to provide the local landscape features along the foraging route. Specifically, we sought (1) to describe animal behavior on rangeland in terms of the temporal pattern of jaw activity rather than in terms of discrete activity classes; (2) to examine the responses of the short-term rate of jaw movement and velocity of locomotion to various factors, including local topography; and (3) to explore the coupling between leg and jaw activity, and its implications for grazing impacts on hilly rangelands.
2. Materials and Methods
2.1. Study Site
The study was conducted on an 870 ha homestead in the northern Negev region of Israel (31°26′33′′ N, 34°53′50′′ E) comprising Mediterranean semiarid rangeland suitable for small-ruminant grazing. The long-term resident herd owner had sole grazing rights, and a perimeter fence deterred grazing incursions by herds from the surrounding areas (see Supplementary Figure S1 for an orthophoto of the study area). The terrain is hilly (slope 0–29°) and average elevation is 430 m a.s.l. The rock formation is primarily chalk from the Eocene period with scattered outcrops of Nari (calcrete) crust [42]. Predominant soil types are brown lithosol and dark brown grumusol [43]. In the wadis, there are loess soils of alluvial/colluvial origin. The mean annual rainfall is 304 mm, which falls during a mild winter period extending from November to April. The average daily temperature is 11 °C. The summer period (May to October) is hot and dry with an average daily temperature of 25 °C (Israel Meteorological Service). Total rainfall in the hydrological years (October basis) of the study was 2011/12: 351 mm and 2012/13: 227 mm. In terms of the rainfall pattern, the wet season (also termed the “green” or “growth” season) of hydrological year 2011/12 brought significant rains in each of the five months November to March, and the subsequent dry season lasted from May to October 2012. In hydrological year 2012/13, significant rainfall (>10 mm) occurred in each of the four months November to February, with only minor subsequent rainfall events.
The rangeland is characterized by a highly heterogeneous mosaic of shrub patches (mainly Sarcopoterium spinosum L. and Rhamnus lycioides L.), herbaceous vegetation (mainly annuals), a small proportion of bare soil, and rocky outcrops [44]. Typically, the annual component of the herbaceous vegetation appears shortly after the first rains, grows rapidly during the spring months of February and March, and sets seed and cures in the months of April and May (images of the landscape from contrasting seasons are shown in Supplementary Figure S2), depending on the amount and distribution of rainfall [45]. Based on the long-term monitoring of primary productivity conducted at the Lehavim LTER station approximately 10 km SW of the study site, the long-term average undisturbed peak standing herbaceous biomass is expected to be ≈100 g m−2 [46].
2.2. The Resident Herd and Its Management
The long-term resident animal herd of the homestead comprised dairy-breed goats and meat-breed sheep, totaling approximately 870 head. These were divided into a herd of approximately 320 lactating goats and a second herd of approximately 550 head, comprising the non-lactating section of the dairy goat herd, and the sheep. Hence, there were three combinations of animal species and herd. Goats were transferred between the herds on an ongoing basis according to their physiological status. After parturition, goats were moved to the lactating herd and milked daily. When the milk yield declined below a threshold, goats were moved to the herd containing the dry goats.
Animals were housed at night in the central compound of the farm (elevation 420 m a.s.l.) that contained the animal sheds, dairy building and outdoor animal holding yards. Animals were not free-ranging; every morning the two herds would depart the central compound, each accompanied by a shepherd, and trace meandering routes across the landscape for approximately five hours, which terminated back at the central compound. On any given day, the two herds mostly explored non-overlapping regions of the available area. There was no significant watering or resting break along the route during the study period. The lactating herd received a grain-based supplementary feed during milking (approximately 400 g head−1 day−1). The herd of non-lactating animals subsisted on the grazed vegetation, receiving no supplementary feed. This required the non-lactating herd to be led out for a secondary shorter foraging route in the late afternoon. These secondary routes were not monitored in this study.
2.3. Study Animals and Experimental Protocol
The movement and foraging behavior of the two herds were monitored approximately once weekly for an entire annual cycle. Monitoring commenced in March 2012, at the peak of one green season, and terminated in April 2013, at the tail end of the next green season. On the morning of each monitoring day, 30 min before the herds departed the central compound, the operator would enter the animal yard (of each herd separately) and select, with minimum disturbance to the group, one volunteer animal. The animals were overwhelmingly females, and only mature adult females were selected. The only other criteria for animal selection were that the animal needed to be of healthy appearance (which was true for almost all animals), have horns of suitable conformation for the acoustic sensor (which was true for a large proportion of mature adult animals), and not have been selected previously (based on records of ear-tag number). Selection was otherwise random from among the animals within easy reach of the operator. The monitoring equipment (described in detail below) was initialized and installed on the animal, after which the animal integrated back into its respective herd in every respect. After the herds returned from grazing, the equipment was removed from the volunteer animal of each herd, and the raw data files from both devices were retrieved for analysis.
2.4. Acoustic Monitoring
The acoustic signal was recorded using an MP3 device (Sansa Clip+, SanDisk, Milpitas, CA, USA) modified to connect externally to a piezoelectric microphone (Model WCP500, Cherub Technology Co., Nanshan, China) by a short cable. This recording device was selected because it was inexpensive, compact, and robust under field conditions. RockBox open-source software (version 3.10, released December 2011; https://www.rockbox.org/, accessed on 2 February 2026) was installed on the device to provide extended functionality. Recordings were written to the microSD, in WAV format, as a gapless series of files of 30 min duration and at a sampling frequency of 48 kHz (nominal). The internal battery of the device allowed approximately 10 h of continuous recording, which was more than sufficient to monitor an entire route. At deployment, acoustic recording was initiated, and the precise time was recorded. The recording device was placed inside a metal protective case with an aperture for the cable leading to the external microphone, and the equipment was taped to the inner face of one horn of the volunteer animal with the microphone facing inwards. The piezoelectric microphone only detects vibrations transmitted via the horns, to the exclusion of the vast majority of ambient environmental noises. Sounds and vibrations generated by jaw activity transmit well through the skull and to the horns to provide a clean high-quality signal (sample waveforms in Supplementary Figure S3). The equipment was lightweight (≈100 g) and had no detectable effect on animal behavior.
2.5. GPS Tracking
Each herd was tracked using a GT-600 i-gotU GPS logger (Mobile Action Technology Inc., New Taipei, Taiwan). The i-gotU uses an SiRF Star III Low Power chipset and built-in GPS patch antenna with WASS & EGNOS support. The internal memory enables storage of up to 262,000 waypoints including date–time. The internal battery allows approximately 30 h of operation in continuous-tracking mode, more than sufficient for our purposes, and the device was configured to record a position every second. Before deployment, the device was sealed in a plastic watertight case and taped to a small-ruminant plastic collar with the device oriented to face the sky.
2.6. Processing the Acoustic Signal
We used the algorithm developed in-house and described by Navon et al. [30] for the core task of JM identification (without classification). The algorithm was designed to be as general as possible in terms of animal species, foraging environment and recording equipment and to require no calibration. The algorithm identifies JMs according to key features in the time domain that are defined in relative terms and uses a machine-learning approach to separate true JM sounds from spurious noises. In a trial with goats grazing green herbage in a noisy environment, the algorithm achieved 96% correct identification and 4% false positives. Even better performance was expected here because of the vibration-type microphone selected.
In the present study, the algorithm was developed further to efficiently handle the large quantity of acoustic data gathered. This included a correction for the clock drift of the SanDisk recording device, which was found to reduce the sampling frequency from the nominal value of 48,000 Hz to a true value of 45,922 Hz. The correction enabled close-to-perfect synchronization with the accurate date–time of the GPS data. A high-pass filter of 60 Hz was applied to all the acoustic files to remove background hiss. The first and last files were trimmed to the exact start and finish times of the foraging route as determined from the GPS data (see below). To reduce the computational load and analysis time, the audio files were down-sampled to 8 kHz, and the signal was amplified according to a set of pre-prepared factors. The core algorithm of Navon et al. [30] then analyzed the sound signals to extract the timeline of JMs. The waveform of the sound signal was overlaid with the timeline of JM events identified by the algorithm to check the performance of the algorithm.
The output files of the signal processing algorithm were merged with metadata for each foraging route containing key variables for the analysis, including season, herd, animal species and date. Time was defined in absolute terms (date and time, to a fraction of a second) and also as time elapsed since the start of the foraging route. For each foraging route, the time interval between consecutive JMs (TI, defined as time since previous) was calculated for all but the first JM. Over the entire set of recordings, there were in mid-summer a few short rumination bouts, which have a distinctive pattern of JMs, and these recordings were removed.
2.7. Processing Geographic Information
Geographic information was processed using ArcMap 10.8.2 GIS software (Esri, Redlands, CA, USA). A digital elevation model (DEM) of the study area was obtained from the Survey of Israel, with a spatial resolution of 4 m (Supplementary Figure S4). Two additional raster layers were derived from it: topographic slope (°; Supplementary Figure S5) and aspect (°; Supplementary Figure S6).
Aerial photos of the study region were obtained for 2012 (Survey of Israel) and imported into GIS. A polygon was created representing the homestead perimeter. The 1 s GPS coordinates, organized by collar deployment, were imported as GIS layers and converted from the WGS84 to ITM (Israel Transverse Mercator) coordinate system. The locations of each deployment were trimmed at the start and end such that only points that fell outside the perimeter of the homestead buildings and yards defined a foraging route. The resulting locations were averaged over 1 min intervals. Each resulting average location inherited the attributes of its local terrain of elevation (m), topographic slope (°) and aspect (°). For elevation, the non-default option to bilinearly interpolate elevation at the point location was implemented. Aspect was converted to the sine of the radian-transformed value.
The path angle (°) between consecutive 1 min average locations was defined as in Equation (1).
where the elevation change is primarily DEM-based, and the 2D-projected distance is GPS-based. The path angle was negative for uphill movement and positive for downhill movement. As an alternative approach to defining sloped locomotion, the path angle was decomposed into steepness (absolute path angle) and the direction of travel (−1 for uphill, +1 for downhill). The animal movement velocity (m s−1) was computed between consecutive 1 min average locations using the 2D-projected distance, corrected for elevation change, as defined in Equation (2).
2.8. Integration of Acoustics, GPS and GIS
Analysis of grazing activity at the JM level was based on a dataset containing 889,813 records organized into 69 subsets, each representing a one-day foraging route of a sheep, lactating goat or dry goat. For each foraging route, the timeline of JMs was aggregated to yield the minute-by-minute rate of jaw movement (RJM, min−1). This was demarcated by the timing of the first and last GPS coordinates and zero-padded for “silent” minutes, which tended to occur near the beginning or towards the end of foraging routes, but not exclusively so. The 1 min-level rates were merged with the 1 min-level GPS/GIS data. The resulting file of 16,852 records, including 2689 with zero count, enabled the JM rates to be related to landscape attributes.
2.9. Statistical Analyses
Data handling, processing and analysis was conducted in JMP®, Version 16 (SAS Institute Inc., Cary, NC, USA). The 1 min-level RJMs showed higher minute-to-minute variability than did the landscape attributes, which changed more gradually and may have contributed to serial autocorrelation. The average distance between any pair of points beyond which their cell attributes are independent was estimated for a similar landscape in the region by Livne and Svoray [47] and was found to be 150 m. Based on the global median movement velocity of ≈0.25 m s−1, the time needed to traverse 150 m would be ≈10 min. Hence a 10 min averaging window was applied to the topographic slope, aspect, elevation, path angle, steepness, direction (−1: uphill, 0: level, 1: downhill), velocity and RJM. Direction at the 10 min level was based on the sign of mean 1 min-level direction. Means equal to zero were assigned a direction at random. The resulting file of means for analysis contained 1577 records.
The frequency distribution of TI was examined for the pooled global dataset, and, in addition, the median was computed for each foraging route. When analyzing the effects of season and species–herd combination on median TI, residuals from ANOVA were tested for normality, and the homogeneity of variances was tested.
The intensity of the grazing activity over the duration of an entire daily foraging route was defined as the dimensionless ratio of the total number of JMs detected along a route multiplied by its median TI and the total elapsed time between first and last JM. The effects of season and species–herd combination on grazing intensity were similarly tested.
We conducted ANOVA on the route-level mean RJM and mean velocity (n = 69 foraging routes), with season and species–herd combination as terms in the model. At the 10 min level, the ANOVA of RJM and velocity (n = 1577) was conducted in two phases, the first of which screened alternative models. All models contained a core set of terms, to which were added landscape-related terms in a constrained combinatorial fashion. The core terms were season, species–herd combination, their interaction, foraging route within season × species-herd combination (random), the linear and quadratic terms for 10 min segment, and a lag term for the dependent variable (previous 10 min-level value). In the model for velocity, RJM was included as a core term because the arrow of causation is assumed to point, primarily, in that direction. Accordingly, velocity was not included in the model for RJM. To this core we added, in combinatorial fashion, the terms: aspect (sine of radian-transformed), topographic slope, elevation and path angle, with the latter three as linear term only or as both linear and quadratic terms. As an alternative to the path angle, combinations containing steepness only, binary direction only, both, and both plus their interaction, were added to the core model. At the whole model level, we examined the adjusted R-square and AICc (Akaike’s information criterion with correction for small sample size) and how they respond to the presence/absence of non-core variables. Likewise, we mapped out the stability of the model coefficient and probability level of all terms in the models and evaluated how dependent these values are on the presence/absence of non-core variables. In the second phase of the analysis, and based on the above information, a “representative” model was selected based on the retention of all significant non-core (landscape-related) variables, separately for models using path angle versus steepness/direction. The response of the predicted RJM and velocity values was examined (separately for each approach) in relation to key factors. Additionally, models that occupied the lowest end of the distribution of AICc values were profiled in terms of which non-core variables they retained.
3. Results
3.1. The Foraging Routes in Spatial Context
There were 69 daily foraging routes for which both GPS tracking and acoustic monitoring yielded complete usable data for analysis, covering the green (n = 23) and dry (n = 46) seasons. All three species–herd combinations were sampled multiple times in both seasons. The foraging routes traced out on these 69 days (Figure 1) reached into different regions of the hilly landscape within a total area of approximately 10 km2 and similarly for the three species–herd combinations.
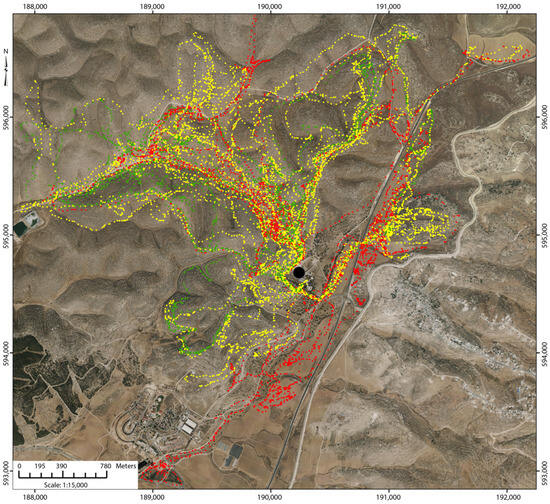
Figure 1.
Aerial orthophoto of the study site showing the natural topography (Survey of Israel, 2008, Israel TM coordinate system in meters) and the 69 foraging routes of the study as determined by the GPS collar operating at a 1 s fixed interval. Points are 1 min average locations and colored according to species–herd combination:  = lactating goats,
  = dry goats,
  = sheep. The black dot indicates the area of the animal night shed and yard. Distance between tick marks is 1 km. The aerial orthophoto was obtained from the Survey of Israel and is publicly accessible at https://www.govmap.gov.il/?c=191150.36,595176.88&b=1&sb=7&z=7 (accessed on 2 February 2026). The figure was generated using ArcMap version 10.8.2 (Esri, Redlands, CA, USA; https://desktop.arcgis.com/en/arcmap/latest/get-started/main/get-started-with-arcmap.htm, accessed on 2 February 2026).
= lactating goats, = dry goats, = sheep. The black dot indicates the area of the animal night shed and yard. Distance between tick marks is 1 km. The aerial orthophoto was obtained from the Survey of Israel and is publicly accessible at https://www.govmap.gov.il/?c=191150.36,595176.88&b=1&sb=7&z=7 (accessed on 2 February 2026). The figure was generated using ArcMap version 10.8.2 (Esri, Redlands, CA, USA; https://desktop.arcgis.com/en/arcmap/latest/get-started/main/get-started-with-arcmap.htm, accessed on 2 February 2026).
3.2. The Jaw-Movement Level
The frequency distribution of TI for the pooled global dataset scaled logarithmically and was highly concentrated around the peak (Figure 2). The global median TI was 0.49 s, which implies an instantaneous RJM of 122 cycles min−1, what might be considered the epitome of active grazing. The interquartile range of TI was only 0.33 s despite the overall range in TI spanning orders of magnitude. After log transformation of the median TI for each foraging route, the residuals from a two-factor analysis (season, species–herd combination, interaction term) showed a normal distribution (Shapiro Wilk W = 0.98, p = 0.22). Homogeneity of variances was established by the Levene test (F5,63 = 0.96, p = 0.45). The median TI was significantly shorter in the green than in the dry season (0.45 vs. 0.57 s, respectively; p < 0.0001), equivalent to instantaneous rates of 133 and 105 JMs min−1, respectively. The interaction term was significant (p = 0.0497), expressing a higher difference between seasons for dry goats than for the other two groups. There was a small increase in the median TI per hour into the foraging route.
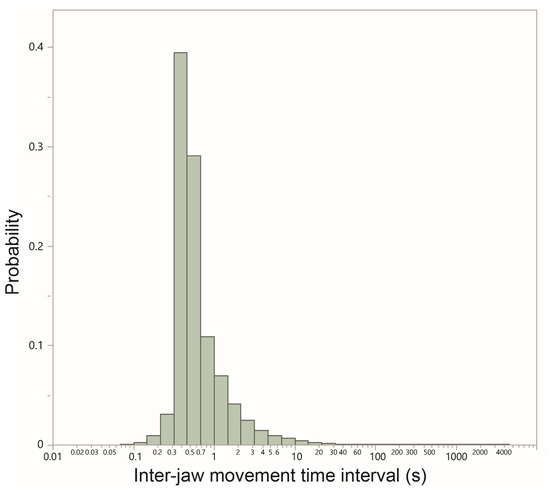
Figure 2.
The frequency distribution of the time interval (seconds; logarithmic scale) between successive jaw movements performed along 69 daily foraging routes traversed over the course of an annual cycle, spanning a green season (23 routes) and a dry season (46 routes). The distribution is based on a total of 877,349 intervals.
3.3. Grazing Intensity
The dimensionless intensity of grazing activity over the duration of an entire daily foraging route (JMs × median TI ÷ duration) ranged from 0.09 to 0.71, and the mean was 0.44. The effects of season and species–herd combination were tested by ANOVA. The residuals from a two-factor analysis (with interaction term) did not differ significantly from normality (W = 0.987, p = 0.6966). Homoscedasticity was established by non-significance of the Levene test (F5,63 = 1.86, p = 0.11). The grazing intensity differed between seasons (p = 0.002), being higher in the green than in the dry season (0.51 vs. 0.38) and differed among species–herd combinations (p = 0.0145), being higher in sheep (0.51) than in lactating goats (0.46) or dry goats (0.37). The interaction term was not significant (p = 0.2773). No relationship was evident between the grazing intensity and total elapsed time.
3.4. Trends in Rate of Jaw Movement
Based on the 10 min-level dataset, the global mean RJM was 49.8 min−1 (±SE = 0.76). At the seasonal scale, an approximately convex quadratic response was obtained between the daily mean RJM (over an entire foraging route) and date along the March 2012 to March 2013 annual cycle of monitoring (Figure 3a). The values were highest in February to April, the height of the green season, and lowest in September, in the depths of the dry season.
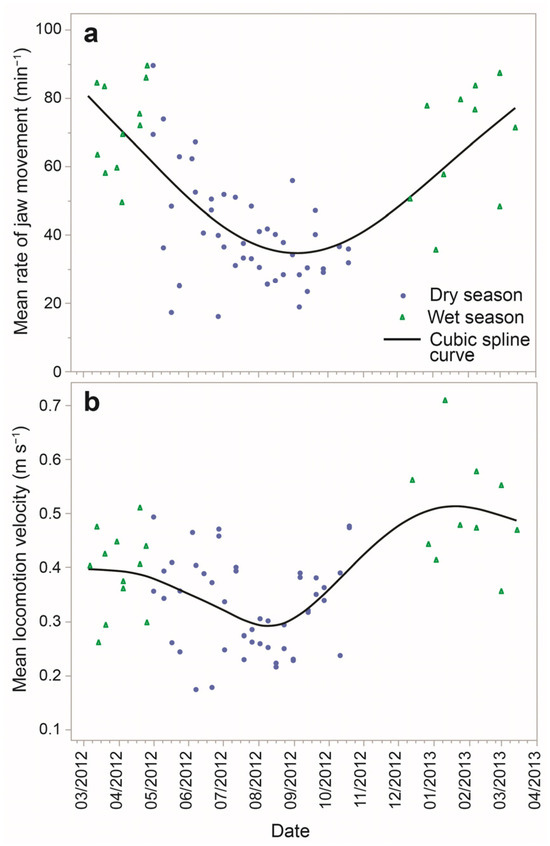
Figure 3.
Daily mean rates of jaw movement (a) and locomotion velocity (b) for 69 foraging routes sampled over the course of one year, spanning wet and dry seasons.
In the two-factor ANOVA of mean RJM for each foraging route, the season had a large effect on the mean, which was 67.7 min−1 and 37.6 min−1 in the green and dry seasons, respectively (p < 0.0001). The species–herd combination was also significant in this analysis (p = 0.0026), being 40.5 versus 57.6 in non-lactating versus lactating goats, presumably related to differential physiological requirements, and 59.8 min−1 in sheep. These rates are approximately half the estimates derived in Section 3.2 from the median TI and are consistent with the low grazing intensities obtained in Section 3.3.
The mean RJM as a function of time into a foraging route showed a unimodal concave pattern, which differed between seasons (Figure 4a). In both seasons, RJM is low at the start of the foraging route and builds up to a maximum approximately one hour into the route. That level is sustained for approximately another hour, and thereafter, there is a gradual decline in RJM until the termination of foraging. Interestingly, this average pattern of evolution of RJM over the course of a foraging route was rarely displayed at the individual-route level, for which patterns were highly diverse (Supplementary Figure S7).
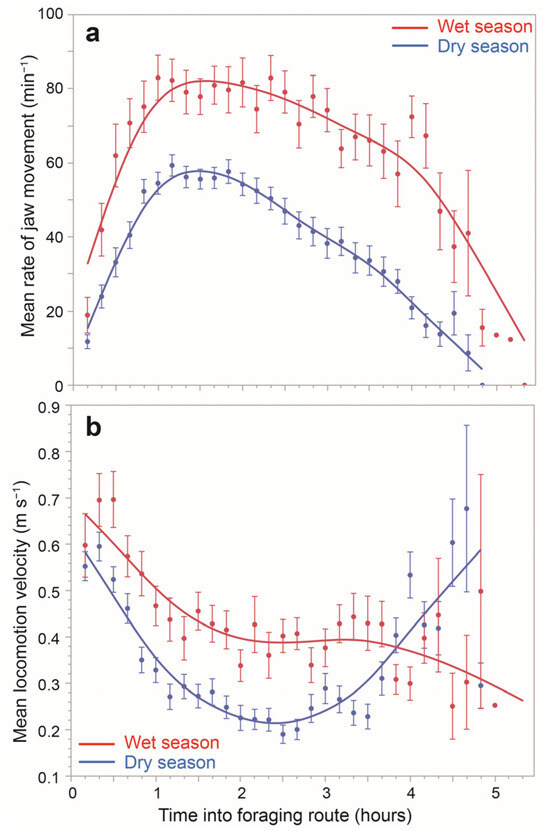
Figure 4.
The average daily time course, by ten-minute segment into a foraging route, of (a) the rate of jaw movements (min−1; mean ± 1SE) and (b) the locomotion velocity (m s−1; mean ± 1SE), both according to season, based on 69 foraging routes.
In the ANOVA of the 10 min-level RJM, the constrained combinatorial screening generated 126 models, which we summarize briefly (see Appendix A for detailed results). For the core variables, consistent results were obtained across all models; the significant factors, mostly highly so, were season, species–herd, the linear and quadratic terms for 10 min-segment, and lagged RJM. Among the non-core (landscape-related) variables, the results were weaker. There was, nevertheless, a consistent convex quadratic response of RJM to elevation, and the RJM tended to increase with the steepness and topographic slope. The latter two variables substituted for each other to some extent, as might be expected.
Using the path-angle approach, the representative model, containing all core variables and all significant (p < 0.05) non-core variables, explained 70% of the variance (adjusted R-square). Non-core terms retained in the model were elevation (linear and quadratic), topographic slope (linear) and aspect. Based on this model, the responses of predicted RJM to time-into-route and landscape-related variables are shown in Figure 5. The response for the 10 min-segment (Figure 5a) is consistent with the empirical relationship shown above (Figure 4a). More moderate responses were obtained for topographic slope (Figure 5b), aspect (Figure 5c) and elevation (Figure 5d). The path angle yielded a flat response (Figure 5e), as would be expected for a non-significant term. Using steepness/direction instead of path angle, the representative model retained the non-core terms of elevation (linear and quadratic), steepness and aspect. The responses of the predicted RJM to the variables common to the path-angle-based model did not noticeably change (Figure 5f–i). Steepness yielded a moderate positive response (Figure 5j) equivalent to approximately 1 jaw movement min−1 per degree increase in steepness.
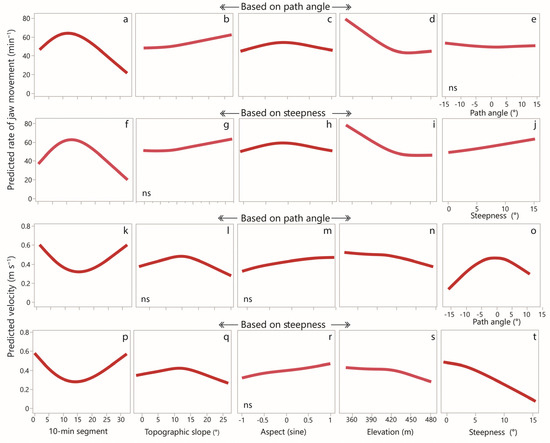
Figure 5.
Cubic spline curves of predicted values for rate of jaw movement (upper 2 rows) and velocity (lower 2 rows) versus selected continuous covariates in the selected models, based on 10 min-level data. For each panel, the lambda coefficient of the spline function was set to 50, which had the minimal inflections that fit the broad trend in the data. (a) the predicted rate of jaw movement according to 10-min segment (based on path angle); (b) the predicted rate of jaw movement according to topographic slope (based on path angle); (c) the predicted rate of jaw movement according to aspect (based on path angle); (d) the predicted rate of jaw movement according to elevation (based on path angle); (e) the predicted rate of jaw movement according to path angle; (f) the predicted rate of jaw movement according to 10-min segment (based on steepness); (g) the predicted rate of jaw movement according to topographic slope (based on steepness); (h) the predicted rate of jaw movement according to aspect (based on steepness); (i) the predicted rate of jaw movement according to elevation (based on steepness); (j) the predicted rate of jaw movement according to steepness; (k) the predicted velocity according to 10-min segment (based on path angle); (l) the predicted velocity according to topographic slope (based on path angle); (m) the predicted velocity according to aspect (based on path angle); (n) the predicted velocity according to elevation (based on path angle); (o) the predicted velocity according to path angle; (p) the predicted velocity according to 10-min segment (based on steepness); (q) the predicted velocity according to topographic slope (based on steepness); (r) the predicted velocity according to aspect (based on steepness); (s) the predicted velocity according to elevation (based on steepness); (t) the predicted velocity according to steepness. Non-significant relationships are indicated by “ns”.
The group of models with the lowest AICc values contained a varied mix of non-core variables, with one notable exception: steepness was present in all of them and, importantly, was the sole non-core variable in one of the models. Models containing path angle did not have especially low AICc values, even though steepness is a function of path angle.
3.5. Trends in Locomotion Velocity
Based on the 10 min-level dataset, the global mean velocity was 0.37 m s−1 (±SE = 0.0058). At the seasonal scale, a similarly-shaped response was obtained for the daily mean velocity (Figure 3b) as was shown for the daily mean RJM. In the two-factor ANOVA of mean velocity for each foraging route, season had a large effect on the mean, which was 0.45 m s−1 and 0.34 m s−1 in the green and dry seasons, respectively (p < 0.0001). Species–herd combination was not significant in this analysis (p = 0.3804). The mean velocity as a function of time into a foraging route showed a unimodal convex pattern, which differed between seasons (Figure 4b). In both seasons, velocity commenced high and descended to a plateau; it then increased towards the end of the foraging route, at least in the dry season.
In the ANOVA of the 10 min-level velocity, the combinatorial screening was again based on 126 models (see Appendix A for detailed results). In terms of the core variables, the results were consistent across all models. Season, the linear and quadratic terms for the 10 min-segment, lagged velocity and RJM were highly significant. Velocity and RJM were inversely related. In terms of the non-core variables, steepness and the quadratic term for path angle were the only variables to display the same consistent high significance across all models containing them as was obtained for some of the core variables. For models using path angle, the coefficients yielded a concave response centered near zero and symmetrical for uphill and downhill values. For models using steepness, the coefficients were negative, implying a decrease in velocity with increasing steepness. The topographic slope was inversely related to velocity in the models in which it was significant.
The representative model for velocity in the approach based on path angle explained 47% of the variance (adjusted R-square). Only the quadratic term for elevation was removed. The response of velocity to the 10 min-segment based on the predicted values is shown (Figure 5k). This is consistent with the empirical relationship shown above (Figure 4b). The rate of jaw movement was highly significant, and, as might be expected, higher RJMs were associated with lower velocities. This assumes the predominant direction of causation to be from RJM to velocity, since locomotion “serves” ingestion (that is not to deny that, in moments when an elevated velocity is being driven by social factors and shepherd interventions, the direction of causation can point from velocity to RJM). There was a decrease in velocity with increasing elevation (Figure 5n). The response of the velocity to the path angle showed a strongly concave response centered near zero that was approximately symmetrical for negative (uphill) and positive (downhill) values (Figure 5o).
Using steepness/direction instead of path angle, the representative model retained all terms except the quadratic term for elevation. The responses of the predicted velocity to the variables common to the path-angled-based model barely changed (Figure 5p–s). The predicted velocity responded strongly to the steepness (Figure 5t). Although significant, the impact of direction on velocity was small, with downhill exceeding uphill velocity by 0.022 m s−1.
The group of models with the lowest AICc values contained a wide variety of combinations of non-core variables, but steepness and topographic slope were present in all of them. There was no overlap in AICc values between models with or without steepness: all models containing steepness had a lower AICc than those that did not. In contrast, topographic slope could appear in models in the mid or upper ranges of AICc values. Models containing path angle were not in the low range of AICc values.
4. Discussion
4.1. Data Quality and Uncertainty
This study integrated three different technologies, each with its own measurement limits. The geographic data were sourced from a DEM, which is subject to inherent errors [48] and a degree of pixelation that is determined by its spatial resolution. For the GPS location data, the challenge was to measure the displacement of a slow-moving object with a tool that, prima facie, does not have that spatial resolution. Acoustic monitoring differs from GPS and GIS technologies in that the potential exists for sound-generating JMs to be identified almost flawlessly by the signal processing algorithm. But not all our recordings were of the quality (strength and cleanness of signal) to achieve such performance, and that could be a further source of error. Classification of sound-producing JMs into pure bite, pure chew and chew–bite actions is more error prone and was not performed by our algorithm. Once that technical hurdle is overcome, it becomes possible to test rigorously whether the bite rate and RJM indeed behave similarly, as argued here.
While the ingestive aspect of grazing behavior was monitored via its fundamental behavioral unit, the JM, the locomotion aspect, whose fundamental behavioral unit would be the step, was not. An accurate timeline of step actions, synchronized and integrated with the timeline of jaw activity, would further deepen our understanding of grazing behavior and enhance our ability to scrutinize the coupling between jaw and leg activity. We are not aware of any commercial pedometers suited for small ruminants that log individual step actions.
4.2. The Rhythm of Jaw Activity
The dominant JM frequency of active grazing can be inferred from the sharply peaked frequency distribution of TI (Figure 1), with a global median in the region of 0.5 s implying an instantaneous RJM of 120 min−1. As corroboration, this rate aligns well with the relationship between the body mass and masticatory cycle period in mammals collated by Druzinsky [49] and corresponds to a body mass of 50 kg, which is representative for the herds in the northern Negev. Yet, when defined at the 1 min level, only 3% of RJMs exceeded 120 min−1. This suggests a single, relatively-high, natural frequency for the rhythm of active jaw activity (comparable to the “chewing frequency” of Virot et al. [50]) that is fractured and fragmented with interruptions of variable length, as opposed to a sustained rhythmic pattern of jaw activity at a lower frequency. This is visualized (Figure 6) by comparing the timeline of JM events for contrasting 10 min segments of a single foraging route.
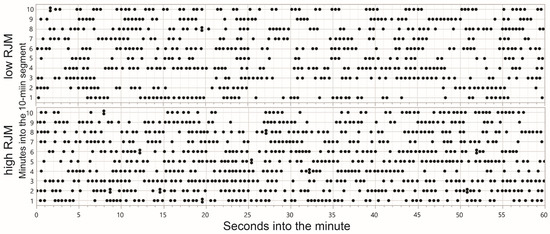
Figure 6.
Comparison of the chronological timeline of jaw movements corresponding to two contrasting rates of jaw movement (RJM) at the 10 min scale along a single foraging route.
However, the median TI value did differ by season, being 0.46 s and 0.55 s in the green and dry seasons, respectively. This could be interpreted in two ways, although testing these alternative hypotheses is beyond our current scope. One possibility is that seasonal changes in the vegetation induce changes in the allocation of bites between shrub and herbaceous vegetation, which in turn changes the time budget of the grazing process and hence the natural JM frequency. It is plausible, for example, that bite formation takes slightly more time on shrub vegetation, which constitutes a higher proportion of the diet in the summer, than on herbaceous vegetation [51]. Alternatively, it could be argued that the natural JM frequency is the same in the dry as in the green season (based on anatomical biomechanics), but there are proportionately more interruptions in that rhythm, because the vegetation is sparser, and the search component of the time budget is more dominant. That would shift the median TI further away from the peak of the distribution.
4.3. RJM and Velocity
The inverse relationship between RJM and velocity reported in Section 3.5 was expected. First, during intense jaw activity (high RJM), the legs of a grazing animal are mostly still (as multiple bites are removed from a single feeding station), and the velocity must be low. Similarly, an animal cannot combine high velocity with high RJM, and the RJM must be low. But a low RJM does not mechanistically constrain velocity to the low or high quadrant. Nevertheless, overall, higher RJMs are associated with lower velocities, and vice versa.
Consistent with this, the RJM and velocity moved in broadly opposite directions within a day, at the 10 min scale (Figure 4). When the relationship between RJM and velocity was examined separately for each foraging route, there was either no significant relationship or a significant negative one. Note, however, that if the inverse relationship between velocity and RJM was mechanistic, we would expect the reduced velocity caused by the increased path angle (itself caused by increased topographic slope) to result in an increase in RJM. This was not observed, as the RJM appeared invariant to the path angle. In contrast, at the level of an entire foraging route, the 69 combinations of mean velocity and mean RJM showed a significant positive relationship between them, consistent with the similar shape of response of the daily mean velocity and daily mean RJM over the annual cycle (Figure 3). But once season was accounted for, the RJM was no longer significant. The dry season, which had the relatively low mean RJM of 41 min−1, also had the lower of the mean velocities of 0.33 m s−1. The values for the green season were 68 min−1 and 0.45 m s−1, respectively. Our interpretation is that this is a reflection of contrasting foraging environments and not of how RJM and velocity co-vary when all other things are equal.
4.4. Robustness of the Key Responses
We examined two approaches to defining sloped locomotion, one based on path angle and the other based on steepness/direction, each with its pros and cons. Using path angle, the effect is tested via the quadratic term, which imposes a functional shape with specific features, such as being less steep nearer the center, which would seem realistic, and being symmetrical between uphill and downhill locomotion, which is not necessarily so. The greater density of values near the center (zero path angle) makes detection of a downward trend on both sides of the central peak area more difficult. Using steepness instead, the less dense points at both ends of the path angle spectrum are “folded over” and merged to better detect an effect, while enabling a differential uphill and downhill response via the steepness × direction interaction term. But being linear, the steepness approach implies an angled peak between uphill and downhill movement, which is less realistic. It was a positive indication that the two approaches yielded mutually compatible results. On the basis of AICc, steepness was the primary non-core variable of importance for both RJM and velocity.
A somewhat similar herd-tracking study on hilly rangeland was conducted in 2008/9 at the Lehavim LTER station, differing from the present study in animal breed, shepherding style and GPS rover technology. Nevertheless, a similar, steep, concave response of locomotion velocity was obtained, peaking at approximately 0° path angle [52]. That is, at least, corroborative evidence. In a separate herd-tracking study conducted in 2002/3 at the same research station, using different GPS rover devices and different GIS data-processing methods, topographic slope was found to be negatively correlated to velocity, although the path angle was not examined [53]. The mean locomotion velocity of 0.3 m s−1 was comparable to that obtained here.
Qualitatively similar results based on human walking on sloping surfaces have been reported by Sun et al. [54] and, at least for uphill travel, by Xie et al. [55]. Using a large database from a fitness-tracking smartphone application, Campbell et al. [56] combined GPS tracks, GIS and lidar data to model travel rates of hikers as a function of terrain slope. Here too, a concave response of travel rate to terrain slope, centered near zero, was obtained. What remains unclear is the role of the shepherd in the velocity response and whether these results extend to free-ranging small ruminants.
Regarding the mild RJM response to path angle (or steepness), we are not aware of any other study of ungulate jaw activity in relation to local topography to be able to corroborate our findings. It is noteworthy that the concave velocity response to path angle was obtained despite being based on an inherently inaccurate tool for measuring small displacements (GPS). Yet the inherently more accurate tool for detecting JMs (acoustic monitoring) failed to reveal a strong response to path angle.
The landscape-level pattern of GPS locations shows a high concentration of points along narrow trunk routes frequented by the herds on exiting and returning to the central compound (Figure 1). This might unduly influence the velocity and RJM responses, which are intended to represent normative foraging behavior on the open landscape. Furthermore, local landscape features near the corral may be confounded with behavior associated with the start and end of foraging routes, making it difficult to interpret their statistical significance. To test this, we removed the 1 min-level GPS points along those trunk routes near the central compound and repeated the statistical analysis of velocity and RJM (n = 1340). We found no substantive change in the core results; RJM was invariant with the path angle, and the velocity responded concavely to the path angle. In the analysis of velocity, the quadratic term for path angle remained highly significant, as did steepness in the other approach.
4.5. The Implications of No Jaw–Leg Coupling
Given the empirical evidence presented regarding jaw activity and animal movement, plus a number of assumptions we regard as eminently reasonable, certain abductive inferences follow. We suggest that (i) velocity is related to path angle (or steepness), and (ii) RJM is effectively invariant to path angle, both as suggested by the empirical evidence. That implies an apparent absence of coupling between locomotion and jaw activity. If so, as path angle increases, velocity declines while RJM remains unchanged, and therefore, more JMs (bite and chew actions) are performed per unit area scanned by the animal. Note, this effect would be only amplified if we adopted increasing RJM with steepness, for which a case could be made.
As the next step in the reasoning, the assumption is made that if more JMs are performed per unit area, then more bites are removed per unit area. For that not to happen, the animal would have to titrate its allocation of JMs between bite and chew actions in exact response to the path angle so as to maintain a constant density of bite placement. That seems implausible, especially in light of the binary on/off nature of jaw activity and the numerous short interruptions at the time scale of a few seconds (Figure 6). Evidently, animals do not take advantage of the “idle” time by performing extra chews, which might be expected to benefit the animal. In fact, there is strong empirical evidence that the chewing coefficient, i.e., the number of chew actions performed per unit herbage mass consumed, is a quite conservative ratio [41]. This conservatism in chew–bite ratio, demonstrated in cattle under controlled grazing conditions and constant bite mass [57], strengthens the argument that animals facing declining locomotion velocity on sloping terrain are unlikely to be increasing chew–bite ratios to maintain constant bite placement density.
In the next step of the reasoning, we argue that more bites per unit area necessarily means more offtake per unit area. That is not self-evident: it might be contended that the bite weight is being regulated to maintain constant herbage offtake per unit area or to even reduce it by more than compensating the increase in bite number. But that would not accord with the current understanding of ingestive behavior. The process of depleting an herbage patch is expected to follow a predictable sequence of bites and associated weights, that gives rise to the “depletion curve” [58,59,60,61]. Therefore, more bites always entail more offtake. That is the case even though, sooner or later along the depletion curve, the marginal bite weight will decline. That is also the case irrespective of how steeply the bite weight declines.
It should be noted, however, that if the marginal bite weight declines as patch depletion proceeds, offtake per unit area will increase monotonically but not linearly. In a simple conceptual model of intake (when search time is not limiting) the intake process is governed by (i) the natural jaw movement rate under non-limiting conditions; (ii) the bite weight; and (iii) the number of chews required per unit intake (the “chewing coefficient”). The animal’s bite rate derives from those parameters: ignoring chew–bites for simplicity, each bite action requires a number of chew actions equal to the product of bite weight and the chewing coefficient. The bite rate is then given by the simple expression: natural jaw movement rate ÷ [1 + (bite weight × chewing coefficient)]. The bite rate would therefore be expected to increase as patch depletion proceeds, because lighter bites require fewer chews [62].
An assumption is being made regarding the scan width of the animal, which is one dimension of the density of bite placement. In theory, the scan width could be regulated to maintain a constant bite density, but that seems highly implausible and is currently impossible to test. The scan width is assumed to be invariant to the path angle (or steepness).
Regarding the vegetation, there is an assumption of no systematic change with topographic slope (or path angle). But could a topographic gradient make the vegetation on steeper terrain more attractive to the animal resulting in higher apparent grazing pressure? We are not aware of any evidence for that, and, if anything, it seems unlikely given the association between slope angle, water-driven erosion and local productivity [63]. Furthermore, if such a gradient existed, the effect of the animal’s path angle (or steepness) on velocity would not be expected to be much stronger than that of the intrinsic local topographic slope, as shown to be the case in Figure 5.
Based on the above reasoning, an implication of the apparent absence of jaw–leg coupling is that, all other things equal, the grazing pressure is more intense on sloping terrain than on level areas. This would be a previously unreported pathway by which herbivory can have a negative impact on rangelands as a result of a direct cause–effect relationship between the abiotic environment (sloping topography) and a core component of grazing behavior (locomotion). Based on the 10 min-level data, the relationship between the absolute path angle and the topographic slope showed an increase in the path angle of approximately 0.6° for every 1° increase in slope angle up to 8° and a less steep increase at higher (and less common) slopes (Supplementary Figure S8). A factor shaping this relationship may be the fine-scale network of trampling routes that often crisscrosses the slopes and becomes most apparent in the latter part of the dry summer season [64]. A change in path angle of 2° would be expected to increase bite placement density by approximately 5%, via its effect on locomotion velocity (Figure 5o). Based on the population of slope values encountered along the foraging routes, 50% were higher than 7°; so, the effect on bite placement density becomes substantial. It appears that the abiotic processes that disadvantage slopes in semiarid areas [65] are compounded by an additional stress via the modification of grazing behavior.
4.6. Optimality Considerations
In the species-rich, highly heterogeneous natural vegetation of the study area, the spatially intermixed population of potential bites on offer presents a range of nutritional value (combining mass and quality). Under such circumstances, theoretical analysis shows that the optimally behaving herbivore selects bites that exceed a certain value threshold [66]. Thus, the assertion that bite placement density is increased by sloping terrain seems to imply a deviation from optimal foraging: if the vegetation did not change, why should the selectivity threshold change? The answer is that the sloping terrain has modulated a behavioral parameter of the model, namely, the search-phase locomotion velocity of the animal. The resulting increase in the searching component of the time budget of instantaneous intake rate shifts the optimum selectivity threshold to include a higher proportion of bites on offer. This makes intuitive sense, and the true absence of jaw–leg coupling, however indirect, is not being purported. But from the point of view of optimality, our assertion is, at least qualitatively, compatible with the predictions of that conceptual model. In fact, there was some indication of an increase in RJM with increasing topographic slope and increasing steepness (Figure 5b,g,j). That would only augment the effect on bite placement density. The impact on intake rate and diet quality would then depend on the flatness of the frequency distribution of bite value in the local landscape.
4.7. Management Implications
The stability analysis of Noy-Meir [67], based on a simple two-function graphical model, can help explain the broader implications of a change in bite placement density, especially in the early phases of the growth season. In Noy-Meir’s graphical model, the direction of change in biomass per unit area at any given biomass level is determined by the balance between the growth and consumption rates on a per-unit-area basis. In the model, these rates are themselves functionally determined by biomass. If we apply the same approach locally to sloping terrain, an increase in bite placement density does not necessarily mean an increase in instantaneous intake rate of the animal and may even reduce it, but it must mean an increase in local offtake per unit area and increased pressure on the vegetation. That could narrow the positive balance between growth and consumption, which would slow subsequent accumulation of biomass towards a high-biomass stable equilibrium, or even switch the balance to negative, which could initiate a decline towards a low-biomass stable equilibrium [67] and predispose wider negative consequences mediated by the soil [68]. This could have implications for how carrying capacity of such areas should be defined [69,70]. Such impacts would need to be ameliorated by introducing or extending deferment at the start of the green season and/or reducing the animal density.
We reason that slower locomotion on sloping terrain, when aggregated over animals and time, modifies the landscape-level spatial distribution of the herd. For a given duration of foraging route, an increase in the density of bite placement at the local behavioral scale implies a contraction in the surface area of the daily herd footprint at the landscape scale. The same herd on level terrain would spread its bites over a larger area.
5. Conclusions
Acoustic monitoring demonstrated that jaw activity associated with small-ruminant grazing on semiarid rangeland operates in bursts of varying duration of evenly spaced jaw movements that occur at a characteristic instantaneous rate of approximately 120 min−1. The bursts are interrupted by breaks of varying lengths, which scale logarithmically and which reduce the mean minute-level rate of jaw movements to approximately 50 min−1. The rate of jaw movement was invariant to the path angle, but the velocity responded concavely to the path angle, with a maximum at zero angle. It was reasoned that this apparent absence of coupling between jaw activity and locomotion increases grazing pressure on the sloped terrain of hilly rangelands. This can have implications for the local stability properties of the system and can modify the landscape-level spatial distribution of the herd. For a given duration of foraging route, an increase in the density of bite placement at the local behavioral scale implies a contraction in the surface area of the daily herd footprint at the landscape scale. These findings from behavioral ecology link directly to applied rangeland management via the effect of terrain-driven bite density on sustainable stocking rates. There is cause to reevaluate how the carrying capacity of hilly rangelands should be defined for the better management of these production systems.
Supplementary Materials
The following supporting information can be downloaded at https://www.mdpi.com/article/10.3390/environments13030177/s1, Figure S1: Aerial orthophoto of the study site showing the natural topography; Figure S2: Typical landscapes of the study region in the green (growth, wet) season and in the dry (senescent) season; Figure S3: Sample waveforms obtained by acoustic monitoring, each of 38 s duration, for uninterrupted rhythmic jaw activity (top) and for a period with significant interruptions in jaw activity (bottom); Figure S4: Digital elevation map of the study site; Figure S5: Topographic slope across the study site; Figure S6: Aspect map of the study site following categorization of the continuous-variable aspect used in the analysis; Figure S7: Contrasting patterns of jaw movement activity along different foraging routes; Figure S8: Cubic spline curve of the relationship between absolute path angle and topographic slope, based on one-minute-level means, truncated at a slope of 18° due to the low density of values.
Author Contributions
Conceptualization, E.D.U., M.Z. and T.S.; Methodology, E.D.U., M.Z. and A.B.; Software, M.Z. and S.N.; Validation, H.V., T.S. and S.N.; Formal Analysis, M.Z. and H.V.; Investigation, T.S. and A.B.; Resources, E.D.U. and T.S.; Data Curation, M.Z., H.V. and S.N.; Writing—Original Draft Preparation, E.D.U.; Writing—Review and Editing, E.D.U., M.Z., H.V., T.S., S.N. and A.B.; Visualization, M.Z.; Supervision, T.S.; Project Administration, Project administration; Funding Acquisition, E.D.U. All authors have read and agreed to the published version of the manuscript.
Funding
This work was supported by the Rangelands Advisory Board (Grant #277-0267), the Jewish National Fund (KKL-JNF; Grant #277-0409), and the Office of the Chief Scientist of the Ministry of Agriculture and Rural Development (Grant #458-0574).
Institutional Review Board Statement
The animal study protocol was approved by the Ethics Committee of the Agricultural Research Organization; approval #381-2012 of 28 March 2012. All experiments were performed in accordance with relevant guidelines and regulations.
Data Availability Statement
The raw data supporting the conclusions of this article will be made available by the authors on request.
Acknowledgments
The authors thank the Zedek family, the herd owners, for their cooperation. The authors are grateful to Avi Perevolotsky and Carly Golodets for comments on the manuscript, and to anonymous reviewers for their constructive critique. The authors thank Hannah Jakob for the artwork in the Graphical Abstract.
Conflicts of Interest
The authors declare no conflicts of interest.
Abbreviations
DEM = digital elevation model; GIS = geographic information system; GPS = global positioning system; JM = jaw movement; LTER = long-term ecological research; RJM = rate of jaw movement; TI = time interval between consecutive jaw movements.
Appendix A. Constrained Combinatorial Screening of Factors
In the ANOVA of 10 min-level RJM, the constrained combinatorial screening contained results from 126 models representing permutations of the inclusion/exclusion of terms related to the landscape (topographic slope, aspect, elevation, path angle, steepness and direction) that were added to a set of core terms present in all models. Second-order terms were only tested in the presence of the first-order term. First- and second-order terms for the path angle were examined in separate models from those based on steepness and direction. The results were scanned for associations between the significance of a variable in the model and the presence/absence of all other variables.
In the ANOVA of 10 min-level RJM, the only variables that yielded consistent high significance belonged to the group of core variables. Season was highly significant (p < 0.0001) in all models, and species–herd was significant (p < 0.02) in all models; the season × species–herd interaction was not significant in any model (p > 0.3). The linear and quadratic terms for the 10 min-segment were highly significant (p < 0.001) in all models, as was the lagged RJM (p < 0.0001). Among the non-core landscape-related variables, aspect was not significant in 48 of 63 models. When the topographic slope was included as a linear factor only, it was significant (p < 0.05) in 24 of the 42 models and highly so for a number of them. In all these models, the coefficient was always positive, implying, if anything, an increase in RJM with increasing topographic slope. When both linear and quadratic terms for topographic slope were included in the model, neither term was significant in any model. When elevation was included as a linear factor only, it was not significant in any of the 42 models examined (p > 0.4). When the model included both the linear and quadratic terms for elevation, both terms were significant in all models and mostly at a significance level of p < 0.01. In all models, coefficients for the linear and quadratic terms were negative and positive, respectively, implying a convex shape. For models using path angle, the linear term was not significant in any model, with or without the quadratic term (p > 0.1), and the quadratic term was significant (p < 0.05) in six of 18 models. For models using steepness/direction, steepness was significant (p < 0.01) in all models in which it appeared. The coefficients for steepness were positive, implying that RJM increases with increasing steepness. Direction alone was not significant (p > 0.1) in any model. Including steepness and direction in the same model yielded similar results to those obtained for each factor alone. The steepness × direction interaction term was not significant in any model (p > 0.2).
In terms of presence/absence dependencies among non-core variables, some relationship existed between aspect and elevation; for the 15 models in which aspect was significant, the linear and quadratic terms for elevation were always present. Not surprisingly, the steepness of the animal’s path angle and the topographic slope of the landscape were related; steepness was absent from all 24 models in which topographic slope (linear only) was significant. Similarly, the quadratic term for path angle was absent from the 17 models with the lowest p-values for topographic slope. Significance levels for the linear and quadratic terms for elevation were not sensitive to presence/absence of other variables in the model. For models using path angle, the linear and quadratic terms for topographic slope were absent from the six significant models. For models using steepness/direction, the significance of steepness was stronger when the topographic slope was not included in the model.
In the ANOVA of 10 min-level velocity, the combinatorial screening was again based on 126 models. In terms of the core variables, season was highly significant (p < 0.0001) in all models; species–herd was not significant (p > 0.1) in any model, neither was the season × species–herd interaction (p > 0.3). The linear and quadratic terms for 10 min-segment, RJM and lagged velocity were all highly significant (p < 0.0001) in all models.
In terms of the non-core landscape-related variables, the only variables to display the same consistent high significance across all models, as shown by some of the core variables, were the quadratic term for path angle and the steepness, as detailed below. Aspect was significant in all models (p < 0.05), sometimes highly so. Topographic slope as a linear term only yielded highly variable probabilities (range < 0.0001–0.8), and its coefficient was positive. The quadratic term for topographic slope was significant in all models (p < 0.05) and most highly so when steepness was included in the model. When elevation was included as a linear factor only, it was significant in all of the 42 models examined (p < 0.01), and the coefficients were all negative (≈−0.0007). When the model included both the linear and quadratic terms for elevation, the quadratic term was significant in 18 of the 42 models.
For models using the path angle, when included as a linear term only, the term was significant (p < 0.01) in all 18 models. Similarly, the quadratic term was highly significant (p < 0.0001) in the 18 models that included it. The coefficient of the linear term was positive, and that of the quadratic term was negative, yielding a concave response centered near zero and symmetrical for negative (uphill) and positive (downhill) values. For models using steepness/direction, steepness alone was highly significant (p < 0.0001) in all 18 models examined, and the coefficients were negative (~−0.02), implying a decrease in velocity with increasing steepness. The direction was significant (p < 0.05) in all 18 models in which it appeared alone, and the coefficients implied slower velocity uphill versus downhill. Including steepness and direction in the same model yielded similar results to those obtained for each factor alone. The steepness × direction interaction was significant or marginally significant in all models in which it appeared (p < 0.09).
There were various presence/absence dependencies among the non-core variables of aspect, topographic slope and elevation. The 21 models with highest significance for aspect did not contain the quadratic term for topographic slope, and the linear term was absent in most of those as well. For topographic slope, the group of models with the highest significance (p < 0.0001) all contained steepness, and the remainder did not. Models with the highest significance (p < 0.0001) for elevation all contained topographic slope, and the remainder did not. The quadratic elevation term was not significant in any model that contained steepness.
References
- Fynn, R.W.S.; O’Connor, T.G. Effect of stocking rate and rainfall on rangeland dynamics and cattle performance in a semi-arid savanna, South Africa. J. Appl. Ecol. 2000, 37, 491–507. [Google Scholar] [CrossRef]
- Allred, B.W.; Fuhlendorf, S.D.; Hovick, T.J.; Dwayne Elmore, R.; Engle, D.M.; Joern, A. Conservation implications of native and introduced ungulates in a changing climate. Glob. Change Biol. 2013, 19, 1875–1883. [Google Scholar] [CrossRef] [PubMed]
- Yu, T.; Yan, R.; Zhang, C.; Chen, S.; Zhang, Z.; Guo, L.; Hu, T.; Jiang, C.; Wang, M.; Bai, K.; et al. How does grazing pressure affect feed intake and behavior of livestock in a meadow steppe in northern China and their coupling relationship. Sci. Total Environ. 2024, 908, 168472. [Google Scholar] [CrossRef] [PubMed]
- Paz-Kagan, T.; Alexandroff, V.; Ungar, E.D. Detection of goat herding impact on vegetation cover change using multi-season, multi-herd tracking and satellite imagery. Sci. Total Environ. 2023, 895, 164830. [Google Scholar] [CrossRef]
- Stegner, M.A.; Belnap, J.; Bishop, T.B.B.; Knight, A.C.; Nauman, T.W.; Duniway, M.C. Vulnerability of different Colorado plateau land types to drivers of change. Ecol. Indic. 2026, 183, 114654. [Google Scholar] [CrossRef]
- Manousidis, T.; Kyriazopoulos, A.P.; Semenzato, P.; Sturaro, E.; Mallinis, G.; Papageorgiou, A.C.; Abas, Z. Spatio-temporal analysis of movement behavior of herded goats grazing in a Mediterranean woody rangeland using GPS collars. Agronomy 2026, 16, 21. [Google Scholar] [CrossRef]
- Senft, R.L.; Coughenour, M.B.; Bailey, D.W.; Rittenhouse, L.R.; Sala, O.E.; Swift, D.M. Large herbivore foraging and ecological hierarchies. BioScience 1987, 37, 789–799. [Google Scholar] [CrossRef]
- Golodets, C.; Kigel, J.; Sternberg, M. Plant diversity partitioning in grazed Mediterranean grassland at multiple spatial and temporal scales. J. Appl. Ecol. 2011, 48, 1260–1268. [Google Scholar] [CrossRef]
- Turner, M.D.; Hiernaux, P.; Schlecht, E. The distribution of grazing pressure in relation to vegetation resources in semi-arid West Africa: The role of herding. Ecosystems 2005, 8, 668–681. [Google Scholar] [CrossRef]
- Kavishe, R.E.; Mulungu, D.M.; Alexander, A.C.; Ehsan, M.A. A rainfall–livestock vulnerability index for semi-arid systems: Spatial hotspots and adaptive grazing strategies in Tanzania. Earth Syst. Environ. 2026, 1–30. [Google Scholar] [CrossRef]
- Ungar, E.D.; Horn, R.; Zahavi, M.; Baram, H.; Evlagon, D. Not-so-precise livestock farming: GPS and the spatial dimension of extensive grazing systems. In Practical Precision Livestock Farming: Hands-On Experiences with PLF Technologies in Commercial and R&D Settings; Banhazi, T., Halas, V., Maroto-Molina, F., Eds.; Wageningen Academic Publishers: Wageningen, The Netherlands, 2022; pp. 247–265. [Google Scholar] [CrossRef]
- Parsons, A.J.; Thornley, J.H.M.; Newman, J.; Penning, P.D. A mechanistic model of some physical determinants of intake rate and diet selection in a two-species temperate grassland sward. Funct. Ecol. 1994, 8, 187–204. [Google Scholar] [CrossRef]
- Meuret, M.; Provenza, F.D. When art and science meet: Integrating knowledge of French herders with science of foraging behavior. Rangel. Ecol. Manag. 2015, 68, 1–17. [Google Scholar] [CrossRef]
- Turner, L.W.; Udal, M.C.; Larson, B.T.; Shearer, S.A. Monitoring cattle behavior and pasture use with GPS and GIS. Can. J. Anim. Sci. 2000, 80, 405–413. [Google Scholar] [CrossRef]
- Augustine, D.J.; Derner, J.D. Assessing herbivore foraging behavior with GPS collars in a semiarid grassland. Sensors 2013, 13, 3711–3723. [Google Scholar] [CrossRef]
- Brennan, J.; Johnson, P.; Olson, K. Classifying season long livestock grazing behavior with the use of a low-cost GPS and accelerometer. Comput. Electron. Agric. 2021, 181, 105957. [Google Scholar] [CrossRef]
- Rivero, M.J.; Grau-Campanario, P.; Mullan, S.; Held, S.D.E.; Stokes, J.E.; Lee, M.R.F.; Cardenas, L.M. Factors affecting site use preference of grazing cattle studied from 2000 to 2020 through GPS tracking: A review. Sensors 2021, 21, 2696. [Google Scholar] [CrossRef]
- Augustine, D.J.; Reed, M.J.; Kearney, S.P.; Porensky, L.M.; Scasta, J.D.; Pellatz, D.W.; Derner, J.D. Linking foraging behaviour of free-ranging, lactating beef cows with diet quality and weight gain in semi-arid rangeland. Appl. Anim. Behav. Sci. 2025, 292, 106802. [Google Scholar] [CrossRef]
- Wade, C.; Trotter, M.G.; Bailey, D.W. Small ruminant landscape distribution: A literature review. Small Rumin. Res. 2023, 223, 106966. [Google Scholar] [CrossRef]
- McGranahan, D.A.; Geaumont, B.; Spiess, J.W. Assessment of a livestock GPS collar based on an open-source datalogger informs best practices for logging intensity. Ecol. Evol. 2018, 8, 5649–5660. [Google Scholar] [CrossRef]
- Buerkert, A.; Schlecht, E. Performance of three GPS collars to monitor goats’ grazing itineraries on mountain pastures. Comput. Electron. Agric. 2009, 65, 85–92. [Google Scholar] [CrossRef]
- Ungar, E.D.; Nevo, Y.; Baram, H.; Arieli, A. Evaluation of the IceTag leg sensor and its derivative models to predict behaviour, using beef cattle on rangeland. J. Neurosci. Methods 2018, 300, 127–137. [Google Scholar] [CrossRef] [PubMed]
- Chebli, Y.; El Otmani, S.; Hornick, J.-L.; Keli, A.; Bindelle, J.; Chentouf, M.; Cabaraux, J.-F. Using GPS collars and sensors to investigate the grazing behavior and energy balance of goats browsing in a Mediterranean forest rangeland. Sensors 2022, 22, 781. [Google Scholar] [CrossRef] [PubMed]
- Sprinkle, J.E.; Sagers, J.K.; Hall, J.B.; Ellison, M.J.; Yelich, J.V.; Brennan, J.R.; Taylor, J.B.; Lamb, J.B. Predicting cattle grazing behavior on rangeland using accelerometers. Rangel. Ecol. Manag. 2021, 76, 157–170. [Google Scholar] [CrossRef]
- Cabezas, J.; Yubero, R.; Visitación, B.; Navarro-García, J.; Algar, M.J.; Cano, E.L.; Ortega, F. Analysis of accelerometer and GPS data for cattle behaviour identification and anomalous events detection. Entropy 2022, 24, 336. [Google Scholar] [CrossRef]
- Ungar, E.D.; Schoenbaum, I.; Henkin, Z.; Dolev, A.; Yehuda, Y.; Brosh, A. Inference of the activity timeline of cattle foraging on a Mediterranean woodland using GPS and pedometry. Sensors 2011, 11, 362–383. [Google Scholar] [CrossRef]
- Ungar, E.D.; Henkin, Z.; Gutman, M.; Dolev, A.; Genizi, A.; Ganskopp, D. Inference of animal activity from GPS collar data on free-ranging cattle. Rangel. Ecol. Manag. 2005, 58, 256–266. [Google Scholar] [CrossRef]
- Rutter, S.M.; Champion, R.A.; Penning, P.D. An automatic system to record foraging behaviour in free-ranging ruminants. Appl. Anim. Behav. Sci. 1997, 54, 185–195. [Google Scholar] [CrossRef]
- Ungar, E.D.; Rutter, S.M. Classifying cattle jaw movements: Comparing IGER Behaviour Recorder and acoustic techniques. Appl. Anim. Behav. Sci. 2006, 98, 11–27. [Google Scholar] [CrossRef]
- Navon, S.; Mizrach, A.; Hetzroni, A.; Ungar, E.D. Automatic recognition of jaw movements in free-ranging cattle, goats and sheep, using acoustic monitoring. Biosyst. Eng. 2013, 114, 474–483. [Google Scholar] [CrossRef]
- Steinmetz, M.; von Soosten, D.; Hummel, J.; Meyer, U.; Dänicke, S. Validation of the RumiWatch Converter V0.7.4.5 classification accuracy for the automatic monitoring of behavioural characteristics in dairy cows. Arch. Anim. Nutr. 2020, 74, 164–172. [Google Scholar] [CrossRef]
- Ungar, E.D.; Nevo, Y. Rhythms, patterns and styles in the jaw movement activity of beef cattle on rangeland as revealed by acoustic monitoring. Sensors 2025, 25, 1210. [Google Scholar] [CrossRef] [PubMed]
- Andriamandroso, A.L.H.; Bindelle, J.; Mercatoris, B.; Lebeau, F. A review on the use of sensors to monitor cattle jaw movements and behavior when grazing. Biotechnol. Agron. Soc. Environ. 2016, 20, 273–286. [Google Scholar] [CrossRef]
- Heublein, C.; Dohme-Meier, F.; Südekum, K.-H.; Bruckmaier, R.M.; Thanner, S.; Schori, F. Impact of cow strain and concentrate supplementation on grazing behaviour, milk yield and metabolic state of dairy cows in an organic pasture-based feeding system. Animal 2016, 11, 1163–1173. [Google Scholar] [CrossRef] [PubMed]
- Chelotti, J.O.; Vanrell, S.R.; Galli, J.R.; Giovanini, L.L.; Rufiner, H.L. A pattern recognition approach for detecting and classifying jaw movements in grazing cattle. Comput. Electron. Agric. 2018, 145, 83–91. [Google Scholar] [CrossRef]
- Ferrero, M.; Chelotti, J.O.; Martinez-Rau, L.S.; Vignolo, L.D.; Pires, M.; Galli, J.R.; Giovanini, L.L.; Rufiner, H.L. A multi-head deep fusion model for recognition of cattle foraging events using sound and movement signals. Eng. Appl. Artif. Intell. 2025, 157, 111372. [Google Scholar] [CrossRef]
- Laca, E.A.; Ungar, E.D.; Seligman, N.G.; Ramey, M.R.; Demment, M.W. An integrated methodology for studying short-term grazing behaviour of cattle. Grass Forage Sci. 1992, 47, 81–90. [Google Scholar] [CrossRef]
- Laca, E.A.; Ungar, E.D.; Seligman, N.G.; Demment, M.W. Effects of sward height and bulk density on bite dimensions of cattle grazing homogeneous swards. Grass Forage Sci. 1992, 47, 91–102. [Google Scholar] [CrossRef]
- Chelotti, J.O.; Vanrell, S.R.; Milone, D.H.; Utsumi, S.A.; Galli, J.R.; Rufiner, H.L.; Giovanini, L.L. A real-time algorithm for acoustic monitoring of ingestive behavior of grazing cattle. Comput. Electron. Agric. 2016, 127, 64–75. [Google Scholar] [CrossRef]
- Galli, J.R.; Cangiano, C.A.; Pece, M.A.; Larripa, M.J.; Milone, D.H.; Utsumi, S.A.; Laca, E.A. Monitoring and assessment of ingestive chewing sounds for prediction of herbage intake rate in grazing cattle. Animal 2018, 12, 973–982. [Google Scholar] [CrossRef]
- Navon, S.; Bellalu, A.; Ben-Moshe, E.; Voet, H.; Ungar, E.D. From chew counts to intake amounts: An evaluation of acoustic sensing in browsing goats. Sensors 2026, 26, 719. [Google Scholar] [CrossRef]
- Singer, A. Soils of the Negev. In The Soils of Israel; Springer: Berlin/Heidelberg, Germany, 2007. [Google Scholar] [CrossRef]
- Shapiro, M.B. Soils of Israel. Eurasian Soil Sci. 2006, 39, 1170–1175. [Google Scholar] [CrossRef]
- Danin, A.; Orshan, G.; Zohary, M. The vegetation of the Northern Negev and the Judean Desert of Israel. Isr. J. Bot. 1975, 24, 118–172. [Google Scholar]
- Danin, A.; Orshan, G. The distribution of Raunkier life-forms in Israel in relation to the environment. J. Veg. Sci. 1990, 1, 41–48. [Google Scholar] [CrossRef]
- Golodets, C.; Sternberg, M.; Kigel, J.; Boeken, B.; Henkin, Z.; Seligman, N.G.; Ungar, E.D. From desert to Mediterranean rangelands: Will increasing drought and inter-annual rainfall variability affect herbaceous annual primary productivity? Clim. Change 2013, 119, 785–798. [Google Scholar] [CrossRef]
- Livne, E.; Svoray, T. Components of uncertainty in primary production model: The study of DEM, classification and location error. Int. J. Geogr. Inf. Sci. 2011, 25, 473–488. [Google Scholar] [CrossRef]
- Mesa-Mingorance, J.L.; Ariza-López, F.J. Accuracy assessment of Digital Elevation Models (DEMs): A critical review of practices of the past three decades. Remote Sens. 2020, 12, 2630. [Google Scholar] [CrossRef]
- Druzinsky, R.E. The time allometry of mammalian chewing movements: Chewing frequency scales with body mass in mammals. J. Theor. Biol. 1993, 160, 427–440. [Google Scholar] [CrossRef]
- Virot, E.; Ma, G.; Clanet, C.; Jung, S. Physics of chewing in terrestrial mammals. Sci. Rep. 2017, 7, 43967. [Google Scholar] [CrossRef]
- Kam, M.; El-Meccawi, S.; Degen, A.A. Foraging behaviour and diet selection of free-ranging sheep and goats in the Negev Desert, Israel. J. Agric. Sci. 2012, 150, 379–387. [Google Scholar] [CrossRef]
- Zahavi, M. The Impact of Landscape Level Attributes on Livestock Distribution in a Semiarid Environment. Doctoral Dissertation, Ben-Gurion University of the Negev, Beersheba, Israel, 1 April 2014. Available online: https://primo.bgu.ac.il/discovery/delivery/972BGU_INST:972BGU/12217799800004361 (accessed on 2 February 2026).
- Arnon, A.; Svoray, T.; Ungar, E.D. The spatial dimension of pastoral herding: A case study from the Northern Negev. Isr. J. Ecol. Evol. 2011, 57, 129–149. [Google Scholar] [CrossRef]
- Sun, J.; Walters, M.; Svensson, N.L.; Lloyd, D.G. The influence of surface slope on human gait characteristics: A study of urban pedestrians walking on an inclined surface. Ergonomics 1996, 39, 677–692. [Google Scholar] [CrossRef]
- Xie, W.; Lee, E.W.M.; Li, T.; Jiang, N.; Ma, Y. Pedestrian dynamics on slopes: Empirical analysis of level, uphill, and downhill walking. Saf. Sci. 2024, 172, 106429. [Google Scholar] [CrossRef]
- Campbell, M.J.; Dennison, P.E.; Butler, B.W.; Page, W.G. Using crowdsourced fitness tracker data to model the relationship between slope and travel rates. Appl. Geogr. 2019, 106, 93–107. [Google Scholar] [CrossRef]
- Ungar, E.D.; Ravid, N.; Zada, T.; Ben-Moshe, E.; Yonatan, R.; Baram, H.; Genizi, A. The implications of compound chew-bite jaw movements for bite rate in grazing cattle. Appl. Anim. Behav. Sci. 2006, 98, 183–195. [Google Scholar] [CrossRef]
- WallisDeVries, M.F.; Laca, E.A.; Demment, N.W. From feeding station to patch: Scaling up food intake measurements in grazing cattle. Appl. Anim. Behav. Sci. 1998, 60, 301–315. [Google Scholar] [CrossRef]
- Ungar, E.D.; Ravid, N.; Bruckental, I. Bite dimensions for cattle grazing herbage at low levels of depletion. Grass Forage Sci. 2001, 56, 35–45. [Google Scholar] [CrossRef]
- Ginnett, T.F.; Dankosky, J.A.; Deo, G.; Demment, M.W. Patch depression in grazers: The roles of biomass distribution and residual stems. Funct. Ecol. 1999, 13, 37–44. Available online: http://www.jstor.org/stable/2656425 (accessed on 2 February 2026). [CrossRef]
- Laca, E.A.; Distel, R.A.; Criggs, T.C.; Demment, M.W. Effects of canopy structure on patch depression by grazers. Ecology 1994, 75, 706–716. [Google Scholar] [CrossRef]
- Boval, M.; Robert, P.-E.; Sauvant, D. Dataset from the literature on the ingestive behaviour of grazing ruminants. Data Brief 2024, 54, 110488. [Google Scholar] [CrossRef]
- Kholmurodova, M.; Juliev, M.; Khamidullaev, S.; Djanpulatova, Z.; Turdalieva, S.; Khadjieva, Z.; Abdikairov, B.; Shamsiev, M.; Khakberdiev, O. Comparative soil erosion susceptibility assessment using statistical and data-driven techniques: Evidence from the Chartak district, Uzbekistan. Appl. Ecol. Environ. Res. 2026, 24, 1113–1131. [Google Scholar] [CrossRef]
- Stavi, I.; Lavee, H.; Ungar, E.D.; Sarah, P. Grazing-induced modification of a semi-arid rangeland from a two-phase to a three-phase mosaic geo-ecosystem. Arid Land Res. Manag. 2012, 26, 79–83. [Google Scholar] [CrossRef]
- Stavi, I.; Lavee, H.; Ungar, E.D.; Sarah, P. Ecogeomorphic feedbacks in semiarid rangelands: A review. Pedosphere 2009, 19, 217–229. [Google Scholar] [CrossRef]
- Ungar, E.D.; Noy-Meir, I. Herbage intake in relation to availability and sward structure: Grazing processes and optimal foraging. J. Appl. Ecol. 1988, 25, 1045–1062. [Google Scholar] [CrossRef]
- Noy-Meir, I. Stability of grazing systems: An application of predator-prey graphs. J. Ecol. 1975, 63, 459–481. [Google Scholar] [CrossRef]
- Minea, G.; Mititelu-Ionuș, O.; Gyasi-Agyei, Y.; Ciobotaru, N.; Rodrigo-Comino, J. Impacts of grazing by small ruminants on hillslope hydrological processes: A review of European current understanding. Water Resour. Res. 2022, 58, e2021WR030716. [Google Scholar] [CrossRef]
- Ungar, E.D. Perspectives on the concept of rangeland carrying capacity, and their exploration by means of Noy-Meir’s two-function model. Agric. Syst. 2019, 173, 403–413. [Google Scholar] [CrossRef]
- Encabo, J.B.M.; Cordeiro, M.R.C.; McGeough, E.J.; Walker, D.; Ominski, K.H.; McAllister, T.A. Large-scale estimation of carrying capacities in agricultural Crown lands of Manitoba, Canada using land cover datasets. Agric. Syst. 2026, 234, 104667. [Google Scholar] [CrossRef]


Disclaimer/Publisher’s Note: The statements, opinions and data contained in all publications are solely those of the individual author(s) and contributor(s) and not of MDPI and/or the editor(s). MDPI and/or the editor(s) disclaim responsibility for any injury to people or property resulting from any ideas, methods, instructions or products referred to in the content. |
© 2026 by the authors. Licensee MDPI, Basel, Switzerland. This article is an open access article distributed under the terms and conditions of the Creative Commons Attribution (CC BY) license.