Abstract
Recent large-scale renewable energy projects, such as the Luzia Solar and Chafariz Wind energy plants in Santa Luzia, Paraíba, Brazil, raised environmental concerns due to their impact on vegetation cover and landscape structure. This study used geospatial technologies to evaluate changes in tree cover and landscape configuration resulting from the installation of these projects. Sentinel-2 imagery processed in Google Earth Engine generated NDVI, SAVI, NDWIveg, and LAI vegetation index data for the dry and rainy seasons of the six years between 2019 and 2024. With these vegetation index values and considering MapBiomas (version 8.0) and FRAGSTATS software (version 4.2), we analyzed the changes in land use and vegetation cover of Santa Luzia municipality during this six-year period. Land use and vegetation cover remained stable from 2019 to 2020 (before the installation of the energy plants), characterized by an NDVI value of 0.60, while tree cover decreased in the following four years, during or after the installation of the energy plants, as indicated by the consistent decreases in NDVI and NDWIveg values. Grassland class areas declined from 41.80% (18,434.59 ha) in 2019, to 34.36% (15,151.22 ha) in 2023, while non-vegetated areas increased by 148%. Landscape metrics showed increased fragmentation, with patch density rising from 3.31 to 3.88 patches/100 ha and core area decreasing from 3045.60 ha to 1395.01 ha. These data demonstrated measurable ecological impacts linked to the infra-structure built to run the two solar and wind energy plants in the semi-arid region of Santa Luzia, Paraíba, Brazil.
1. Introduction
The Brazilian Semi-Arid Region (BSAR) extends across the nine states of the Northeastern region of Brazil and the northern portion of Minas Gerais. It covers approximately 12% of the country’s area and is home to about 28 million inhabitants, making it one of the most densely populated semi-arid regions in the world [1]. Characteristically, this region shows high temperatures and intense solar radiation [2].
The annual rainfall averages 800 mm, irregularly distributed in time and space [2]. Historically, the effects of El Niño and La Niña on BSAR result in extreme climatic events, such as floods and water scarcity [3,4]. In this semi-arid environment, such instability renders the xerophilous vegetation particularly vulnerable to prolonged droughts, thereby intensifying erosion, soil degradation, and the risk of desertification, especially after vegetation cover removal by man or loss due to harsh environmental conditions [5].
The Caatinga Biome is exclusive to Brazil, predominates in the BSAR, and shows a rich fauna and flora with many endemic species [6]. However, it is highly threatened by unsustainable land use practices, including deforestation, overgrazing, slash and burning agricultural practice and, more recently, the installation and expansion of solar and wind energy plants [6,7]. These activities compromise ecosystem services, decrease local biodiversity and increase the risks of species extinction.
Due to its geographical location, recent years have witnessed the establishment of many solar and wind energy plants [8]. Now, the Northeast region has a significant role in the national energy sector due to its photovoltaic and wind plants [9].
The recent expansion of renewable energy production in the semi-arid region of Paraíba contributed to the diversification of the Brazilian energy matrix and the local socioeconomic development [10]. Beyond construction-related disturbances, the operational phase of renewable energy facilities may affect vegetation dynamics [11]. Wind farms can alter local microclimatic conditions and vegetation vigor, reduce plant diversity and induce community convergence around each turbine [12,13], an environmental stress that spreads over large areas as the turbines are widely spaced on slopes and hilltops and interconnected by roads where once predominated continuous forested areas with little exposure to human activity. Photovoltaic installations may affect vegetation through persistent shading, surface albedo modification, soil compaction, and land use change [14]. However, impacts on vegetation are particularly intense during the installation phase of energy plants, when most vegetation removal occurs due to land clearing, road construction, and infrastructure deployment. For this reason, the present study focuses exclusively on vegetation dynamics associated with the construction phase of these renewable energy facilities, rather than their operational phase.
Thus, the growing number of solar and wind plants is of concern regarding the possible alterations in local vegetation structure and the subsequent effects on biodiversity and ecosystem services in the surroundings of these energy complexes.
Geoprocessing techniques represent essential tools for monitoring deforestation, vegetation cover recovery, and land use changes [15]. The use of vegetation indices such as NDVI, SAVI, NDWI, and LAI enables the assessment of tree cover dynamics and vegetation responses to anthropogenic pressures [16]. Combined with landscape metrics, these indices provide integrated analyses of the spatial and structural impacts of such projects, supporting territorial planning and conservation strategies [17].
In the context of environmental impacts caused by renewable energy plants, geospatial technologies emerge as strategic tools for environmental monitoring and for the design of alternative actions to restore degraded areas [18]. Therefore, the dissemination of remote sensing studies related to the analysis of environmental impacts in the scientific literature can provide valuable data and protocols to devise strategies for environmental recovery. In this regard, considering the potential of the Paraíba hinterland for renewable energy generation and the associated impacts of solar and wind plants on ecosystems, in general, and on forests in particular, this study addressed the following research questions: What were the spatiotemporal changes in vegetation cover resulting from the installation of a solar and a wind plant, in the semi-arid region of Santa Luzia, Paraiba, Brazil, based on NDVI, SAVI, NDWIveg, and LAI indices? How did the structure and spatial patterns of the landscape change during the installation of these renewable energy complexes? How did vegetation around these complexes evolve over time, according to vegetation indices and landscape metrics, before and during the six-year initial period of the installation of these projects?
This study analyzed, by means of geospatial technologies, the changes in tree cover and the landscape structure observed in the areas of influence of the Chafariz Wind Complex and the Luzia Solar Complex, located in the semi-arid region of Santa Luzia, Paraíba, Brazil, before and during the first six years of their installation phase.
2. Materials and Methods
2.1. Study Area Characterization
The study area corresponded to the municipality of Santa Luzia, located in the state of Paraíba, Brazil (from 7°08′00″ S to 6°45′25″ S, and from 37°02′04″ W to 36°46′28″ W, covering an area of approximately 440 km2). According to the Köppen–Geiger, the region’s climate class corresponds to the “BSh” one—hot semi-arid [19,20]. Based on the climatological normals data for the 1981–2010 period (National Institute of Meteorology—INMET, Brasília, DF, Brazil), the air temperature averaged air temperature of 27.60 °C, with minimum and maximum average values of 22.00 °C and 34.10 °C, respectively. The annual precipitation averaged 780 mm [21].
The areas occupied by the Luzia Solar and Chafariz Wind complexes are representative of the Caatinga in the Semi-Arid Region of Paraíba, where shallow and erosion-prone soils with high surface reflectance influence vegetation vigor and responses to water stress [22]. The landscape comprises Arborized Caatinga fragments interspersed with shrub–herbaceous strata and Pasture–Grassland formations, consistent with the land-cover patterns identified by MapBiomas [22]. Historical land use practices, including grazing and selective extraction of forest products, led to the heterogeneous mosaic of different successional stages of plant communities [22]. These environmental characteristics provided the essential context for interpreting the decline of the vegetation cover and the increase in landscape fragmentation observed after the installation of the renewable energy complexes.
To contextualize the climatic dynamics of the study area, precipitation data were obtained from the TerraClimate database https://www.climatologylab.org/terraclimate.html (accessed on 9 October 2025). Filgueiras et al. [23] evaluated and considered this database accurate and applicable for climatological analyses in the Brazilian territory. The analysis of the data, available on a monthly scale and with a spatial resolution of approximately 4 km, organized and processed in a spreadsheet, estimated the accumulated annual averages, helping in the interpretation of the calculated vegetation indices values and landscape metrics.
In addition to the climatic characterization, the spatial analysis developed in this study encompassed the entire municipal territory, with emphasis on two areas: the Chafariz Wind Complex (6°58′59″ S and 36°53′15″ W) and the Luzia Solar Complex (6°50′53″ S and 36°56′43″ W). Both projects are located within the territorial limits of the Santa Luzia municipality and represent an important hub of renewable energy generation in the region (Figure 1).
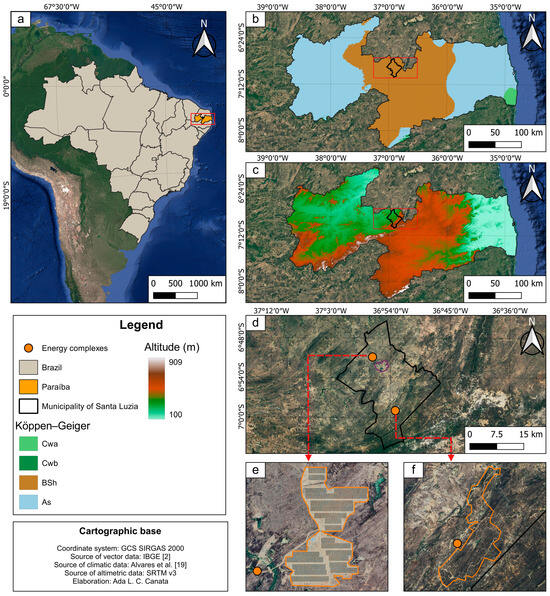
Figure 1.
Location of the solar and wind energy complexes in Santa Luzia, Paraíba State, Northeastern Brazil. (a) South America and Brazil, with Paraíba State in prominence. (b) Location of Paraíba and Santa Luzia within the regional Köppen–Geiger BSh climatic zone. (c) Altitude map of the municipality. (d) Location of the energy complexes. (e) Luzia Photovoltaic Plant. (f) Chafariz wind complex [2,19].
The integration of the Chafariz Wind Farm and the Luzia Photovoltaic Plant forms the Neoenergia Renewable Complex, a project developed by the Spanish company Iberdrola through its Brazilian subsidiary Neoenergia, in the semi-arid region of Paraíba. Construction of the Chafariz Wind plant began in October 2019, with operations starting in January 2022. It is composed of 15 wind farms, totaling an installed capacity exceeding 471.25 MW, distributed across 136 wind turbines. The wind energy infrastructure occupies approximately 2726.81 ha. The Luzia Solar plant, the company’s first centralized solar generation unit, began operations in March 2023 and includes approximately 228,000 photovoltaic panels, reaching a total installed capacity of 149.3 MW. The solar facility occupies approximately 337.47 ha. Together, these two plants form one of the largest renewable energy complexes in Brazil, standing out for their strategic contribution to the national energy matrix [24].
2.2. Methodological Flowchart
The summary of the methodology applied in this study is in Figure 2, and integrates the main stages of data acquisition, image processing, vegetation analyses, and landscape metrics computation.
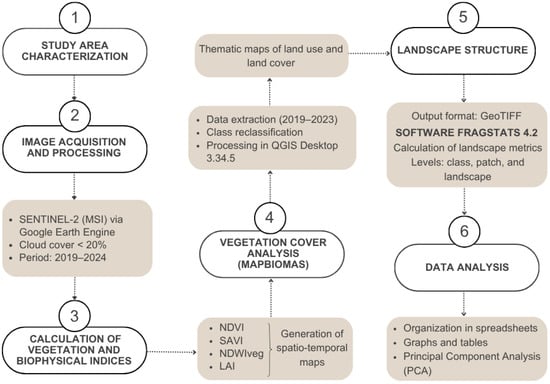
Figure 2.
Methodological flowchart detailing the stages of the study. Arrows indicate the sequence of analytical steps and data processing workflow.
2.3. Processing of Vegetation and Biophysical Indices
The vegetation indices analyzed in this study included the Normalized Difference Vegetation Index (NDVI), the Soil-Adjusted Vegetation Index (SAVI), the Normalized Difference Water Index for vegetation (NDWIveg), and the Leaf Area Index (LAI). These indices, calculated for both the dry and rainy seasons from 2019 to 2024, totaled 12 seasonal composite images per index. This design made it possible to assess vegetation dynamics and characterize resilience and floristic structure under contrasting hydrological conditions within and around the photovoltaic and wind energy plants. The temporal interval considered images taken before the beginning of the installation of the plants and during their first six years of installation and operation, allowing the identification of land use and vegetation shifts associated with each plant.
The four selected indices correspond to distinct and complementary ecological dimensions, particularly in semi-arid environments. NDVI and SAVI assess vegetation vigor; SAVI corrects for soil background effects and is more robust in Caatinga landscapes than the NDVI index as high soil reflectance may bias its estimates [25,26]. NDWIveg detects changes in vegetation water content [27], enabling the identification of hydric stress even when NDVI remains at moderate levels. LAI represents structural canopy density and aboveground biomass [28], providing physiologically meaningful information not captured by purely spectral vegetation indices. To streamline the presentation of methodological details, the vegetation and biophysical indices applied in this study are summarized in Table 1, which includes the index name, its corresponding equation, and the original reference.

Table 1.
Vegetation and biophysical indices used in this study.
The L value is a constant used to minimize soil influence on the spectral responses of vegetation. According to Huete [25], this value should vary inversely with vegetation density, ranging from 0 to 1 (Table 2). In this study, we adopted L = 0.25 (Table 2), a minimal value expected to reduce the risk of overestimating SAVI and to ensure the detection of the real variations in vegetation cover, according to Huete [25].
Table 2.
Values of the L factor in SAVI according to vegetation cover conditions.
To distinguish it from McFeeters’ NDWI, commonly used to detect surface water bodies, the nomenclature NDWIveg was adopted. In some referenced studies, NDWIveg appears simply as NDWI; therefore, comparisons were made considering the equivalence between the two terms.
In the Semi-Arid Region of Paraíba, precipitation patterns strongly determine seasonal dynamics. Based on its climatologic data, we defined the local rainy season as the three-month period from February to April, when rainfall is at its highest level and accompanied by the rapid leaf emission process and short annual growth cycle. We considered the four-month period from September to December as the dry season, when rainfall and soil water availability are minimal.
The satellite dataset used to compute the indices consisted of Sentinel-2 Level-2A imagery acquired by the MSI (Multispectral Instrument) sensor. Image processing was performed on the Google Earth Engine (GEE) platform using the ee.ImageCollection COPERNICUS/S2_SR_HARMONIZED, which provides atmospherically corrected surface reflectance data [30]. All satellite images showing less than 20% cloud cover in each period contributed to estimating the index values. To ensure methodological consistency across the time series, we collected an additional sample of the same size of Sentinel-2 images for each season and year.
2.4. Vegetation Cover Dynamics via MapBiomas Brazil
To assess vegetation cover, we used land use and land cover (LULC) data from the MapBiomas Brazil platform [22], available up to 2023. The data were obtained from https://brasil.mapbiomas.org/ (accessed on 24 April 2025). MapBiomas is a multi-institutional initiative that produces annual LULC maps for all Brazilian biomes using machine-learning classification (primarily Random Forest) applied to multispectral satellite imagery. Version 8.0 is structured in “data collections,” meaning that each new collection reprocesses the entire historical series with updated algorithms and training datasets [22,31].
Although derived from Landsat imagery (30 m resolution), MapBiomas provides harmonized, validated, and thematically consistent annual classifications, which complement the 10–20 m spatial analysis based on Sentinel-2 used in this study. We used MapBiomas outputs only to evaluate annual patterns of land use and land-cover change, while Sentinel-2 vegetation indices supported the seasonal vegetation dynamics analysis.
To optimize the map design of the land use and land-cover classes of the study area, we reclassified the original MapBiomas classes. The strategy focused on merging categories with similar ecological attributes and reducing ambiguities caused by spectral confusion. Consequently, we consolidated detailed classes into broader groups without losing their ecological-functional meaning (Table 3). Then, we generated Raster files for the years 2019 to 2023 for each land use type, and calculated the area of the major land cover classes using the “r.report” plugin of the GRASS GIS 7 software [32], integrated into QGIS Desktop 3.34.5 [33].
Table 3.
Description of Reclassified MapBiomas Classes.
2.5. Landscape Structure Analysis
Landscape structure analysis considered the municipal boundary of the municipality of Santa Luzia as the spatial unit. All metrics represent cumulative landscape changes at the municipal scale over time, including those associated with renewable energy project installation. Based on the land use and land cover maps, raster data were prepared in GeoTIFF format and processed using FRAGSTATS 4.2, a software widely recognized in landscape ecology studies for the calculation of spatial metrics [35]. The landscape structure analysis considered different hierarchical levels—class, patch, and landscape—and the selected metrics described by McGarigal [36], as they represent robust and well-established indicators in the scientific literature for the evaluation of habitat fragmentation and spatial structure.
As highlighted by Cheung et al. [37], many available metrics exhibit interrelationships, making it essential to define clearly the research objectives and methodological approach to ensure a careful selection. In this context, the metrics adopted in this study considered their ecological relevance and suitability to the analyzed landscape. The selected metrics were organized into thematic categories: area and edge, shape, core area, aggregation, and diversity, as presented in Table 4, including the corresponding acronym, measurement unit, and a brief description of its ecological purpose.
Table 4.
Landscape Ecology Metrics used in this study.
Studies across different biomes have demonstrated that edge effects on vegetation structure tend to decrease substantially beyond approximately 100 m into the interior of patches. In the Brazilian semiarid region, as in tropical rainforests, microclimatic and structural attributes also stabilize at around this distance [38,39,40]. Classic reviews, such as Murcia [41], indicate that the depth of edge effects may vary between 50 and 300 m, depending on the ecological factor analyzed, but emphasize 100 m as a widely adopted intermediate value. Additionally, Harper et al. [42] quantified the magnitude and distance of edge influence across multiple ecological response categories and found an overall mean close to 100 m.
Based on this body of evidence, we adopted a depth of edge effects of 100 m in FRAGSTATS, a parameter that ensures the delineation of core areas relatively protected from external influences and facilitates comparison with studies carried out in other biomes.
The classification and interpretation of landscape metrics followed the ecological criteria commonly adopted in landscape studies, where increases in NP and ED indicate higher fragmentation, while reductions in LPI reflect the loss of cohesive vegetation patches. These directional interpretations are consistent with ecological responses of Caatinga vegetation to anthropogenic disturbance documented by Rito et al. [43] and Medeiros et al. [44]. Thus, rather than relying on fixed numerical thresholds, our assessment is based on consolidated ecological interpretations of how vegetation structure responds to disturbance in semi-arid environments.
2.6. Data Analysis
Calculations of NDVI, SAVI, NDWIveg, and LAI considered data organized in electronic spreadsheets, and data manipulation generated mean values of these indices for each season, year, and zone of Santa Luzia territory municipality. For the landscape metrics generated in FRAGSTATS, we calculated the following descriptive statistics: mean, standard deviation, minimum, maximum, and median, used in the identification of spatial and temporal patterns in landscape structure.
Spatial summaries organized in electronic spreadsheets allowed the construction of temporal profiles used in the identification of inter-annual and seasonal patterns. The processed datasets organized in graphs and tables provided a clear visualization of vegetation dynamics.
Finally, the application of the Principal Component Analysis (PCA) techniques, using pixel-level samples, helped to synthesize the main temporal and environmental gradients. A total of 100 spatially independent sampling points (n = 100), corresponding to 20 points per land use and land cover class. The non-vegetated class includes the areas occupied directly by the renewable energy complexes. For each point, vegetation index values were extracted for the dry and rainy seasons of the 2019–2024 period. PCA analysis considered each vegetation index (NDVI, SAVI, NDWIveg, and LAI) separately and under two complementary perspectives: differentiation among land use and land cover classes and seasons.
3. Results
3.1. Annual Precipitation
Rainfall in the municipality of Santa Luzia, Paraíba (Brazil) concentrates in the first months of the year, particularly between February and April, and March showed the highest annual level in each year from 2019 to 2024 (Figure 3).
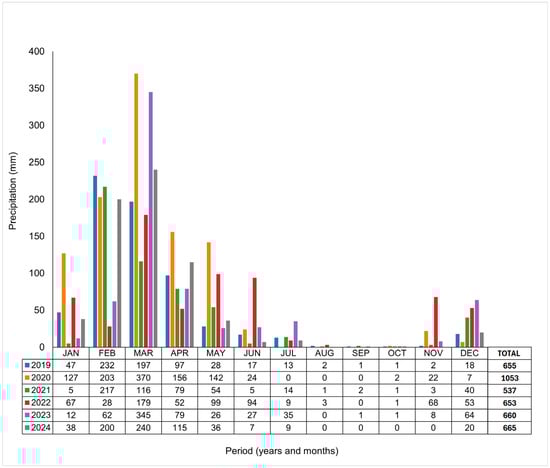
Figure 3.
Monthly Precipitation in the Municipality of Santa Luzia-PB.
In 2020 and 2023, March showed exceptionally high precipitation peaks (>350 mm). After May, rainfall declined, reaching near-zero values between July and October. This pattern clearly demonstrates the pronounced seasonality of the local rainfall regime (Figure 3).
3.2. Vegetation and Biophysical Indices
NDVI values (Figure 4) exhibited a clear seasonal pattern, with high values during wet periods and low values during dry periods, reflecting the strong dependence of the Caatinga vegetation on water availability.
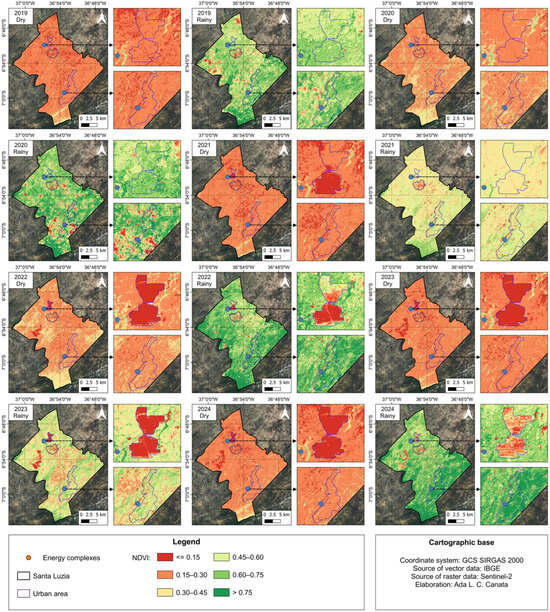
Figure 4.
Spatiotemporal maps (2019–2024) of the Normalized Difference Vegetation Index (NDVI) in the municipality of Santa Luzia-PB, Brazil [2].
During 2019 and 2020, vegetation cover was quite stable, with large areas exhibiting NDVI values between 0.40 and 0.60 during the wet season. In contrast, during the dry season, most of the area showed NDVI values below 0.30, a pattern consistent with the deciduous behavior of Caatinga vegetation, where leaf shedding and physiological dormancy are common responses to seasonal water limitation. As such, low NDVI values during the dry period primarily reflect phenological changes rather than structural alterations in vegetation cover.
This seasonal dynamic also appears in Figure 5a, which presents mean NDVI values for dry and wet periods between 2019 and 2024. While reduced NDVI during the dry season is expected, the progressive decline observed from 2021 onward, particularly during the wet season, when leaf flushing typically occurs, suggests a limitation in vegetation recovery beyond natural phenological cycles. This interannual pattern indicates that factors other than seasonal leaf loss, including land use change and anthropogenic disturbance, may be influencing vegetation vigor in the study area. The temporal correspondence between these spatial indicators and the decline in vegetation indices suggests additional human-related pressure acting alongside natural climatic controls.
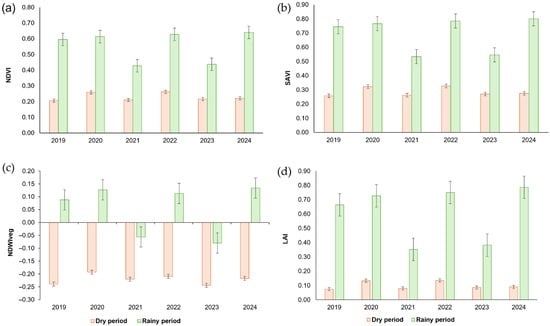
Figure 5.
Mean values of vegetation and biophysical indices during dry and wet periods in the municipality of Santa Luzia–PB, Brazil, from 2019 to 2024: (a) NDVI, (b) SAVI, (c) NDWIveg, and (d) LAI.
Spatially, the expansion of areas with NDVI values below 0.15 during the dry seasons of 2021 and 2023 suggests localized vegetation suppression or degradation, with low-NDVI patches increasingly concentrated around the renewable energy complexes. During the wet seasons of these years, large portions of the study area remained below NDVI values of 0.45, and in some central zones and areas adjacent to the solar and wind energy plants, values fell below 0.30, indicating reduced vegetation recovery even under favorable moisture conditions.
In contrast, the wet season of 2024 showed partial recovery, with extensive areas reaching NDVI values above 0.60, especially in regions farther from the energy complexes. Overall, the NDVI results demonstrate that, beyond the expected seasonal variability, vegetation vigor declined after 2021, with strong effects near the energy plants and during periods of water stress, suggesting an increasing sensitivity of vegetation to anthropogenic disturbance superimposed on climatic controls.
The SAVI results (Figure 6) exhibit a clear seasonal signal, with lower values during dry periods and higher values during rainy seasons, reflecting the sensitivity of vegetation cover to water availability and soil exposure in semi-arid environments. In 2019 and 2020, rainy-season SAVI values were predominantly above 0.50, indicating a homogeneous vegetative response, while dry-season values were generally ≤0.20, consistent with sparse vegetation and exposed soil.
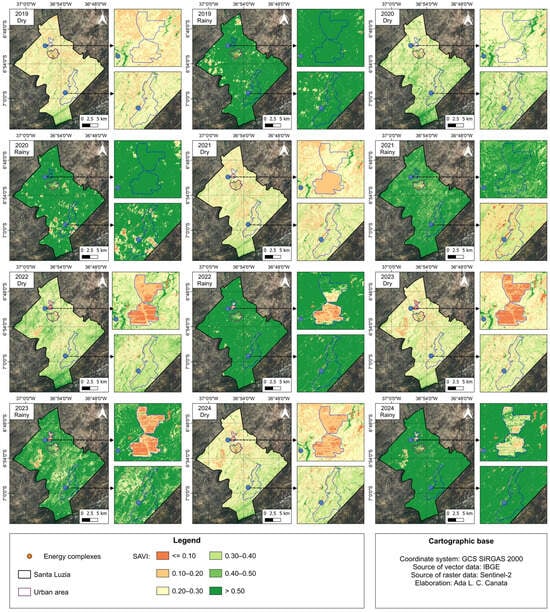
Figure 6.
Spatiotemporal maps (2019–2024) of the Soil-Adjusted Vegetation Index (SAVI) in the municipality of Santa Luzia-PB, Brazil [2].
From 2021 onward, SAVI values declined progressively (Figure 5b), particularly during the rainy seasons, suggesting reduced vegetation vigor beyond the expected reduction due to seasonal variability. Although 2021 coincided with the lowest precipitation of the series, low SAVI values (≤0.20) persisted near the energy complexes even during the rainy period, indicating localized constraints on vegetation cover potentially related to land use change and soil disturbance.
This pattern intensified in 2023, when extensive patches with SAVI values between 0.10 and 0.30 became concentrated around the energy complexes, especially during the dry season. In 2024, rainy-season SAVI values increased in less impacted areas (>0.50), while low-value patches persisted near the complexes, suggesting limited vegetation recovery in disturbed zones despite favorable rainfall conditions.
Overall, SAVI confirms the reduction in vegetation vigor in areas adjacent to the energy complexes, particularly during dry periods. Compared to NDVI, SAVI provided a more realistic representation of vegetation conditions in sparsely vegetated areas, highlighting soil influence and reinforcing its suitability for use in semi-arid environments.
The NDWIveg results (Figure 7) reveal a consistent seasonal pattern, with higher values during rainy periods and predominantly negative values during dry seasons, reflecting fluctuations in vegetation water content. Mean NDWIveg values during rainy periods peaked in 2020, 2022, and 2024, while dry-season values remained negative throughout the entire time series (Figure 5c), indicating persistent water limitation typical of the Caatinga biome.
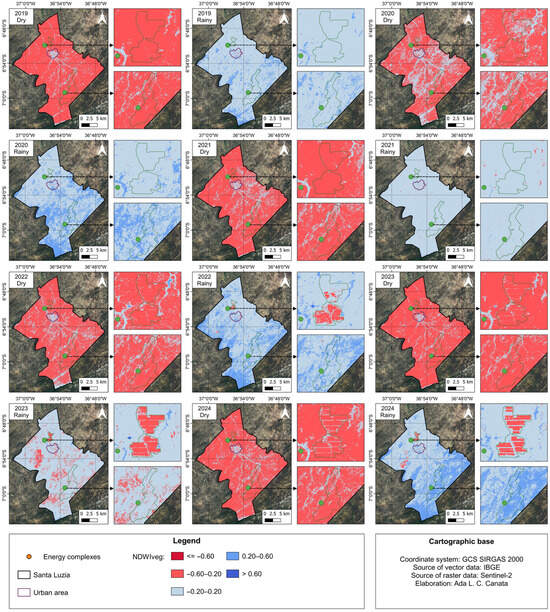
Figure 7.
Spatiotemporal maps (2019–2024) of the Normalized Difference Water Index (NDWIveg) in the municipality of Santa Luzia-PB, Brazil [2].
In 2019 and 2020, rainy periods showed a marked increase in vegetation moisture, with widespread positive NDWIveg values (0.20–0.60). However, from 2021 onward, rainy-season NDWIveg values declined substantially, remaining mostly between −0.20 and 0.20, suggesting a reduced vegetation moisture response to precipitation. This trend intensified in 2023, when negative or near-zero values predominated even during the rainy period, indicating less water absorbed by plants in the rainy season than in the same season of the previous years.
In 2024, partial recovery of vegetation moisture was observed in some sectors, but extensive areas—particularly those adjacent to the energy complexes—remained within low NDWIveg ranges (<0.20), supporting the presence of localized and recurrent moisture limitations in plant tissues.
The spatial coherence between areas of low NDWIveg and reduced NDVI reinforces the interpretation that declines in vegetation vigor occur at the same time as the decrease in canopy moisture, indicating that vegetation stress after 2021 reflects not only phenological variation but also constraints on water availability and plant recovery capacity in disturbed zones.
The Leaf Area Index (LAI) maps for the 2019–2024 period (Figure 8) show clear seasonal contrasts, with higher values during rainy periods and predominantly low values during dry seasons, reflecting expected variations in canopy density in semi-arid vegetation. In 2019 and 2020, rainy seasons were characterized by widespread LAI values ranging from 0.36 to >0.48, while dry periods were dominated by values ≤ 0.12, consistent with seasonal leaf loss in the Caatinga biome.
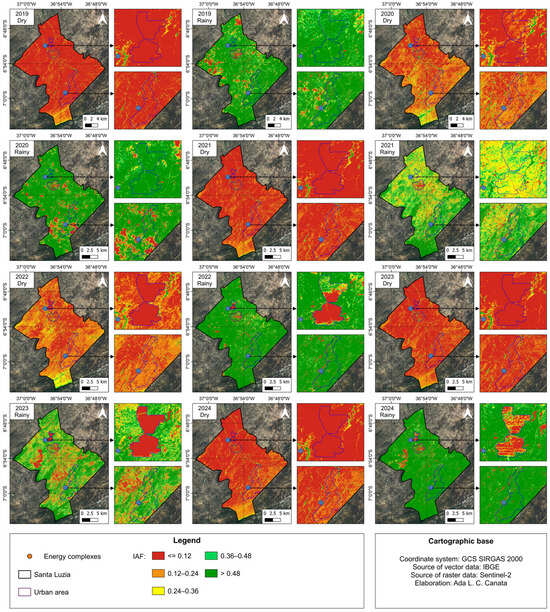
Figure 8.
Spatiotemporal maps (2019–2024) of the Leaf Area Index (LAI) in the municipality of Santa Luzia-PB, Brazil [2].
From 2021 onward, LAI values reduced markedly (Figure 5d), even in the rainy seasons, indicating a decline in canopy density beyond typical seasonal oscillations. This was notably true during the rainy season of 2023, when recovery of foliage densities was lower than that observed in the initial years of the series. In the dry seasons of 2022 and 2023, extensive areas exhibited very low LAI values (≤0.12), particularly in the surroundings of the energy complexes.
In 2024, low LAI values remained dominant during the dry season, with only partial recovery during the rainy period. Areas adjacent to the energy plants consistently exhibited lower LAI values compared to non-adjacent ones.
Overall, LAI results indicate a transition from high canopy density in the pre-installation period (2019–2020) to reduced LAI values scattered in many points of the area after 2021, reinforcing the pattern of declining vegetation structure detected by the different vegetation indices.
3.3. Dynamics of Vegetation Cover Using MapBiomas Brazil
Based on the dataset provided by MapBiomas Platform Collection 8.0, the land use and land cover classes in the study area changed over the 2019–2013 period (Figure 9).
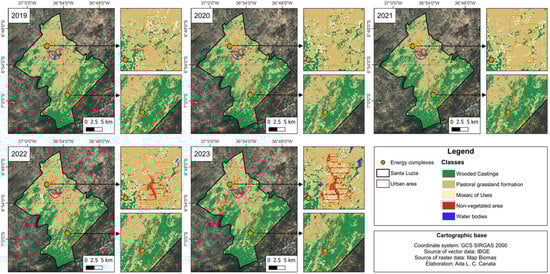
Figure 9.
Thematic classification of land use and land cover from MapBiomas (2019–2023) for the municipality of Santa Luzia–PB, Brazil [2,31].
Over the five-year period, spatial changes in the landscape concentrated mainly near the urban area of Santa Luzia town and the energy complexes, indicating continuous pressure on the remaining native vegetation. Quantitative data revealed not only the magnitude of these changes but also important trends in land use and land cover dynamics (Table 5).
Table 5.
Areas in hectares (ha) and percentage (%) of land use and cover classes in the municipality of Santa Luzia–PB.
The predominant vegetation formation in the municipality of Santa Luzia–PB is classified as Arboreal Steppe Savanna [35], referred to in this study as arboreal Caatinga, and, within the study area, may or may not be associated with palms, and shows no gallery forest. This phytophysiognomy is characterized by two distinct strata: the upper stratum, consisting of sparse shrub–tree vegetation, generally composed of grasses and small shrubs, which, although less dense and discontinuous, plays a significant structural role. This structural characterization provides a basis for understanding the vegetation’s response to environmental and anthropogenic pressures observed over the study period.
Arboreal Caatinga exhibited variations over the period, with signs of regeneration particularly in 2023. This regeneration process appears to be associated with higher water availability, suggesting that years with elevated precipitation favored herbaceous and arboreal regeneration, consistent with the structural capacity of the vegetation to recover under favorable hydrological conditions.
In contrast, the pasture class experienced a continuous decline, decreasing from 18,434.59 ha in 2019 to 15,151.22 ha in 2023, representing a loss of approximately 3283 ha. This reduction likely reflects conversion to more intensive anthropogenic uses, such as the establishment of energy complexes, and indicates significant modifications in land use structure, potentially affecting landscape connectivity.
The mosaic of class use fluctuated throughout the period, increasing in 2022 and decreasing in 2023, remaining below the 2019 level. This pattern suggests temporary shifts in land use practices, possibly associated with crop rotation or management adjustments.
Non-vegetated areas showed the most pronounced proportional increase, rising 148% from 562.21 ha in 2019 to 1397.55 ha in 2023. This expansion indicates intensification of anthropogenic activities, including infrastructure installation and vegetation clearance, highlighting direct pressures on the remaining fragments of arboreal Caatinga. Spatial analysis shows that the largest increases occurred near the energy complexes, reinforcing the influence of human activities on landscape transformation.
Water bodies exhibited minor fluctuations, with a slight reduction in 2022 followed by recovery in 2023, surpassing 2019 levels. The coincident increase in surface water and arboreal Caatinga in 2023 suggests that water availability plays a critical role in vegetation regeneration and maintenance, particularly in semi-arid ecosystems.
In years with high rainfall values, such as 2020 (1053 mm) and 2023 (660 mm) (Figure 2), there was also an increase in the water bodies class, indicating an increase in surface water availability. This hydrological increase may have contributed to raising soil moisture, creating favorable conditions for vegetation growth, particularly during the initial stages of ecological succession. This scenario occurred in 2023, when the expansion of water bodies coincided with the increase in the arboreal Caatinga class, suggesting that greater water retention favored herbaceous regeneration.
3.4. Exploratory Inference of Vegetation Indices on Land Use and Land Cover Dynamics
The Principal Component Analysis (PCA) applied to the NDVI, SAVI, NDWIveg, and LAI indices for the 2019–2024 period revealed consistent temporal and spatial patterns of variation. The first two components retained between 82.65% and 88.27% of the total 82.65% to 88.27% variability (Figure 10) of the dataset, demonstrating high representativeness of the model and confirming that the selected indices adequately capture the primary vegetation and moisture dynamics within the study area. This indicates that the first two components summarize most of the variability present in the dataset, facilitating interpretation of correlations and grouping of land cover types and seasonal conditions.
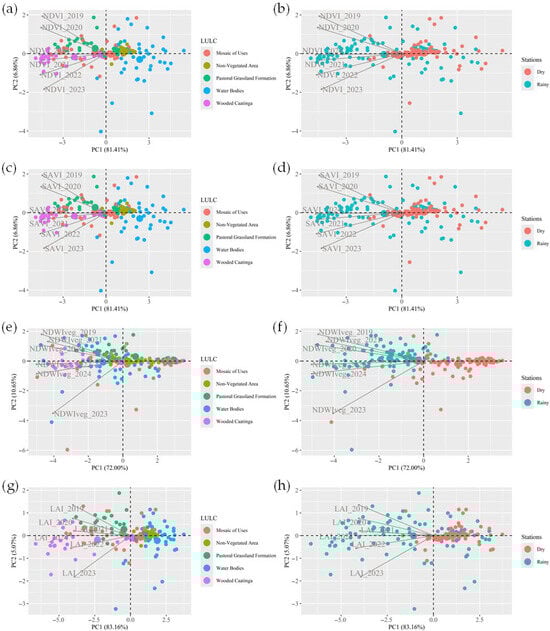
Figure 10.
Principal Component Analysis (PCA) for NDVI by land use and land cover (a), seasonal differentiation (b); SAVI by land use and land cover (c) and by season (d); NDWIveg by land use and land cover (e) and by season (f); LAI by land use and land cover (g) and by season (h), between 2019–2024 in the municipality of Santa Luzia–PB, Brazil.
For NDVI, the two components explained 86.27% of the total observed variability (Figure 10a), indicating a consistent representation of the data structure. For SAVI and NDWIveg, the cumulative variance reached 88.27% (Figure 10c) and 82.65% (Figure 10e), also demonstrating the PCA’s strong ability to summarize the original information by the first two PCA components. As for LAI, the first two PCA components retained 88.23% (Figure 10g) of the total variance, reflecting a high degree of correlation within the variables in the analyzed dataset.
In the present study, the explained variance ranging from 82.65% to 88.27% lies at an intermediate level, reflecting the sensitivity of vegetation and biophysical indices to seasonal fluctuations and precipitation variability, as well as the anthropogenic impacts associated with the installation of energy complexes in Santa Luzia–PB, Brazil.
To contextualize the temporal evolution of these indices and understand their relationship with anthropogenic processes, Table 6 presents a timeline correlating the stages of installation and operation of the solar and wind energy plants with the observed variations in environmental indices, highlighting the correspondence between the intensification of construction activities and the decline in vegetation and moisture indices.
Table 6.
Timeline of installation and operation of Solar Luiza and Chafariz Wind energy plants and observations on the environmental indices (NDVI, SAVI, NDWIveg, and LAI) between 2019–2024 in the municipality of Santa Luzia–PB, Brazil.
As observed in the principal components (PCs) characterizing the periods, the rainy season was particularly representative for differentiating the indices across years, showing that all indices (NDVI, SAVI, NDWIveg, and LAI) correlated positively with the rainy period. In other words, the rainy season allowed for greater differentiation among the indices than the dry season.
The PCA revealed two main temporal groupings across all indices. For NDVI and SAVI (Figure 10a,c), Group 1 (G1: 2019–2020) corresponded to years with more stable vegetation, associated with the Pastoral Grassland Formation, which exhibited consistent index values despite substantial differences in annual precipitation. Group 2 (G2: 2021–2024) reflects altered spatial patterns, with vectors clustering in the negative quadrant of PC1 and PC2, indicating areas with reduced vegetation cover or limited response to precipitation. The year 2023 stands out within G2 as the most extreme, suggesting cumulative impacts of anthropogenic pressure combined with low precipitation, while 2024 shows slight recovery or stabilization. G2 also displays a stronger association with the Arborized Caatinga and Mosaic classes, indicating that these land cover types had a significant effect on the spatial variation of indices during these years.
NDWIveg PCA (Figure 10e) showed similar temporal grouping, with G1 (2019–2021) representing years with relatively high moisture availability, and G2 (2022–2024) with reduced surface water content and possible vegetation degradation. In G2, 2023 presents the most negative and isolated vector, indicating critical conditions of moisture stress and likely soil exposure. The association of NDWIveg with Arborized Caatinga, Mosaic, and Water Bodies in G2 suggests that low precipitation, vegetation degradation, and increased anthropogenic activity, including energy complex operation, had an effect even on typically moist sites.
PCA of LAI (Figure 10d) further corroborated these patterns, separating the period into G1 (2019–2021), associated with higher foliar density in preserved or lightly managed areas, and G2 (2022–2024), marked by reduced leaf area, particularly in 2023. This pattern reflects both climatic limitations and intensified human activities that decreased foliar cover, especially in the native vegetation.
Across all indices, PCA results reveal a clear temporal transition corresponding to the pre- and post-construction phases of the energy complexes. This transition coincides with direct anthropogenic interventions—such as road construction, vegetation clearing, and infrastructure development—contributing to fragmentation of the natural landscape. The year 2023 emerges as the period of maximum impact, with the most isolated vectors across NDVI, SAVI, LAI, and NDWIveg, illustrating the cumulative effects of vegetation loss and moisture reduction under ongoing anthropogenic pressure.
3.5. Landscape Structure
3.5.1. Class Level
Our analyses considered the following metrics: Class Area (CA), Number of Patches (NP), Patch Density (PD), Largest Patch Index (LPI), Total Edge (TE), Edge Density (ED), Mean Shape Index (SHAPE_MN), Mean Fractal Dimension (FRAC_MN), and Total Core Area (TCA), corresponding to the area and edge, shape, core area, and aggregation categories. Table 7 summarizes the main results by land cover class over the analyzed period.
Table 7.
Class-Level Metrics for Arboreal Caatinga from 2019 to 2024 in the municipality of Santa Luzia, Paraíba (PB).
The Arboreal Caatinga exhibited a progressive increase in area, expanding from 19,947.79 ha in 2019 to 22,683.02 ha in 2023, according to the Class Area (CA) metric (Table 7). Despite this expansion, the Number of Patches (NP) fluctuated slightly between 2019 and 2022, remaining around 3700, before decreasing to 3492 in 2023. This reduction suggests either the merging of previously isolated patches through natural regeneration or improved connectivity, or the loss of very small fragments. Patch Density (PD) declined from 3.68 to 3.36 patches per 100 ha over the same period, indicating a landscape characterized by fewer, but potentially larger and more connected patches.
The Largest Patch Index (LPI) increased from 13.55% in 2019 to 15.73% in 2023, reflecting a growing dominance of a single patch within the class. Conversely, Total Edge (TE) decreased from 3,710,329 m to 3,596,456 m, and Edge Density (ED) declined from 35.74 to 34.65 m/ha, suggesting reduced peripheral fragmentation and greater compactness of patches. The Mean Shape Index (SHAPE_MN) of 1.28 indicates moderately irregular patch forms, while the Mean Fractal Dimension (FRAC_MN) of 1.05 reflects relatively simple and smooth edges. These patterns suggest intermediate edge effects and potentially lower ecological vulnerability compared to highly fragmented landscapes. The Total Core Area (TCA) increased substantially, from 5218.77 ha to 7218.51 ha, implying better preservation of patch interiors and reduced exposure to external disturbances.
The Pastoral Grassland Formation, representing native herbaceous-shrub vegetation under extensive grazing, exhibited marked changes in the studied period (Table 8). The class area (CA) decreased from 18,432.95 ha to 15,149.87 ha, signaling a reduction in vegetation cover. In contrast, the number of patches (NP) increased from 3437 to 4032, and Patch Density (PD) rose from 3.31 to 3.88 patches per 100 ha, reflecting enhanced spatial fragmentation. The Largest Patch Index (LPI) decreased from 12.06% to 5.81%, indicating both a decline in dominant patches and intensified fragmentation. Total Edge (TE) and Edge Density (ED) remained relatively stable, suggesting persistent exposure of vegetation to edge effects. Shape metrics (SHAPE_MN and FRAC_MN) remained nearly constant, with SHAPE_MN between 1.39 and 1.42 and FRAC_MN between 1.07 and 1.08, indicating maintenance of peripheral complexity despite fragmentation increase. The Total Core Area (TCA) decreased sharply from 3045.60 ha to 1396.41 ha, revealing substantial loss of protected interior areas.
Table 8.
Class-level metrics for the Pastoral Grassland Formation between 2019–2024 in the municipality of Santa Luzia–PB, Brazil.
The Land Use Mosaic class displayed irregular variations over the period (Table 9). The class area (CA) decreased from 5026.69 ha to 4731.32 ha. NP remained relatively stable (13,482–15,888), while PD fluctuated slightly (12.99–15.31 patches per 100 ha), highlighting a highly fragmented and spatially dispersed landscape. Shape metrics (SHAPE_MN and FRAC_MN) exceeded 1.4, reflecting irregularly shaped patches. Total Core Area (TCA) remained virtually null, indicating that these patches are narrow, peripheral, and lack preserved cores, limiting their ecological stability.
Table 9.
Class-level Metrics for the Land Use Mosaic from 2019 to 2024 in the municipality of Santa Luzia–PB, Brazil.
Non-Vegetated Areas exhibited marked expansion, from 562.16 ha in 2019 to 1396.58 ha in 2023 (Table 10), directly linked to anthropogenic activities associated with the energy complex installation, including vegetation removal and infrastructure development. NP increased from 863 to 1541 and PD from 0.83 to 1.48 patches per 100 ha, demonstrating that the expansion occurred in a dispersed and disconnected way. LPI remained very low, confirming the absence of large continuous patches, while TCA remained minimal, reinforcing the lack of stable core areas. Collectively, these metrics indicate active fragmentation and replacement of native vegetation, spatially and temporally associated with wind and solar energy plants.
Table 10.
Class-Level Metrics for Non-Vegetated Areas in the Caatinga from 2019 to 2024 in the municipality of Santa Luzia–PB, Brazil.
Water Bodies showed significant variation consistent with regional rainfall patterns (Table 11). Total area (CA) ranged from 125.47 ha in 2019 to 131.59 ha in 2023, with a sharp reduction in 2022 (72.36 ha), coinciding with a 1500 ha decrease in Arborized Caatinga (Table 7). NP followed a similar trend, decreasing in 2022 and recovering in 2023. LPI remained low, indicating the absence of dominant water bodies, while Edge Density (ED) remained minimal (0.34–0.54 m/ha). TCA decreased sharply from 12.50 ha to 0.01 ha, revealing that virtually no core areas remain protected from edge effects. These results suggest increasing vulnerability of aquatic systems, likely driven by vegetation cover changes influencing regional hydrology.
Table 11.
Class-Level Metrics for Non-Vegetated Areas in the Caatinga from 2019 to 2024 in the municipality of Santa Luzia–PB.
3.5.2. Fragment-Level Analysis
Fragment-level metrics considered three statistical descriptors for each metric: mean, standard deviation, and maximum for NCORE (Number of Core Areas), and mean, median, and standard deviation for ENN (Euclidean Nearest Neighbor Distance). This approach highlights overall trends, variability among fragments, and the presence of extreme or representative values.
The NCORE metric (Table 12), representing core areas excluding edge zones, revealed consistently low mean values for the Arborized Caatinga during the study period, indicating that most Arborized Caatinga fragments contain few or no core areas and are therefore highly vulnerable to edge effects and external disturbances. Maximum NCORE values peaked in some years (up to 499 cores in 2021), corresponding to a single large fragment exceeding 14,000 ha. The exclusion of this outlier fragment allowed for a more accurate representation of the general fragment distribution. The retention of maximum values in the table highlights the occasional presence of large fragments with multiple core areas, even if they do not represent the predominant landscape pattern.
Table 12.
Fragment-Level Metrics: Number of Core Areas (NCORE), from 2019 to 2024, in the municipality of Santa Luzia–PB, Brazil.
For the Pasture-Grassland Formation class, NCORE values were also consistently low (0.11–0.16), reflecting limited core areas within most fragments and high ecological vulnerability. Atypical fragments with unusually high numbers of cores inflated the standard deviation, and their exclusion improved the representation of the structural fragility of the majority of fragments. The observed decrease in maximum NCORE values over time (from 421 to 254) further indicates a reduction in well-preserved cores, emphasizing the degradation risk of the Pasture-Grassland Formation class.
The NCORE metric values did not provide meaningful interpretative values for the Mosaic of Uses, Non-Vegetated Area, and Water Bodies classes, as both mean and maximum values were virtually null, and for that reason, lack a detailed discussion.
The ENN metric for the Arborized Caatinga class (Table 13) remained relatively stable in the 2019–2024 period, with mean values ranging from 53.82 m to 57.34 m, and a constant median value of 40.96 m. Standard deviation ranged from 33.46 to 40.84 m, reflecting some variability in fragment spacing. These results suggest that, despite ongoing fragmentation, isolation levels of Arborized Caatinga fragments did not increase, maintaining moderate proximity that may support functional connectivity over time.
Table 13.
Fragment-Level Metrics: Euclidean Nearest Neighbor Distance (ENN) from 2019 to 2024 in the municipality of Santa Luzia-PB, Brazil.
For the Pasture-Grassland Formation, ENN mean values also remained stable (53.06–55.79 m range), with slight fluctuations in the median (39.74–40.96 m) and high standard deviation (44.89–51.37 m), indicating greater variability in isolation among fragments. This pattern reflects the impact of anthropogenic pressures on native herbaceous vegetation, as extensive grazing and land conversion disrupt connectivity between remaining patches.
ENN values for the Mosaic of Uses, Non-Vegetated Area, and Water Bodies classes exhibited wide variability and extremely high standard deviations—exceeding 1000 m for water bodies—highlighting highly irregular spatial dispersion. Thus, the ecological relevance of ENN is limited when associated with highly variable data, and we provided no further interpretation.
3.5.3. Landscape Level
The Shannon Diversity Index (SHDI), which is exclusive to the landscape level (Figure 11), displayed slight variations throughout the analyzed period, increasing from 1.04 in 2019 to 1.08 in 2023. The lowest values were observed in 2020 (1.01) and 2021 (1.02), followed by a gradual increase in subsequent years.
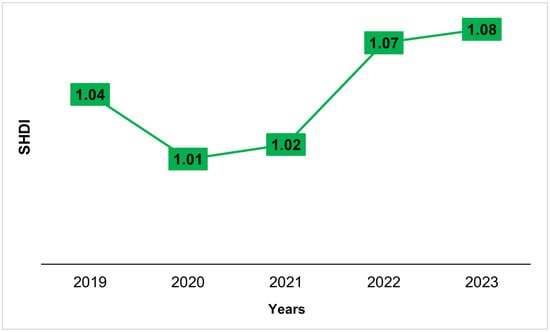
Figure 11.
Landscape-Level Metric from 2019 to 2023 in the municipality of Santa Luzia-PB.
4. Discussion
The vegetation dynamics observed in the study area reflect the combined influence of climatic seasonality typical of the Caatinga biome and anthropogenic disturbances associated with land use change. The rainfall regime of the Northeastern Brazilian semiarid region, characterized by high interannual variability and strong seasonality, provides the climatic background for interpreting temporal patterns in vegetation indices, land use classes, and landscape structure [45]. As expected for this biome, vegetation greenness increases during the rainy season and declines sharply during the dry period due to water limitation and seasonal leaf shedding.
The seasonal behavior of NDVI observed in this study is consistent with previous findings for the Caatinga. In this biome, rapid leaf emission during the wet season leads to higher index values, followed by leaf shedding and marked decline in NDVI values during the prolonged dry periods [46]. These patterns confirm the strong dependence of vegetation vigor on precipitation and reinforce the suitability of chlorophyll-sensitive indices as indicators of water stress in semi-arid environments. However, beyond this expected seasonal signal, important interannual deviations were detected.
In particular, the reduced vegetation vigor observed in 2021 and 2023, including lower NDVI values even during the rainy season, suggests limitations in vegetation recovery caused by factors other than climatic variability. Similar anomalies occur in disturbed Caatinga landscapes, where anthropogenic pressures such as vegetation clearing, infrastructure expansion, and fragmentation constrain physiological responses and delay post-rainfall recovery of the vegetation [47]. The temporal coincidence between these anomalies and the installation phases of the Luzia Solar and Chafariz Wind plants points to an additional anthropogenic pressure operating alongside natural climatic controls.
The combined use of NDVI, SAVI, NDWIveg, and LAI indices proved effective in capturing complementary aspects of vegetation condition. NDVI and SAVI detected variations in green biomass and soil background effects, particularly in sparsely vegetated semi-arid environments [48,49]. NDWIveg highlighted changes in canopy moisture and vegetation water status, which are critical for interpreting vegetation stress under prolonged dry conditions [50], while LAI provided structural information related to leaf area and canopy density [51]. These indices, in association with modeling techniques, are effective in detecting vegetation degradation and forage biomass dynamics in the Caatinga biome. The consistent post-2021 decline observed across all indices suggests a systematic reduction in vegetation vigor rather than isolated short-term climatic fluctuations, strengthening the interpretation of cumulative landscape stress by means of the joint use of the vegetation indices.
Ground clearing and soil exposure typically reduce biomass and canopy moisture, and anthropogenic disturbances in Caatinga environments intensify landscape fragmentation processes [43,44]. Studies conducted in different Caatinga regions documented similar fragmentation patterns, including increased patch isolation, reduced core areas, and loss of landscape connectivity under land use pressure [52,53].
Beyond the spectral responses captured by NDVI, SAVI, NDWIveg, and LAI, these vegetation changes indicated shifts in land use and land cover classes. The analysis of MapBiomas data reveals that the two-layered structure of the arboreal Caatinga partially explains the increase observed in this class between 2022 and 2023. Considering the increase in precipitation during this period, it is likely that the herbaceous stratum responded rapidly to enhanced soil moisture through germination, intense sprouting, and leaf renewal, a typical seasonal phenological response of the Caatinga vegetation. Even at low density, the intensification of this lower stratum is detectable by remote sensing, contributing to the expansion of areas classified as native vegetation.
Multivariate analysis reinforced this interpretation by clearly separating pre-installation years from the period following project installation. The proportion of variance explained by the first principal components was comparable to or higher than values reported in previous studies applying PCA to vegetation and moisture-related indices in seasonally dry tropical ecosystems, indicating a robust representation of dominant environmental gradients. Similar to findings reported for Caatinga and other Seasonally Dry Tropical Forests, the ordination patterns highlight stronger vegetation–climate coupling during the rainy season and greater sensitivity of spectral indices to interannual variability under disturbance conditions [54]. The separation observed for the 2019–2020 and 2021–2024 periods corroborated patterns reported in the literature for landscapes subject to cumulative climatic stress and land use pressure [55].
Importantly, the analysis considers the municipal scale and does not attempt to statistically isolate individual factors; rather, it captures cumulative landscape responses over time. This cumulative-response framework is consistent with studies showing that land use change, land cover changes and surface modifications alter soil moisture dynamics and intensify anthropogenic pressure gradients detectable through spatial and multivariate analyses in the Brazilian semi-arid region [56,57,58], a pattern also reported in regions affected by wind energy plants and associated infrastructure expansion.
Although some of these effects may persist during the operational phase, the present study focuses specifically on impacts associated with the installation phase of the energy complex. Recent studies demonstrated that wind energy infrastructure can induce localized but measurable changes in vegetation structure, vigor, and community composition, particularly in areas adjacent to turbines and access roads. Remote sensing analyses have identified reductions in vegetation indices and microclimatic alterations associated with wind farms [59], while field-based and landscape-scale studies report declines in plant diversity, vegetation convergence, and differential responses among vegetation types near wind plants [12,13,60]. The patterns observed in the present study are consistent with this body of evidence and temporally overlap with the installation of the Luzia Solar and Chafariz Wind complex.
In the present study, the decline in vegetation indices and the increase in landscape fragmentation coincide temporally with the installation phase of the Luzia Solar and Chafariz Wind complex. Rather than demonstrating direct causation, these results indicate a coherent temporal association between large-scale infrastructure development and detectable landscape-level responses.
Although previous studies in the region have reported environmental disturbances associated with the installation of wind farms—such as those documented in the Médio Sertão Territory of Paraíba, Brazil [5]—these assessments primarily focus on socioeconomic or general environmental dimensions rather than quantifying vegetation responses. To the best of our knowledge, no study has previously evaluated changes in vegetation vigor or moisture using spectral vegetation indices or landscape metrics within the direct influence on the adjacent areas of these renewable energy plants in this region. In this sense, the results presented here constitute the first evidence based on remote sensing indicators to explicitly link anthropogenic pressure and vegetation dynamics in Santa Luzia–PB, Brazil.
Some limitations of this study are evident. The relatively short temporal series (2019–2024), with only two years representing pre-installation conditions, restricts the application of formal trend analysis techniques such as Mann–Kendall tests or Sen’s slope estimators. In addition, the strong climatic control exerted by precipitation in the Caatinga biome limits the full separation of climate-driven variability from anthropogenic disturbances. Accordingly, the findings should be interpreted as evidence of cumulative landscape responses during the installation phase, rather than as isolated impacts attributable to specific factors or operational phases of solar or wind plants.
Despite these constraints, the integrated use of vegetation indices, land use data, and landscape metrics provides a robust characterization of the spatial expression and magnitude of landscape change associated with large-scale renewable energy projects in the semi-arid region. Future studies incorporating longer time series, explicit climatic controls, spatial buffer analyses, and formal trend detection methods will be essential to disentangle construction and operational effects and to refine impact assessments in Caatinga ecosystems.
5. Conclusions
The results of this study indicate that relevant spatiotemporal changes in vegetation cover and landscape structure occurred in the study area during the installation phase of the Luzia Solar and Chafariz Wind complex, with impacts being particularly pronounced in 2021. Vegetation indices revealed measurable declines in vegetation vigor, moisture, and leaf density, suggesting increased environmental stress during both dry and wet seasons. In the most affected year (2023), dry-season NDVI values decreased to below 0.15, while SAVI values declined to ≤0.20, indicating reduced vegetation cover and increased soil exposure. NDWIveg values shifted from predominantly positive conditions (up to 0.13) to near-zero or negative values, reflecting intensified vegetation water stress. LAI values exhibited marked interannual variability, reaching higher values during the 2024 rainy season (~0.79 m2 m−2) but showing pronounced reductions during the rainy seasons of 2021 and 2023 (approximately 0.35 m2 m−2). During dry periods, LAI values consistently remained ≤0.15 m2 m−2, indicating persistent seasonal canopy limitation.
Land use and land cover analysis showed a reduction in Pasture–Grassland formations from 41.80% (18,434.59 ha) in 2019 to 34.36% (15,151.22 ha) in 2023, representing a loss of more than 3200 ha, while non-vegetated areas expanded by approximately 148%, increasing from 562.21 ha to 1397.55 ha. Arborized Caatinga exhibited a slight increase in 2023, suggesting localized and possibly transient successional or phenological responses.
Landscape metrics further indicated structural changes consistent with increased fragmentation, with patch density rising from 3.31 to 3.88 patches per 100 ha and total core area decreasing from 3045.60 ha to 1395.01 ha, pointing to reduced habitat connectivity at the municipal scale.
Taken together, these spectral, land use, and landscape-level indicators indicate that the installation phase of the energy complex was directly associated with measurable alterations in Caatinga vegetation structure and spatial organization within the study area. The combined analysis of vegetation indices and landscape metrics allowed a more rigorous and sensitive assessment of geospatial surface modifications than the use of spectral indices alone, capturing not only changes in vegetation vigor but also structural fragmentation and connectivity loss at the landscape scale. Although the analytical framework does not allow for the statistical isolation of individual factors, the temporal correspondence between vegetation decline, land use change, and infrastructure installation supports the interpretation of integrated landscape responses during the construction phase rather than operational effects or definitive causal attribution.
Finally, the integrated methodological framework adopted in this study demonstrates the usefulness of combining open-access satellite data, vegetation indices, and landscape metrics for monitoring landscape changes in semi-arid regions. Despite limitations related to the relatively short time series, climatic control, and index sensitivity to soil background and canopy density, the approach is transferable to other regions affected by renewable energy development and provides a robust basis for future studies incorporating longer datasets, explicit climatic controls, spatial buffer analyses, and formal trend detection methods.
Author Contributions
Conceptualization, A.L.C.C., R.d.S.G., I.A.B., M.M.d.L.P., A.P.L., M.B.F. and M.V.d.S.; Data curation, A.L.C.C., E.S.d.S. and M.V.d.S.; Formal analysis, A.L.C.C., R.d.S.G., I.A.B., L.d.M.M., O.A.B., A.P.L., E.S.d.S. and M.V.d.S.; Funding acquisition, M.B.F., N.A.F.M. and M.V.d.S.; Investigation, A.L.C.C., R.d.S.G., L.d.M.M. and M.V.d.S.; Methodology, A.L.C.C., R.d.S.G., I.A.B., L.d.M.M., M.M.d.L.P., A.P.L., M.B.F., E.S.d.S., N.A.F.M. and M.V.d.S.; Project administration, I.A.B. and M.V.d.S.; Resources, I.A.B., O.A.B., M.B.F., N.A.F.M. and M.V.d.S.; Software, A.L.C.C., R.d.S.G., L.d.M.M. and M.V.d.S.; Supervision, I.A.B. and M.V.d.S.; Validation, A.L.C.C., R.d.S.G., O.A.B. and M.V.d.S.; Visualization, A.L.C.C., R.d.S.G., I.A.B., L.d.M.M., O.A.B., M.M.d.L.P., A.P.L., M.B.F., E.S.d.S., N.A.F.M. and M.V.d.S.; Writing—original draft, A.L.C.C., I.A.B., L.d.M.M., O.A.B., M.M.d.L.P., A.P.L. and M.B.F.; Writing—review & editing, A.L.C.C., R.d.S.G., I.A.B., L.d.M.M., O.A.B., M.M.d.L.P., A.P.L., M.B.F., E.S.d.S., N.A.F.M. and M.V.d.S. All authors have read and agreed to the published version of the manuscript.
Funding
This research received no external funding.
Data Availability Statement
The data used in this research were obtained from the Google Earth Engine platform, available at the following link: https://code.earthengine.google.com (accessed on 25 May 2024).
Acknowledgments
The authors would like to express their gratitude to the Graduate Program in Forest Sciences at the Federal University of Campina Grande (UFCG), Patos Campus–PB, Brazil, for the academic and institutional support provided during the development of this study.
Conflicts of Interest
The authors declare no conflicts of interest.
References
- INSA O Semiárido Brasileiro. Available online: https://www.gov.br/insa/pt-br/semiarido-brasileiro (accessed on 5 April 2024).
- IBGE Semiárido Brasileiro. Available online: https://www.ibge.gov.br/geociencias/cartas-e-mapas/mapas-regionais/15974-semiarido-brasileiro.html?=&t=o-que-e (accessed on 6 May 2024).
- Paredes-Trejo, F.; Barbosa, H.A.; Daldegan, G.A.; Teich, I.; García, C.L.; Kumar, T.V.L.; Buriti, C.d.O. Impact of Drought on Land Productivity and Degradation in the Brazilian Semiarid Region. Land 2023, 12, 954. [Google Scholar] [CrossRef]
- Nascimento, G.V.S.; Ribeiro, E.P. Variabilidade Espaço-Temporal Da Precipitação Na Bacia Hidrográfica Do Rio Moxotó. Rev. GeoUECE 2023, 12, e2023006. [Google Scholar] [CrossRef]
- Santos, A.A.M.; Morais, L.A.; Carvalho, E.F.; Batista, C.C.R. Socioeconomic and Environmental Impacts of Wind Parks in a Municipality of the Médio Sertão Territory of Paraíba. Res. Soc. Dev. 2022, 11, e7311225561. [Google Scholar] [CrossRef]
- Silva, J.M.C.; Lacher, T.E. Caatinga—South America. In Encyclopedia of the World’s Biomes; Elsevier: Amsterdam, The Netherlands, 2020; pp. 554–561. [Google Scholar]
- Jardim, A.M.d.R.F.; Júnior, G.D.N.A.; da Silva, M.V.; dos Santos, A.; da Silva, J.L.B.; Pandorfi, H.; de Oliveira-Júnior, J.F.; Teixeira, A.H.d.C.; Teodoro, P.E.; de Lima, J.L.M.P.; et al. Using Remote Sensing to Quantify the Joint Effects of Climate and Land Use/Land Cover Changes on the Caatinga Biome of Northeast Brazilian. Remote Sens. 2022, 14, 1911. [Google Scholar] [CrossRef]
- Abeeólica, A.B. Boletim Annual. Available online: https://abeeolica.org.br/wp-content/uploads/2022/04/PT_Boletim-Anual-de-Geracao_2020.pdf (accessed on 28 April 2024).
- Almeida, H.A.; Almeida, E.C.V. Potencial Da Energia Solar Fotovoltaica No Semiárido Nordestino. Concilium 2022, 22, 197–210. [Google Scholar] [CrossRef]
- Leite, A.C.C.; Picchi, L. Os Impactos Socioambientais Resultantes Da Implantação e Operação Dos Parques Eólicos No Estado Da Paraíba. RP3-Rev. Pesqui. Políticas Públicas 2019, 1. [Google Scholar]
- da Silva, N.S. Os Impactos Ambientais Decorrentes Da Implantação Dos Parques Eólicos Volta Do Rio (Acaraú) e Cajucoco (Itarema) No Litoral Cearense. Rev. Geociências Nordeste 2016, 2, 1336–1346. [Google Scholar] [CrossRef]
- Zhao, X.; Li, F.; Yuan, Y.; Ari, G.; Yan, Y.; Zhang, Q.; Olhnuud, A.; Liu, P. Wind Farms Reduce Grassland Plant Community Diversity and Lead to Plant Community Convergence. BMC Ecol. Evol. 2025, 25, 10. [Google Scholar] [CrossRef]
- Pătru-Stupariu, I.; Calotă, A.M.; Santonja, M.; Anastasiu, P.; Stoicescu, I.; Biriş, I.A.; Stupariu, M.S.; Buttler, A. Do Wind Turbines Impact Plant Community Properties in Mountain Region? Biologia 2019, 74, 1613–1619. [Google Scholar] [CrossRef]
- Renewables 2014 Global Status Report; REN21 Secretariat: Paris, France, 2014; Available online: https://www.ren21.net/wp-content/uploads/2019/05/GSR2014_Full-Report_English.pdf (accessed on 20 February 2026).
- Braz, A.M.; Águas, T.A.; Garcia, P.H.M. Análise De Índices De Vegetação Ndvi E Savi E Índice De Área Folear (Iaf) Para A Comparação Da Cobertura Vegetal Na Bacia Hidrográfica Do Córrego Ribeirãozinho, Município De Selvíria—Ms. Rev. Percurso 2015, 7, 5–22. [Google Scholar] [CrossRef]
- Oliveira Junior, I.; Pereira, A.J. Índice de Vegetação e Dinâmica Ambiental Das Caatingas: A Susceptibilidade Ambiental à Desertificação Em Canudos-BA. Geogr. Ensino Pesqui. 2025, 29, e87806. [Google Scholar] [CrossRef]
- Salazar, A.A.; Arellano, E.C.; Muñoz-Sáez, A.; Miranda, M.D.; Oliveira da Silva, F.; Zielonka, N.B.; Crowther, L.P.; Silva-Ferreira, V.; Oliveira-Reboucas, P.; Dicks, L.V. Restoration and Conservation of Priority Areas of Caatinga’s Semi-Arid Forest Remnants Can Support Connectivity within an Agricultural Landscape. Land 2021, 10, 550. [Google Scholar] [CrossRef]
- Mohammed, I. The Application of Remote Sensing (RS) Technology in Renewable Energy Development: A Review; SSRN: Amsterdam, The Netherlands, 2017. [Google Scholar] [CrossRef]
- Alvares, C.A.; Stape, J.L.; Sentelhas, P.C.; Gonçalves, J.L.M.; Sparovek, G. Köppen’s Climate Classification Map for Brazil. Meteorol. Z. 2013, 22, 711–728. [Google Scholar] [CrossRef]
- Beck, H.E.; Zimmermann, N.E.; McVicar, T.R.; Vergopolan, N.; Berg, A.; Wood, E.F. Present and Future Köppen-Geiger Climate Classification Maps at 1-Km Resolution. Sci. Data 2018, 5, 180214. [Google Scholar] [CrossRef]
- INMET. Normais Climatológicas do Brasil. Available online: https://portal.inmet.gov.br/normais (accessed on 5 March 2024).
- MAPBIOMAS BRAZIL. Plataforma de Mapas e Dados. Available online: https://brasil.mapbiomas.org/ (accessed on 25 March 2024).
- Filgueiras, R.; Venancio, L.P.; Aleman, C.C.; da Cunha, F.F. Comparison and Calibration of Terraclimate Climatological Variables over the Brazilian Territory. J. S. Am. Earth Sci. 2022, 117, 103882. [Google Scholar] [CrossRef]
- Iberdrola. Neoenergia. Available online: https://www.neoenergia.com/ (accessed on 5 February 2024).
- Huete, A.R. A Soil-Adjusted Vegetation Index (SAVI). Remote Sens. Environ. 1988, 25, 295–309. [Google Scholar] [CrossRef]
- da Silva, L.G.; Galvíncio, J.D. Comparative Analysis of Changes in NDVI and SAVI in PELD—22—Petrolina—PE, in the First Decade of the XXI Century. Rev. Bras. Geogr. Física 2013, 5, 1446–1456. [Google Scholar]
- Gao, B. NDWI—A Normalized Difference Water Index for Remote Sensing of Vegetation Liquid Water from Space. Remote Sens. Environ. 1996, 58, 257–266. [Google Scholar] [CrossRef]
- Allen, R.G.; Bastiaanssen, W.; Waters, R.; Tasumi, M.; Trezza, R. Surface Energy Balance Algorithms for Land (SEBAL): Idaho Implementation—Advanced Training and Users Manual; Version 1. Available online: https://posmet.ufv.br/wp-content/uploads/2017/04/MET-479-Waters-et-al-SEBAL.pdf (accessed on 12 April 2024).
- Rouse, J.W., Jr.; Haas, R.H.; Schell, J.A.; Deering, D.W. Monitoring the Vernal Advancement and Retrogradation (Green Wave Effect) of Natural Vegetation; Remote Sensing Center, Texas A&M University: College Station, TX, USA, 1973; Volume 1. [Google Scholar]
- Gorelick, N.; Hancher, M.; Dixon, M.; Ilyushchenko, S.; Thau, D.; Moore, R. Google Earth Engine: Planetary-Scale Geospatial Analysis for Everyone. Remote Sens. Environ. 2017, 202, 18–27. [Google Scholar] [CrossRef]
- da Silva, M.V.; Pandorfi, H.; de Oliveira-Júnior, J.F.; da Silva, J.L.B.; de Almeida, G.L.P.; Montenegro, A.A.d.A.; Mesquita, M.; Ferreira, M.B.; Santana, T.C.; Marinho, G.T.B.; et al. Remote Sensing Techniques via Google Earth Engine for Land Degradation Assessment in the Brazilian Semiarid Region, Brazil. J. S. Am. Earth Sci. 2022, 120, 104061. [Google Scholar] [CrossRef]
- Neteler, M.; Bowman, M.H.; Landa, M.; Metz, M. GRASS GIS: A Multi-Purpose Open Source GIS. Environ. Model. Softw. 2012, 31, 124–130. [Google Scholar] [CrossRef]
- QGIS Development Team. QGIS Geographic Information System, version 3.34.5. free/open-source GIS software. QGIS Organization: Laax, Switzerland, 2024.
- IBGE. Manual Técnico da Vegetação Brasileira, 2nd ed.; IBGE: Rio de Janeiro, Brazil, 2012; 271p, Available online: https://uc.socioambiental.org/sites/uc/files/2019-12/liv63011.pdf (accessed on 9 June 2025).
- Turner, M.G.; Gardner, R.H. Landscape Ecology in Theory and Practice; Springer: New York, NY, USA, 2015; Volume 2. [Google Scholar]
- Mcgarical, K. Fragstats Help; University of Massachusetts: Amherst, MA, USA, 2015; 182p. [Google Scholar]
- Cheung, A.K.L.; Brierley, G.; O’Sullivan, D. Landscape Structure and Dynamics on the Qinghai-Tibetan Plateau. Ecol. Modell. 2016, 339, 7–22. [Google Scholar] [CrossRef]
- Laurance, W.F.; Lovejoy, T.E.; Vasconcelos, H.L.; Bruna, E.M.; Didham, R.K.; Stouffer, P.C.; Gascon, C.; Bierregaard, R.O.; Laurance, S.G.; Sampaio, E. Ecosystem Decay of Amazonian Forest Fragments: A 22-Year Investigation. Conserv. Biol. 2002, 16, 605–618. [Google Scholar] [CrossRef]
- Alves, F.T., Jr.; Brandão, C.F.L.S.; Rocha, K.D.; Marangon, L.C.; Ferreira, R.L.C. Efeito de Borda Na Estrutura de Espécies Arbóreas Em Um Fragmento de Floresta Ombrófila Densa, Recife, PE. Rev. Bras. Ciências Agrárias—Braz. J. Agric. Sci. 2006, 1, 49–56. [Google Scholar] [CrossRef]
- Oliveira, J.R.P.M.; Pôrto, K.C.; Silva, M.P.P. Richness Preservation in a Fragmented Landscape: A Study of Epiphytic Bryophytes in an Atlantic Forest Remnant in Northeast Brazil. J. Bryol. 2011, 33, 279–290. [Google Scholar] [CrossRef]
- Murcia, C. Edge Effects in Fragmented Forests: Implications for Conservation. Trends Ecol. Evol. 1995, 10, 58–62. [Google Scholar] [CrossRef]
- Harper, K.A.; Macdonald, S.E.; Burton, P.J.; Chen, J.; Brosofske, K.D.; Saunders, S.C.; Euskirchen, E.S.; Roberts, D.; Jaiteh, M.S.; Esseen, P. Edge Influence on Forest Structure and Composition in Fragmented Landscapes. Conserv. Biol. 2005, 19, 768–782. [Google Scholar] [CrossRef]
- Rito, K.F.; Arroyo-Rodríguez, V.; Queiroz, R.T.; Leal, I.R.; Tabarelli, M. Precipitation Mediates the Effect of Human Disturbance on the Brazilian Caatinga Vegetation. J. Ecol. 2017, 105, 828–838. [Google Scholar] [CrossRef]
- Medeiros, R.; Andrade, J.; Ramos, D.; Moura, M.; Pérez-Marin, A.; Santos, C.; Silva, B.; Cunha, J. Remote Sensing Phenology of the Brazilian Caatinga and Its Environmental Drivers. Remote Sens. 2022, 14, 2637. [Google Scholar] [CrossRef]
- Moura, F.D.B.P.; Silva, J.V. Restauração Na Caatinga 2; EDUFAL: Maceió, Brazil, 2021; Available online: https://www.repositorio.ufal.br/handle/123456789/9074 (accessed on 30 May 2024).
- Ribeiro, E.P.; Nóbrega, R.S.; Mota Filho, F.O.; Moreira, E.B.M. Estimativa Dos Índices de Vegetaçãona Detecção de Mudanças Ambientais Nabacia Hidrográfica Do Rio Pajeú. Geosul Florianópolis 2016, 31, 59–92. [Google Scholar]
- Silva Junior, U.J.; Fonseca, R.C.; Silva Júnior, J.A. Mapeamento Da Vegetação Do Bioma Caatinga Por Meio De Séries Temporais Modis Ndvi E Albedo, Na Bacia Hidrográfica Do Rio Pajeú—Pe, Br. Caminhos Geogr. 2022, 23, 75–89. [Google Scholar] [CrossRef]
- da Silva, M.V.; Pandorfi, H.; de Almeida, G.L.P.; de Lima, R.P.; dos Santos, A.; Jardim, A.M.d.R.F.; Rolim, M.M.; da Silva, J.L.B.; Batista, P.H.D.; da Silva, R.A.B.; et al. Spatio-Temporal Monitoring of Soil and Plant Indicators under Forage Cactus Cultivation by Geoprocessing in Brazilian Semi-Arid Region. J. S. Am. Earth Sci. 2021, 107, 103155. [Google Scholar] [CrossRef]
- Gameiro, S.; Teixeira, C.P.B.; Silva Neto, T.A.; Lopes, M.F.L.; Duarte, C.R.; Souto, M.V.S.; Zimback, C.R.L. Avaliação Da Cobertura Vegetal Por Meio de Índices de Vegetação (NDVI, SAVI e IAF) Na Sub-Bacia Hidrográfica Do Baixo Jaguaribe, CE. Terræ 2016, 13, 15–22. [Google Scholar]
- Bezerra, A.C.; da Silva, J.L.B.; Silva, D.A.d.O.; Nascimento, C.R.; Ribeiro, E.P.; Galvincio, J.D.; da Silva, M.V.; de Oliveira, H.F.E.; Mesquita, M.; de Oliveira-Júnior, J.F.; et al. Seasonality of Biophysical Parameters in Extreme Years of Precipitation in Pernambuco: Relations, Regionalities, and Variability. Atmosphere 2023, 14, 1712. [Google Scholar] [CrossRef]
- Moura, D.C.; Silva, J.B.D.; Moura, A.S.S.D.; Melo, J.I.M.D.; Penha Pacheco, A.D. Atlas das Caatingas: O Único Bioma Exclusivamente Brasileiro; Freire, N.C.F., Ed.; FUNDAJ: Teresina, Brazil, 2018. Available online: https://www.gov.br/fundaj/pt-br/composicao/dipes-1/publicacoes/livro-atlas-final.pdf (accessed on 1 September 2025).
- Fernandes, M.R.M.; Matricardi, E.A.T.; Almeida, A.Q.; Fernandes, M.M. Análise Temporal Da Fragmentação Florestal Na Região Semiárida de Sergipe. Nativa 2017, 5, 421–427. [Google Scholar] [CrossRef][Green Version]
- Antongiovanni, M.; Venticinque, E.M.; Fonseca, C.R. Fragmentation Patterns of the Caatinga Drylands. Landsc. Ecol. 2018, 33, 1353–1367. [Google Scholar] [CrossRef]
- Ferreira, M.B.; Ferreira, R.L.C.; Silva, J.A.A.; Lima, R.B.; Silva, E.A.; Sousa, A.N.; De La Cruz, D.B.C.; Silva, M.V. Spatial-Temporal Dynamics of Water Resources in Seasonally Dry Tropical Forest: Causes and Vegetation Response. AgriEngineering 2024, 6, 2526–2552. [Google Scholar] [CrossRef]
- Teixeira, D.B.; Teixeira, L.M.; Costa, C.A. Correlation between Precipitation and Vegetation Indexes under Preserved Caatinga Condition. J. Hyperspectral Remote Sens. 2016, 7, 21–30. [Google Scholar] [CrossRef]
- de Queiroz, M.G.; da Silva, T.G.F.; Zolnier, S.; Jardim, A.M.d.R.F.; de Souza, C.A.A.; Júnior, G.D.N.A.; de Morais, J.E.F.; de Souza, L.S.B. Spatial and Temporal Dynamics of Soil Moisture for Surfaces with a Change in Land Use in the Semi-Arid Region of Brazil. Catena 2020, 188, 104457. [Google Scholar] [CrossRef]
- Bezerra, F.G.S.; de Toledo, P.M.; von Randow, C.; de Aguiar, A.P.D.; Lima, P.V.P.S.; dos Anjos, L.J.S.; Bezerra, K.R.A. Spatio-Temporal Analysis of Dynamics and Future Scenarios of Anthropic Pressure on Biomes in Brazil. Ecol. Indic. 2022, 137, 108749. [Google Scholar] [CrossRef]
- Coelho, V.H.R.; Montenegro, S.M.G.L.; Almeida, C.N.; Lima, E.R.V.; Ribeiro Neto, A.; Moura, G.S.S. Dinâmica Do Uso e Ocupação Do Solo Em Uma Bacia Hidrográfica Do Semiárido Brasileiro. Rev. Bras. Eng. Agrícola Ambient. 2014, 18, 64–72. [Google Scholar] [CrossRef]
- Fei, T.; Lu, D.; Li, Y.; Li, D.; Tian, S.; Amar, A.; Yang, X.; Li, Z. The Impact of the Wind Farm on the Vegetation and the Microclimate via Remote Sensing: A Case Study in Hebei Province, China. Energy Ecol. Environ. 2025, 1–18. [Google Scholar] [CrossRef]
- Zhang, C.; Li, X.; Lyu, X.; Dang, D.; Liu, S.; Su, N. Impact of Mountain Wind Farms on Different Vegetation Types: A Case Study in Yunnan Province. Environ. Sustain. Indic. 2025, 28, 100873. [Google Scholar] [CrossRef]


Disclaimer/Publisher’s Note: The statements, opinions and data contained in all publications are solely those of the individual author(s) and contributor(s) and not of MDPI and/or the editor(s). MDPI and/or the editor(s) disclaim responsibility for any injury to people or property resulting from any ideas, methods, instructions or products referred to in the content. |
© 2026 by the authors. Licensee MDPI, Basel, Switzerland. This article is an open access article distributed under the terms and conditions of the Creative Commons Attribution (CC BY) license.