Abstract
This study investigates the potential influence of Saharan dust intrusions on the stable carbon isotopes of methane (CH4) and carbon dioxide (CO2), using continuous in situ measurements from the ICOS (Integrated Carbon Observation System) atmospheric station at the CNR-IMAA Atmospheric Observatory (CIAO) in Tito, Basilicata, southern Italy. The analysis builds upon the recent investigation of a two-month isotopic dataset (20 February–20 April 2025), which identified anomalous isotopic behavior in March, coinciding with three distinct dust events. The observations reveal shifts in δ13C–CH4 values that align temporally with the dust intrusions, accompanied by a decrease in CH4 mole fractions. Such patterns could suggest fractionation processes affecting CH4, potentially driven by enhanced oxidation promoted by mineral aerosols. At the same time, δ13C–CO2 shows a gradual decline, deviating from the typical springtime enrichment associated with intensified photosynthetic uptake of 12CO2. This unexpected decrease suggests that dust-related radiative effects, particularly the attenuation of incoming solar radiation, may inhibit photosynthesis, thereby altering the isotopic composition of atmospheric CO2. Consistently, CO2 mole fractions exhibit a modest increase during periods of declining δ13C–CO2, reinforcing the interpretation of reduced photosynthetic activity. These findings provide new observational data beyond existing studies from Atlantic regions and highlight the need for further research on the role of mineral dust in shaping greenhouse gas isotopic variability in the Mediterranean, where such events are frequent and climatically relevant.
1. Introduction
CH4 is a potent and photochemically active greenhouse gas (GHG) with an atmospheric lifetime of approximately 11.2 ± 1.3 years [1]. Its global warming potential (GWP) far exceeds that of CO2 over shorter timeframes, about 80 times greater over 20 years (GWP20) and 28 times greater over 100 years (GWP100) [2]. This makes CH4 a critical target for near-term climate mitigation strategies. Since 2007, atmospheric CH4 concentrations have been rising steadily [3,4,5], reflecting a disequilibrium between its sources and sinks [6]. The increase followed a plateau of several years, during which no major fluctuations in terms of concentrations and isotopic fingerprint were observed [7]. CH4 is emitted from biogenic, anthropogenic, and geological sources, while its removal is primarily driven by oxidation via hydroxyl radicals (OH•), chlorine atoms (Cl), and methanotrophic bacteria [8,9,10,11]. These oxidation processes alter the stable carbon isotope ratio (δ13C) of CH4, as lighter isotopes (12CH4) are preferentially consumed, enriching the atmosphere in 13CH4 [12,13]. Biogenic sources such as wetlands, termites, ruminants, and rice paddies typically emit CH4 that is depleted in 13C, with δ13C–CH4 values ranging from approximately −65‰ to −55‰ compared to the international VPDB (Vienna Pee Dee Belemnite) standard. In contrast, fossil fuel combustion and biomass burning produce CH4 with less negative δ13C–CH4 values, generally ranging from −45‰ to −20‰ compared to the VPDB. The resulting atmospheric mixture of emissions yields an average δ13C–CH4 value around −54.3‰. Isotopic analysis of CH4 thus provides a powerful tool for source apportionment and for constraining the global CH4 budget [14,15]. However, the δ13C–CH4 observed in the atmosphere also reflects isotopic fractionation during oxidation. This enrichment effect shifts δ13C–CH4 toward less negative values, around −47.5‰ [16], potentially leading to an underestimation of biogenic contributions in top-down isotope-constrained models [17]. Moreover, uncertainties in atmospheric Cl concentrations [18] propagate through these models, affecting the accuracy of CH4 source attribution [10].
Recent studies have highlighted the role of mineral dust aerosols, particularly Saharan dust, in modulating CH4 oxidation [19]. These aerosols provide reactive surfaces that facilitate chemical transformations capable of altering δ13C-CH4 signatures. Saharan dust, a major component of atmospheric aerosols, exerts wide-reaching effects on climate, ecosystems, and biogeochemical cycles. Mona et al. [20] provided a comprehensive overview of these impacts, including modifications to the Earth’s radiation budget, changes in cloud microphysics, and influences on biogeochemical cycles. Their work also emphasized the rapid evolution of dust observational capabilities, spanning in situ measurements, ground-based networks, and satellite remote sensing. More recently, advances in field instrumentation have enabled deeper investigation into how mineral aerosol transported by Saharan dust influences the oxidative capacity of the atmosphere and impacts trace gas concentrations [21].
Saharan dust is known to carry nutrients such as iron (Fe) and phosphorus (P); when mineral dust travelling across the ocean mixes with sea spray aerosol containing sodium chloride (NaCl), it forms mineral dust sea-spray aerosol (MDSA), acting as a large surface on which chemical reactions can occur [22]. Under sunlight, Fe in mineral dust acts as a catalyst, triggering chemical reactions with chloride ions (Cl−) to produce Cl•, highly reactive gas-phase Cl radicals capable of modifying the oxidizing capacity of the atmosphere [23,24,25]. This mechanism may lead to an increase in δ13C-CH4 due to the kinetic isotope effect during CH4 oxidation [26,27,28]. This process develops over a time span ranging from a few hours to several days and may mask the decreasing δ13C-CH4 signatures from biogenic and fossil fuel sources, complicating the interpretation of the drivers behind the observed increase in atmospheric CH4. A work by D’Amico et al. [29] highlighted the potential of using δ13C-CH4 fractionation to perform local assessments of the Cl sink, because the magnitude of the Cl-initiated CH4 sink remains poorly constrained, and its overall contribution to regional CH4 loss is still the subject of active investigation [9,10]. Inspired by natural mechanisms like MDSA, the Iron-Salt Aerosol (ISA) method [30] has been proposed as a geoengineering strategy to enhance atmospheric CH4 removal. This approach involves lofting Fe-rich aerosols to catalyze Cl radical formation, thereby accelerating CH4 oxidation. While promising, the ISA method requires further investigation to assess its feasibility, environmental impact, and safety.
A recent study by Buono et al. [31] analyzed isotopic measurements collected over a 60-day period (20 February–20 April) at the newly established ICOS [32] atmospheric station in southern Italy for greenhouse gas observations, named POT station. Their results showed that δ13C-CH4 and δ13C-CO2 values in March deviated notably from those in February and April. This anomaly was interpreted as a possible indication of the Saharan dust influence on the isotopic composition of atmospheric CH4 and CO2. Although the study did not directly quantify the impact of mineral aerosols, it provided preliminary evidence that episodic dust intrusions may modulate CH4 isotopic signatures, potentially through enhanced oxidative processes involving Cl radicals. Building on these observations, the present study aims to investigate this phenomenon further by correlating isotopic shifts with documented dust intrusion events, searching to identify potential links between aerosol dynamics and changes in δ13C signatures. Future research will be necessary to confirm the underlying chemical mechanisms, including the role of reactive halogen species in CH4 oxidation.
In this work, we analyze data from continuous measurements of stable carbon isotopes in CH4 and CO2 performed during three Saharan dust intrusions between 10 and 26 March 2025. Observations were conducted at the POT atmospheric station [33] near Potenza, southern Italy, part of CIAO and currently under evaluation for ICOS labeling. The study integrates isotopic measurements with aerosol data from in situ instruments and ground-based remote sensing techniques [34,35].
These results represent a fundamental step toward expanding high-resolution GHG monitoring in southern Europe. A recent study [36] emphasized the strategic relevance of the Potenza site in addressing spatial gaps in the ICOS network. The isotopic fingerprinting technique pioneered by Keeling [37] is directly employed in this study, its conceptual framework may be essential for interpreting CH4 and CO2 variability in the central Mediterranean.
2. Materials and Methods
2.1. GHGs Observation
2.1.1. Sampling System
The POT station, located on a plain surrounded by low mountains in Southern Italy (Tito, 40.60° N, 15.72° E, 760 m a.s.l.), is less than 150 km from the Mediterranean Sea’s coasts in the west, south, and east directions. This strategic location places it within the central Mediterranean Basin, approximately 560 km north of the African continent (S-SW direction), and makes it an ideal site for studying Saharan dust [38,39]. The ICOS station is equipped with a 104 m-high tower featuring three air intake levels at 10, 50 and 100 m, with an advanced air sampling system. At the base of the tower, a climate-controlled shelter houses an array of ICOS compliant instruments dedicated to monitoring greenhouse gases.
For isotopic measurements, the air is sampled at 100 m above ground level (a.g.l), to reduce the influence of local sources [40], minimize the impact of soil respiration [41], and ensure that the data are representative of regional atmospheric conditions. The air sampling system begins with an EATON Synflex 1300 (EATON, Dublin, Ireland) tube with an outer diameter (OD) of 12 mm that extends from the 100 m intake point down to the shelter. The tube connects to a KNF N 815 KTE (KNF, Schenkon, Switzerland) flushing pump to ensure efficient air transport. Inside the shelter, the sampling line transitions to an EATON Synflex 1300 tube with a reduced OD of 6 mm via Swagelok fittings. The air is filtered through a first universal filter with a porosity of 2 μm (M&C F2, Ratingen, Germany) to remove particulates and a second in-line Swagelok filter with a porosity of 0.5 μm (Swagelok, Solon, OH, USA) prior to reaching the analyzer. Before analysis, gathered air is dried using a Perma Pure MD 070-144 S-4 Nafion dryer (Perma Pure, Lakewood, NJ, USA) to ensure moisture-free measurements. Ambient air is sampled with a flow rate of about 25 mL/min.
2.1.2. GHGs Instrumentation
For the purpose of this study, greenhouse gas measurements were performed using a Picarro G2201-i (Santa Clara, CA, USA), operating in simultaneous CO2–CH4 mode. This instrument enables continuous monitoring of mole fractions (ppm) of CO2 and CH4, along with their respective carbon isotope ratios (δ13C-CO2 and δ13C-CH4), referenced to the VPDB standard [42,43]. The analyzer achieves a precision of <0.16‰ for δ13C-CO2 and <1.15‰ for δ13C-CH4 in High Precision (HP) mode, which was selected based on the observed CH4 concentration range (1.8–12 ppm). The instrument performs one measurement per second, allowing high-frequency data acquisition suitable for capturing fine-scale atmospheric variability. CRDS technology, on which its operation is based, ensures reliable and continuous measurements with minimal calibration needs [44]. However, maintaining data quality requires strict control of key instrumental parameters. During operation, cavity pressure is kept within 148 Torr, while cavity and warm box temperatures are maintained within ±0.003 °C of the 45 °C setpoint. These parameters are continuously monitored, and deviations may indicate potential performance issues.
The dataset analyzed in this study is publicly available through the ITINERIS (Italian Integrated Environmental Research Infrastructures System) HUB [45]. Data acquisition and evaluation follow procedures described in Buono et al. [30]. In that work, the performance and stability of the Picarro G2201-i analyzer were assessed by comparing its dry mole fraction measurements with those obtained from a co-located Picarro G2401 (Santa Clara, CA, USA). The comparison, based on 1015 h of overlapping observations, was performed using the Bland & Altman method [46,47,48], confirming strong agreement between the two instruments and validating the reliability of the G2201-i data throughout the observation period. The isotopic dataset used in this study was collected during the initial operational period of the G2201-i analyzer, for which we assume that the original factory calibration remained valid throughout the measurement window. This assumption is partly supported by the stability observed in the corresponding CO2 and CH4 concentration measurements. Moreover, the focus of this work is on short-term variability, typically over timescales of a few days. Any slow instrumental drift in the isotopic channels would therefore not affect the representativeness of the observed patterns.
2.1.3. Isotopic Analysis
All data analyses were performed using R (version 4.4.2). To investigate temporal variability in isotopic composition, all measurements of CH4 and CO2 were aggregated using 10 min averages over the full observation period from 1 March to 10 April 2025. To highlight broader patterns while preserving short-term fluctuations, a moving average with a 36 h window (equivalent to 216 data points) was applied to the time series.
For the Keeling plot analysis, we used ordinary least squares linear regression, with δ values regressed against the inverse of CO2 concentration. The intercepts of these regressions were extracted as indicators of the isotopic signature of the dominant source. To quantify the associated uncertainty, we calculated the standard deviation of the intercepts obtained from the individual regression fits.
2.2. Aerosol Analysis
To assess the presence and evolution of Saharan dust intrusions, we integrated aerosol-focused remote sensing observations, trajectory modelling, and in situ measurements. Satellite monitoring relied on the Dust RGB (Red, Green, Blue) product available through EUMETView [49], derived from infrared observations of the Meteosat Second Generation (MSG) [50] SEVIRI instrument (Airbus Defence and Space, Taufkirchen, Germany, IR8.7, IR10.8, and IR12.0). The Dust RGB is a diagnostic false-colour composite in which these three infrared channels are mapped to the red, green, and blue components of the image. This combination enhances the thermal contrast between dust, clouds, and the underlying surface, allowing airborne mineral dust to be visually identified as characteristic pink–magenta areas. This RGB composite is specifically designed to track dust storm dynamics both day and night, providing valuable insight into aerosol transport pathways and atmospheric structure. Vertical information on aerosol layers was obtained from ground-based active remote sensing. Vertical profiles of aerosol optical properties and continuous high-resolution profiles (30 m, 10 s) of aerosol and cloud stratification were analyzed using, respectively, lidar and ceilometer (CL51, Vaisala, Vantaa, Finland) measurements performed within the ACTRIS (Aerosol, Clouds and Trace Gases Research Infrastructure) framework [51] at the CIAO. These observations enabled a detailed characterization of lofted aerosol layers during the dust events. Air mass origin and transport pathways were investigated using NOAA HYSPLIT (Hybrid Single-Particle Lagrangian Integrated Trajectory) backward trajectories [52,53], which supported the identification of source regions and transport patterns associated with each intrusion. Finally, in situ measurements from a nephelometer (Aurora 3000, Ecotech, Knoxfield, VIC, Australia) were used to characterize the scattering properties of mineral dust aerosol, contributing to the assessment of dust event intensity and temporal variability. The nephelometer measured light scattering at three wavelengths (450, 525, and 635 nm), integrating the scattered signal over angular ranges of 9–170° for total scattering and 90–170° for backscattering. Routine calibration was performed using particle-free air for zero checks and CO2 as the span gas. The dataset was recorded at 1 min resolution, and hourly averages were subsequently calculated. Corrections for truncation and non-Lambertian illumination effects were applied following the methodology described by Muller et al. [54], and all corrections and hourly averaging procedures were implemented using a dedicated Pyton 3.12 script.
3. Results
3.1. The Dust Event
Multiple observational methods confirmed the occurrence of Saharan dust intrusions, revealing three closely spaced events on 10–12 March, 14–16 March, and 22–26 March. The MSG SEVIRI Dust RGB product provided a clear overview of dust outbreaks over the Italian peninsula on 10 March (Figure 1a), 14 March (Figure 1b), and 22 March (Figure 1c).
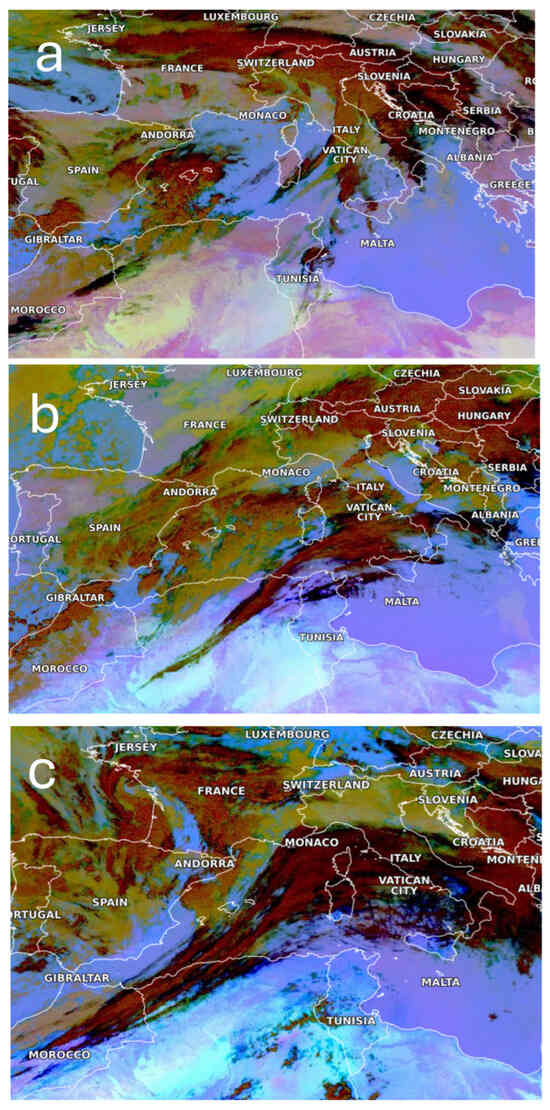
Figure 1.
MSG SEVIRI Dust RGB imagery showing the evolution of Saharan dust over the central Mediterranean region. (a–c) correspond, respectively, to 10 March 2025 at 06:00 UTC, 14 March 2025 at 09:00 UTC, and 22 March 2025 at 12:00 UTC. In the Dust RGB, colours indicate different atmospheric features: magenta—dust or ash clouds; black—cirrus clouds; dark red—thick, high and cold ice clouds; yellow—thick mid-level clouds; dark blue—humid lower-level air; lilac—dry lower-level air. Source: ©EUMETSAT [2025] [49].
Complementary cloud remote sensing measurements from the CIAO revealed a persistent aerosol layer on these days, as indicated by the target classification product derived from Cloudnet algorithms (Figure 2a–c). Daily evolution plots are available via the ACTRIS Cloudnet portal [55], offering further insight into the vertical structure and persistence of the aerosol layers.
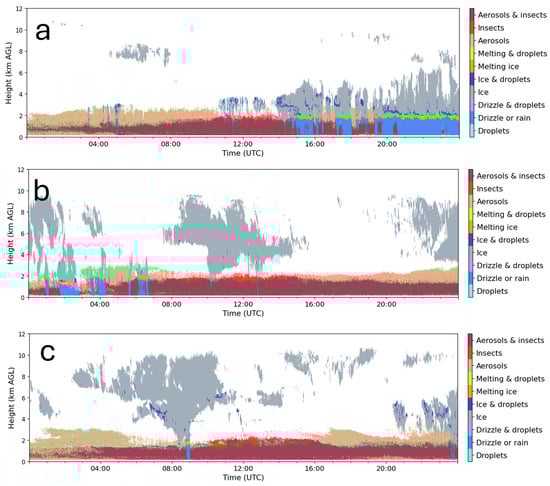
Figure 2.
ACTRIS Cloudnet Target classification at Potenza observatory during three Saharan dust episodes. (a–c) correspond, respectively, to 10 March 2025, 14 March 2025, and 22 March 2025.
These satellite-based and cloud-classification products provide a broad spatial and temporal overview of dust transport across the Mediterranean region. To complement these large-scale observations, ground-based lidar measurements from the ACTRIS/EARLINET network [56] were examined. These measurements were acquired using the Potenza Lidar for Particle Observation (POLPO) which operates at 355 nm, 532 nm and 1064 nm, at CIAO, and is designed for continuous monitoring of aerosol layers. The vertical profiles of aerosol optical properties measured on 15 March 2025 between 20:36 and 21:36 UTC (Figure 3a) indicate the presence of dust-contaminated air masses within the planetary boundary layer, as evidenced by depolarization ratios at 532 nm ranging between 0.1 and 0.2. The lidar profiles acquired on 21 March 2025 between 20:19 and 21:14 UTC (Figure 3b) reveal similar optical characteristics, confirming the presence of Saharan dust within the lower troposphere. In this case, the dust layer is more vertically extended, with a pronounced signal between an altitude of 2 and 3 km. The depolarization ratio at 532 nm exceeds 0.3 throughout this layer, indicating the dominance of pure mineral dust particles. Due to the persistent rainfall during the analyzed period, most lidar observations were not available. For this reason, all other days were excluded from analysis.
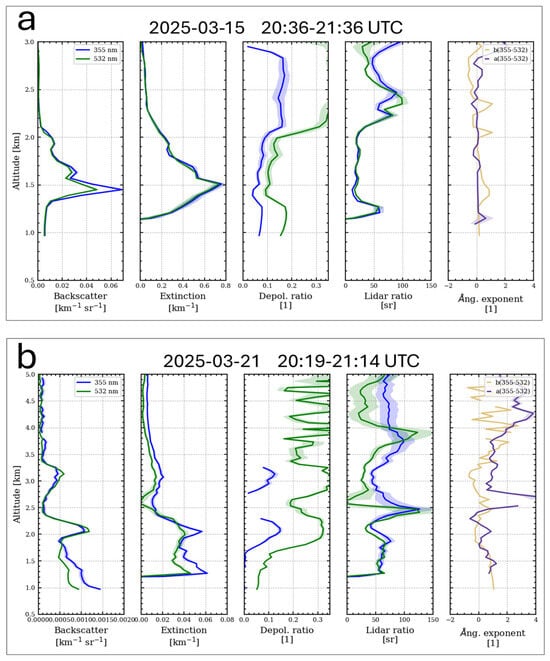
Figure 3.
Vertical profiles at 355 and 532 nm of particle backscattering coefficients, particle extinction coefficients, particle depolarization ratio, particle lidar ratios, and extinction Ångström exponents, respectively, measured: (a) on 15 March 2025 in the time slot 20:3621:36 UTC; (b) on 21 March 2025 in the time slot 20:19–21:14 UTC.
To trace the origin and transport pathways of the dust-laden air masses, NOAA HYSPLIT trajectory analysis was performed for 10 March (Figure 4a), 14 March (Figure 4b), and 22 March (Figure 4c). The trajectories indicate that the air masses originated from North Africa, following distinct paths. During the first intrusion (10 March), air parcels originated from central North Africa and traveled over Libya, Algeria, and Tunisia before reaching southern Italy. The second event (14 March) was characterized by a more westerly trajectory, with air masses primarily originating from Morocco and crossing the western Mediterranean Basin. In the third event (22 March), the air parcels again passed through Libya and Tunisia, with additional contributions from northern Europe, suggesting a more complex and layered transport pattern.
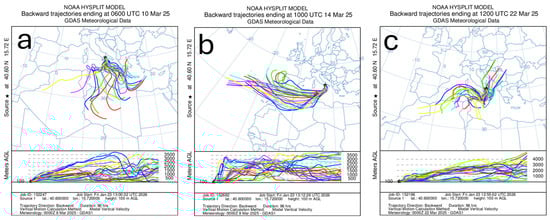
Figure 4.
HYSPLIT 96 h back trajectories for POT station. (a) Backward trajectories ending at 06:00 UTC 10 March 2025, (b) Backward trajectories ending at 10:00 UTC 14 March 2025, and (c) Backward trajectories ending at 12:00 UTC 22 March 2025.
The nephelometer observations (Figure 5a) show a pronounced shift in the spectral behavior of light scattering. Before the dust intrusion, the scattering coefficients exhibited the characteristic pattern of fine aerosol, with σsp (635 nm) < σsp (525 nm) < σsp (450 nm), resulting in positive scattering Ångström exponents (SAE) values around 1. During the dust events, this ordering reversed: σsp (635 nm) became the dominant wavelength, driving the SAE to values well below 1 and reaching −0.5 (Figure 5b). Such an inversion is characteristic of coarse mineral particles whose diameters are comparable to or larger than the measurements of wavelengths, thereby enhancing scattering at longer wavelengths. During the first event, a modest increase in σsp at 635 nm between 10 and 12 March, relative to pre-dust conditions, already points to the early arrival of coarse-mode particles. The second event displays a sharper and more intense peak at longer wavelength between 14 and 16 March, pointing to a more concentrated intrusion. This episode is marked by a sudden and pronounced increase in particulate concentration, producing a well-defined scattering signal. In contrast, the third event shows a broader and more prolonged enhancement in long-wavelength scattering, consistent with a prolonged dust presence over the region from 22 to 26 March. The persistence of elevated scattering values indicates a stable dust-laden air mass influencing the measurements over several days.
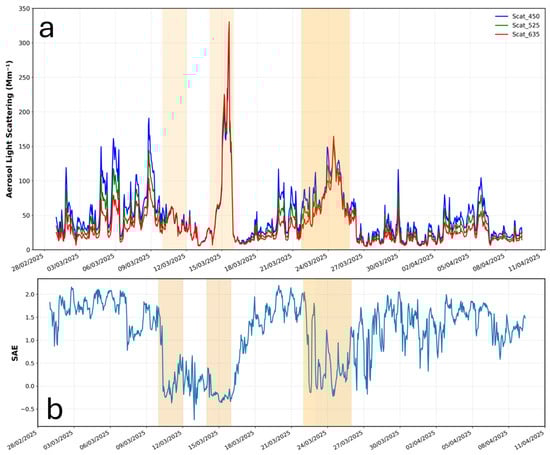
Figure 5.
Time series of (a) aerosol light scattering (Mm−1) and (b) the scattering Ångström exponent (SAE450–635) measured by the Aurora 3000-Ecotech nephelometer during the study period. Shaded intervals highlight the temporal windows dominated by coarse aerosol presence: 10–12 March, 14–16 March, and 22–26 March.
3.2. Temporal Variability of Isotopic Composition
Figure 6a,b present the evolution of δ13C–CH4 and CH4 mole fractions, respectively. The time series reveals several distinct phases, including periods of relative stability and intervals marked by abrupt changes.
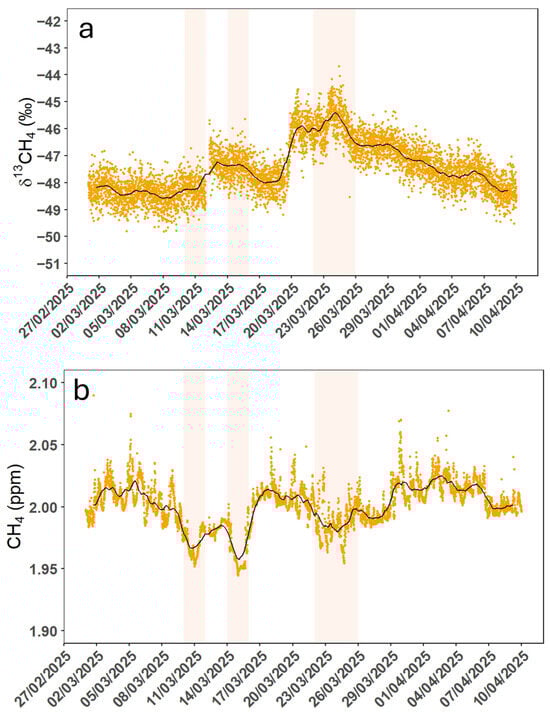
Figure 6.
10 min blocks covering the period from 1 March to 10 April. The black lines represent the 36 h moving average. Shaded intervals indicate three Saharan dust intrusion events: 10–12 March, 14–16 March, and 22–26 March. Figure (a) reports the High-Precision (HP) δ13C-CH4 values (‰ VPDB), and figure (b) shows the corresponding CH4 mole fractions (ppm).
Figure 6a shows alternating enrichment and depletion in δ13C–CH4 values, with transitions almost aligned with the timing of Saharan dust intrusions (10–26 March). Figure 6b shows the corresponding CH4 mole fractions, characterized by an overall trend with localized fluctuations. A clear drop occurs during the first two dust intrusion events, which exhibit very similar pattern.
Figure 7a,b illustrate the behavior of δ13C–CO2 and CO2 mole fractions, respectively. The δ13C–CO2 time series shows a gradual increase over the observed period, as expected during the early growing season, with a clear inflection occurring between 11 and 23 March. CO2 mole fractions remain relatively stable overall, exhibiting only slight increases beginning on 15 and again on 21 March.
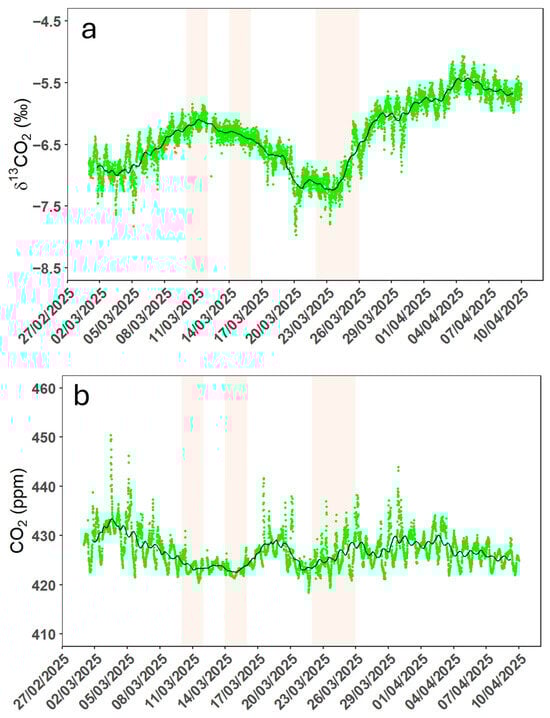
Figure 7.
10 min blocks covering the period from 1 March to 10 April. The black lines represent the 36 h moving average. Shaded intervals indicate three Saharan dust intrusion events: 10–12 March, 14–16 March, and 22–26 March. Figure (a) reports the High Precision (HP) δ13C- CO2 values (‰ VPDB), and figure (b) shows the corresponding CO2 mole fractions (ppm).
Together, these four figures provide a comprehensive overview of the dynamics of stable carbon isotopes and GHG concentrations before, during, and after the Saharan dust events. The patterns observed will be further examined in the discussion section to explore potential mechanisms and implications.
3.2.1. Keeling Plots of CO2
To investigate the isotopic behavior of atmospheric CO2 during Saharan dust intrusions, Keeling plots [35] (Figure 8a–c) were constructed for three distinct time windows corresponding to the periods with the highest R2 values, in order to maximize the reliability of the inferred source signature. Each plot represents a linear regression between δ13C–CO2 and the inverse of CO2 concentration. The regression slopes and intercepts vary across the three intervals, reflecting differences in the isotopic composition of CO2 and its sources.
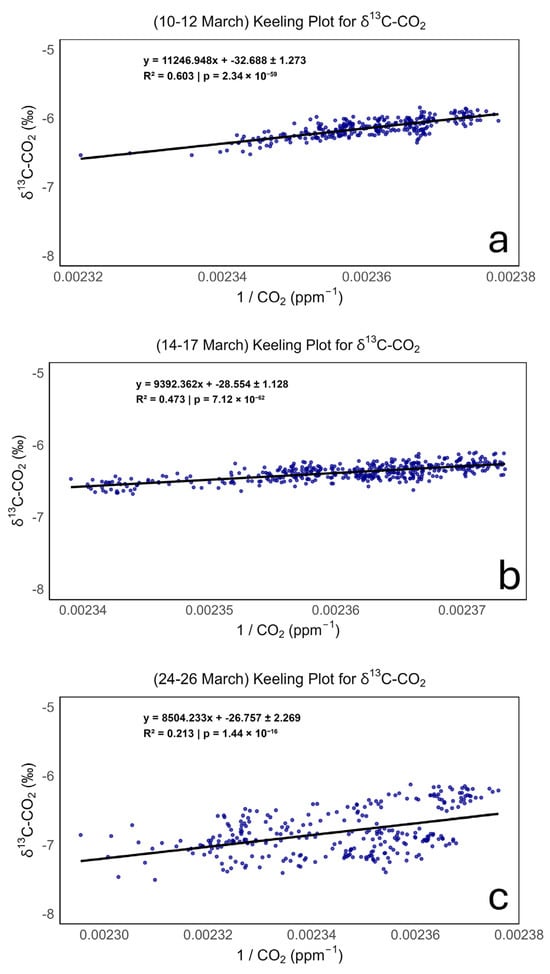
Figure 8.
Keeling plots of δ13C–CO2 versus the inverse of CO2 concentration 1/CO2 for three distinct Saharan dust intrusion periods, based on 10 min blocks: (a) 10–12 March, (b) 14–17 March, and (c) 24–26 March 2025. The intercepts, shown with their standard deviations, indicate the isotopic fingerprint of the emission source. The p-value associated with the regression is reported as p.
The first event (10–12 March) shows a relatively strong correlation (R2 = 0.603), suggesting a coherent isotopic signal. The second event (14–17 March) presents a slightly lower R2 (0.473), yet still indicates a consistent isotopic trend, possibly reflecting enhanced heterogeneity in air mass composition. The third event (24–26 March) exhibits the weakest correlation (R2 = 0.213), which may be attributed to more stratified transport regimes and mixed air masses, as suggested by trajectory analysis.
3.2.2. Keeling Plots of CH4
To explore the isotopic behavior of atmospheric CH4 during Saharan dust intrusions, Keeling plots [36] (Figure 9a–c) were constructed for the same three time windows used in the CO2 analysis: 10–12 March, 14–17 March, and 24–26 March 2025. Each plot represents a linear regression between δ13C–CH4 and the inverse of CH4 concentration. The results show a very weak correlation, with low R2 values suggesting that CH4 variability during these events is influenced by multiple overlapping sources and does not conform to the assumptions of a single-source mixing model. Nevertheless, the consistently very negative intercepts fall within the characteristic range of biogenic CH4, suggesting that background CH4 during the dust intrusions was dominated by biogenic emissions.
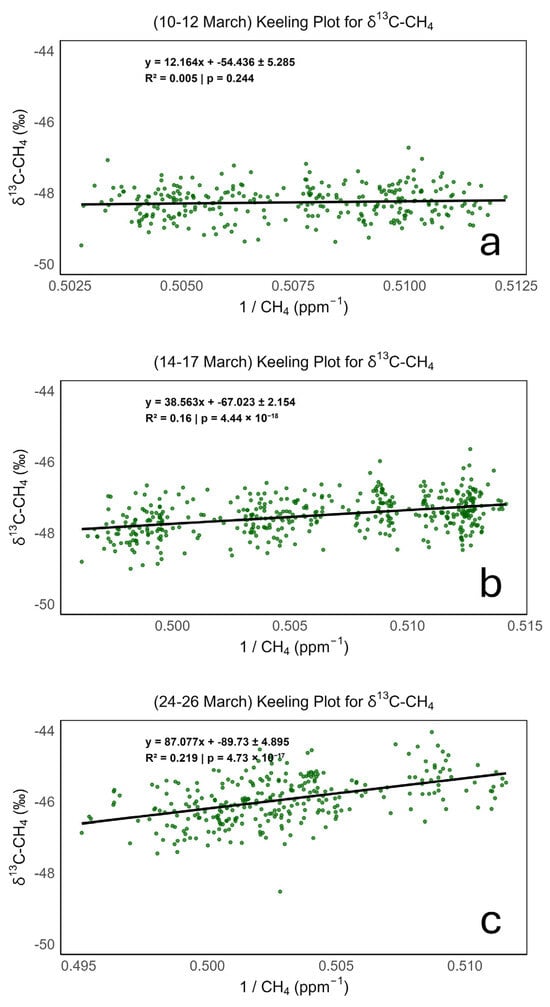
Figure 9.
Keeling plots of δ13C–CH4 versus the inverse of CH4 concentration 1/CH4 for three distinct Saharan dust intrusion periods, based on 10 min blocks: (a) 10–12 March, (b) 14–17 March, and (c) 24–26 March 2025. The p-value associated with the regression is reported as p.
4. Discussion
The integrated analysis, combining satellite and ground-based remote sensing observations, in situ aerosol optical measurements, air mass trajectory modeling, and continuous monitoring of GHG stable isotopes, reveals a coherent link between Saharan dust intrusions and perturbations in regional carbon dynamics. Although the temporal correspondence between the dust intrusions and the observed isotopic shifts is evident, the alignment is not perfectly synchronous. The physical presence of mineral aerosol and the chemical processes influencing δ13C-CH4 and δ13C-CO2 can evolve on different timescales. Gas-phase oxidation may exhibit a time lag relative to the arrival of dust-laden air masses, and such reactions can continue or intensify even after the peak aerosol load has passed, leading to delayed isotopic responses. Additionally, part of this mismatch may arise from the photochemical nature of these processes, which operate under sufficient solar radiation. Consequently, the timing of isotopic changes along the air mass trajectory may carry additional uncertainty, reflecting the variable onset of photochemically driven reactions. In this context, the shift toward less negative δ13C-CH4 values around 20 March likely reflects the delayed and combined influence of two closely spaced Saharan dust intrusions. Although the aerosol peaks occurred earlier, the associated changes in oxidative capacity can persist and partially overlap, producing an integrated isotopic signal that does not coincide exactly with the timing of maximum dust load.
In situ measurements of aerosol optical properties revealed a marked contribution from coarse mineral particles, a defining feature of Saharan dust intrusions, indicating that the sampled air masses were influenced by dust-laden conditions. The first and third episodes were characterized by slightly enhanced scattering coefficients at longer wavelengths, displaying less sharply defined peaks that suggest less intense dust plumes. In contrast, the second intrusion exhibited a markedly higher scattering signal at longer wavelengths, with a narrow and well-defined peak of short duration, indicative of a more concentrated and intense dust transport episode. Enhancements in aerosol scattering were accompanied by notable changes in particle size distribution, as reflected by the scattering Ångström exponent (SAE). During the first two events, SAE values approached zero, consistent with the dominance of coarse mineral particles. In contrast, the third event showed a less pronounced and more variable decrease in SAE, suggesting a more heterogeneous aerosol composition. This interpretation is consistent with the back trajectory analysis: while the first two intrusions were clearly linked to air masses originating from North African source regions, the third event displayed a more complex transport pattern. In this case, the air parcels travelled over Libya and Tunisia but also included contributions from northern Europe, indicating the arrival of mixed and layered air masses during the 22 March intrusion. Such variability in aerosol origin may also help explain the different isotopic response observed in δ13C–CH4 during this period, as air parcels with distinct source regions and transport histories can carry chemically diverse mixtures of dust and reactive gases. Notably, the intense scattering peak observed on 14–16 March coincides with the most pronounced subsequent enrichment in δ13C-CH4, which becomes evident after 17 March. This temporal sequence suggests that the conditions associated with the second intrusion were particularly conducive to promoting CH4 isotopic fractionation.
Specifically, the observed decrease in CH4 mole fractions accompanied by an enrichment in δ13C–CH4 points to isotopic fractionation likely driven by enhanced oxidative reactions. In addition to this, diurnal variability provides further insight into the short-term dynamics of the system. Previous work by Buono et al. [31] has characterized the expected seasonal behaviour of CO2 and δ13C-CO2 at the site, and over the period considered here (1 March–20 April) both species exhibit patterns consistent with those established seasonal cycles. For methane, the March diurnal cycle shows a more pronounced daytime decrease in CH4 mole fractions. In contrast, δ13C-CH4 in March remains systematically less negative than in April, with this behaviour persisting throughout most of the month. These diurnal features, although not the primary focus of the present study, are consistent with the interpretation that oxidation processes may modulate the observed isotopic signatures.
One plausible mechanism involves the catalytic role of Fe-rich mineral dust in generating reactive Cl radicals (Cl•), which increases the oxidative capacity of the atmosphere and preferentially removes lighter CH4 isotopes. Simultaneously, a light increase in atmospheric CO2 concentrations was observed during the dust events. This rise is plausibly associated with a temporary reduction in photosynthetic activity caused by diminished incoming solar radiation on the surface, itself a consequence of the elevated aerosol loads documented from vertical profiles of aerosol optical properties over the observation period. Correspondingly, δ13C–CO2 values show a noticeable decline, consistent with reduced uptake of 12CO2 by plants. Since photosynthesis preferentially fixes the lighter isotope (12C), diminished photosynthetic activity leads to less 12C being removed from the atmosphere. As a result, the δ13C–CO2 values temporarily decline, reflecting the transient decrease in photosynthetic carbon uptake. Outside of dust intrusion periods (10–26 March 2025), the δ13C–CO2 trend displays a progressive increase, as illustrated in the corresponding figures, which is consistent with the expected seasonal enhancement of photosynthetic activity during this time of year [57].
To further investigate the isotopic source signatures associated with the dust-intrusion periods, Keeling plots were generated for CO2 and CH4 across the three restricted time windows. These analyses offer additional insight into mixing processes and potential source contributions, influencing the observed isotopic variability. While the CO2 Keeling plots display clearer linear relationships, the CH4 plots consistently show very weak correlations, with low coefficients of determination. This contrast reflects the more complex and regionally integrated atmospheric behavior of CH4, which rarely conforms to a simple two-end-member mixing framework on which the Keeling plot approach relies [36]. Moreover, the markedly different atmospheric abundances of the two gases further contribute to this divergence: CO2 is over two orders of magnitude more abundant than CH4, meaning that small measurement uncertainties propagate very differently. As a result, the CH4 Keeling plots are inherently more sensitive to noise and variability, reinforcing the weaker and less interpretable linear relationships observed during the dust-intrusion periods. Although the weak correlations observed in the CH4 Keeling plots limit the robustness of source apportionment, the consistently very negative intercepts remain compatible with a predominantly biogenic CH4 signature. This interpretation is also consistent with the well-documented [58,59] association between Saharan dust and long-range transport of microbial and organic material, which may contribute to the complex mixture of bio-mineral particles influencing the isotopic composition of the sampled air masses. The Keeling intercepts obtained for CO2 (−32.7‰, −28.5‰, and −26.8‰) fall within the typical range of C3 ecosystem respiration [60] and indicate that, during the Saharan dust intrusions, the isotopic signature of CO2 was dominated by local biogenic sources. The dust intrusions do not introduce a characteristic CO2 isotopic signature of their own but instead modify atmospheric mixing and surface processes, thereby influencing the apparent intercept.
Marteen et al. [19] proposed, also, that the MDSA mechanism plays a pivotal role in regional-scale atmospheric chemistry, potentially driving ozone (O3) suppression, VOC oxidation, secondary organic aerosol formation, and HCl production through heterogeneous reactions involving Cl. Furthermore, Bonasoni et al. [61] investigated the impact of Saharan dust intrusions on tropospheric O3 levels at Mt. Cimone station in Northern Italy. During 12 documented dust transport events between June and December 2000, they observed a pronounced anticorrelation between coarse particle concentrations and surface O3 mixing ratio. Specifically, southerly flows carrying mineral dust from North Africa were associated with significant O3 reductions compared to background free-tropospheric conditions. These findings suggest that elevated concentrations of mineral aerosol can facilitate heterogeneous O3 destruction on particle surfaces, even at considerable distances from the dust source regions.
Taken together, the process-based hypothesis of Marteen et al. [18] and the observational evidence from Bonasoni et al. [61] provide a coherent framework for interpreting the O3 depletion events observed at Mt. Cimone. In our study, the isotopic shifts in CH4 and CO2 observed during Saharan dust intrusion further support the occurrence of dust-induced chemical processing, likely involving Cl-mediated heterogeneous reactions consistent with the MDSA mechanism. This convergence of chemical theory, observational data, and isotopic evidence reinforces the role of mineral dust as a key modulator of tropospheric oxidizing capacity in the Mediterranean region.
5. Conclusions
This study provides preliminary evidence that Saharan dust intrusions can alter the isotopic composition of atmospheric methane (CH4) and carbon dioxide (CO2), although through distinct and partly independent mechanisms. The combined analysis of aerosol optical properties, air mass trajectories, and continuous isotopic measurements shows that dust-laden air masses can affect regional carbon dynamics by modifying both the physical environment and the chemical reactivity of the atmosphere. For CH4, the observed decreases in CH4 mole fractions accompanied by enrichments in δ13C–CH4 during dust events suggest enhanced isotopic fractionation. Although CH4 Keeling plots did not yield strong linear relationships, reflecting the complex, multi-source nature of atmospheric CH4, the isotopic time series nonetheless indicates that dust intrusions can modulate CH4 isotopic composition. For CO2, the temporary increases in CO2 concentrations and concurrent declines in δ13C–CO2 are consistent with a short-term reduction in photosynthetic uptake driven by dust-induced radiative suppression. In contrast to CH4, CO2 Keeling plots displayed clearer mixing relationships, highlighting the stronger influence of local processes on short-term CO2 variability during dust events. Taken together, these findings demonstrate that Saharan dust intrusions exert a measurable influence on the isotopic composition of both CH4 and CO2, acting through a combination of radiative, chemical, and transport-related processes. Furthermore, the alignment with O3 depletion patterns documented in previous studies reinforces the broader role of mineral dust in modulating tropospheric oxidative capacity across the Mediterranean basin. However, given the complexity of the processes involved and the limited temporal resolution of the events examined, these interpretations should be considered indicative rather than conclusive. Future research should include extended observational campaigns and targeted in situ chemical analyses to fully characterize the mechanisms driving aerosol–gas coupling and their broader climatic implications.
Author Contributions
Conceptualization, I.Z.; methodology, I.Z., A.B. and F.D.; software, I.Z., E.L. and C.C.; validation, I.Z., A.B., T.L., B.D.R. and F.D.; formal analysis, I.Z., A.B., B.D.R., T.L. and F.D.; investigation, I.Z., A.B., F.D., E.L., F.C., T.L., M.R., B.D.R. and D.S.; resources, D.A., E.R. and A.G.; data curation, I.Z., A.B., F.D., T.L. and B.D.R., writing—original draft preparation, I.Z. and A.B.; writing—review and editing, I.Z., A.B., F.D., E.L., F.C., T.L., D.A., C.C., G.D.F., A.G., G.M., G.G., A.G.d.S., C.R.C., S.T., B.D.R., M.R., D.S. and L.M.; visualization, I.Z., A.B., B.D.R., T.L., F.D., E.L. and F.C.; supervision, A.G.d.S., C.R.C., S.T., G.M. and L.M.; funding acquisition, G.D.F., S.T. and L.M. All authors have read and agreed to the published version of the manuscript.
Funding
This research was funded by MUR (Italian Ministry of University and Research) through PON “Ricerca e Innovazione 2014–2020” under the following projects: PRO ICOS MED “Potenziamento della Rete di Osservazione ICOS-Italia nel Mediterraneo”, contract PIR01_00019, CUP B85D18000340001 (7 June 2019–18 February 2022), PRO ICOS MED (Potenziamento della Rete di Osservazione ICOS-Italia nel Mediterraneo—Rafforzamento del capitale umano)—Avviso MUR D.D. n. 2595 del 24 December 2019 Piano Stralcio “Ricerca e Innovazione 2015–2017”, CIR01_00019, CUP B58I20000210001, PER-ACTRIS-IT (Potenziamento della componente italiana della Infrastruttura di Ricerca Aerosol, Clouds, and Trace Gases Research Infrastructure)–Avviso MUR D.D. n. 2595 del 24.12.2019 Piano Stralcio “Ricerca e Innovazione 2015–2017”, PIR01_00015, CUP B17E19000000007, ITINERIS, Italian Integrated Environmental Research Infrastructure System (IR0000032, D.D. n.130/2022—CUPB53C22002150006) Funded by EU—Next Generation EU PNRR—Mission 4—Component 2—Investment 3.1 and Ordinary Fund for Research Institutions and Organizations (FOE), funded by the Italian Ministry of University and Research (D.M. n. 744, 8 October 2020).
Institutional Review Board Statement
Not applicable.
Informed Consent Statement
Not applicable.
Data Availability Statement
The dataset featuring 10 min aggregated blocks of stable carbon isotope data (δ13C–CO2, δ13C–CH4) and the respective mole fractions of CO2 and CH4 is available via the ITINERIS HUB [40].
Acknowledgments
We are grateful to ACTRIS and the Finnish Meteorological Institute for providing the ceilometer dataset and the ACTRIS-EARLINET network for providing aerosol optical parameters essential for reconstructing and analyzing the vertical profiles of atmospheric aerosols. We also acknowledge the Joint Research Unit “ICOS Italia”, funded by Ministry of University and Research. We acknowledge the support of EUMETSAT for providing access to the EUMETView platform. Our appreciation also goes to the NOAA Air Resources Laboratory (ARL) for the provision of the HYSPLIT transport and dispersion model and the READY website which have been fundamental in tracking atmospheric transport processes.
Conflicts of Interest
The authors declare no conflicts of interest.
References
- Prather, M.J.; Holmes, C.D.; Hsu, J. Reactive greenhouse gas scenarios: Systematic exploration of uncertainties and the role of atmospheric chemistry. Geophys. Res. Lett. 2012, 39, L09803. [Google Scholar] [CrossRef]
- IPCC: 2019 Refinement to the 2006 IPCC Guidelines for National Greenhouse Gas Inventories—IPCC. Available online: https://www.ipcc.ch/report/2019-refinement-to-the-2006-ipcc-guidelines-for-national-greenhouse-gas-inventories/ (accessed on 20 December 2025).
- Schaefer, H. On the Causes and Consequences of Recent Trends in Atmospheric Methane. Curr. Clim. Change Rep. 2019, 5, 259–274. [Google Scholar] [CrossRef]
- Nisbet, E.G.; Manning, M.R. What is causing the methane surge? Atmospheric methane’s recent growth has been driven by biogenic sources and COVID-19 impacts. Science 2026, 391, 556–557. [Google Scholar] [CrossRef] [PubMed]
- Drinkwater, A.; Palmer, P.I.; Feng, L.; Arnold, T.; Lan, X.; Michel, S.E.; Parker, R.; Boesch, H. Atmospheric data support a multi-decadal shift in the global methane budget towards natural tropical emissions. Atmos. Chem. Phys. 2023, 23, 8429–8452. [Google Scholar] [CrossRef]
- Kirschke, S.; Bousquet, P.; Ciais, P.; Saunois, M.; Canadel, J.G.; Dlugokencky, E.J.; Bergamaschi, P.; Bergmann, D.; Blake, D.R.; Bruhwiler, L.; et al. Three decades of global methane sources and sinks. Nat. Geosci. 2013, 6, 813–823. [Google Scholar] [CrossRef]
- Nisbet, E.G.; Manning, M.R.; Dlugokencky, E.J.; Fisher, R.E.; Lowry, D.; Michel, S.E.; Myhre, C.L.; Platt, S.M.; Allen, G.; Bousquet, P.; et al. Very Strong Atmospheric Methane Growth in the 4 Years 2014–2017: Implications for the Paris Agreement. Glob. Biogeochem. Cycles 2019, 33, 318–342. [Google Scholar] [CrossRef]
- Lawler, M.J.; Sander, R.E.; Carpenter, L.; Lee, J.D.; von Glasow, R.; Sommariva, R.; Saltzman, E.S. HOCl and Cl2 observations in marine air. Atmos. Chem. Phys. 2011, 11, 7617–7628. [Google Scholar] [CrossRef]
- Hossaini, R.; Chipperfield, M.P.; Saiz-Lopez, A.; Fernandez, R.; Monks, S.; Feng, W.P.; Brauer, P.; von Glasow, R. A global model of tropospheric chlorine chemistry: Organic versus inorganic sources and impact on methane oxidation. J. Geophys. Res. Atmos. 2016, 121, 14271–14297. [Google Scholar] [CrossRef]
- Gromov, S.; Brenninkmeijer, C.A.M.; Jöckel, P.A. Very limited role of tropospheric chlorine as a sink of the greenhouse gas methane. Atmos. Chem. Phys. 2018, 18, 9831–9843. [Google Scholar] [CrossRef]
- Hanson, R.S.; Hanson, T.E. Methanotrophic bacteria. Microbiol. Rev. 1996, 60, 439–471. [Google Scholar] [CrossRef] [PubMed]
- Saueressig, G.; Bergamaschi, P.; Crowley, J.N.; Fischer, H.; Harris, G.W. Carbon kinetic isotope effect in the reaction of CH4 with Cl atoms. J. Geophys. Res. Atmos. 1995, 22, 1225–1228. [Google Scholar] [CrossRef]
- Lan, X.; Nisbet, E.G.; Dlugokencky, E.J.; Michel, S.E. Improved Constraints on Global Methane Emissions and Sinks Using δ13C-CH4. J. Geophys. Res. Atmos. 2021, 35, e2021GB007000. [Google Scholar] [CrossRef] [PubMed]
- Quay, P.D.; King, S.L.; Stusman, J.; Wilbur, D.O.; Steele, L.P.; Fung, I.; Gammon, R.H.; Brown, T.A.; Farwell, G.W.; Grootes, P.M.; et al. Carbon isotopic composition of atmospheric CH4: Fossil and biomass burning source strengths. Glob. Biogeochem. Cycles 1991, 5, 25–47. [Google Scholar] [CrossRef]
- Saunois, M.; Stavert, A.R.; Poulter, B.; Bousquet, P.; Canadell, J.G.; Jackson, R.B.; Raymond, P.A.; Dlugokencky, E.J.; Houweling, S.; Patra, P.K.; et al. The Global Methane Budget 2000–2017. Earth Syst. Sci. Data 2020, 12, 1561–1623. [Google Scholar] [CrossRef]
- Basu, S.; Lan, X.; Dlugokencky, E.; Michel, S.; Schwietzke, S.; Miller, J.B.; Bruhwiler, L.; Oh, Y.; Tans, P.P.; Apadula, F.; et al. Estimating emissions of methane consistent with atmospheric measurements of methane and δ13C of methane. Atmos. Chem. Phys. 2022, 22, 15351–15377. [Google Scholar] [CrossRef]
- Cheewaphongphan, P.; Chatani, S.; Saigusa, N. Exploring Gaps between Bottom-Up and Top-Down Emission Estimates Based on Uncertainties in Multiple Emission Inventories: A Case Study on CH4 Emissions in China. Sustainability 2019, 11, 2054. [Google Scholar] [CrossRef]
- Röckmann, T.; van Herpen, M.; Brashear, C.; van der Veen, C.; Gromov, S.; Li, Q.; Saiz-Lopez, A.; Meidan, D.; Barreto, A.; Prats, N.; et al. The use of δ13C in CO to determine removal of CH4 by Cl radicals in the atmosphere. Environ. Res. Lett. 2024, 19, 064054. [Google Scholar] [CrossRef]
- Maarten, M.J.; van Herpena, W.; Qinyi, L.; Saiz-Lopezb, A.; Liisbergc, J.B.; Röckmann, T.; Cuevas, C.A.; Fernandez, R.P.; Mak, J.E.; Mahowald, N.M.; et al. Photocatalytic chlorine atom production on mineral dust–sea spray aerosols over the North Atlantic. Proc. Natl. Acad. Sci. USA 2023, 120, e2303974120. [Google Scholar] [CrossRef]
- Mona, L.; Amiridis, V.; Cuevas, E.; Gkikas, A.; Trippetta, S.; Vandenbussche, S.; Benedetti, A.; Dagsson-Waldhauserova, P.; Formenti, P.; Haefele, A.; et al. Observing Mineral Dust in Northern Africa, the Middle East, and Europe: Current Capabilities and Challenges ahead for the Development of Dust Services. Bull. Am. Meteorol. Soc. 2023, 104, E2223–E2264. [Google Scholar] [CrossRef]
- Brass, M.; Röckmann, T. Continuous-flow isotope ratio mass spectrometry method for carbon and hydrogen isotope measurements on atmospheric methane. Atmos. Meas. Tech. 2010, 3, 1707–1721. [Google Scholar] [CrossRef]
- Zhang, Y.; Sunwoo, Y.; Kotamarthi, V.; Carmichael, G.R. Photochemical oxidant processes in the presence of dust: An evaluation of the impact of dust on particulate nitrate and processes ozone formation. J. Appl. Met. 1994, 33, 813–824. [Google Scholar] [CrossRef]
- Allan, W.; Struthers, H.; Lowe, D.C. Methane carbon isotope effects caused by atomic chlorine in the marine boundary layer: Global model results compared with Southern Hemisphere measurements. J. Geophys. Res. Atmos. 2007, 112, D04306. [Google Scholar] [CrossRef]
- Qinyi, L.; Fernandez, R.P.; Hossaini, R.; Iglesias-Suarez, F.; Cuevas, C.A.; Apel, E.C.; Kinnison, D.E.; Lamarque, J.-F.; Saiz-Lopez, A. Reactive halogens increase the global methane lifetime and radiative forcing in the 21st century. Nat. Commun. 2022, 13, 2768. [Google Scholar] [CrossRef]
- Arimoto, R. Eolian dust and climate: Relationships to sources, tropospheric chemistry, transport and deposition. Earth Sci. Rev. 2001, 54, 29–42. [Google Scholar] [CrossRef]
- Cantrell, C.A.; Shetter, R.E.; McDaniel, A.H.; Calvert, J.G.; Davidson, J.A.; Lowe, D.C. Carbon kinetic isotope effect in the oxidation of methane by the hydroxyl radical. J. Geophys. Res. Atmos. 1990, 95, 22455–22462. [Google Scholar] [CrossRef]
- Bergamaschi, P.; Bruhl, C.; Brenninkmeijer, C.A.M.; Saueressig, G.; Crowley, J.N.; Groos, J.U.; Fischer, H.; Crutzen, P.J. Implications of the large carbon kinetic isotope effect in the reaction CH4+ Cl for the 13C/12C ratio of stratospheric CH4. Geophys. Res. Lett. 1996, 23, 2227–2230. [Google Scholar] [CrossRef]
- Tyler, S.C.; Ajie, H.O.; Rice, A.L.; Cicerone, R.J.; Tuazon, E.C. Experimentally determined kinetic isotope effects in the reaction of CH4 with Cl: Implications for atmospheric CH4. Geophys. Res. Lett. 2000, 27, 1715–1718. [Google Scholar] [CrossRef]
- D’Amico, F.; Ammoscato, I.; Gullì, D.; Avolio, E.; Lo Feudo, T.; De Pino, M.; Cristofanelli, P.; Malacaria, L.; Parise, D.; Sinopoli, S.; et al. Integrated analysis of methane cycles and trends at the WMO/GAW station of Lamezia Terme (Calabria, Southern Italy). Atmosphere 2024, 15, 946. [Google Scholar] [CrossRef]
- Gorham, K.A.; Abernethy, S.; Jones, T.R.; Hess, P.; Mahowald, N.M.; Meidan, D.; Johnson, M.S.; van Herpen, M.M.J.W.; Xu, Y.; Saiz-Lopez, A.; et al. Opinion: A research roadmap for exploring atmospheric methane removal via iron salt aerosol. Atmos. Chem. Phys. 2024, 24, 5659–5670. [Google Scholar] [CrossRef]
- Buono, A.; Zaccardo, I.; D’Amico, F.; Lapenna, E.; Cardellicchio, F.; Laurita, T.; Amodio, D.; Colangelo, C.; Di Fiore, G.; Giunta, A.; et al. Expanding Continuous Carbon Isotope Measurements of CO2 and CH4 in the Italian ICOS Atmospheric Consortium: First Results from the Continental POT Station in Potenza (Basilicata). Atmosphere 2025, 16, 951. [Google Scholar] [CrossRef]
- Heiskanen, J.; Brümmer, C.; Buchmann, N.; Calfapietra, C.; Chen, H.; Gielen, B.; Gkritzalis, T.; Hammer, S.; Hartman, S.; Herbst, M.; et al. The Integrated Carbon Observation System in Europe. Bull. Am. Meterol. Soc. 2022, 103, E855–E872. [Google Scholar] [CrossRef]
- Lapenna, E.; Buono, A.; Mauceri, A.; Zaccardo, I.; Cardellicchio, F.; D’Amico, F.; Laurita, T.; Amodio, D.; Colangelo, C.; Di Fiore, G.; et al. ICOS Potenza (Italy) Atmospheric Station: A New Spot for the Observation of Greenhouse Gases in the Mediterranean Basin. Atmosphere 2025, 16, 57. [Google Scholar] [CrossRef]
- Laurita, T.; Mauceri, A.; Cardellicchio, F.; Lapenna, E.; De Rosa, B.; Trippetta, S.; Mytilinaios, M.; Amodio, D.; Giunta, A.; Ripepi, E.; et al. CIAO observatory main upgrade: Building up an ACTRIS compliant aerosol in-situ laboratory. Atmos. Meas. Tech. 2025, 18, 2373–2396. [Google Scholar] [CrossRef]
- Madonna, F.; Amodeo, A.; Boselli, A.; Cornacchia, C.; Cuomo, V.; D’Amico, G.; Giunta, A.; Mona, L.; Pappalardo, G. CIAO: The CNR-IMAA advanced observatory for atmospheric research. Atmos. Meas. Tech. 2011, 4, 1191–1208. [Google Scholar] [CrossRef]
- Villalobos, Y.; Gomez-Ortiz, C.; Scholze, M.; Monteil, G.; Karstens, U.; Fiore, A.; Brunner, D.; Thanwerdas, J.; Cristofanelli, P. Towards improving top-down national CO2 estimation in Europe: Potential from expanding the ICOS atmospheric network in Italy. Environ. Res. Lett. 2025, 20, 054002. [Google Scholar] [CrossRef]
- Keeling, C.D. The concentration and isotopic abundances of atmospheric carbon dioxide in rural areas. Geochim. Cosmochim. Acta 1958, 13, 322–334. [Google Scholar] [CrossRef]
- Mona, L.; Amodeo, A.; Pandolfi, M.; Pappalardo, G. Saharan dust intrusions in the Mediterranean area: Three years of Raman lidar measurements. J. Geophys. Res. Atmos. 2006, 111, D16203. [Google Scholar] [CrossRef]
- De Rosa, B.; Mytilinaios, M.; Amodeo, A.; Colangelo, C.; D’Amico, G.; Dema, C.; Gandolfi, I.; Giunta, A.; Gumà-Claramunt, P.; Laurita, T.; et al. Observations of Saharan Dust Intrusions over Potenza, Southern Italy, During 13 Years of Lidar Measurements: Seasonal Variability of Optical Properties and Radiative Impact. Remote Sens. 2025, 17, 453. [Google Scholar] [CrossRef]
- Andrews, A.E.; Kofler, J.D.; Trudeau, M.E.; Williams, J.C.; Neff, D.H.; Masarie, K.A.; Chao, D.Y.; Kitzis, D.R.; Novelli, P.C.; Zhao, C.L.; et al. CO2, CO and CH4 measurements from the NOAA Earth System Research Laboratory’s Tall Tower Greenhouse Gas Observing Network: Instrumentation, uncertainty analysis and recommendations for future high-accuracy greenhouse gas monitoring efforts. Atmos. Meas. Tech. 2014, 7, 647–687. [Google Scholar] [CrossRef]
- Zhu, X.; Di, D.; Ma, M.; Shi, W. Stable isotopes in greenhouse gases from soil: A review of theory and application. Atmosphere 2019, 10, 377. [Google Scholar] [CrossRef]
- Craig, H. Isotopic standards for carbon and oxygen and correction factors for mass-spectrometric analysis of carbon dioxide. Geochim. Cosmochim. Acta 1957, 12, 133–149. [Google Scholar] [CrossRef]
- Dunn, P.J.H.; Malinovsky, D.; Ogrinc, N.; Potočnik, D.; Flierl, L.; Rienitz, O.; Paul, D.; Meijer, H.A.J. Re-determination of R(13C/12C) for Vienna Peedee belemnite (VPDB). Rapid Commun. Mass Spectrom. 2024, 38, e9773. [Google Scholar] [CrossRef]
- Chen, H.; Winderlich, J.; Gerbig, C.; Hoefer, A.; Rella, C.W.; Crosson, E.R.; Van Pelt, A.D.; Steinbach, J.; Kolle, O.; Beck, V.; et al. High-accuracy continuous airborne measurements of greenhouse gases (CO2 and CH4) using cavity ring-down spectroscopy (CRDS) technique. Atmos. Meas. Tech. 2020, 3, 375–386. [Google Scholar] [CrossRef]
- Buono, A.; Zaccardo, I.; D’Amico, F.; Mona, L.; Ripepi, E.; Dema, C. Continuous δ13C-CO2 and δ13C-CH4 Measurements in the Atmosphere—Data Gathered at Potenza (Basilicata, Southern Italy) in 2025. Version 1. Available online: https://hub.itineris.cnr.it/datasets/ (accessed on 15 December 2025).
- Altman, D.G.; Bland, J.M. Measurement in Medicine: The Analysis of Method Comparison Studies. J. R. Stat. Soc. Ser. D 1983, 32, 307–317. [Google Scholar] [CrossRef]
- Bland, J.M.; Altman, D.G. Statistical methods for assessing agreement between two methods of clinical measurement. Lancet 1986, 327, 307–310. [Google Scholar] [CrossRef]
- Datta, D. Blandr: Bland-Altman Method Comparison Package for R, Version 0.6.0; Zenodo: Geneva, Switzerland, 2024. [Google Scholar] [CrossRef]
- EUMETSAT Viewer. Available online: https://view.eumetsat.int/productviewer?v=mumi:wideareacoverage_rgb_dust (accessed on 20 November 2025).
- Lensky, I.M.; Rosenfeld, D. Clouds–Aerosols–Precipitation Satellite Analysis Tool (CAPSAT). Atmos. Chem. Phys. 2008, 8, 6739–6753. [Google Scholar] [CrossRef]
- Laj, P.; Lund Myhre, C.; Riffault, V.; Amiridis, V.; Fuchs, H.; Eleftheriadis, K.; Petäjä, T.; Salameh, T.; Kivekäs, N.; Juurola, E.; et al. Aerosol, Clouds and Trace Gases Research Infrastructure (ACTRIS): The European Research Infrastructure Supporting Atmospheric Science. Bull. Am. Meterol. Soc. 2024, 105, E1098–E1136. [Google Scholar] [CrossRef]
- Stein, A.F.; Draxler, R.R.; Rolph, G.D.; Stunder, B.J.B.; Cohen, M.D.; Ngan, F. NOAA’s HYSPLIT atmospheric transport and dispersion modeling system. Bull. Am. Meteorol. Soc. 2015, 96, 2059–2077. [Google Scholar] [CrossRef]
- National Oceanic and Atmospheric Administration Air Resources Laboratory. Real-Time Environmental Applications and Display sYstem. Available online: https://www.ready.noaa.gov (accessed on 23 January 2026).
- Müller, T.; Laborde, M.; Kassell, G.; Wiedensohler, A. Design and Performance of a Three-Wavelength LED-Based Total Scatter and Backscatter Integrating Nephelometer. Atmos. Meas. Tech. 2011, 4, 1291–1303. [Google Scholar] [CrossRef]
- ACTRIS Cloudnet Data Portal. Available online: https://cloudnet.fmi.fi (accessed on 10 December 2025).
- ACTRIS Earlinet Data Portal. Available online: https://data.earlinet.org/earlinet (accessed on 26 January 2026).
- Farquhar, G.D.; Ehleringer, J.R.; Hubick, K.T. Carbon Isotope Discrimination and Photosynthesis. Annu. Rev. Plant Physiol. Plant Mol. Biol. 1989, 40, 503–537. [Google Scholar] [CrossRef]
- González-Toril, E.; Osuna, S.; Viúdez-Moreiras, D.; Navarro-Cid, I.; Díaz Del Toro, S.; Sor, S.; Bardera, R.; Puente-Sánchez, F.; de Diego-Castilla, G.; Aguilera, Á. Impacts of Saharan Dust Intrusions on Bacterial Communities of the Low Troposphere. Sci. Rep. 2020, 10, 6837. [Google Scholar] [CrossRef]
- Navarro, A.; del Moral, A.; de Pablos, I.; Delgado, R.; Párraga, J.; Martín-García, J.M.; Martínez-Checa, F. Microorganisms Isolated from Saharan Dust Intrusions in the Canary Islands and Processes of Mineral Atmospherogenesis. Appl. Sci. 2024, 14, 1862. [Google Scholar] [CrossRef]
- Pataki, D.E.; Ehleringer, J.R.; Flanagan, L.B.; Yakir, D.; Bowling, D.R.; Still, C.J.; Buchmann, N.; Kaplan, J.O.; Berry, J.A. The application and interpretation of Keeling plots in terrestrial carbon cycle research. Glob. Biogeochem. Cycles 2003, 17, 1022. [Google Scholar] [CrossRef]
- Bonasoni, P.; Cristofanelli, P.; Calzolari, F.; Bonafe, U.F.; Evangelisti, F.; Stohl, A.; Sajani, S.Z.; van Dingenen, R.; Colombo, T.; Balkanski, Y. Aerosol-ozone correlations during dust transport episodes. Atmos. Chem. Phys. 2004, 4, 1201–1215. [Google Scholar] [CrossRef]


Disclaimer/Publisher’s Note: The statements, opinions and data contained in all publications are solely those of the individual author(s) and contributor(s) and not of MDPI and/or the editor(s). MDPI and/or the editor(s) disclaim responsibility for any injury to people or property resulting from any ideas, methods, instructions or products referred to in the content. |
© 2026 by the authors. Licensee MDPI, Basel, Switzerland. This article is an open access article distributed under the terms and conditions of the Creative Commons Attribution (CC BY) license.