Article

Pasture Floristic Composition as an Indicator of Soil pH Correction and Sheep Stocking Rate in Montado Ecosystem

by
João Serrano
1,*,
Paula Matono
1,
Emanuel Carreira
1,
Shakib Shahidian
1,
Francisco J. Moral
2,
Luís L. Paniagua
3,
Rui Charneca
1,
Alfredo Pereira
1 and
Anabela Belo
1
1
MED—Mediterranean Institute for Agriculture, Environment and Development and CHANGE–Global Change and Sustainability Institute, School of Sciences and Technology, University of Évora, Mitra, Ap. 94, 7006-554 Évora, Portugal
2
Departamento de Expresión Gráfica, Escuela de Ingenierías Industriales, Universidad de Extremadura, Avenida de Elvas s/n, 06006 Badajoz, Spain
3
Escuela de Ingenierías Agrarias, Universidad de Extremadura, Avenida Adolfo Suárez s/n, 06007 Badajoz, Spain
*
Author to whom correspondence should be addressed.
Environments 2025, 12(10), 385; https://doi.org/10.3390/environments12100385
Submission received: 20 September 2025 / Revised: 10 October 2025 / Accepted: 13 October 2025 / Published: 16 October 2025

Abstract

The application of dolomitic limestone is a recommended practice for improving pastures established on acidic soils. On the other hand, pasture availability should determine the adjustment of the biotic load. The aim of this study is to evaluate the potential of pasture plant community composition as an indicator to assess the effects of intensification strategies in the Montado ecosystem, specifically soil pH correction and/or increasing animal stocking rate. Forty-eight sampling areas of a biodiverse pasture were monitored on a 4-ha plot located at the Mitra farm (Évora district; southern Portugal). The experimental design included four treatments: with and without limestone application (respectively, DL and WDL) × traditional low stocking rate (LSR, 7 sheep ha−1) and high stocking rate (HSR, 18 sheep ha−1). Floristic composition, structural parameters, and diversity metrics were recorded and analyzed using multivariate statistical tools. Pasture diversity was assessed through the computation of richness indices, with plant species identified as ecological indicators representative of each study area. The results showed Rumex pulcher, Trifolium subterraneum, Plantago lanceolata, and Lolium rigidum as botanical indicators of the four treatments of this study, respectively, LSR in untreated soil, HSR in untreated soil, HSR in treated soil, and LSR in treated soil. The results also show that soil amendment led to a more distinct and stable pasture floristic composition (PFC) compared to untreated areas. Conversely, the stocking rate (SR) played a secondary but still ecologically relevant role. Notably, HSR appears to reduce the need for lime application to achieve a balanced floristic composition and desirable plant community structure, potentially lowering soil amendment costs without compromising pasture quality. In LSR areas, the application of lime was essential to significantly improve the floristic richness, the vegetation cover, and the presence of legumes.

1. Introduction

Grasslands occupy around 70% of the agricultural land in the world and are used mainly for livestock production [1]. Pastures represent the primary feed resource for herbivores (mainly sheep and cattle) in extensive livestock systems, reducing the need for supplementary feeding and the associated economic cost during the growing season [2].
Grassland systems often display fine-scale botanical and structural heterogeneity, characterized by marked spatial and temporal variability [3]. The characteristic pasture biodiversity, composed of multiple plant species, can be regarded as a dynamic bioindicator of the long-term evolution and preservation of the ecosystem’s ability to deliver essential services under future environmental conditions [4]. This means greater resilience to climate change and may present advantages in the complementary growth that they present, enabling the production of biomass with acceptable nutritional value for the animals [5].
However, the economic return on extensive livestock farming (pasture-based systems) is low, as it occupies degraded, low-fertility, stony, shallow, and acidic soils. There are few incentives for investment with a view to increasing productivity. Therefore, the environmental perspective prevails, with the recovery of soil functionality and the preservation of the Montado, an ecosystem of high natural value [6]. Pastoral activities support local economies, maintain biodiversity, and contribute to the sustainable use of natural resources [7]. In addition, grazing lands can play an important role in providing ecosystem services, such as carbon sequestration, greenhouse gas emissions mitigation, biodiversity conservation, and reduction of soil degradation [8].
Regional, national, and international programs (for example, the interregional cooperation program “Interreg Europe”, between Portugal and Spain, co-funded by the European Union) have promoted research studies based on the sustainability of this ecosystem and on managing the balance of all its components (soil, pasture, trees, and animals), interacting with the climate. Legislation resulting from these projects has made it possible to promote and reward good value-generating practices, such as the “Management of the Montado by Results” [9], with payments to the farmer for agri-environmental results achieved as instruments of the Common Agricultural Policy (CAP).
A few decades of extensive grazing have had a positive impact on recovering the productive potential of large areas in the Alentejo, in Southern Portugal. Favorable indicators such as the positive evolution of the soil’s organic matter content or the significant diversity of plant species in the pastures have led to improvement measures, for example, through the application of dolomitic limestone and/or phosphate fertilization, making it possible to consider a greater animal load per unit area, creating a more productive system with greater economic return. The recommended approach to effectively manage and enhance the productivity of these extensive production systems relies on improving soil fertility using chemical fertilizers, soil amendments, and appropriate grazing management [10,11,12]. This strategy requires a thorough understanding of how these factors influence pasture growth, enabling managers to make well-informed decisions. Thus, in this context, the research hypothesis of this study is: Can pasture floristic composition serve as an indicator for the effects of pH correction and/or increased animal stocking rates? The intensification of animal production systems requires indicators that are accessible to farmers and agricultural managers. Biodiversity associated with pastures can be a permanent indicator to characterize vegetation dynamics, the ecosystem’s evolution, and management strategies. The knowledge of pasture plant species that are more important for livestock may be achieved by carrying out floristic surveys and phytosociology studies, and is a prerequisite for elaborating management programs to recover degraded pastures [13]. Pasture vegetation and diversity fundamentally reflect the variability of soil parameters and grazing management and can be identified as ecological and dynamic attributes characteristic of each specific area [14]. Botanical composition affects overall sward productivity and is directly linked to grassland and livestock management [15]. Forage nutritive value (which includes floristic composition) is also an essential indicator of rangeland status regarding degradation and livestock nutrient demand [16].
Understanding how pastures respond to environmental variability is fundamental for improving grazing management and animal welfare, as well as for ensuring the sustainability of these systems, which are vital for preserving biodiversity, ecological resilience, and economic productivity [7]. The composition of grasslands serves as a foundation for a wide range of farm decisions, from strategic (long-term planning) to tactical (medium term adjustments) and operational levels (daily decisions regarding fertilizer or amendment applications and grazing intensity) [3]. However, the process of evaluating floristic composition is complex, requires the participation of experts, involves exhaustive procedures and standard protocols [14], and is further hampered by vegetation’s phenological, physiological, and morphological seasonal changes [17].
This work is part of a research project that started in 2015 and aims to assess the relative importance of different factors in the productivity of the Montado ecosystem. This is the Portuguese designation for an agro-silvo-pastoral system characteristic of the Mediterranean region that includes Southern Portugal, Spain (where it takes the name Dehesa), Italy, Greece, and some North African countries. Various studies have been and continue to be carried out on this experimental field, such as evaluating the effect of trees, sheep grazing, or the application of dolomitic limestone and phosphorus fertilizer to the soil and pasture [18]. All these factors represent approaches towards intensifying this production system.
This study aims to evaluate the potential of pasture plant community composition as an ecological and holistic indicator to assess the effects of intensification strategies in the Montado ecosystem, specifically soil pH correction and/or increasing animal stocking rate. By analyzing floristic composition, species richness, diversity, and indicator species, the goal is to identify sustainable management practices that promote pasture productivity and biodiversity, supporting informed decisions for the integrated management of soil, vegetation, and livestock in this silvopastoral system.

2. Materials and Methods

2.1. Study Area, Treatments, and Chronological Approach

The study area (4 ha) is located at Mitra farm (38°53.10′ N; 8°01.10′ W; mean altitude 219.61 m), an experimental site belonging to the University of Évora, in the Alentejo region of Southern Portugal (Figure 1a). This field was subdivided by fences into 4 plots of approximately 1 ha each (Figure 1b). These plots were assigned to one of four treatments (T) that combined liming and stocking rate levels:
  • T1 (WDL/LSR)—Without dolomitic limestone; Low stocking rate (7 sheep/ha);
  • T2 (WDL/HSR)—Without dolomitic limestone; High stocking rate (18 sheep/ha);
  • T3 (DL/HSR)—With dolomitic limestone; High stocking rate;
  • T4 (DL/LSR)—With dolomitic limestone; Low stocking rate.
Twelve sampling areas (3 m × 3 m) were georeferenced within each plot, totaling 48 across the field.
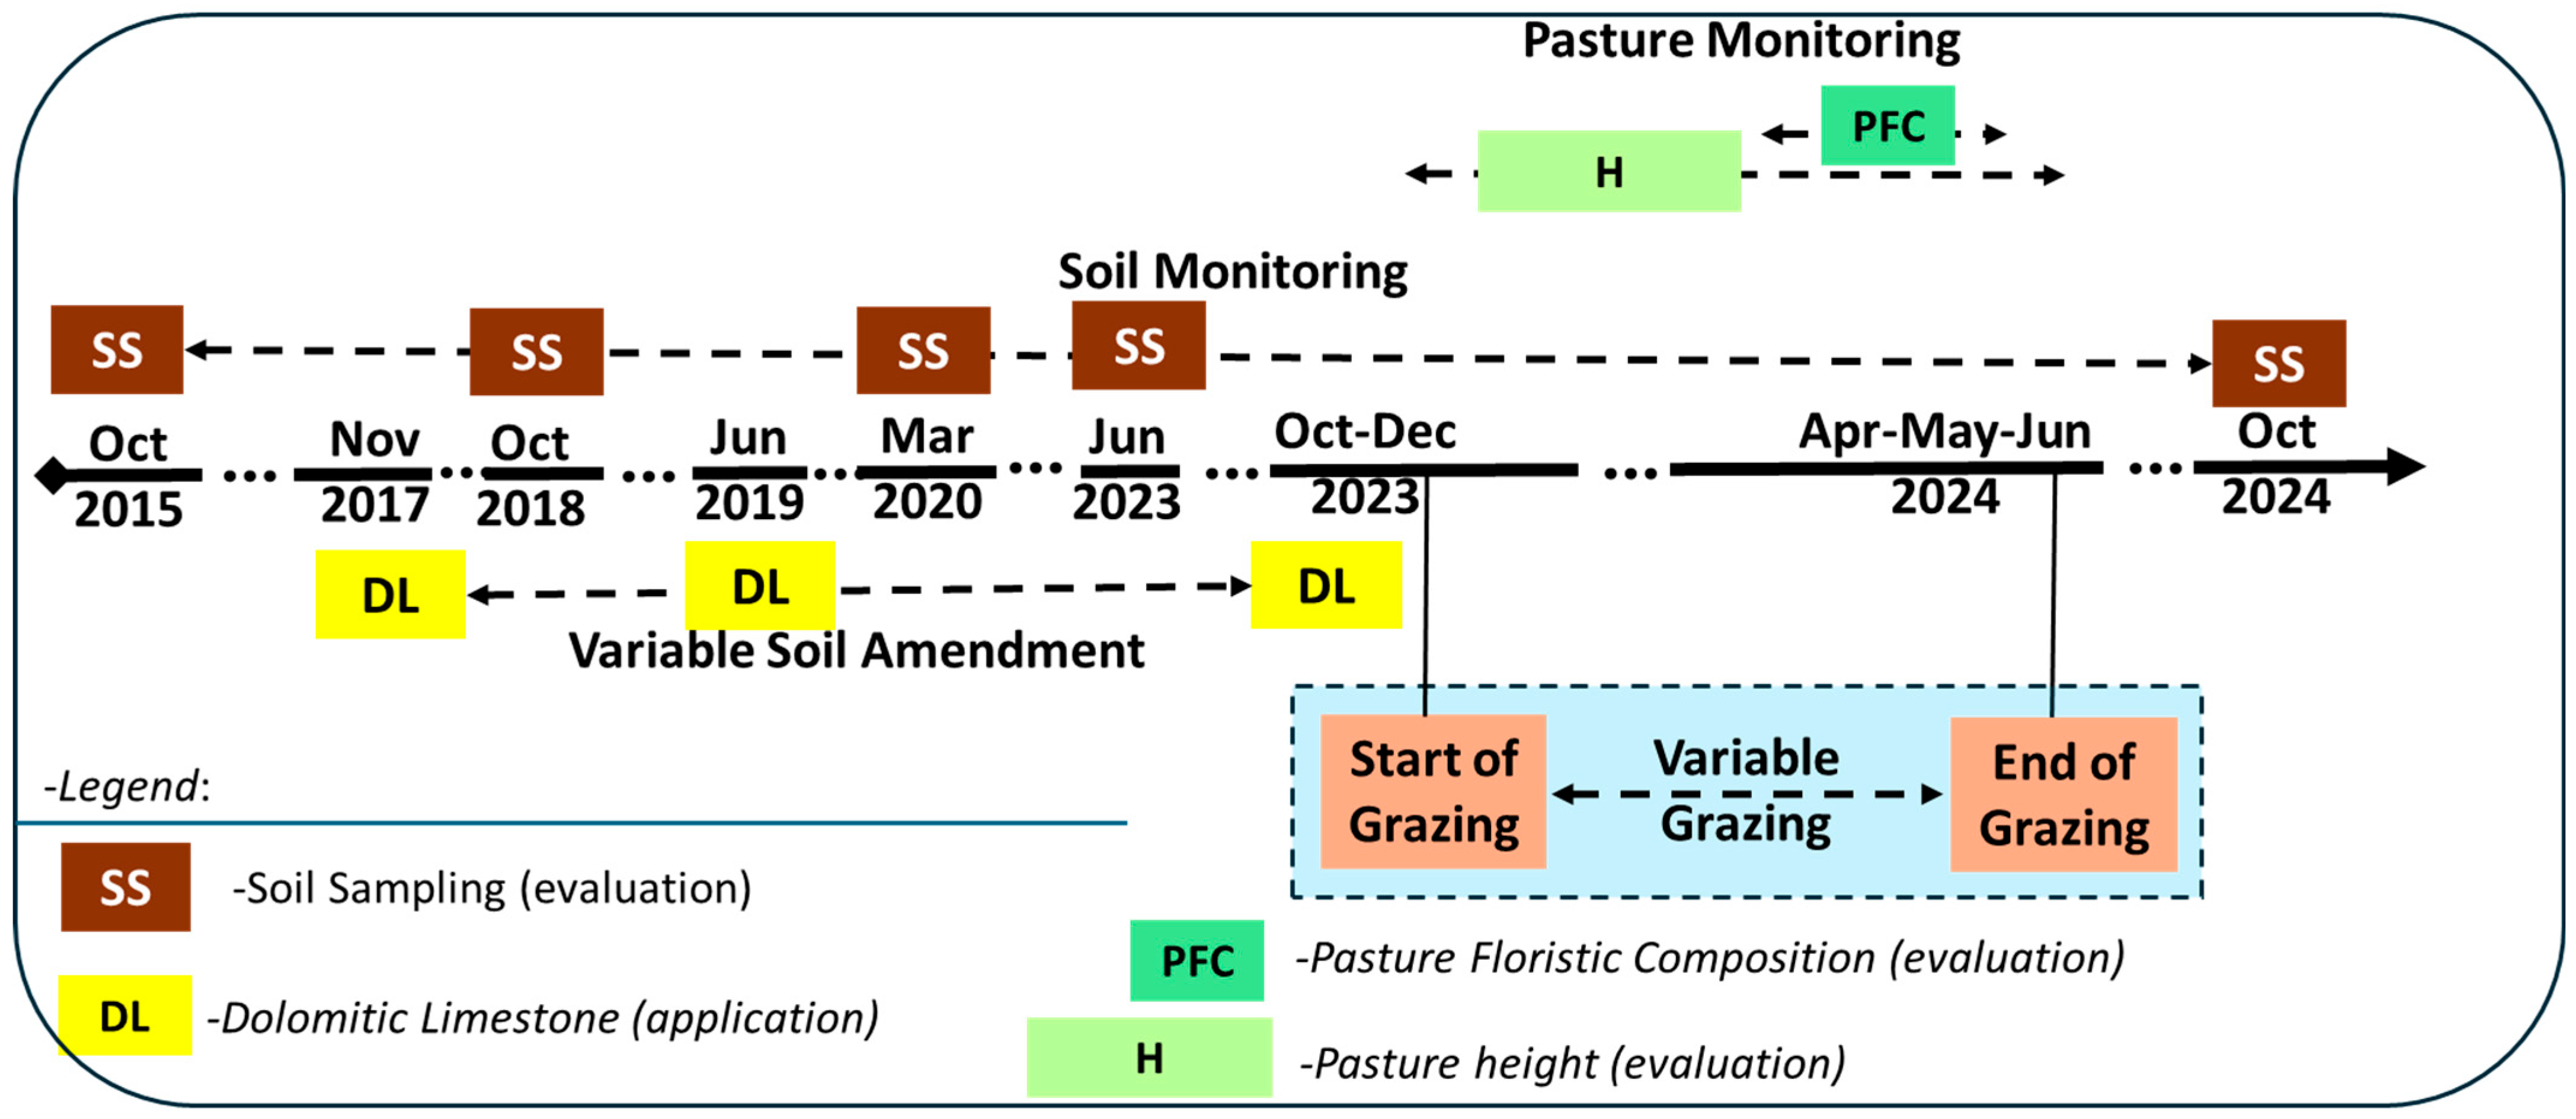
The soil of the experimental field is a Cambisoil [19], derived from granite, with a slightly acidic pH [12]. Soil monitoring includes topsoil (0–0.30 m) sampling, carried out at the start of the global project (2015) and then at an interval of 2 or 3 years (SS, Figure 2). Throughout this long-term study (2015–2024), dolomitic limestone (1.5–2.0 tons ha−1; DL; Figure 2) was periodically applied to half of the study area (plots T3 and T4). The tree layer of the experimental area consists of holm oaks (Quercus rotundifolia Lam.) and cork oaks (Quercus suber L.), with an average density of around 10 trees ha−1. These dryland biodiverse pastures are grazed by sheep at different stocking rates depending on the treatment. Grazing began in December 2023 and continued until June 2024.
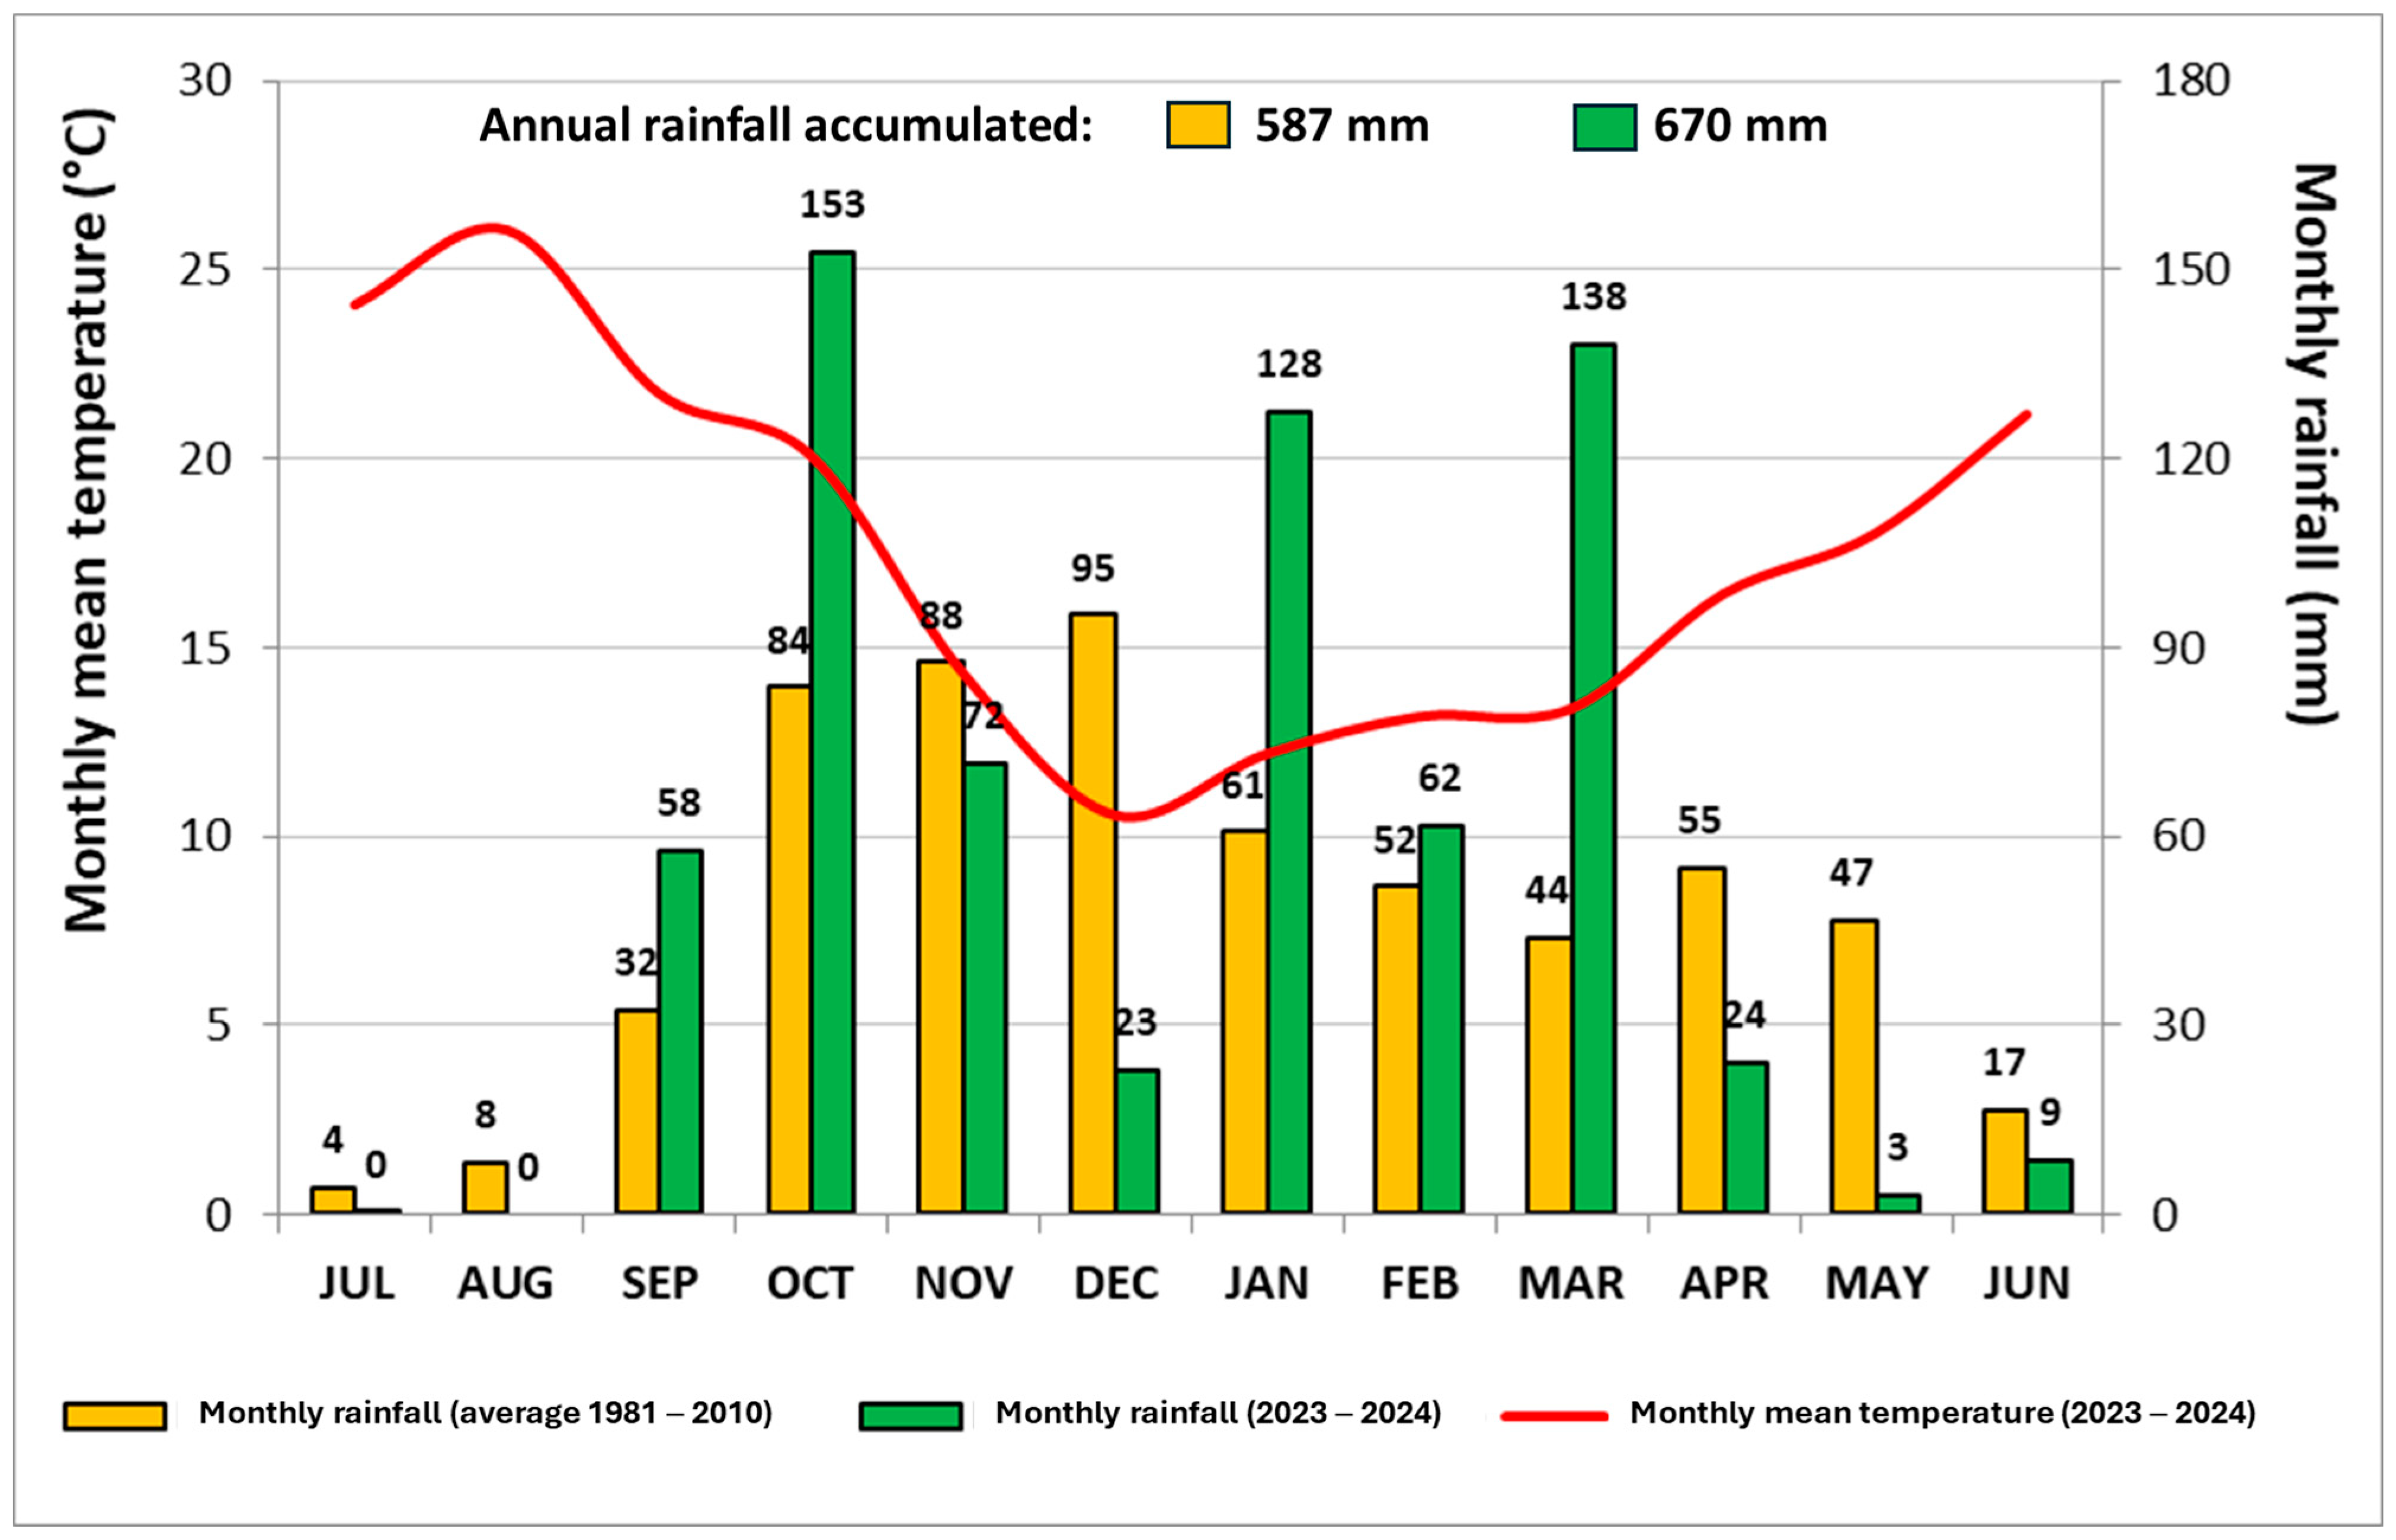
Figure 3 presents the thermo-pluviometric diagram recorded at the Mitra Meteorological Station (38°31.50′ N; 8°01.00′ W) for the 2023/2024 agricultural year. A well-balanced distribution of rainfall across Autumn and Winter seasons, with values above the region’s average (represented by the thirty-year average from 1981 to 2010), was important for ensuring good pasture growth and development.

2.2. Soil Monitoring

Soil samples were obtained with a gouge auger and a hammer from a depth range of 0–0.30 m, on five sampling dates (SS, Figure 2): October 2015, October 2018, March 2020, June 2023, and October 2024. In each of the 48 geo-referenced sampling areas (3 m × 3 m), one composite soil sample (comprising five subsamples) was taken. Soil samples were kept in plastic bags and, in the laboratory, air-dried, sieved, and submitted to official methods of analysis [20]. To assess the impact of dolomitic limestone applications (November 2017, June 2019, and October 2023) on soil pH and the availability of Mg and Mn, the fine soil fraction (diameter <2 mm) was analyzed. Soil pH was determined in a 1:2.5 (soil: water) suspension using the potentiometric method, while Mg and Mn concentrations were measured by atomic absorption spectrometry. In June 2023, before the grazing trial of this study, soil samples were additionally analyzed for particle size distribution (texture: clay, silt, and sand content) using a sedimentographer. Additionally, these soil samples were processed for determination of: (i) organic matter (by combustion and CO2 measurement employing an infrared detection cell); (ii) P2O5 and K2O, extracted using the Egner-Riehm method (the first measured using the colorimetric method and the second measured with a flame photometer); and (iii) cation exchange capacity (CEC), extracted with ammonium acetate [21].

2.3. Pasture Monitoring

Pasture height (H, in cm) of the 48 sampling areas was measured with an electronic graduated ruler once a month, between December 2023 and June 2024. In each pasture sampling area (3 m × 3 m), three H measurements were carried out. The locations of H measurements were chosen by a senior researcher with expertise in grasslands to ensure they adequately represent the spatial variability.
Between April and June 2024, a botanical expert specializing in conservation biology conducted a floristic inventory of species present in each sampling area, assessing the pasture floristic composition (PFC). Abundance of each species was visually estimated from the vertical projection of plant canopies onto the ground as a percentage of the sampling area [22]. Plant nomenclature follows Flora Iberica [23].
The floristic community was analyzed based on information considering different sets of data:
(i)
Composition—coverage of species and families (%);
(ii)
Vegetation structural parameters—total cover (%), green cover (%), bare soil (%) and tree leaf litter (%);
(iii)
Floristic community metrics—species and family richness (number) and diversity (Shannon–Wiener index).

2.4. Data Processing and Analysis

The processing and analysis of pasture data comprised several stages, ranging from data collection, dataset preparation, statistical analysis, to output of practical management decisions, which are schematically presented in Figure 4.
Descriptive statistical analysis (mean, standard deviation, and range) was performed for pasture parameters. Then, data analysis was carried out considering a two-factor experiment (soil pH correction, application vs. non-application of dolomitic limestone, DL vs. WDL; and grazing system, low, L vs. high, H stocking rate, SR), with a 95% significance level (p < 0.05). Statistical analyses were carried out using Primer 6+ and SPSS 28 software.
A score of relative importance, in all experimental fields and each plot, was calculated based on the mean of occurrence (mean abundance) × frequency (sensitivity). For example, a plant species that has an average abundance in the sampling area of 10% and is present in 6 sampling areas has a score (of relative importance) of 60. This was an initial approach to general characterization of the experimental field.
“Canonical Analysis of Principal Coordinates” (CAP) was used to identify the axes that best discriminate between plots, as a function of changes in species composition and based on the Bray-Curtis similarity coefficient. “Permutational multivariate analysis of variance” (PERMANOVA) was used to test significant differences in species and family composition between treatments. The “similarity percentage” (SIMPER) was used to identify which species and families contribute most to differentiating PFC in each treatment. The Mann–Whitney non-parametric test was used to detect significant differences between treatments for each structural parameter and metrics of PFC. Prior to ordination analysis, percentage data were transformed using [Asen(√x)] function.
To identify bioindicator species characteristic of each study area over the evaluation period, PFC data were normalized using the “log (x + 1)” transformation and analyzed through multilevel pattern analysis (Indicator Species Analysis—ISA), using a dedicated package in the “R” statistic software, version 4.5.1 for Windows (St. Louis, MO, USA). ISA calculates an indicator value (IV) for each species as the product of the relative abundance (specificity) and relative frequency (fidelity), expressed as a percentage. Indicator values range from 0, indicating a species is absent in a given group, to 100, representing species present in all samples of a group and absent from other groups. Pasture biodiversity was assessed using species richness and the Shannon–Wiener diversity index.
The spatial distribution of the six species with the greatest representation within the experimental field was characterized by estimating their occurrence at unsampled locations. To obtain a continuous variable, each location was defined as a 1 m2 unit, thereby enabling the computation and mapping of species densities.
Spatial interpolation was performed using ordinary kriging, which generated predictions for unsampled locations based on point measurements. The resulting kriged surfaces provided a detailed representation of the spatial patterns of each species. Raster maps were subsequently produced at a spatial resolution of 1 m2, a parameter specified in ArcGIS during the vector-to-raster conversion.
All spatial analyses were conducted in ArcGIS (version 10.5, ESRI Inc., Redlands, CA, USA) with the Geostatistical Analyst extension. For each dataset, omnidirectional experimental variograms were computed, and spherical theoretical models were fitted to describe the spatial dependence structure.

3. Results

3.1. Soil Amendment

A summary of the topsoil (0–30 cm) pH and Mg Mn−1 ratio in the experimental field is presented in Table 1. The positive evolution of pH in the areas where dolomitic lime was applied (fields 3 and 4) is evident when compared to the untreated areas (fields 1 and 2). The same is true for the Mg Mn−1 ratio, which is a good indicator of the soil’s response to lime application.
The results of soil analysis carried out in June 2023, before the grazing trial of this study, are presented in Table 2. The texture, classified as sandy loam soil (clay: 10–11%; silt: 11–13%; sand: 76–79%), is relatively homogeneous throughout the experimental field. The OM values can be considered high for this type of soil (3–4%), pH slightly acidic (5.5–6.1), with average values of phosphorus (45–91 mg kg−1) and relatively high potassium levels (90–130 mg kg−1). The main differences between treatments were observed in terms of OM and CEC (with higher values in T1), pH, and Mg Mn−1 ratio (with pH values closer to neutrality and a higher Mg Mn−1 ratio in areas where lime was applied, areas T3 and T4).

3.2. Pasture Structural Parameters

The results of the pasture parameters are shown in Table 3 (height, H, measured monthly between December 2023 and June 2024) and Table 4 (pasture coverage, assessed between April and June 2024).
The results of the Mann–Whitney test applied to pasture height (Table 3) show significant differences between treatments on all dates. On the first sampling date, before the animals entered the experimental field (5 December 2023), the plots that had been subjected to the application of dolomitic lime showed a tendency towards greater height, which, as you might expect, will translate into greater initial productivity. On the other dates throughout the growing season, and also as expected, the plots with less stocking rate (T1 and T4) showed greater pasture height than the plots with more stocking rate (T2 and T3). Several studies have concluded that the increase in animal load is inversely related to the height of the pasture [24,25].
In terms of pasture coverage (Table 4), the only parameter that showed significant differences between treatments was tree leaf litter, with clearly higher values in area T1, similar to what was observed in soil parameters, in terms of OM and CEC.

3.3. Pasture Floristic Composition and Diversity

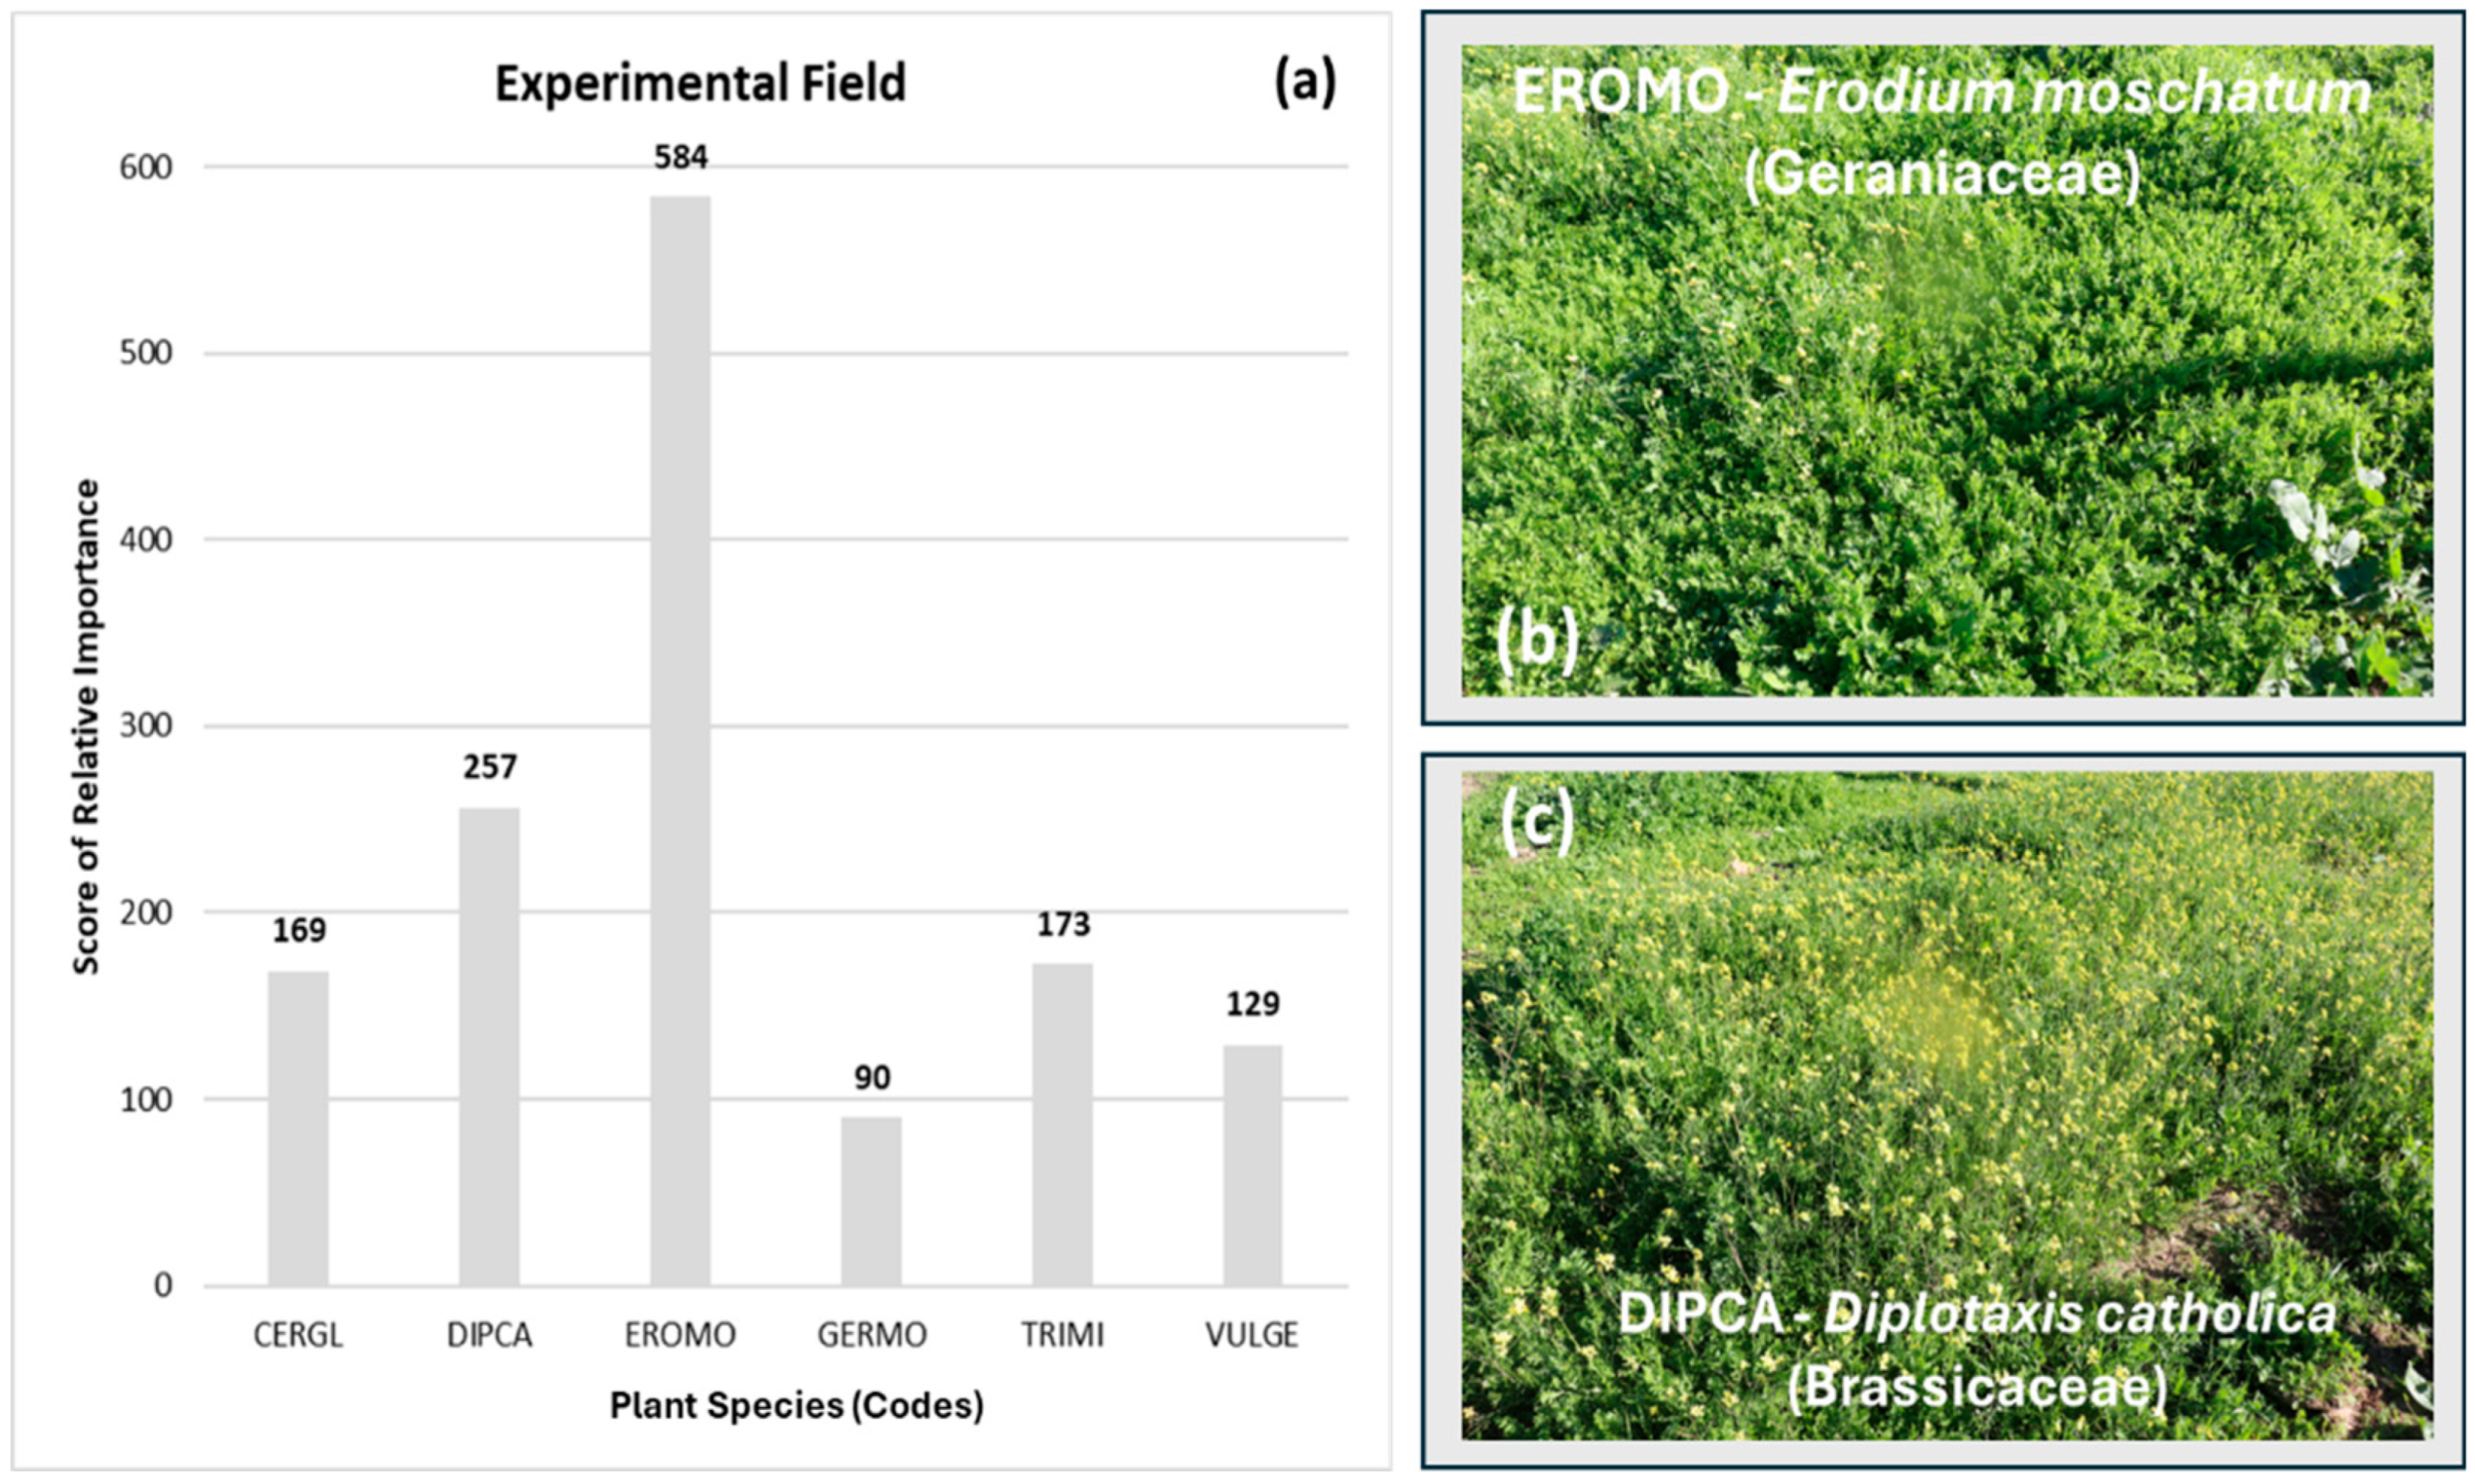
In this study, analyses of the floristic composition of the sampled plots revealed significant variation between the different grazing stocking rates and the application of dolomitic lime. A total of 79 plant species belonging to 20 families were identified in the experimental field. The plant species with the greatest representation in the experimental field was Erodium moschatum (score of relative importance, SRI = 584; Figure 5), followed by Diplotaxis catholica (SRI = 257), respectively, of the Geraniaceae and Brassicacea families.
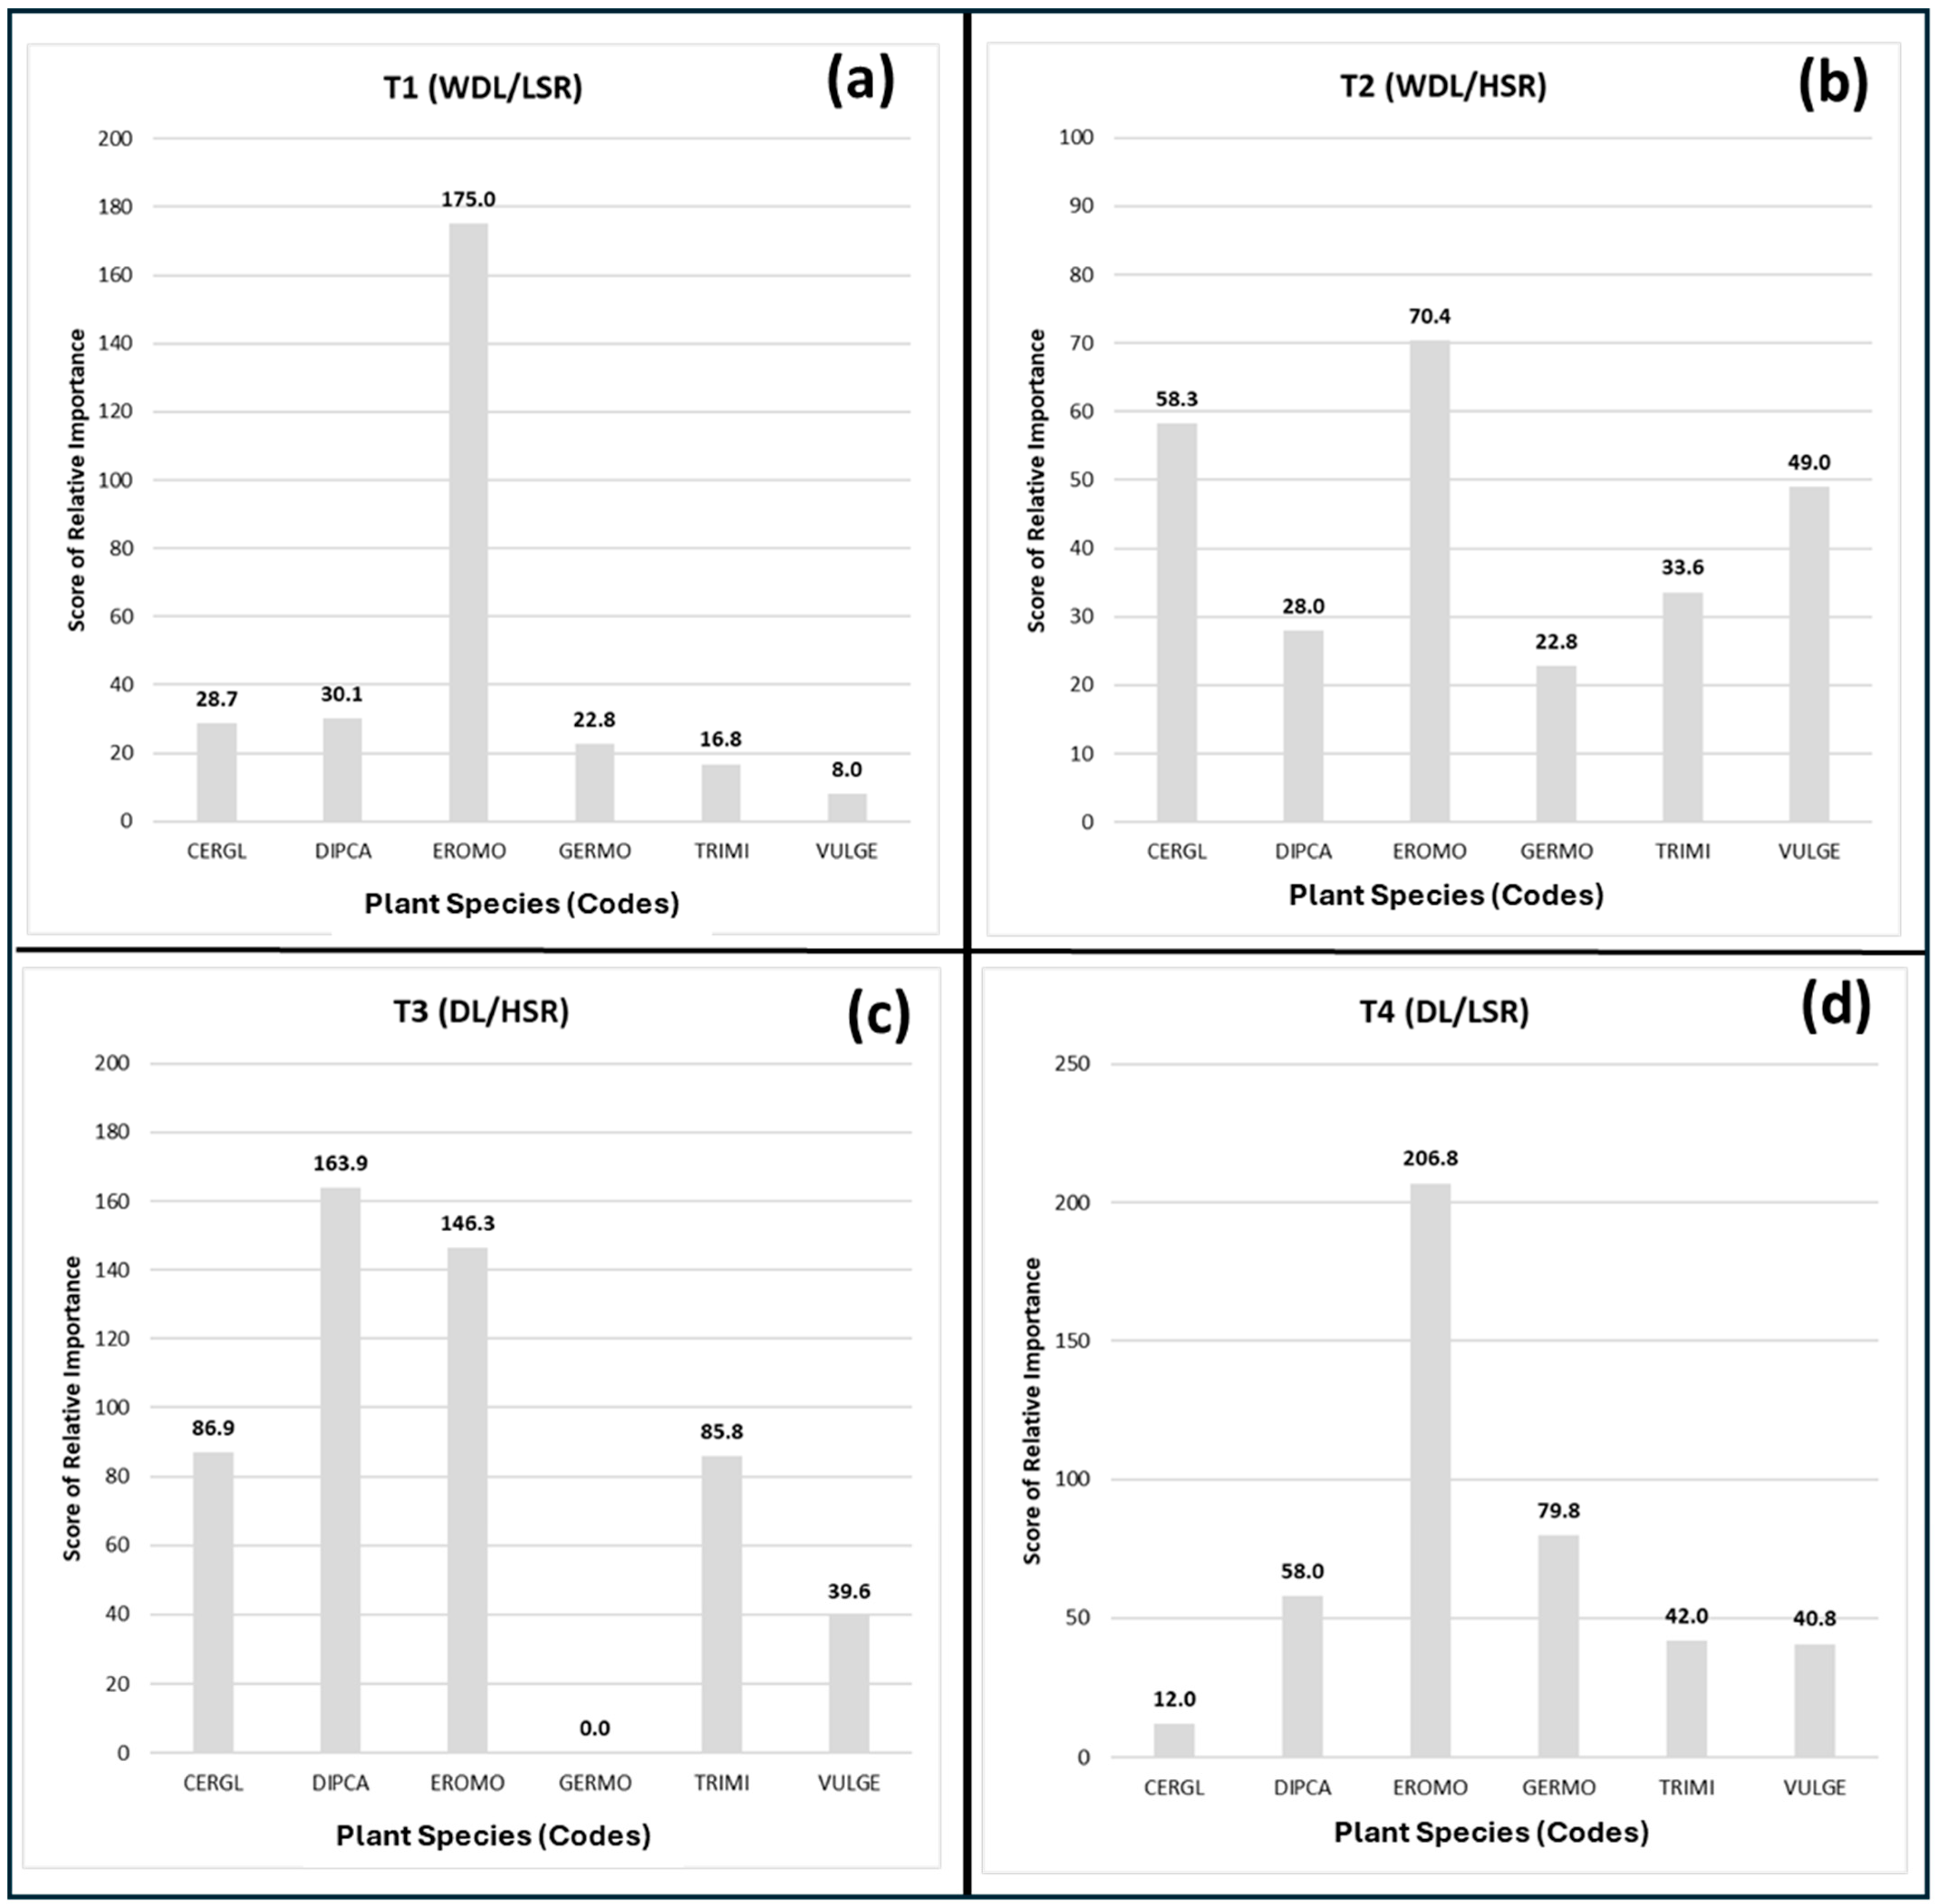
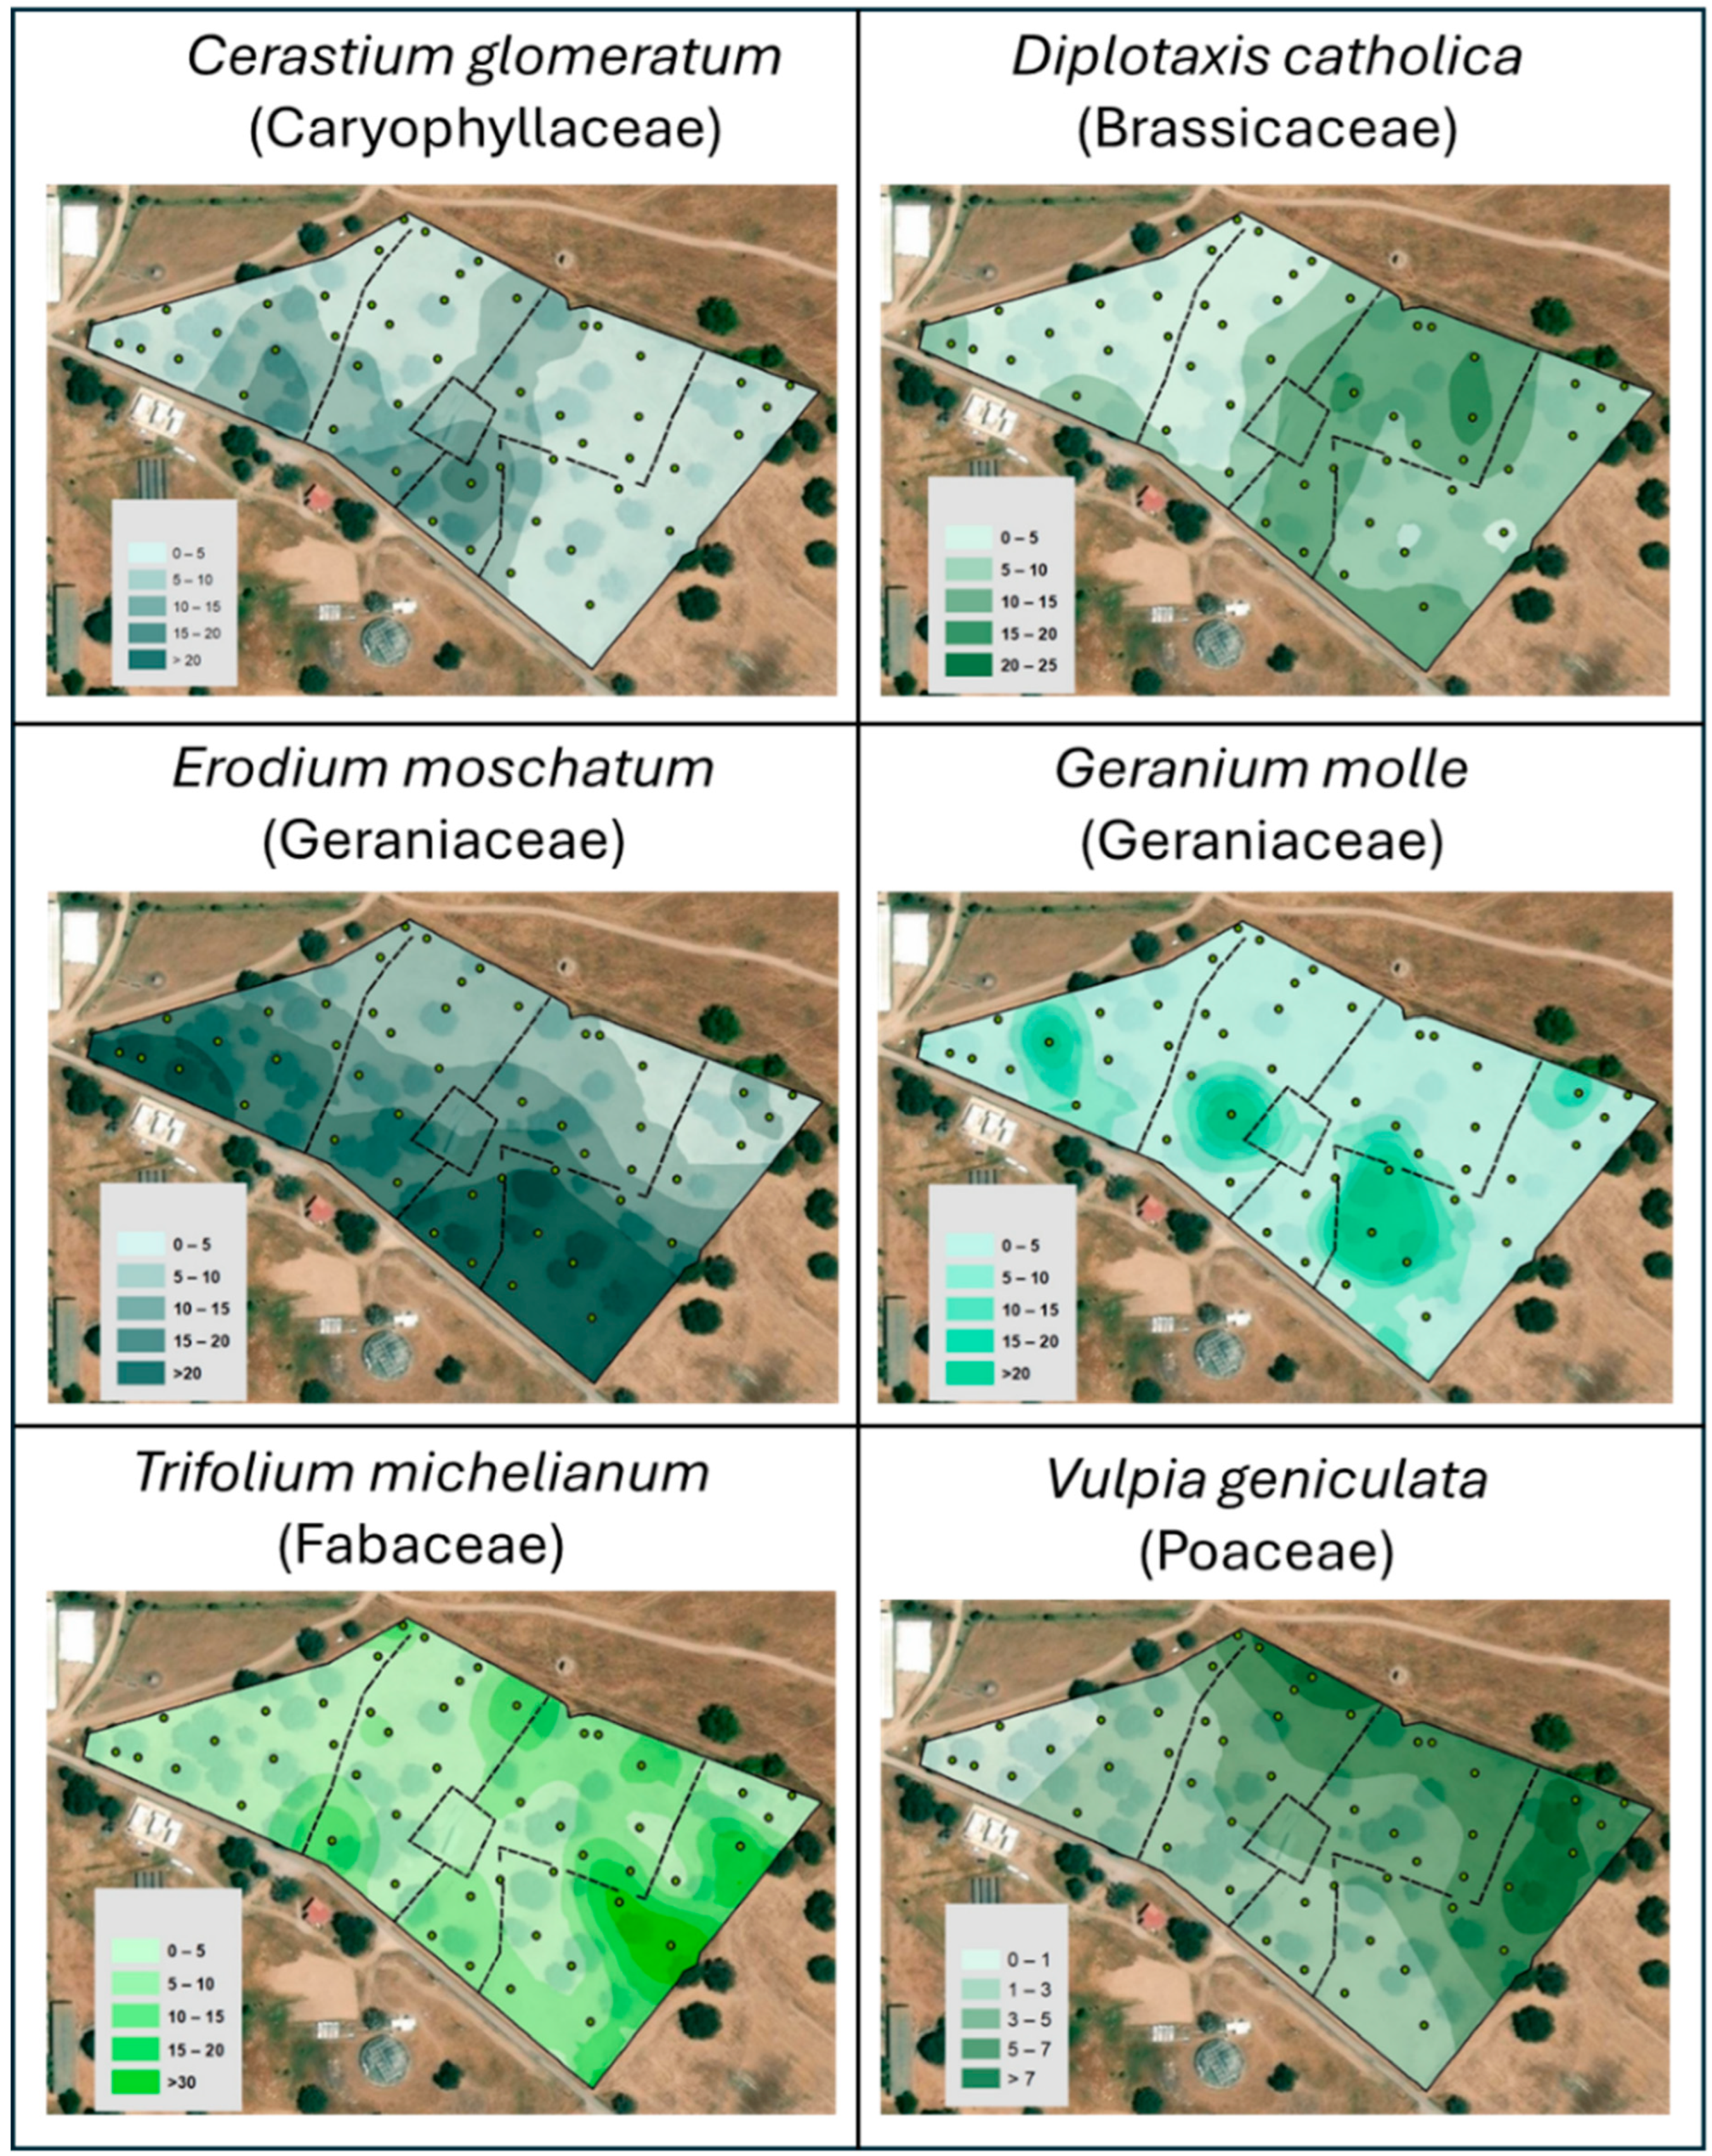
Other species with important representation are Trifolium michelianum (SRI = 173; Fabaceae), Cerastium glomeratum (SRI = 169; Caryophyllaceae), Vulpia geniculata (SRI = 129; Poaceae), and Geranium molle (SRI = 90; Geraniaceae). The SRI of each of these six species in each plot (treatment) is presented in Figure 6a–d. The maps with the spatial distribution of these six species in the experimental field are presented in Figure 7. Some specific and complementary patterns between species are visible; this is the case of Erodium moschatum, which is distributed across all four plots (T1 to T4), most clearly in half of the area, with Vulpia geniculata showing a distribution in the complementary area. On the other hand, while Diplotaxis catholica shows a clear incidence in plot T3 and has practically no expression in the other areas (T1, T2, and T4), Geranium molle practically doesn’t exist in plot T3 but has patches in the other three areas (T1, T2, and T4).
Figure 8 shows the floristic community metrics (species and family richness, (a) and (b), respectively; species and family diversity, (c) and (d), respectively). The differences in species and family richness and diversity between corrected and uncorrected plots are more marked in LSR. Additionally, the plots corrected with lime, both under LSR and HSR, showed significant improvements in vegetation cover and vegetation structure compared to the uncorrected plots. Although LSR benefits from the application of lime, it requires a greater amount of it to achieve equivalent results, especially in terms of plant regeneration and soil cover, particularly with more productive species/families.

3.4. Changes in Pasture Plant Community Driven by Lime Application and Stocking Rate

The “Canonical Analysis of Principal Coordinates” (CAP; Figure 9) reveals a structured, though partly overlapping, separation among the four treatment groups (WDL/HSR, WDL/LSR, DL/HSR, DL/LSR), based on floristic composition influenced by dolomitic lime application and stocking rate. The first two canonical axes explain a substantial proportion of the variation (CAP1 = 79.14%; CAP2 = 58.93%), with axis 1 (r = 0.8896) distinguishing plots with and without lime application, and axis 2 (r = 0.7676) reflecting less evident differences in stocking rate.
The effectiveness of the CAP model was assessed using a leave-one-out cross-validation procedure, achieving a correct classification rate of 66.67%. The classification success was highest in DL/HSR (83.3%) and DL/LSR (75%), indicating clear floristic distinctiveness in limed treatments. In contrast, classification rates were lower for WDL/LSR (50%) and WDL/HSR (58.3%), reflecting high internal heterogeneity and substantial overlap between these groups.
The statistical significance of group separation was confirmed by permutation tests with 999 permutations. Both the trace statistic (tr(Q’HQ) = 1.7231; p = 0.001) and the squared canonical correlation of the first axis (δ12 = 0.7914; p = 0.001) indicate that the observed multivariate structure is highly significant.
The ordination diagram shows a clear gradient from WDL to DL treatments along axis 1, indicating the determinant influence of lime application on species composition. Plots with lime application (DL) are floristically distinct: i) when the stocking rate is high (DL/HSR), the community is dominated by several functionally diverse species such as Diplotaxis catholica (DICAT), Trifolium michelianum (TRMIC), Cerastium glomeratum (CEGLO), and Plantago lagopus (PLLAG); ii) when the stocking rate is low (DL/LSR), the community is dominated by certain species such as Lolium perenne (LOPER), Lolium rigidum (LORIG) and Medicago polymorpha (MEPOL). Conversely, plots without lime application (WDL) show considerable overlap, regardless of the stocking rate, and are dominated by species such as Rumex pulcher (RUPIL), Trifolium glomeratum (TRGLO), Trifolium cernuum (TRCER), and Agrostis pourreti (AGPOU). Nevertheless, a higher stocking rate (WDL/HSR) shows more proximity to the floristic communities of DL/HSR plots.
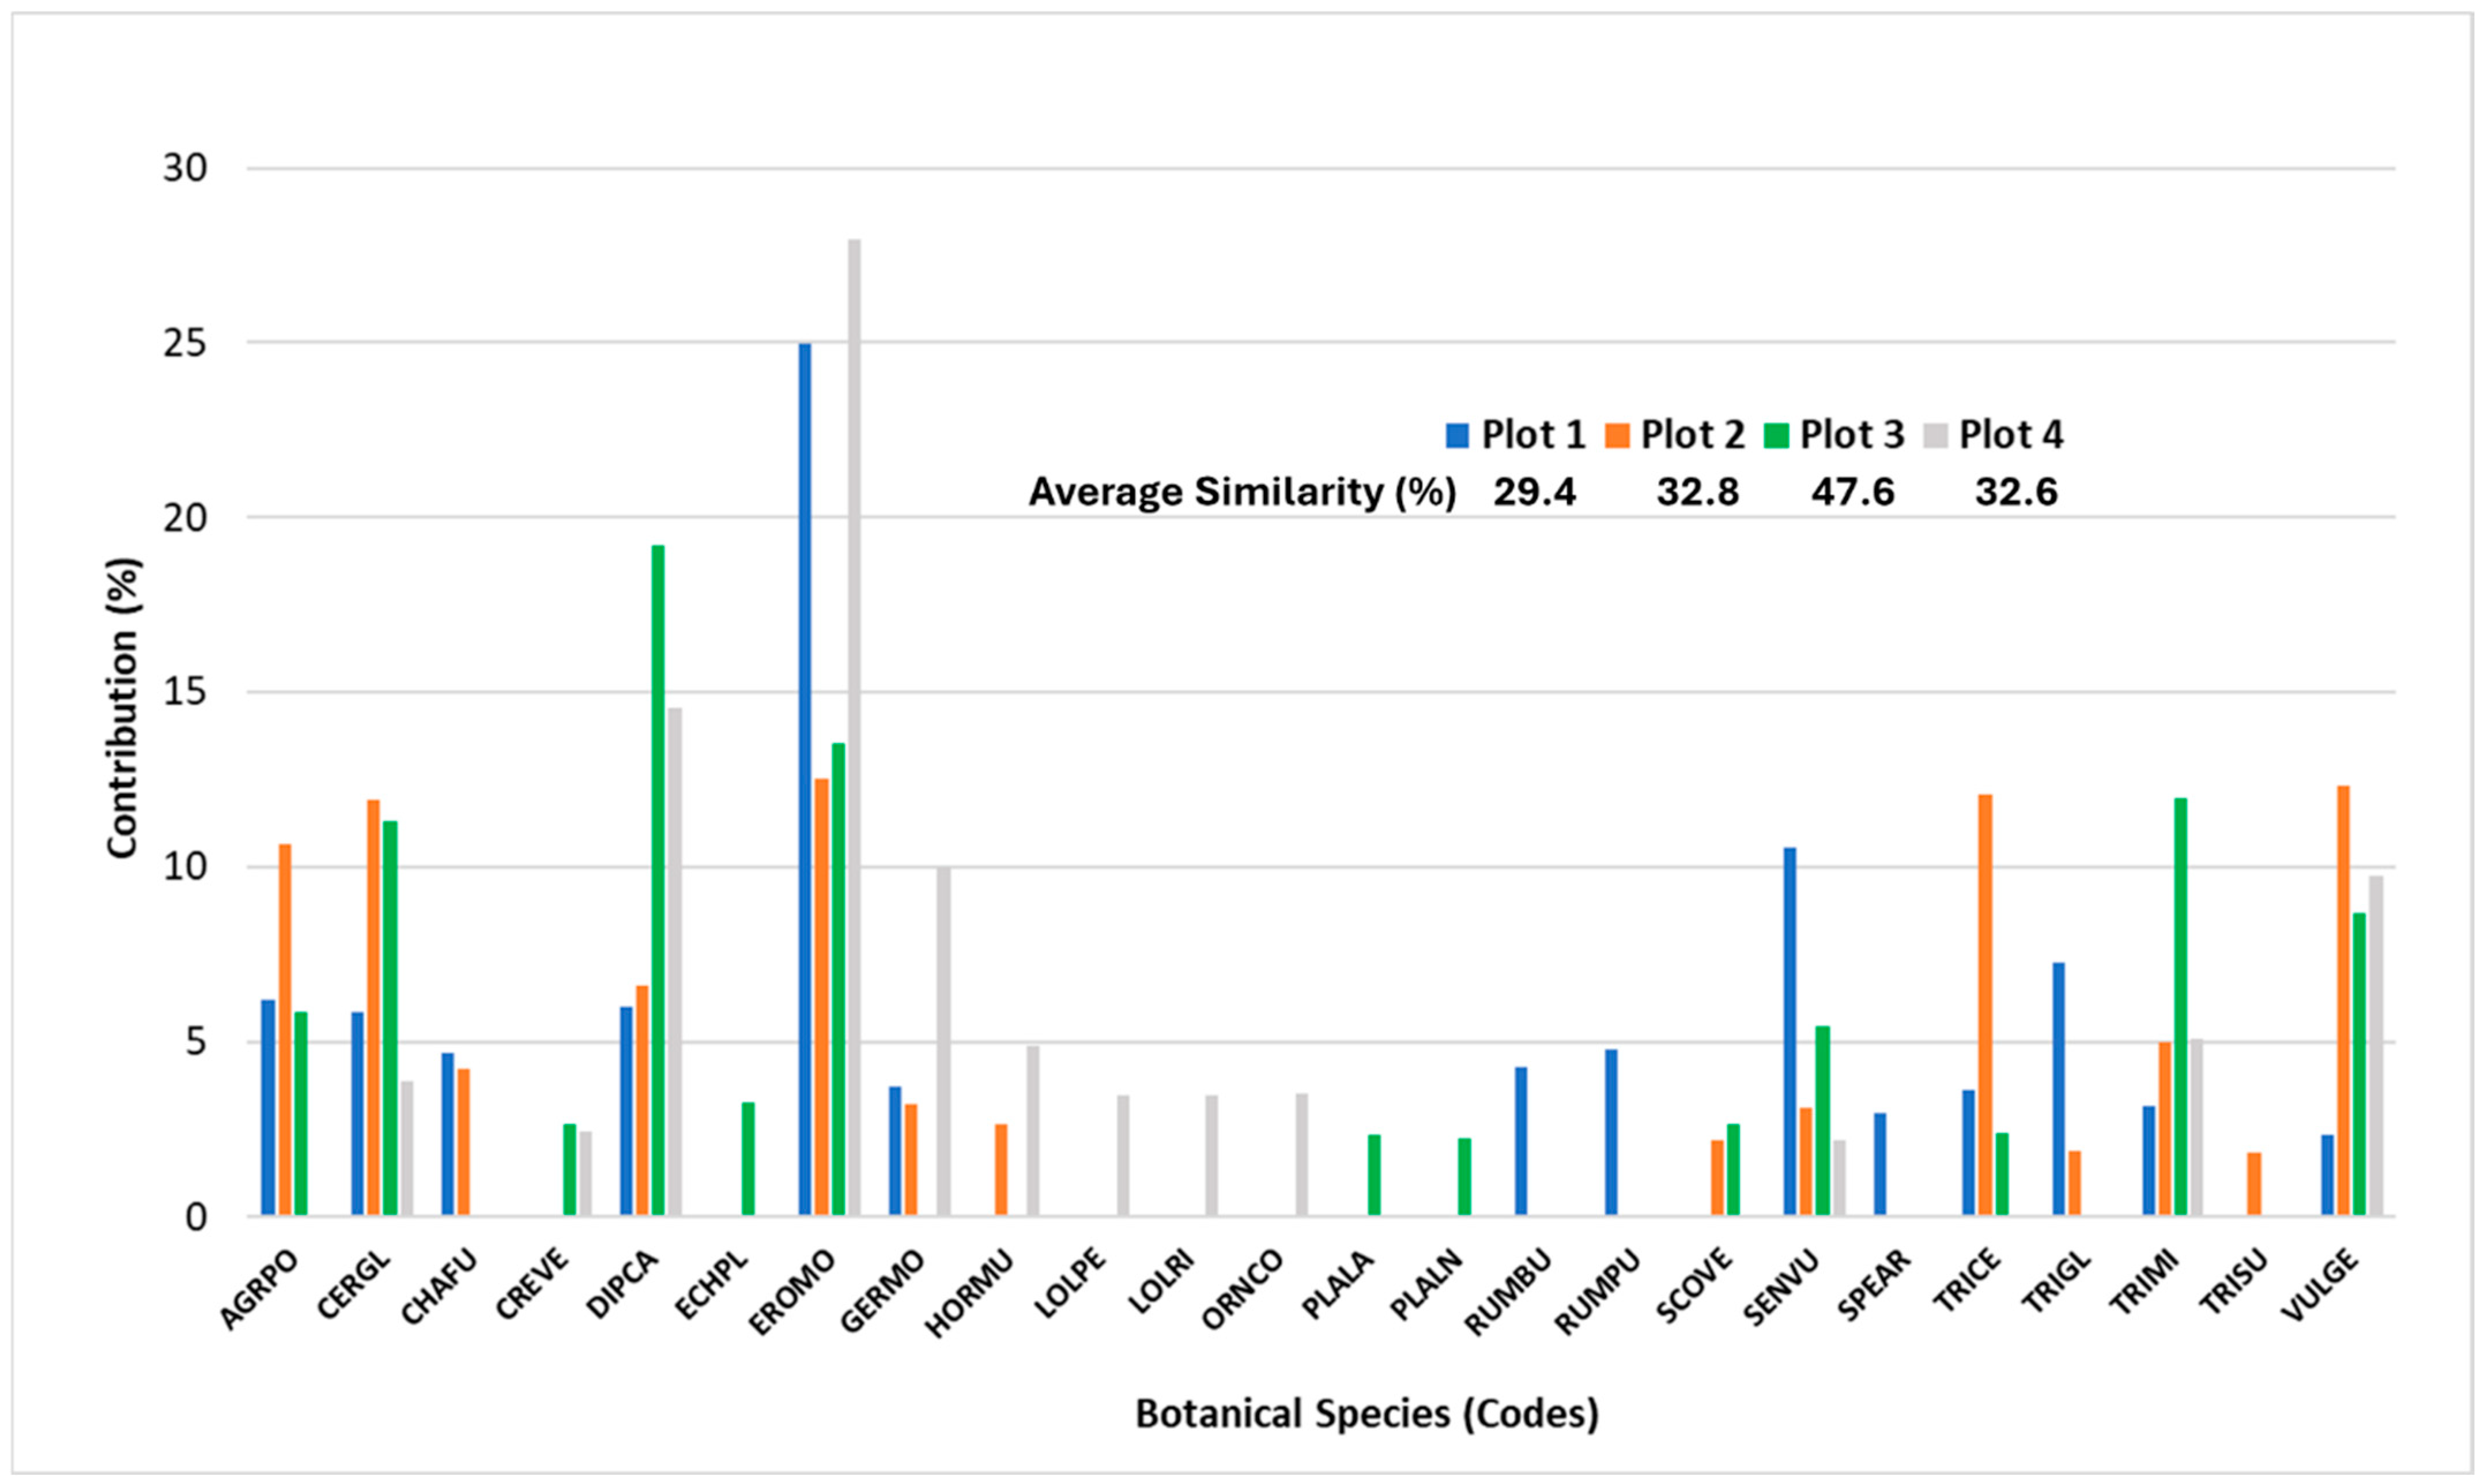
The “similarity percentage” (SIMPER) was used to identify which species and families contribute most to differentiating PFC in each treatment (Figure 10 and Figure 11, respectively). The more abundant a species or family is within a group, the more it will contribute to the intra-group similarities. Based on this analysis, Erodium moschatum is the species with the greatest contribution to similarity in treatments 1 (25.0%) and 4 (28.0%), both with low SR. In treatment 1, in addition to the aforementioned species, Senecio vulgaris (10.5%) and Trifolium glomeratum (7.3%) make a significant contribution. In treatment 4, Diplotaxis catholica (14.5%), Geranium molle (10%), and Vulpia geniculata (9.7%) show a relevant contribution. On the other hand, in the plot amended with lime and HSR (T3), Diplotaxis catholica made the greatest contribution to similarity (19.2%), followed by Erodium moschatum (13.5%) and Trifolium michelianum (12.0%). In regard to treatment 2 (uncorrected and high SR), no single species stands out, but 5 species make a similar contribution: Erodium moschatum, Vulpia geniculata, Trifolium cernuum, Cerastium glomeratum, and Agrostis pourretti (12.5%, 12.3%, 12.1%, 11.9% and 10.6%, respectively).
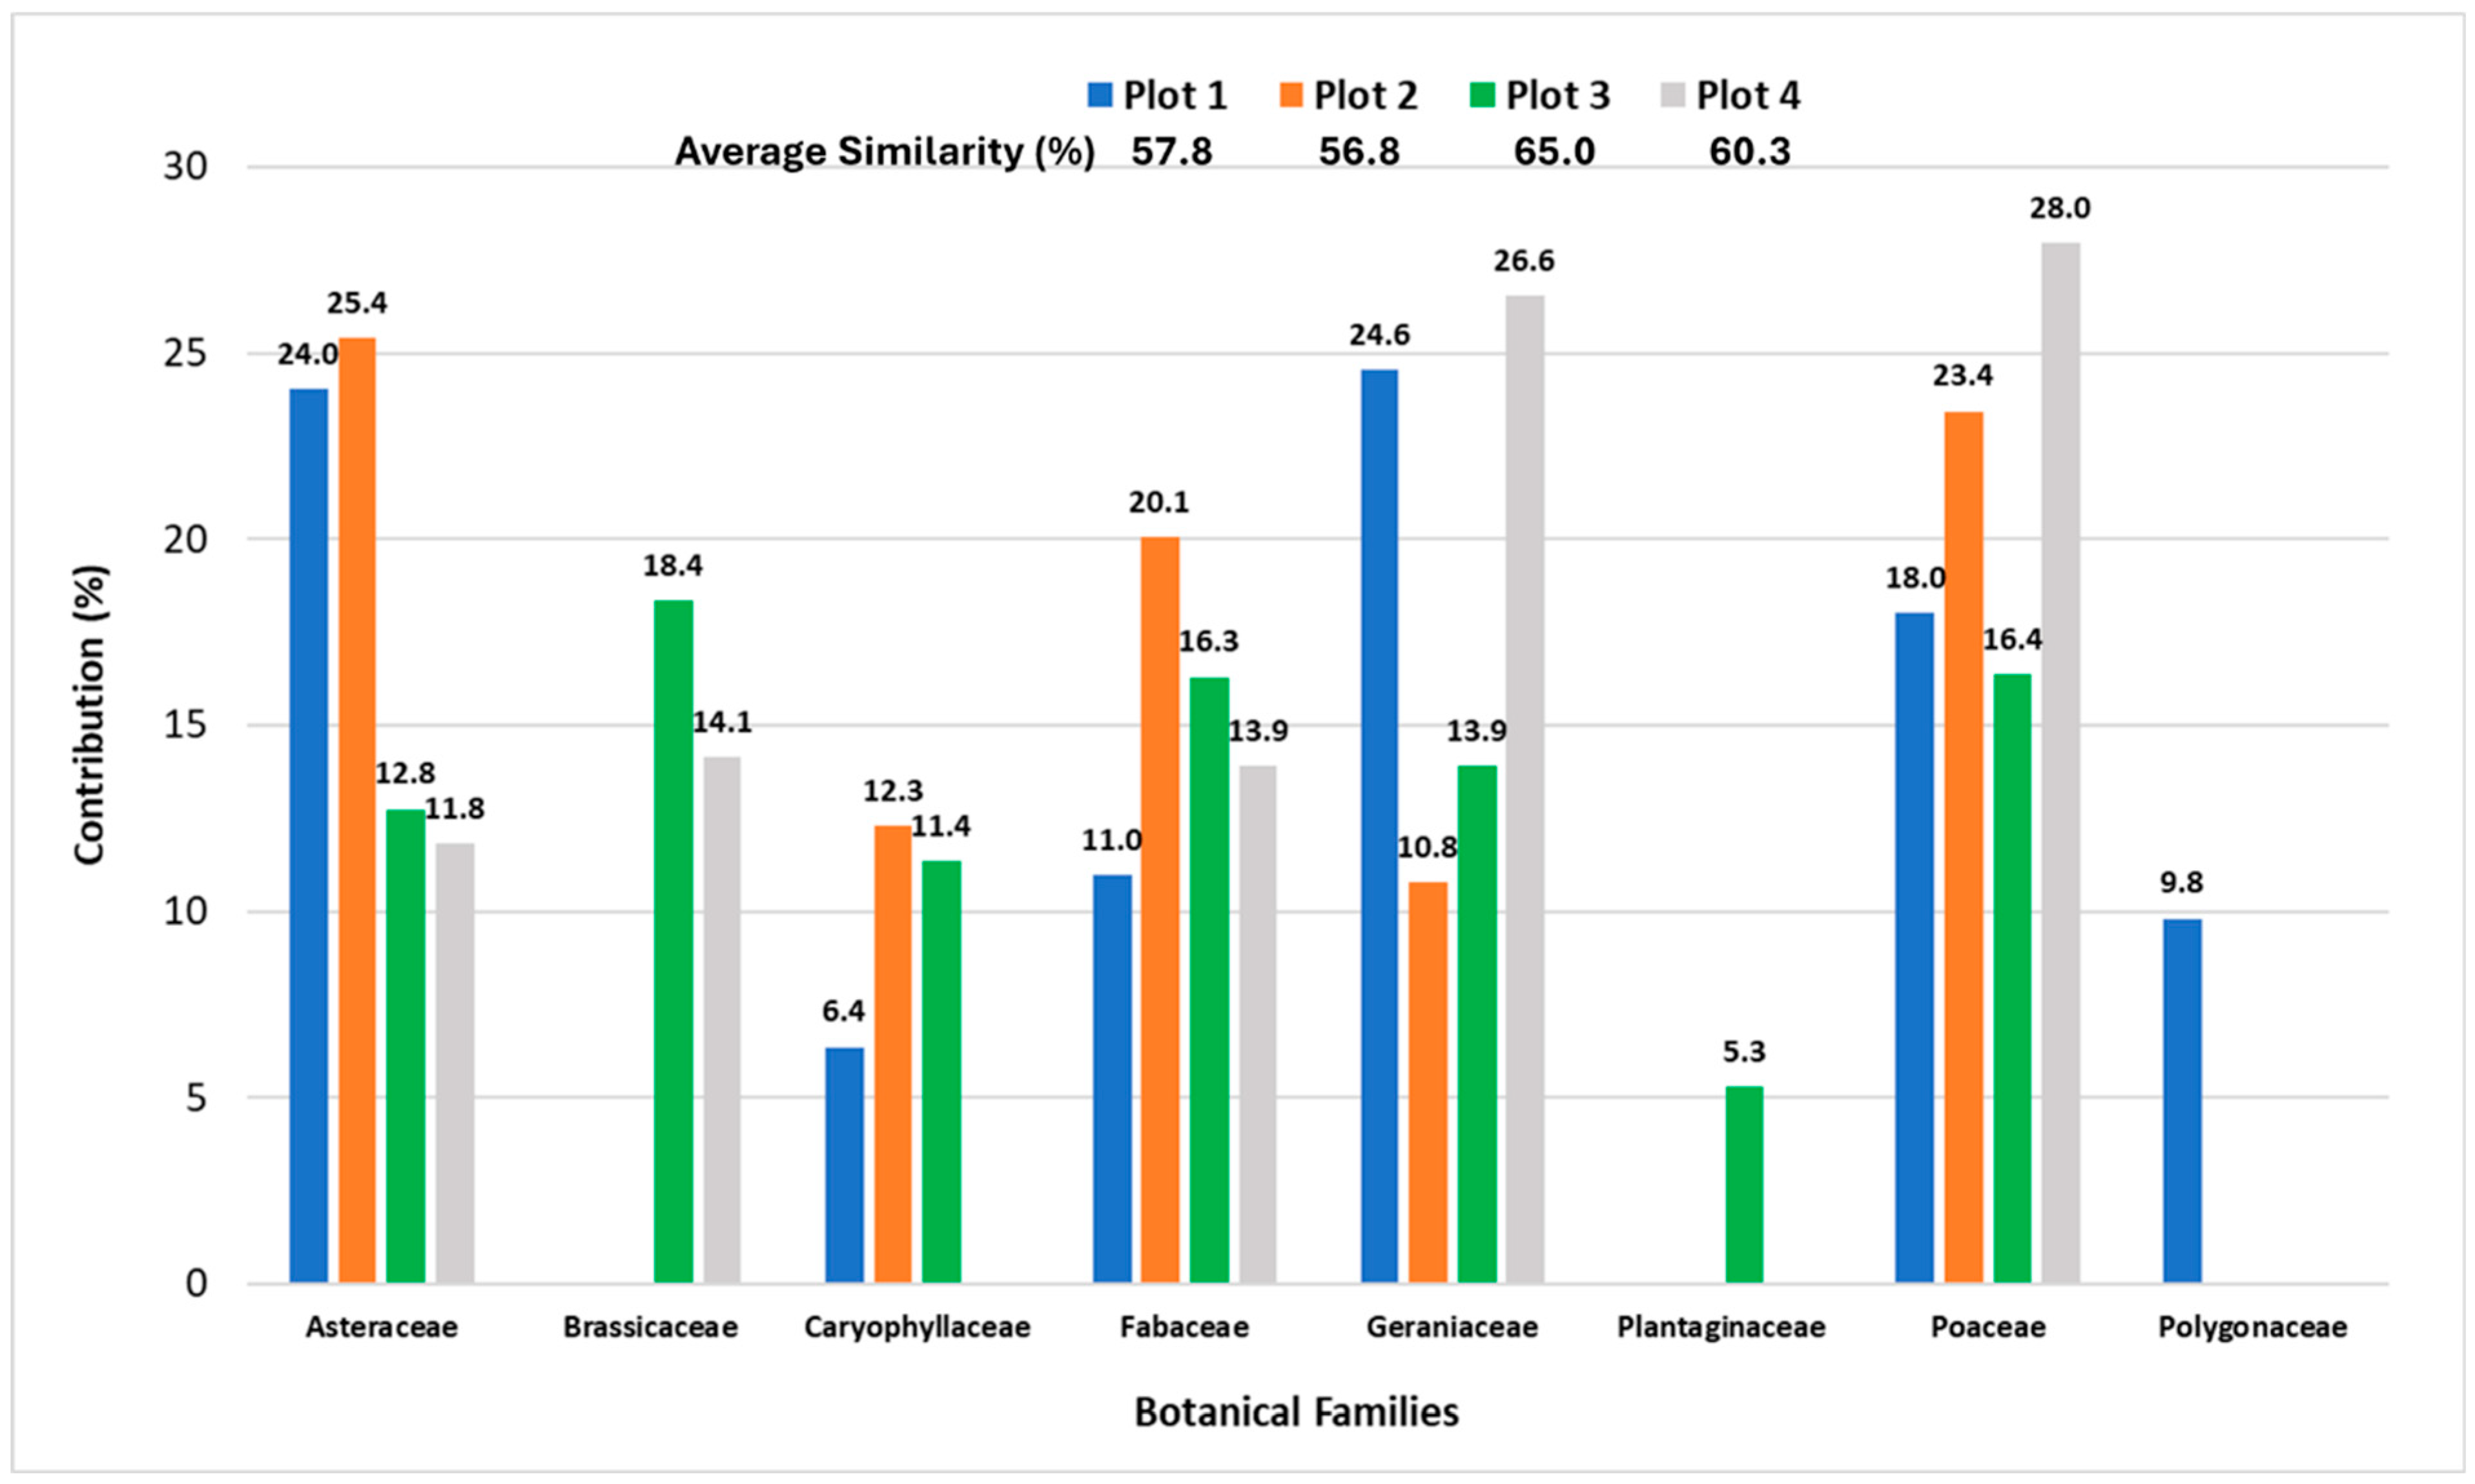
Regarding families, SIMPER analysis (Figure 11) showed that the families that contributed most to plots similarity were Geraniaceae (24.6%), Asteraceae (24.0%) and Poaceae (18.0%) in T1; Asteraceae (25.4%), Poaceae (23.4%) and Fabaceae (20.1%) in T2; Brassicaceae (18.4%), Poaceae (16.4%) and Fabaceae (16.3%) in T3; and Poaceae (28.0%) and Geraniaceae (26.6%) in T4.
Table 5 presents the results of “Permutational multivariate analysis of variance” (PERMANOVA), used to test significant differences in species and family composition in the two-by-two comparison between treatments. Based on species, only the comparison of T1 vs. T2 showed no significant differences. All other comparisons were significant. The comparison between T2 and T3 (uncorrected vs. corrected, with HSR) shows a less significant difference than that between T1 and T4 (uncorrected vs. corrected, with LSR). This indicates that, in high stocking rates, the application of lime causes a less marked change in the plant community (confirmed by the average similarity of T3: 47.6% based on species; 65.0% based on families). Thus, with less lime application, high stocking rates can achieve a more diverse floristic community, which represents an advantage in terms of cost reduction.
Based on families, the comparisons were not significant between T1 vs. T2, T1 vs. T4, and T2 vs. T4. Treatment T3 (DL/HSR) showed significant differences compared to all the other treatments.
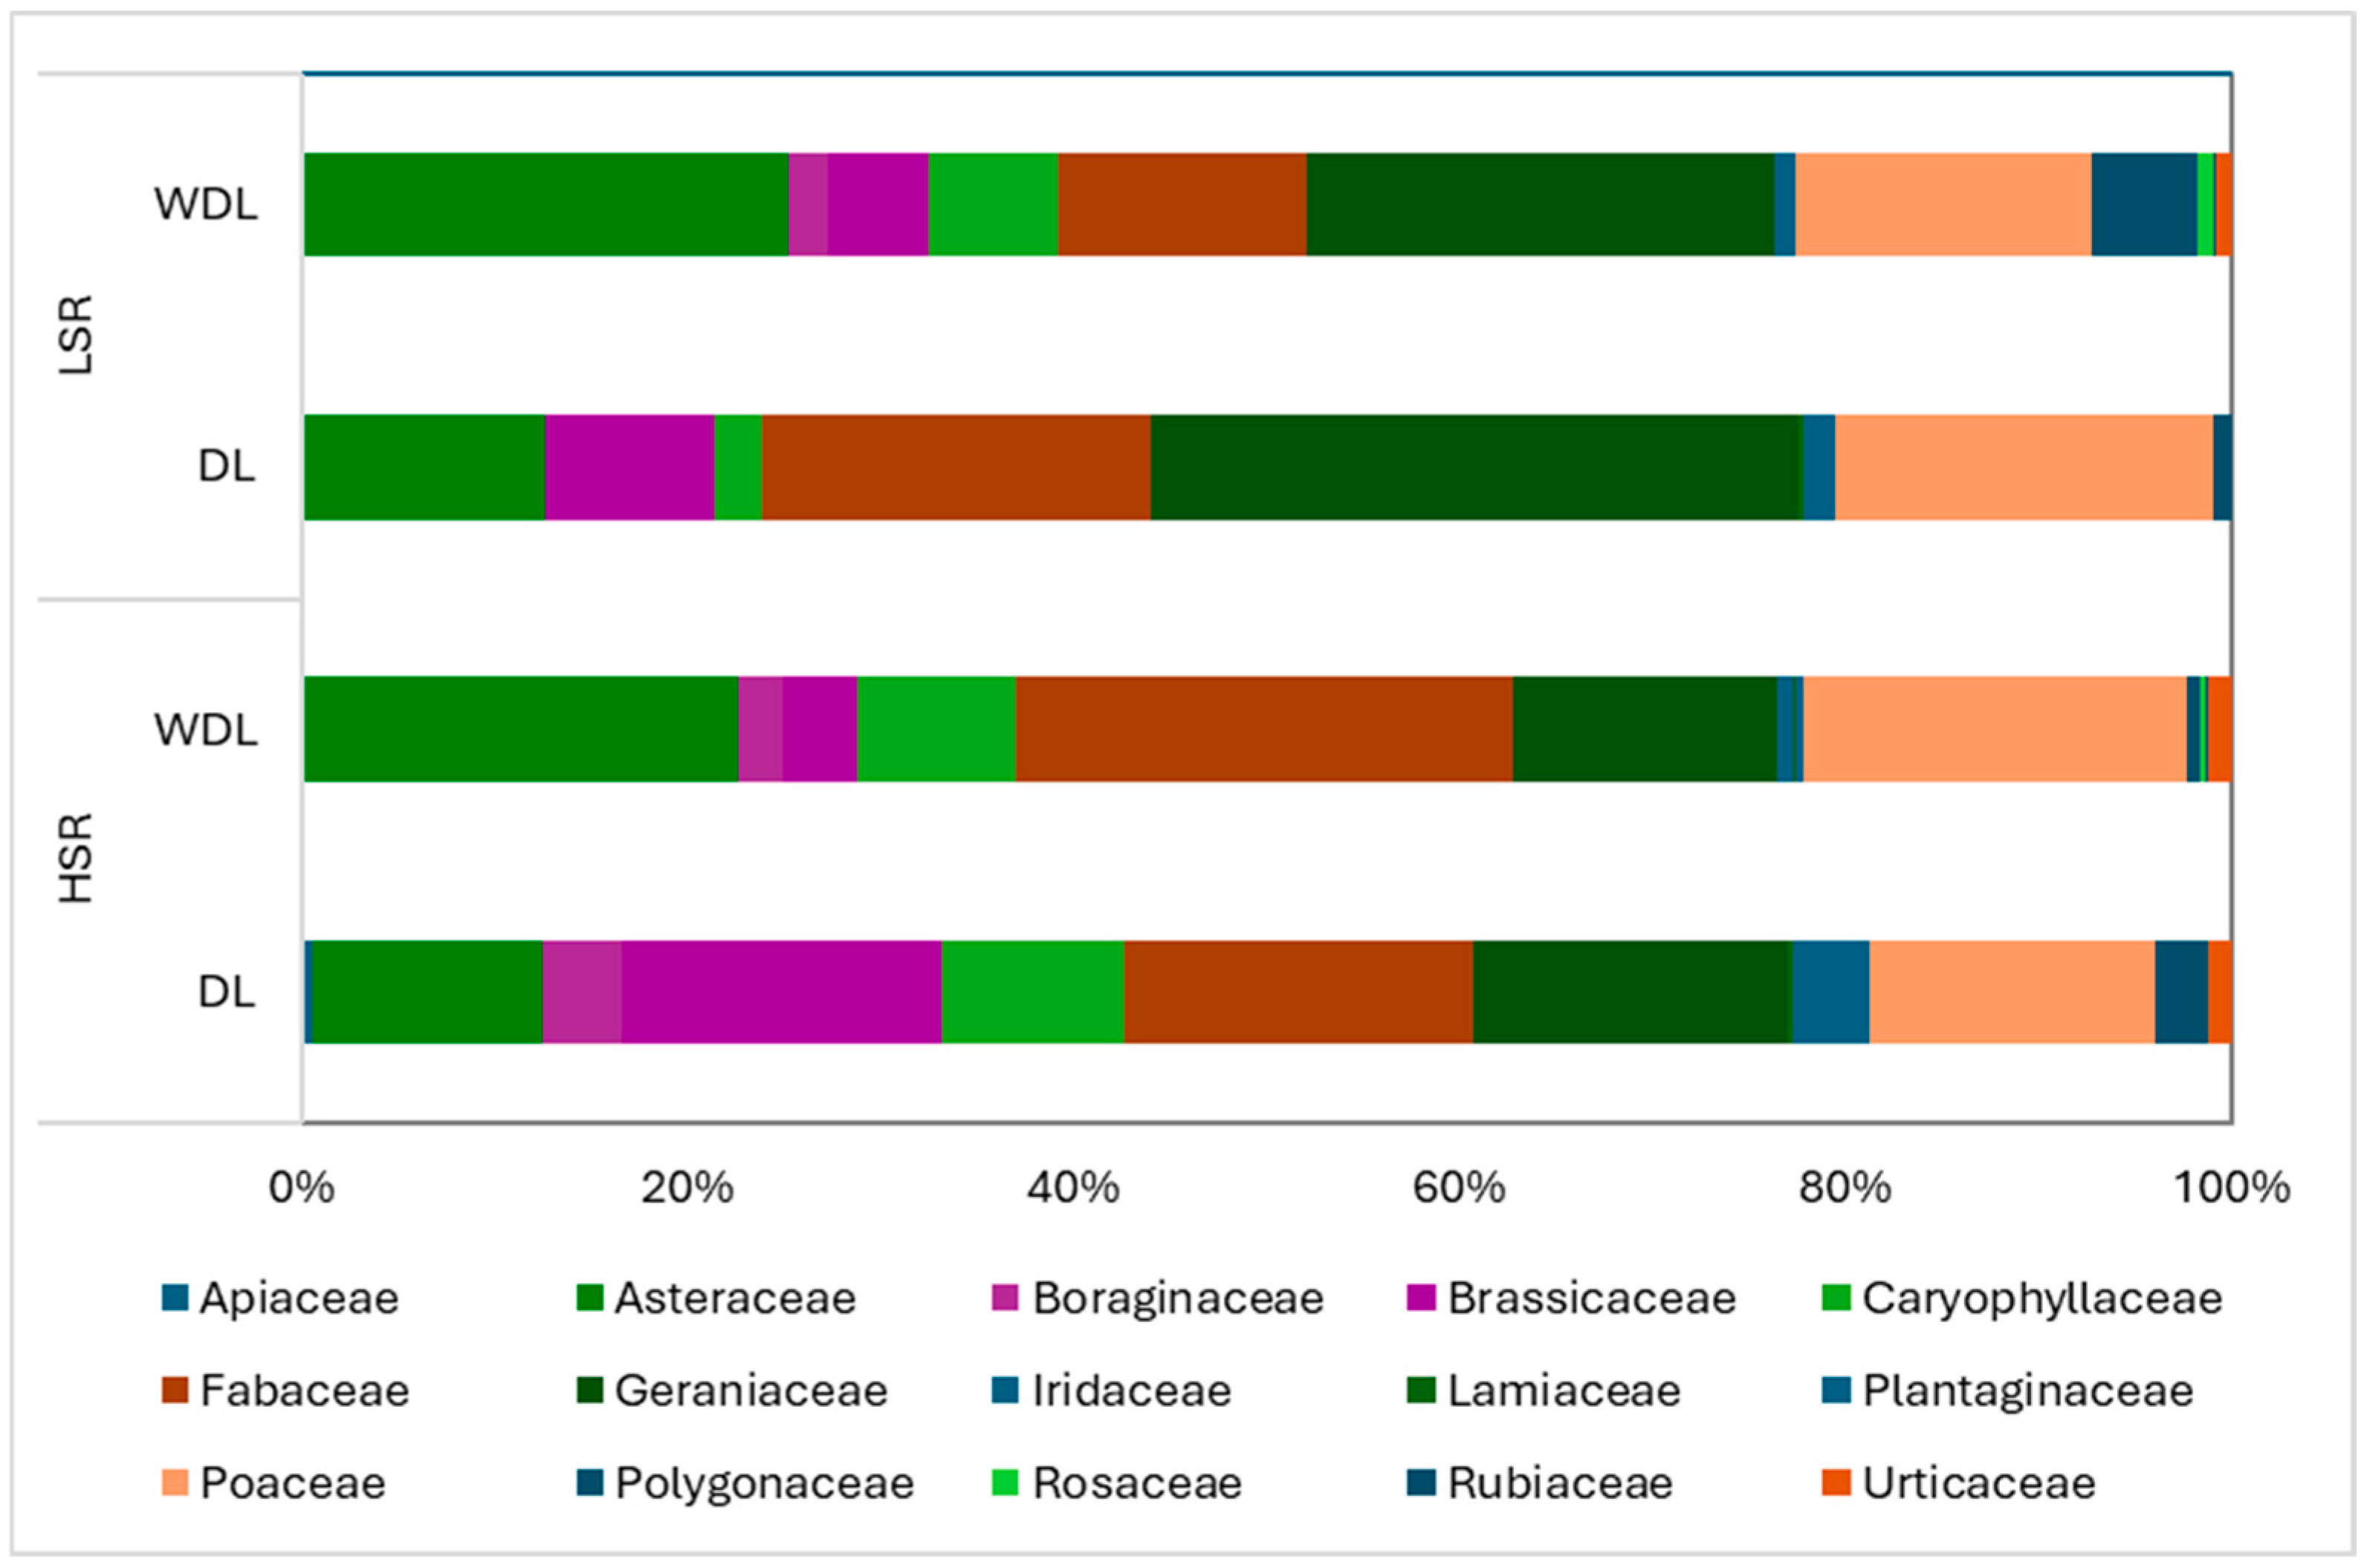
The relative coverage of the families (Figure 12) reinforces the previous results, with the plots with HSR and lime (T3) being more similar to the uncorrected plots (T2) than in the case of LSR, where the difference between T1 and T4 is more pronounced. This suggests that in the HSR regime, the vegetation may be more stable, requiring only moderate adjustment with lime to optimize the results.
On the other hand, a high abundance of legume species is recognized as an indicator of high-quality pastures; in other words, a decline in this functional group serves as the primary indicator of pasture quality degradation [26]. In this study (Figure 11 and Figure 12), the main difference in the presence of legumes occurred between plots T1 and T2. In untreated soil, the greater stocking rate (T2) allowed the presence of legumes to increase almost twofold (from 11.0% in T1 to 20.1% in T2). High biotic loads provide a homogeneous intake of all botanical species in autumn and winter, which enhances the presence of legumes in late winter and spring. Legumes benefit from grazing with high biotic loads because competition for light is reduced [27]. With low stocking rates (T1), the decreased presence of legumes may result from shading by taller, upright grasses, which limit solar exposure for the prostrate legumes and place them at a competitive disadvantage [28]. Since legumes are, in general, inhibited in acidic soils [29], intensifying the system by increasing stocking rate could be an advantageous alternative or complementary option to applying dolomitic lime to improve the floristic composition of the pasture.
The PERMANOVA results (Table 5) confirm the effect of lime application on the composition of floristic families. The difference between T1 (WDL/LSR) and T3 (DL/HSR) was the most significant (significant at 99%; Table 5), reflecting that the application of lime in HSR results in a substantial change in floristic composition. The comparison between T2 (WDL/HSR) and T3 (DL/HSR) showed a less significant difference, suggesting that HSR, combined with no lime application, can be effective in improving floristic diversity more economically, compared to LSR, where the difference between T1 (WDL/LSR) and T4 (DL/LSR) is more evident, reflecting the need for greater intervention to achieve the same results.
In the plots without lime application and with LSR (T1), the Geraniaceae, Asteraceae, and Poaceae families accounted for more than 66% of the total similarity (Figure 12). In the plots without limestone and with HSR (T2), the same families continued to dominate, but with a slight increase in the contribution of Poaceae and Fabaceae, which suggests a greater capacity for recovery in this treatment. In the plots corrected with lime and subjected to LSR (T4), the Poaceae and Geraniaceae became the most representative families, with a combined contribution of 54%, reflecting the positive response to lime and a more balanced floristic structure. Finally, in the plots corrected with lime and with HSR (T3), Brassicaceae, Poaceae, and Fabaceae dominated, with 51% of the total contribution, showing that soil amendment in HSR favors more productive families and promotes a more diverse community.
In HSR (comparison between T3 and T2), the differences in species richness and diversity between the corrected and uncorrected plots are smaller, with a moderate increase observed in T3 (DL/HSR). On the other hand, in LSR, the application of lime is essential to significantly increase floristic richness and vegetation cover. In addition, the T3 plots (DL/HSR) have an average vegetation height and green cover similar to the T2 plots (WDL/HSR, but with less need for soil amendment, which reinforces the hypothesis that HSR, adjusted with a more moderate application of lime, can be a more sustainable management strategy.
Collectively, the results show that the strongest floristic differentiation occurs between treatments with and without lime application, while stocking rate plays a secondary but still ecologically relevant role. Lime application enhances shifts in species composition, whereas its absence continues to constrain floristic differentiation regardless of stocking rate. Notably, even without the application of lime, the HSR regime (T2) promotes greater diversity in floristic composition compared to the LSR regime (T1). This suggests that: (i) the combination of HSR and lime application (T3) results in a more diverse floristic community and a significant presence of legumes; (ii) lime application is more efficient under HSR conditions, requiring less intervention to achieve comparable floristic improvements.
Statistical analyses can identify indicator plant species that serve as useful diagnostic tools, simplifying and understanding patterns, identifying potential risks of invasive plant expansion, and pinpointing ecological niches of species characterized by relatively narrow habitat preferences and specific microclimatic requirements [30]. The results of Indicator Species Analysis (ISA) are presented for all species (79 species) in Table A1 (Appendix A). In this table, the values “1” and “0” indicate, respectively, the presence (preference) of each species in each of four treatments. The IV is used to measure the association between a plant species and a specific area (treatment). The method of Dufrêne and Legendre [31] calculates the IV between the species and each group of sites and then searches for the group corresponding to the highest association value. Finally, this relationship is tested for statistical significance using a permutation test. In this study, there are 10 species with the highest IV (15), which means that they are present in all the treatments, as indicated by the p-value (“NA”): Carduus tenuiflorus, Cerastium glomeratum, Crepis vesicaria, Diplotaxis catholica, Erodium moschatum, Geranium molle, Rumex bucephalophorus, Senecio vulgaris, Trifolium cernuum, and Trifolium michelianum. In ISA, “NA” p-value indicates that a specific test, often a permutation test, was not statistically significant.
An overview of these results is presented in Figure 13. The dendogram shows two outputs of ISA, according to the approach: (i) without the combination of treatments; or (ii) with the combination of treatments. As a common denominator for both approaches (without or with a combination of treatments), Rumex pulcher appears as an indicator species of LSR in untreated soils (T1), while Trifolium cernuum or Trifolium subterraneum (approach (i) or (ii), respectively) were indicators of HSR in untreated soils (T2). From the same perspective (regardless of the approach, with or without interactions between treatments), Plantago lanceolata appears to be an indicator of HSR in treated areas (T3), while Lolium rigidum appears to be an indicator species of LSR in treated areas (T4).

4. Discussion

4.1. Changes in Pasture Plant Community Driven by Lime Application and Stocking Rate

Soil acidity limits agricultural production primarily through reduced nutrient availability and metal toxicity, such as from manganese (Mn) [11]. Additionally, varying tolerance of plant species to soil pH significantly affects pasture floristic composition [29]. According to Carvalho et al. [11], in acidic soils, which are predominant in the Montado areas of the Alentejo region, one of the low-cost amendments is the application of dolomitic lime as a way of improving soil fertility and, consequently, pasture productivity and quality. However, some studies have shown that soil acidity amendment based on dolomitic lime application is a slow and gradual process [12]. Surface application of amendments, as applied in this experimental field without incorporation into the soil, does not produce an immediate or significant increase in soil pH; instead, it leads to a gradual increase over time [32,33]. This was confirmed in this study (see results of Table 1) and is in line with previous results obtained in spring 2020, in the same experimental field, but in this case, with sheep in continuous grazing at low stocking rates [14]. Therefore, it is recommended to apply lime systematically and, at least once every two years, until the soil pH stabilizes near neutral [10].
There are not many published studies on the impact of soil amendment on the floristic composition of dryland biodiverse pastures under Montado in the Alentejo region (Southern Portugal). On the other hand, composition and functional diversity are recognized as among the most important ecological attributes of any ecosystem [34]. It is known that various pasture species are sensitive to low pH and/or elevated Mn levels, whereas others exhibit relative tolerance to soil acidity [10]. For instance, the growth of legumes is generally hindered in acidic soils, and these species can benefit from soil amendments [29]. However, very little is known about how soil correction can be enhanced by adequate grazing management, particularly animal stocking rates.
Although confirm that tolerance to soil acidity depends on the plant species [29], as a common denominator for both approaches of Indicator Species Analysis of this study (without or with combination of treatments), Rumex pulcher appears as an indicator species of LSR in untreated soils (T1) while Trifolium cernuum or Trifolium subterraneum (approach (i) or (ii), respectively) were indicators of HSR in untreated soils (T2). While plants of the Rumex genus, indicators of acidic soils [11], are identified as being of little interest to animals and may even be toxic, plants of the Trifolium genus, Fabaceae family (which includes the species known as legumes), in addition to having the advantage of fixing atmospheric nitrogen and thus increasing soil fertility [8], have high palatability and nutritional value [5,26].
Therefore, a high stocking rate could be an alternative or complementary strategy to lime application for improving the floristic composition of pastures on acid soils. These bio-indicators are therefore a strong reason for the interest in higher biotic loads (HSR) in untreated soils. However, in amended soils, plant bioindicators of HSR (Cerastium glomeratum, Diplotaxis catholica, and Plantago lanceolata or only the latter (approach (i) or (ii), respectively) are less interesting for animal feed than the bio-indicator species identified in LSR (Lolium rigidum and Medicago polimorfa or only the first one (approach (i) or (ii), respectively). The Lolium genus is a very productive grass (Poaceae family), re-establishing itself quickly after grazing, with good forage quality and high digestibility and palatability, especially in the early stages of the vegetative cycle [10], and is often recommended for integrating biodiverse pastures, in conjunction with legumes. Likewise, Medicado polimorfa is a species from the Fabaceae family that is very interesting in animal feed due to its digestibility and palatability, and is often recommended for integrating biodiverse mixtures with grasses, particularly with species of the Lolium genus [10]. These results seem to indicate that the effect of intensifying the system through higher stocking rates is more advantageous in untreated soil.
In short, this study seems to indicate that the differences between amended and unamended plots are less pronounced in HSR (WDL/HSR and DL/HSR, T2 and T3, respectively) than in LSR (WDL/LSR and DL/LSR, T1 and T4, respectively), which suggests that HSR benefits more easily from the application of lime and requires less intensive intervention (lower soil amendment costs) to achieve good results, without compromising pasture quality (a balanced floristic composition and plant structure). HSR with lime application will be the most appropriate strategy for optimizing pasture management, providing productivity at a lower cost.
The approach (ii) of ISA also identified the following indicator species, involving two or more treatments:
(i)
Spergula arvensis as an indicator of untreated soils (T1 + T2) and Plantago lagopus as an indicator of treated soils (T3 + T4);
(ii)
Scorpiurus vermiculatus as an indicator of high stocking rate (T2 + T3) and Lolium perenne as an indicator of low stocking rate (T1 + T4);
(iii)
Agrotis pourreti and Trifolium glomeratum as indicator species that respond negatively to treated soils and low stocking rate (T1 + T2 + T3);
(iv)
Vulpia geniculata an indicator species that responds negatively to untreated soils and low stocking rate (T2 + T3 + T4).
The results of this work refer to a previous study in the same experimental field, based on ISA, which showed that the influence of tree canopy on PFC was greater than that of soil pH correction [18]. However, this outcome was anticipated, as the soil amendment in this experimental field was a relatively recent intervention (2–3 years). It is well established that the correction of soil acidity through dolomitic lime application is a slow and gradual process [12]. In contrast, the tree effect represents the cumulative influence of several decades [18]. In this study, dolomitic lime has been applied intermittently since 2017, so it already has a consistent effect on soil pH, on the availability of nutrients for plants, and, consequently, on PFC. The effect of dolomitic lime application on PFC was more prominent than the effect of stocking rate, which was also to be expected given that it only covered one vegetative cycle of the pasture. The stocking rate in PFC effect is complex since it has a strong impact on the grazing selectivity, which can determine the future advantage of species that are less palatable to the animals, in a dynamic process throughout the growing season [25]. Selectivity for distinct plant species and asymmetrical nutrient transfer towards frequently used areas affect the patterns of species composition [35].

4.2. Limitations and Perspectives

The aim of this study is to show the potential of pasture floristic composition (PFC) to enhance decision-making in pasture and grazing management. Several complementary statistical analysis approaches were used (CAP, SIMPER, ISA, for example) to obtain all the practical applications of the indicators collected in the field.
The results show the value of regularly applying dolomitic lime as a base strategy on acid soils. The positive effect of a higher stocking rate on the PFC was also demonstrated, but only two levels were tested: the traditional low stocking rate (7 sheep ha−1) and a high level (18 sheep ha−1). Two important questions are: Will the advantage of higher stocking levels persist in years with lower accumulated rainfall? And what is the threshold that optimizes animal production (total accumulated weight)? Because grazing animals rely on the availability and spatial distribution of vegetation resources, which vary seasonally, understanding these dynamics is crucial for optimizing pasture management and determining appropriate stocking rates [7]. Forage biomass and nutrient requirements of livestock are two of the most basic pieces of information required for calculating the carrying capacity of pastures and adjusting stocking rates [8].
Additional research is needed to substantiate the preliminary findings presented in this study. Therefore, it will be important to extend this work over two or three more pasture vegetative cycles, trying to capture the effect of seasonality and inter-annual climate variability, especially rainfall, a determining factor in dryland pastures [36]. At the same time, a holistic approach to the process should be sought, combining PFC with analyses of the productivity, quality, and nutritional value of the pasture, as well as georeferencing grazing to identify patterns of preference and selectivity. Strong selectivity for distinct plant species and asymmetrical nutrient transfer towards frequently used areas affect species composition [35].
Another important aspect is related to the characteristics of the Montado ecosystem, which includes soil, pasture, animals, but also trees. Given the average density of trees in the experimental field (around 10 trees ha−1), several sampling areas are under the effect of the tree canopy (see Figure 1b). However, this factor was not considered in this study. The effect of trees on PFC is unanimously considered to be decisive [14,37]. The presence of plant indicators of tree areas should be studied in the context of the role that trees play as reference points where livestock typically engage in activities such as rumination and resting [37].
It is important to reinforce that floristic inventories follow strict formal and demanding protocols [14]. Moreover, grass classification ability varies over time due to the vegetation’s phenological, physiological, and morphological seasonal changes [17], so future studies should consider both the dynamic processes and patterns of biodiversity [14]. Consequently, it is expected that in the coming years, with the integration of Precision Agriculture and the incorporation of other technologies, remote sensing (by satellite or by UAV) will play a decisive role in the monitoring of patterns of grassland composition [38]. Several research teams have already published papers showing the potential of remote sensing in surveying the spatial variability of botanical species in grasslands [39,40,41,42]. Agri-Environmental policy schemes represent one of the most effective instruments for supporting conservation initiatives within European agricultural landscapes (e.g., the Common Agriculture Policy, CAP). Grasslands, as key targets of these policies, are affected by changes in agricultural land use and abandonment, and require reliable spatial indicators to assess biodiversity status and monitor progress toward policy objectives [39]. Consequently, spatially explicit monitoring of grassland biodiversity is a crucial step and may pave the way for a new paradigm in agri-environment schemes [39]. In this context, technological tools in general and remote sensing in particular will play a decisive role.

5. Conclusions

The results of this study showed that the floristic composition of pastures can be used as an indicator of the effects of pH correction and/or increased stocking rates. Specifically: (i) dolomitic lime application (DL) led to significant improvements in pasture floristic composition (PFC) compared to untreated areas; (ii) SR played a secondary but still ecologically relevant role; (iii) high stocking rate (HSR) adjusted with a more moderate application of lime, can be a more sustainable management strategy to improve PFC, in particular, the presence of legumes, especially on acid soils; (iv) in contrast, in low stocking rate (LSR) areas, the application of lime was essential for significant increases in floristic richness and vegetation cover.
As a practical implication for farmers, this work shows that the intensification of pasture-based animal production systems with HSR can be a complementary or alternative and economic strategy to apply lime to improve PFC on acid soils, especially useful when seeking cost reduction. In terms of perspectives, it will be important to extend this work over more pasture vegetative cycles, trying to capture the effect of seasonality and inter-annual climate variability, and the incorporation of remote sensing technologies that enable dynamic and continuous monitoring of pasture to support farm managers’ decision-making.

Author Contributions

Conceptualization, J.S., R.C. and A.P.; methodology, J.S., P.M., E.C., S.S., F.J.M., L.L.P., R.C., A.P. and A.B.; software, J.S., P.M., F.J.M. and L.L.P.; validation, J.S., P.M. and A.B.; formal analysis, J.S., P.M. and A.B.; investigation, J.S., E.C., A.P. and A.B.; resources, J.S., R.C. and A.P.; data curation, J.S., P.M. and A.B.; writing—original draft preparation, J.S.; writing—review and editing, J.S., P.M., S.S. and A.B.; visualization, J.S. and P.M.; supervision, J.S., R.C. and A.P.; project administration, J.S., A.P. and R.C.; funding acquisition, J.S., A.P. and R.C. All authors have read and agreed to the published version of the manuscript.

Funding

This work was funded by the project “SUMO—Montado Sustainability” (Ref. PRR-C05-i03-I000066), investment supported by the PRR—Recovery and Resilience Plan and European Funds NextGeneration EU and by National Funds through FCT (Foundation for Science and Technology) under the Project UIDB/05183/2025.

Data Availability Statement

The original contributions presented in this study are included in the article. Further inquiries can be directed to the corresponding author.

Acknowledgments

MED (https://doi.org/10.54499/UIDB/05183/2020; https://doi.org/10.54499/UIDP/05183/2020) (accessed on 12 October 2020) and CHANGE (https://doi.org/10.54499/LA/P/0121/2020) (accessed on 12 October 2020).

Conflicts of Interest

The authors declare no conflicts of interest.

Appendix A

Table A1. Results of Indicator Species Analysis (ISA): presence (1) or absence (0) of plant species in each plot (treatments, T1 to T4).
SpecieCodeFamilyT1T2T3T4IVStat.p-Value
Agrostis pourrettiAGRPOPoaceae1110120.7880.029
Anagallis arvensisANAARPrimulaceae010020.2891.000
Anchusa azureaANCAZBoraginaceae100010.2891.000
Andryala integrifoliaANDINAsteraceae100010.2891.000
Aphanes arvensisAPHARRosaceae100010.3690.241
Arum italicumARUITAraceae100010.2891.000
Astragalus pelecinusASTPEFabaceae000130.2891.000
Avena barbataAVEBAPoaceae010180.4770.322
Bromus diandrusBRODIPoaceae000130.2891.000
Bromus hordeaceusBROHOPoaceae010180.3350.604
Bromus rubensBRORUPoaceae0011100.2891.000
Calendula arvensisCALARAsteraceae100010.4520.091
Callitriche stagnalisCALSTPlantaginaceae001040.2891.000
Carduus tenuiflorusCARTEAsteraceae1111150.323NA
Cerastium glomeratumCERGLCaryophyllaceae1111150.854NA
Chamaemelum fuscatumCHAFUAsteraceae1110120.6420.193
Chamaemelum mixtumCHAMIAsteraceae010020.4260.138
Crepis capillarisCRECAAsteraceae100160.4480.430
Crepis vesicariaCREVEAsteraceae1111150.540NA
Cynodon dactylonCYNDAPoaceae001040.2891.000
Diplotaxis catholicaDIPCABrassicaceae1111150.866NA
Echium plantagineumECHPLBoraginaceae1110120.5530.144
Erodium moschatumEROMOGeraniaceae1111150.913NA
Galium aparineGALAPRubiaceae010020.2891.000
Geranium dissectumGERDIGeraniaceae100010.4080.237
Geranium molleGERMOGeraniaceae1111150.722NA
Gynandriris sisyrinchiumGYNSIIridaceae110050.5000.079
Hedypnois creticaHEDCRAsteraceae1101110.4270.660
Holcus annuusHOLANPoaceae000130.2891.000
Hordeum murinumHORMUPoaceae0111140.6140.397
Hypochaeris glabraHYPGLAsteraceae110050.3370.594
Hypochaeris radicataHYPRAAsteraceae010020.2891.000
Lamarckia aureaLAMAUPoaceae010180.2891.000
Lathyrus angulatusLATANFabaceae100010.2891.000
Leontodon taraxacoidesLEOTAAsteraceae110050.4560.503
Logfia gallicaLOGGAAsteraceae110050.2891.000
Lolium perenneLOLPEPoaceae100160.6120.013
Lolium rigidumLOLRIPoaceae000130.5770.008
Medicago arabicaMEDARFabaceae100010.2891.000
Medicago polymorphaMEDPOFabaceae000130.5000.049
Mentha pulegiumMENPULamiaceae000130.2891.000
Ornithopus compressusORNCOFabaceae0011100.5730.215
Ornithopus pinnatusORNPIFabaceae1101110.3330.896
Phalaris coerulescensPHACOPoaceae0011100.2891.000
Plantago coronopusPLACOPlantaginaceae1101110.2891.000
Plantago lagopusPLALAPlantaginaceae0011100.6300.018
Plantago lanceolataPLALNPlantaginaceae001040.6390.004
Poa annuaPOAANPoaceae1011130.3730.731
Polycarpon tetraphyllumPOLTECaryophyllaceae001040.2891.000
Polypogon maritimusPOLMAPoaceae000130.2891.000
Pulicaria paludosaPULPAAsteraceae100010.2891.000
Ranunculus bullatusRANBURanunculaceae100010.2891.000
Raphanus raphanistrumRAPRABrassicaceae100160.4420.214
Rumex bucephalophorusRUMBUPolygonaceae 1111150.645NA
Rumex pulcherRUMPUPolygonaceae 100010.6050.005
Scirpoides holoschoenusSCIHOCyperaceae001040.2891.000
Scorpiurus muricatusSCOMUFabaceae011090.4560.143
Scorpiurus vermiculatusSCOVEFabaceae011090.6320.016
Senecio vulgarisSENVUAsteraceae1111150.791NA
Sherardia arvensisSHEARRubiaceae100010.2891.000
Silene gallicaSILGACaryophyllaceae1110120.4080.583
Sonchus oleraceusSONOLAsteraceae110050.2891.000
Spergula arvensisSPEARCaryophyllaceae110050.6050.042
Stachys arvensisSTAARLamiaceae011090.3540.595
Stellaria mediaSTEMECaryophyllaceae010020.2891.000
Tolpis barbataTOLBAAsteraceae100160.2891.000
Torilis arvensisTORARApiaceae011090.2891.000
Trifolium campestreTRICAFabaceae110050.4560.144
Trifolium cernuumTRICEFabaceae1111150.736NA
Trifolium glomeratumTRIGLFabaceae1110120.6870.014
Trifolium michelianumTRIMIFabaceae1111150.777NA
Trifolium resupinatumTRIREFabaceae000130.4080.229
Trifolium subterraneumTRISUFabaceae010020.5000.051
Urospermum picroidesUROPIAsteraceae010020.2891.000
Urtica membranaceaURTMEUrticaceae001040.2891.000
Urtica urensURTURUrticaceae110050.3770.432
Veronica arvensisVERARPlantaginaceae 001040.4080.231
Vicia luteaVICLUFabaceae100010.2891.000
Vulpia geniculataVULGEPoaceae0111140.8490.015
T1 to T4—Treatments; IV—Indicator value of Indicator Species Analysis (ISA); NA—Not applicable.

References

  1. Reinermann, S.; Asam, S.; Kuenzer, C. Remote sensing of grassland production and management—A review. Remote Sens. 2020, 12, 1949. [Google Scholar] [CrossRef]
  2. Serrano, J.; Roma, L.; Shahidian, S.; Belo, A.D.F.; Carreira, E.; Paniagua, L.L.; Moral, F.; Paixão, L.; Marques da Silva, J. A technological approach to support extensive livestock management in the Portuguese Montado ecosystem. Agronomy 2022, 12, 1212. [Google Scholar] [CrossRef]
  3. Wachendorf, M.; Fricke, T.; Möckel, T. Remote sensing as a tool to assess botanical composition, structure, quantity and quality of temperate grasslands. Grass Forage Sci. 2017, 73, 1–14. [Google Scholar] [CrossRef]
  4. Salmerón-Sánchez, E.; Mendoza-Fernández, A.J.; Lorite, J.; Mota, J.F.; Peñas, J. Plant conservation in Mediterranean-type ecosystems. Mediterr. Bot. 2021, 42, e71333. [Google Scholar] [CrossRef]
  5. Lambert, M.; Clark, D.; Litherland, A. Advances in pasture management for animal productivity and health. N. Z. Vet. J. 2004, 52, 311–319. [Google Scholar] [CrossRef]
  6. Pinto-Correia, T.; Guiomar, N.; Ferraz-de-Oliveira, M.I.; Sales Baptista, E.; Rabaça, J.; Godinho, C.; Ribeiro, N.; Sá Sousa, P.; Santos, P.; Silva, C.S.; et al. Progress in identifying High Nature Value montados: Impacts of grazing on hardwood rangeland biodiversity. Rangel. Ecol. Manag. 2018, 71, 612–625. [Google Scholar] [CrossRef]
  7. Moscatelli, S.; Pesaresi, S.; Wikelski, M.; Tardella, F.M.; Catorci, A.; Quattrini, G. Influence of pasture diversity and NDVI on sheep foraging behavior in Central Italy. Geographies 2025, 5, 26. [Google Scholar] [CrossRef]
  8. Bretas, I.; Dubeux, J.; Priscila, J.; Oduor, K.; Queiroz, L.; Valente, D.; Chizzotti, F. Precision livestock farming applied to grazingland monitoring and management—A review. Agron. J. 2024, 116, 1164–1186. [Google Scholar] [CrossRef]
  9. Guimarães, M.; Pinto-Correia, T.; Freitas, M.; Ferraz-de-Oliveira, I.; Sales-Baptista, E.; Veiga, J.; Marques, T.; Pinto Cruz, C.; Godinho, C.; Belo, A. Farming for nature in the Montado: The application of ecosystem services in a results-based model. Ecosyst. Serv. 2023, 61, 101524. [Google Scholar] [CrossRef]
  10. Efe Serrano, J. Pastures in Alentejo: Technical Basis for Characterization, Grazing and Improvement; Universidade de Évora—ICAM, Ed.; Gráfica Eborense: Évora, Portugal, 2006; pp. 165–178. (In Portuguese) [Google Scholar]
  11. Carvalho, M.; Goss, M.J.; Teixeira, D. Manganese toxicity in Portuguese Cambisoils derived from granitic rocks: Causes, limitations of soil analyses and possible solutions. Rev. Cienc. Agrar. 2015, 38, 518–527. [Google Scholar] [CrossRef]
  12. Serrano, J.; Shahidian, S.; Marques da Silva, J.; Moral, F.; Carvajal-Ramirez, F.; Carreira, E.; Pereira, A.; Carvalho, M. Evaluation of the effect of dolomitic lime application on pastures—Case study in the Montado Mediterranean ecosystem. Sustainability 2020, 12, 3758. [Google Scholar] [CrossRef]
  13. Costa, J.P.; Mesquita, M.L.R. Floristic and phytosociology of weeds in pastures in Maranhão State, Northeast Brazil. Rev. Cien. Agron. 2016, 47, 414–442. [Google Scholar] [CrossRef]
  14. Serrano, J.; Shahidian, S.; Machado, E.; Paniagua, L.L.; Carreira, E.; Moral, F.; Pereira, A.; de Carvalho, M. Floristic composition: Dynamic biodiversity indicator of tree canopy effect on dryland and improved Mediterranean pastures. Agriculture 2021, 11, 1128. [Google Scholar] [CrossRef]
  15. Ara, I.; Harrison, M.T.; Whitehead, J.; Waldner, F.; Bridle, K.; Gilfedder, L.; Da Silva, J.M.; Marques, F.; Rawnsley, R. Modelling seasonal pasture growth and botanical composition at the paddock scale with satellite imagery. in silico Plants 2021, 3, diaa013. [Google Scholar] [CrossRef]
  16. Fenetahun, Y.; You, Y.; Fentahun, T.; Xinwen, X.; Yong-dong, W. Effects of grazing intensity on forage nutritive value of dominant grass species in Borana rangelands of Southern Ethiopia. PeerJ 2021, 9, e12204. [Google Scholar] [CrossRef]
  17. Shoko, C.; Mutanga, O.; Dube, T. Optimal season for discriminating C3 and C4 grass functional types using multi-date Sentinel 2 data. GISCI Remote Sens. 2020, 57, 127–139. [Google Scholar] [CrossRef]
  18. Serrano, J.; Shahidian, S.; Costa, F.; Carreira, E.; Pereira, A.; Carvalho, M. Can soil pH correction reduce the animal Supplementation needs in the critical autumn period in Mediterranean Montado ecosystem? Agronomy 2021, 11, 514. [Google Scholar] [CrossRef]
  19. IUSS Working Group WRB. World Reference Base for Soil Resources 2014; International Soil Classification System for Naming Soils and Creating Legends for Soil Maps; Update 2015; World Soil Resources Report 106; Food and Agriculture Organization (FAO): Rome, Italy, 2015; 188p. [Google Scholar]
  20. AOAC. Official Method of Analysis of AOAC International, 18th ed.; AOAC International: Arlington, TX, USA, 2005. [Google Scholar]
  21. Egner, H.; Riehm, H.; Domingo, W.R. Untersuchungen über die chemische Bodenanalyse als Grudlage für die Beurteilung des Nahrstoffzunstandes der Boden. II: Chemische extraktion methoden zur phosphor- und kalium-bestimmung. K. Lantbrhogsk. Annlr. 1960, 26, 199–216. (In German) [Google Scholar]
  22. Mueller-Dombois, D.; Ellenberg, H. Aims and Methods of Vegetation Ecology; Wiley: New York, NY, USA, 1974. [Google Scholar]
  23. Castroviejo, S. Flora Iberica; Real Jardín Botánico, CSIC: Madrid, Spain, 1986–2021; Volume I–XXI. [Google Scholar]
  24. Bear, D.A.; Russell, J.R.; Tufekcioglu, M.; Isenhart, T.M.; Morrical, D.G.; Kovar, J.L. Stocking rate and riparian vegetation effects on physical characteristics of riparian zones of Midwestern Pastures. Rangel. Ecol. Manag. 2012, 65, 119–128. [Google Scholar] [CrossRef]
  25. Xiao, X.; Zhang, T.; Angerer, J.P.; Hou, F. Grazing seasons and stocking rates affects the relationship between herbage traits of Alpine meadow and grazing behaviors of Tibetan sheep in the Qinghai–Tibetan plateau. Animals 2020, 10, 488. [Google Scholar] [CrossRef] [PubMed]
  26. Avdiu, B.; Aliu, S.; Fetahu, S.; Zeka, D.; Rusinovci, I. The floristic composition of the natural pastures in massive of Novobërba. Agric. For. 2018, 64, 235–241. [Google Scholar] [CrossRef]
  27. Mendes, P.; Meireles, C.; Vila-Viçosa, C.; Musarella, C.; Pinto-Gomes, C. Best management practices to face degraded territories occupied by Cistus ladanifer shrublands—Portugal case study. Plant Biosyst. 2015, 149, 494–502. [Google Scholar] [CrossRef]
  28. Graß, R.; Malec, S.; Wachendorf, M. Biomass performance and competition effects in an established temperate agroforestry system of willow and grassland—Results of the 2nd rotation. Agronomy 2020, 10, 1819. [Google Scholar] [CrossRef]
  29. Paço, A.; da-Silva, J.R.; Torres, D.P.; Glick, B.R.; Brígido, C. Exogenous ACC Deaminase is key to improving the performance of pasture legume-rhizobial symbioses in the presence of a high manganese concentration. Plants 2020, 9, 1630. [Google Scholar] [CrossRef] [PubMed]
  30. De Cáceres, M.; Legendre, P. Beals smoothing revisited. Oecologia 2008, 156, 657–669. [Google Scholar] [CrossRef]
  31. Dufrêne, M.; Legendre, P. Species assemblages and indicator species: The need for a flexible asymmetrical approach. Ecol. Monogr. 1997, 67, 345–366. [Google Scholar] [CrossRef]
  32. Halim, N.; Abdullah, R.; Karsani, S.; Osman, N.; Panhwar, Q.; Ishak, C. Influence of soil amendments on the growth and yield of rice in acidic soil. Agronomy 2018, 8, 165. [Google Scholar] [CrossRef]
  33. Li, G.D.; Conyers, M.K.; Helyar, K.R.; Lisle, C.J.; Poile, G.J.; Cullis, B.R. Long-term surface application of lime ameliorates subsurface soil acidity in the mixed farming zone of south-eastern Australia. Geoderma 2019, 338, 236–246. [Google Scholar] [CrossRef]
  34. Solefack, M.C.M.; Fedoung, E.F.; Temgoua, L.F. Factors determining floristic composition and functional diversity of plant communities of Mount Oku forests, Cameroon. J. Asia Pac. Biodiver. 2018, 11, 284–293. [Google Scholar] [CrossRef]
  35. Wild, M.; Gauly, M.; Zanon, T.; Isselstein, J.; Komainda, M. Tracking free-ranging sheep to evaluate interrelations between selective grazing, movement patterns and the botanical composition of alpine summer pastures in northern Italy. Pastor. Res. Policy Pract. 2023, 13, 25. [Google Scholar] [CrossRef]
  36. Porqueddu, C.; Melis, R.A.M.; Franca, A.; Sanna, F.; Hadjigeorgiou, I.; Casasús, I. The role of grasslands in the less favoured areas of Mediterranean Europe. Grassl. Sci. Eur. 2017, 22, 3–22. [Google Scholar]
  37. De Miguel, J.M.; Acosta-Gallo, B.; Gómez-Sal, A. Understanding Mediterranean pasture dynamics: General tree cover vs. specific effects of individual trees. Rangel. Ecol. Manage. 2013, 66, 216–223. [Google Scholar] [CrossRef]
  38. Chen, Y.; Guerschman, J.; Shendryk, Y.; Henry, D.; Harrison, M.T. Estimating pasture biomass using Sentinel-2 imagery and machine learning. Remote Sens. 2021, 13, 603. [Google Scholar] [CrossRef]
  39. Monteiro, A.T.; Alves, P.; Carvalho-Santos, C.; Lucas, R.; Cunha, M.; Marques da Costa, E.; Fava, F. Monitoring plant diversity to support Agri-environmental schemes: Evaluating statistical models informed by satellite and local factors in Southern European Mountain pastoral systems. Diversity 2022, 14, 8. [Google Scholar] [CrossRef]
  40. Yang, M.; Chen, A.; Zhang, M.; Gu, Q.; Wang, Y.; Guo, J.; Yang, D.; Zhao, Y.; Huang, Q.; Ma, L.; et al. Relationship between plant species diversity and aboveground biomass in alpine grasslands on the Qinghai–Tibet Plateau: Spatial patterns and the factors driving them. Front. Ecol. Evol. 2023, 11, 1138884. [Google Scholar] [CrossRef]
  41. Zhao, X.; Wu, B.; Xue, J.; Shi, Y.; Zhao, M.; Geng, X.; Yan, Z.; Shen, H.; Fang, J. Mapping forage biomass and quality of the Inner Mongolia grasslands by combining field measurements and Sentinel-2 observations. Remote Sens. 2023, 15, 1973. [Google Scholar] [CrossRef]
  42. Hayes, S.; Cawkwell, F.; Bacon, K.L.; Wingler, A. Remote sensing of grassland plant biodiversity and functional traits. Ecol. Evol. 2025, 15, e71829. [Google Scholar] [CrossRef]
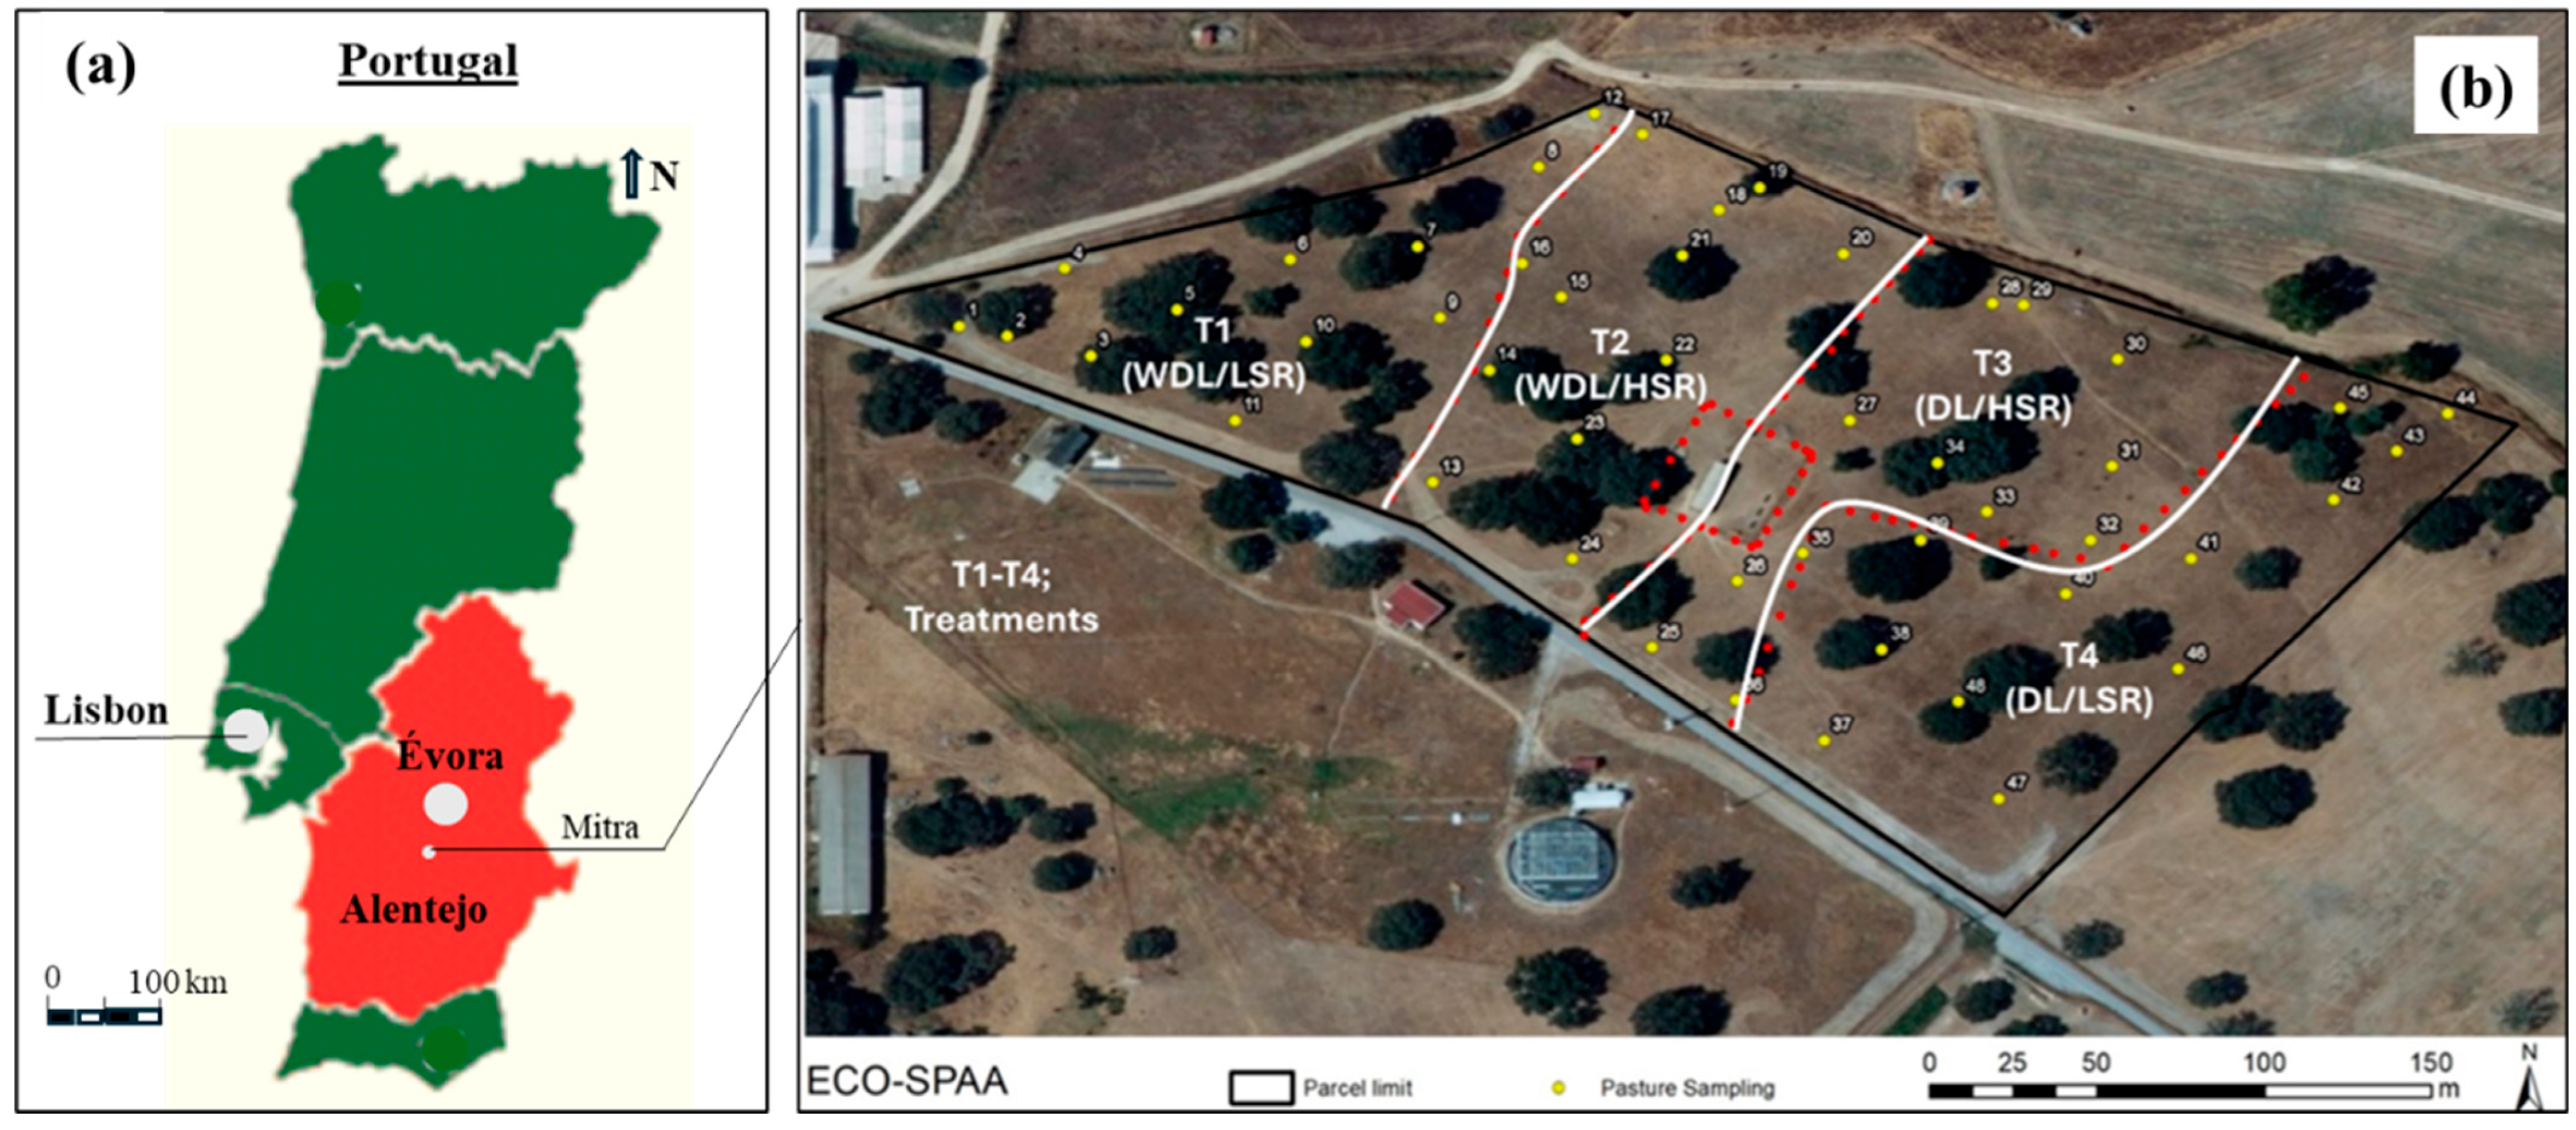
Figure 1. Experimental field (“Eco-SPAA”), located in Mitra farm (University of Évora), Alentejo region of Portugal (a). The treatments (T1, T2, T3, and T4) and 48 pasture sampling areas (b). WDL—Without dolomitic limestone application; DL—With dolomitic limestone application; LSR—Low stocking rate; HSR—High stocking rate.
Environments 12 00385 g001
Figure 2. Chronological diagram of the experimental trial: Grazing and pasture monitoring between December 2023 and June 2024.
Environments 12 00385 g002
Figure 3. Thermo-pluviometric diagram of Meteorological Station of Mitra (Évora, Portugal) between July 2023 and June 2024. The evolution of the average value of the monthly rainfall in a 30-year period (between 1981 and 2010) is also presented.
Environments 12 00385 g003
Figure 4. Structural organization of methodological procedures carried out from pasture data collection to the output of practical management decisions.
Environments 12 00385 g004
Figure 5. Score of the Relative Importance of plant species with the greatest representation in the experimental field (a); pictures of two species with major representation: Erodium moschatum (b) and Diplotaxis catholica (c).
Environments 12 00385 g005
Figure 6. Score of the Relative Importance of plant species with the greatest representation in each plot of the experimental field: (a) treatment 1; (b) treatment 2; (c) treatment 3; (d) treatment 4.
Environments 12 00385 g006
Figure 7. Maps of spatial distribution of plant species with the greatest representation in the experimental field. Circles represent the locations of pasture sampling areas.
Environments 12 00385 g007
Figure 8. Boxplot of the floristic community metrics (species richness (a); families richness (b); species diversity (c) and families diversity (d)), according to treatment: T1 (without dolomitic lime and low stocking rate, WDL/LSR), T2 (without dolomitic lime and high stocking rate, DL/HSR), T3 (with dolomitic lime and high stocking rate (DL/HSR), and T4 (with dolomitic lime and low stocking rate, DL/LSR). The letters refer to the results of the Mann–Whitney non-parametric test. Different letters represent significant differences (p < 0.05).
Environments 12 00385 g008
Figure 9. Ordination diagram of the “Canonical Analysis of Principal Coordinates” (CAP) for the floristic inventories, based on species composition and using the Bray-Curtis similarity coefficient. Species with higher correlations with the CAP axes were overlaid in the diagram. (WDL/LSR: without lime application/low stocking rate; WDL/HSR: without lime application/high stocking rate; DL/HSR: with lime application/high stocking rate; DL/LSR: with lime application/low stocking rate).
Environments 12 00385 g009
Figure 10. Summary of the results of the SIMPER analysis to identify the species that contribute most to differentiating the floristic community in each plot.
Environments 12 00385 g010
Figure 11. Summary of the results of the SIMPER analysis to identify the families that contribute most to differentiating the floristic community in each plot.
Environments 12 00385 g011
Figure 12. Relative coverage (%) of floristic families in each plot, considering the application of dolomitic lime and stocking rate: without dolomitic lime/low stocking rate (WDL/LSR), without dolomitic lime/high stocking rate (WDL/HSR), with dolomitic lime/low stocking rate (DL/LSR), and with dolomitic lime/high stocking rate (DL/HSR).
Environments 12 00385 g012
Figure 13. Dendogram representing the results of the indicator species analysis (ISA): (i) without combinations of treatments; and (ii) with combinations of treatments. T1, T2, T3 and T4—Treatments; NDL—No dolomitic lime application; LSR—Low stocking rates; HSR—High stocking rates; DL—Dolomitic lime application; * Probability < 0.05; ** Probability < 0.01; *** Probability < 0.001.
Environments 12 00385 g013
Table 1. Evolution of soil parameters (depth = 0–30 cm) of the experimental field throughout the monitoring period (2015–2024).
DateOct 2015Oct 2018Oct 2018Mar 2020Mar 2020Jun 2023Jun 2023Oct 2024Oct 2024
FieldsAll1 and 23 and 41 and 23 and 41 and 23 and 41 and 23 and 4
pH5.4 ± 0.35.3 ± 0.25.6 ± 0.25.6 ± 0.25.8 ± 0.45.5 ± 0.26.0 ± 0.45.6 ± 0.46.4 ± 0.4
Mg (mg kg−1)95.6 ± 43.773.3 ± 34.682.9 ± 32.171.3 ± 16.8108.1 ± 22.393.8 ± 25.6106.1 ± 37.580.2 ± 18.1110.6 ± 23.8
Mn (mg kg−1)76.4 ± 44.966.8 ± 31.433.6 ± 16.151.6 ± 24.632.5 ± 13.666.1 ± 11.533.3 ± 36.448.3 ± 12.530.5 ± 26.5
Ratio Mg Mn−11.31.12.51.43.31.43.21.73.6
Fields 1 and 2—Without dolomitic limestone application; Fields 3 and 4—With dolomitic limestone application; Mg—Magnesium; Mn—Manganese; Oct—October; Mar—March; Jun—June.
Table 2. Soil parameters (mean ± standard deviation) of the experimental field in June 2023.
Soil
Parameters
T1
(WDL/LSR)
T2
(WDL/HSR)
T3
(DL/HSR)
T4
(DL/LSR)
Sand (%)79.2 ± 1.6 a77.5 ± 2.9 a76.0 ± 3.0 a79.1 ± 4.0 a
Silt (%)11.0 ± 1.4 b11.3 ± 1.6 b13.0 ± 2.5 a10.7 ± 2.1 b
Clay (%)9.8 ± 1.2 a11.2 ± 3.6 a11.0 ± 1.6 a10.1 ± 2.8 a
OM (%)4.5 ± 1.2 a3.5 ± 0.6 b3.0 ± 0.4 b3.9 ± 1.0 ab
pH5.5 ± 0.2 b5.5 ± 0.2 b6.1 ± 0.4 a5.9 ± 0.4 a
P2O5 (mg kg−1)90.7 ± 39.8 a50.3 ± 22.1 b45.3 ± 27.7 b63.8 ± 38.9 ab
K2O (mg kg−1)89.9 ± 62.1 a100.8 ± 65.1 a94.8 ± 67.0 a129.5 ± 69.2 a
Mg (mg kg−1)95.8 ± 25.8 a90.8 ± 26.9 a110.4 ± 29.6 a101.7 ± 45.6 a
Mn (mg kg−1)64.6 ± 32.3 a67.5 ± 40.5 a39.7 ± 13.4 ab26.7 ± 9.5 b
CEC (cmol kg−1)12.0 ± 8.7 a6.6 ± 1.4 b5.7 ± 0.8 b5.9 ± 1.1 b
T1, T2, T3 and T4—Experimental treatments; WDL—Without dolomitic limestone application; DL—With dolomitic limestone application; LSR—Low stocking rate; HSR—High stocking rate; OM—Organic matter; P2O5—Phosphorus; K2O—Potassium; Mg—Magnesium; Mn—Manganese; CEC—Cationic exchange capacity; Different lowercase letters indicate significant differences (significance 0.05) between treatments according to the Mann–Whitney test (p < 0.05).
Table 3. Pasture height (mean ± standard deviation; in cm) registered in each treatment at different sampling dates between December 2023 and June 2024.
Sampling DatesT1
(WDL/LSR)
T2
(WDL/HSR)
T3
(DL/HSR)
T4
(DL/LSR)
5 December 20239.1 ± 5.1 b9.0 ± 4.1 b10.4 ± 5.8 ab12.9 ± 7.3 a
18 January 202411.6 ± 7.0 ab6.2 ± 3.7 c10.4 ± 7.4 b16.3 ± 9.5 a
29 February 202417.8 ± 9.4 ab10.9 ± 3.4 c16.0 ± 5.6 b20.7 ± 10.1 a
19 March 202419.6 ± 10.9 ab11.9 ± 4.7 c16.9 ± 6.6 b26.2 ± 10.3 a
17 April 202424.8 ± 11.3 ab17.9 ± 7.7 c20.8 ± 6.9 bc32.1 ± 12.4 a
10 May 202431.7 ± 14.6 a19.1 ± 8.4 b19.8 ± 13.7 b29.2 ± 14.6 a
11 June 202429.3 ± 11.7 a17.9 ± 10.2 b14.4 ± 13.9 b33.4 ± 26.5 a
T1, T2, T3, and T4—Experimental treatments; WDL—Without dolomitic limestone application; DL—With dolomitic limestone application; LSR—Low stocking rate; HSR—High stocking rate; Different lowercase letters indicate significant differences (significance 0.05) between treatments according to the Mann–Whitney test (p < 0.05).
Table 4. Pasture parameters (mean ± standard deviation; in percentage) of each treatment in Spring 2024.
Pasture
Parameters
T1
(WDL/LSR)
T2
(WDL/HSR)
T3
(DL/HSR)
T4
(DL/LSR)
Bare soil6.8 ± 5.7 a8.0 ± 6.7 a9.4 ± 5.8 a11.8 ± 4.7 a
Total coverage92.2 ± 6.9 a92.0 ± 6.7 a90.6 ± 5.8 a88.2 ± 4.7 a
Green coverage86.8 ± 10.5 a88.5 ± 14.1 a88.8 ± 8.3 a87.8 ± 5.6 a
Tree leaf litter18.9 ± 31.7 a6.4 ± 14.5 b3.5 ± 11.5 b1.7 ± 2.7 b
T1, T2, T3, and T4—Experimental treatments; WDL—Without dolomitic limestone application; DL—With dolomitic limestone application; LSR—Low stocking rate; HSR—High stocking rate; Different lowercase letters indicate significant differences (significance 0.05) between treatments according to the Mann–Whitney test (p < 0.05).
Table 5. Results of the “Permutational Multivariate Analysis of Variance” (PERMANOVA) between treatments, based on species and families of pasture floristic composition.
TreatmentsBased on SpeciesBased on Families
tp (perm)n (perms)tp (perm)n (perms)
T1 vs. T21.24150.128 ns9981.33870.133 ns998
T1 vs. T31.61640.010 *9991.89270.009 **996
T1 vs. T41.48180.016 *9971.52900.066 ns999
T2 vs. T31.37470.047 *9991.63760.021 *999
T2 vs. T41.64850.017 *9991.54550.073 ns999
T3 vs. T41.74580.002 **9991.69530.034 *997
n (perms)—Number of permutations used in the test; ns—Not significant; *—Significant at 95%; **—Significant at 99%.
Disclaimer/Publisher’s Note: The statements, opinions and data contained in all publications are solely those of the individual author(s) and contributor(s) and not of MDPI and/or the editor(s). MDPI and/or the editor(s) disclaim responsibility for any injury to people or property resulting from any ideas, methods, instructions or products referred to in the content.