Abstract
This study examined the impact of fluid type and grain diameter on the interfacial area between different pairs of non-wetting and wetting fluids in natural porous media. Synchrotron X-ray microtomography was used to obtain high-resolution, three-dimensional images of multi-phase porous media systems. Multiple porous media, comprising a range of physical and geochemical properties, were used in this study. The four pairs of non-wetting/wetting fluids used were dense OIL/water, light OIL/water, air/dense OIL, and air/water. Images were obtained over a broad range of wetting phase saturation and for both wetting phase drainage and imbibition conditions. The results showed that for each fluid pair, the total (capillary + film) interfacial area increased with decreasing wetting fluid saturation. Interfacial areas were similar among all fluid pairs for a given porous medium. They were also similar for drainage and imbibition conditions. The maximum specific interfacial area (Am) was shown to correlate well with inverse median grain diameter. The physical properties of the porous medium appear to have a greater influence on the magnitude of specific total interfacial area for a given saturation than fluid properties or wetting phase history.
1. Introduction
The pore-scale distribution and morphology of immiscible fluids mediate fundamental flow and mass transport behavior in porous media systems. Hence, the configuration of immiscible fluids residing in porous media is of interest to many fields, including contaminant hydrology, soil science, and petroleum engineering. One aspect of particular interest is the influence of fluid and porous medium properties on the interfaces between non-wetting and wetting fluids. Methods such as magnetic resonance imaging and synchrotron X-ray computed microtomography have been used to characterize and quantify the interfacial areas of fluids in porous media, including air/water systems [1,2,3,4,5,6,7], organic liquid/water systems [8,9,10,11,12,13,14,15,16,17,18,19,20,21,22,23], and three-phase systems containing air, organic liquid, and water [24,25] This research has, for example, demonstrated the impact of physical properties of the porous medium (e.g., grain size) and of the magnitude of fluid saturation on interfacial area.
While the aforementioned studies have provided critical insights into the nature and magnitudes of fluid/fluid interfaces in porous media, the works have each focused on a singular fluid pair. Specifically, the studies typically characterize interfaces between air and water or between organic immiscible liquids (OILs) and water, with very few comparisons of the two within the same study. In addition, there has been minimal investigation of air/OIL systems.
The objectives of this study are twofold. The first, primary, objective is to quantify and compare interfacial areas associated with the three types of non-wetting/wetting fluid pairs in natural porous media, air/water, OIL/water, and air/OIL. Four porous media, comprising a range of physical and geochemical properties, are used in this study. Images are obtained over a broad range of wetting phase saturation and for both wetting phase drainage and imbibition conditions. A secondary objective is to examine the influence of porous medium texture on fluid/fluid interfacial area. Twelve porous media comprising a range of physical and geochemical properties were used for this analysis, supplemented by data sets collected from the literature. Synchrotron X-ray microtomography is used to obtain high-resolution, three-dimensional images of multi-phase porous media systems, from which volumes, surface areas, and interfacial areas are quantified.
2. Materials and Methods
2.1. Materials
Tetrachloroethene and hexadecane were the organic liquids used in this study. All chemicals were reagent grade (Sigma-Aldrich, Co., St. Louis, MO, USA). To enhance image contrast, the organic liquids were doped with either iodobenzene or 2-iodopropane (10% by volume). For the air/water systems, the aqueous phase was doped with potassium iodide or cesium chloride. The selected dopants were chosen to exhibit minimal partitioning to non-target fluids. The interfacial tensions of the fluid pairs, with and without dopant, were measured with a ring tensiomat (Fischer Co., Fair Lawn, NJ, USA) following standard procedures. Values of the interfacial tension for each fluid pair are presented in Table 1. The dopant had an insignificant impact on interfacial tension. Based on these results, the presence of the dopant compounds is not expected to significantly influence the phase distribution behavior of the systems. Comparison of configurations and interfacial areas obtained for systems with and without the dopant present confirmed that the dopants had minimal impact.

Table 1.
Interfacial tension of fluid pairs 1.
Four porous media were used for the primary component of this study. One is a well-sorted, commercially available quartz sand (45/50 Accusand) with minimal organic carbon and metal oxides. The other three are soils with different median grain sizes, organic carbon contents, and metal oxide contents. The first is a soil (Eustis) collected in Gainesville, Florida. The second is a soil (Vinton) collected from the West Campus Agricultural Center in Tucson, Arizona. The third (Mt. Lemmon) is a soil collected from Pima County, Arizona. Relevant properties of the porous media are presented in Table 2. The Eustis soil is composed primarily of quartz, and has a moderate organic-carbon content and a low metal oxide content. The Vinton soil comprises quartz (~54%), with significant amounts of potassium feldspar and plagioclase, and has high metal oxide content and relatively low organic carbon. Mt. Lemmon soil primarily comprises quartz, has high silt- and clay-sized fractions, and a high organic carbon content. It is anticipated that surface wetting properties likely do not vary significantly among the four media given their compositions. The one possible exception is Mt. Lemmon soil with its comparatively high organic carbon content.
Table 2.
Properties of the porous media used for the first objective of this study.
A total of twelve porous media were used for the second objective: five soils and sediments; five natural, commercially available sands (Accusand and Granusil, Unimin Co., Le Sueur, MN); and two glass bead media. Relevant physical properties of the porous media are provided in Table 3. The median grain diameters (d50) and the grain size distributions, as characterized by the uniformity coefficient (U), vary considerably. The organic carbon contents of the media also vary, from zero for the glass beads to low values for the sands and Borden aquifer sediment (~0.02%), to moderate to high values for the soils (0.08, 0.09, 0.38, and 10% for Hayhook, Vinton, Eustis, and Mt. Lemmon, respectively). The porous media are considered to be predominantly to completely water-wetting. Additional data sets were collected from the literature (Table 4).
Table 3.
Properties of the porous media used for the second objective of this study.
Table 4.
Literature data used for the second objective of this study.
2.2. Methods
The porous media were dry-packed into thin-walled, X-ray transparent columns constructed of aluminum. A small subset of the columns used for the air/water experiments were made of acrylic. The aluminum columns were 4.4 cm long, with an outer diameter of 0.64 cm and an inner diameter of 0.58 cm. The acrylic columns were 5 cm long, with an outer diameter of 0.7 cm and an inner diameter of 0.5 cm. Polypropylene frits (10 μm pores) were placed on both ends of the column to promote uniform flow and retain the porous media. The porosities and bulk densities of the columns were determined gravimetrically (Table 2). These values are similar to those obtained for larger columns packed with the same media.
After packing, the columns were saturated for several days by pumping the wetting fluid into the bottom of the vertically oriented column with a single-piston HPLC pump (Acuflow Series II). The packed columns were imaged prior to the measurements to ensure complete saturation. Images were then collected during multiple, sequential wetting phase drainage and imbibition events for a single column. Drainage and imbibition steps were conducted in a manner to maintain stable displacement conditions. For the OIL systems, wetting phase drainage was initiated by injecting organic liquid into the bottom (tetrachloroethene) or top (hexadecane) of the column at a Darcy velocity of approximately 5 cm/h using a syringe pump (Sage). Wetting phase imbibition was initiated by pumping an aqueous solution saturated with the target organic compound and the dopant into the top (displacing tetrachloroethene) or bottom (displacing hexadecane) of the column. Compound-saturated solutions were used to prevent dissolution during the experiments. For the air/water systems, drainage was initiated by injecting air into the top of the column and imbibition was initiated by injecting water into the bottom of the column. For the air/organic liquid systems, air was injected into the top of the column and organic liquid (tetrachloroethene) was injected into the bottom of the columns. The capillary number for these displacements was approximately 10−6.
2.3. Synchrotron X-Ray Microtomography and Data Processing
Imaging was conducted at the GeoSoilEnviroCARS (GSECARS) BM-13D beamline at the Advanced Photon Source, Argonne National Laboratory, Illinois. Imaging was conducted by directing the monochromatic X-ray beam through the column, perpendicular to the longitudinal axis. The transmitted X-rays were converted to visible light with a single-crystal scintillator, and projected onto a mirror inclined 45º to the incoming beam. A photograph of the image on the mirror was then taken with a high-resolution CCD camera attached to a microscope objective (5×). This image represents a depth-integrated grayscale map of the linear attenuation of the X-ray beam as it passed through the column. After an image was collected, the column was rotated 0.25º and the image acquisition process was repeated. A total of 720 two-dimensional images of each sample were collected in this manner through a 180° rotation. Additionally, several backfield projections, or images of the beam without any sample present, were collected during each set of scans. The image resolution (pixel size) was approximately 10–11 μm. The length of the imaged zone was approximately 5 mm. The images were collected from the centers of the columns, thus minimizing the potential influence of end effects. Prior analysis indicated that REV requirements were met for image volumes of approximately 30–50 mm3, depending on the porous medium. These results are similar to those reported in prior studies (e.g., [6,13,14]. The volumes of the imaged zones were larger than the minimum for all data sets.
The synchrotron beam was tuned to specific incident energies to take advantage of the X-ray absorption K-edge of the doping compounds. The K-edge refers to the X-ray energy at which the absorption of the beam by that element increases dramatically. For example, the absorption of the beam by the iodine-doped organic liquid is significantly greater at an energy slightly above the iodine K-edge compared to its absorption below the iodine K-edge. However, the absorption of the beam by other constituents of the matrix (e.g., porous media solids) remains essentially unchanged. For the OIL systems, data were collected sequentially below and above the iodine K-edge (33.0169 and 33.269 keV) to specifically resolve the organic liquid. For the air/water and air/OIL systems, images were collected below and above the cesium or iodine K-edge to resolve the aqueous solution or organic liquid.
The set of two-dimensional images collected for a given scan were preprocessed and reconstructed with algorithms developed by Rivers [31]. Preprocessing of the two-dimensional images removes artifacts and adjusts for the backfield projections. Reconstruction is used to convert the series of two-dimensional images into a single three-dimensional image file that comprises the attenuation (grayscale) of the X-ray beam in discrete locations (voxels), thus presenting the internal distribution of the attenuation. Reconstructed three-dimensional images acquired with incident energy below the iodine K-edge were subtracted from the corresponding images obtained from above the iodine K-edge to produce images wherein only voxels comprising the target phase display grayscale values different from the background. The use of subtracted image files simplifies data processing, ensures that voxels comprising the target phase are successfully separated from the surrounding matrix, and eliminates artifacts associated with highly attenuating components of the porous media, such as metal oxides.
Additional image data processing and extraction of quantitative information were conducted with the software package Blob3D, which was specifically developed for high-resolution X-ray microtomography data [32]. A global thresholding technique was used whereby the average grayscale value of each phase was used to determine the threshold for a given image set. This was carried out to create an array of binary images wherein voxels considered, for example, to be organic liquid were assigned a grayscale of 255 (white) and all others were assigned a grayscale of 0 (black). Contiguous voxels classified as organic liquid were then identified and combined to form three-dimensional units (blobs). Once data processing was complete, quantitative information was generated for each individual organic liquid blob. Blob volume was calculated as the total volume of all the voxels contained within a blob. The effective resolution with respect to blob volume was approximately 10−5 mm3. Surface area was calculated from the isosurface connecting the selected grayscale value (e.g., 127) in the binarized image. The methods used have been tested and employed successfully in prior research (e.g., [3,4,8,13]).
Fluid/fluid interfacial area comprises two components, area associated with capillary domains (e.g., menisci) and area associated with non-wetting fluid in contact with films of wetting fluid. This study will focus on total interfacial area. This is in part for consistency with the other primary method for measuring interfacial areas, the interfacial partitioning tracer test method, which provides measures of total interfacial area. The total surface area of the non-wetting phase was used to determine the total non-wetting/wetting interfacial area. The specific total non-wetting/wetting interfacial area (Anw, cm−1) was then calculated by dividing total interfacial area by the volume of porous medium comprising the imaged domain. It is important to note that interfacial areas measured with synchrotron X-ray microtomography do not include area associated with microscopic surface heterogeneities (e.g., surface roughness), as discussed previously [3,4,13]. The maximum specific interfacial area (Am) is determined from the relationship Anw = AmSn, where Sn is the saturation of the non-wetting phase. It is important to note that this linear relationship represents an approximation, as the true relationship between fluid/fluid interfacial area and saturation is nonlinear [4]. The linear-based approximation is used as a means to quantitatively compare across media.
3. Results and Discussion
The fraction of pores with nominal diameters <10 μm, the imaging resolution, was estimated for the porous media based on grain size distribution measurements [4]. The values range from 0 for the glass beads to <~10% for the coarse and medium diameter sands and for Eustis soil. The fractions are 18% for Vinton and Borden, 27% for Hayhook, and 51% for Mt. Lemmon soil. The results of previous work, which focused specifically on air/water interfacial areas, indicated that porosity and air/water interfacial areas were not fully characterized for the latter two soils [4]. In contrast, the results indicated minimal impact of the sub-resolution pores on the imaging results for the other porous media. The impacts of substantial fractions of sub-resolution pores, if present, would be anticipated to be mitigated by the fact that the wetting fluid most likely preferentially fills the smallest pores and that they remain fully saturated over the fluid saturations employed in the present study.
Two-dimensional thin section images for each fluid pair under imbibition conditions are shown for the Accusand and Vinton media in Figure 1 and Figure 2, respectively. The thin sections were obtained for columns at similar non-wetting phase saturations. Inspection of the reconstructed thin sections shows that the separate phases are very well distinguished. Also shown are false-color overlays of the binary images acquired individually for each fluid during image processing. A comparison of the thin-section images and the false-color overlays reveals that the spatial distributions of the separate phases were successfully characterized.
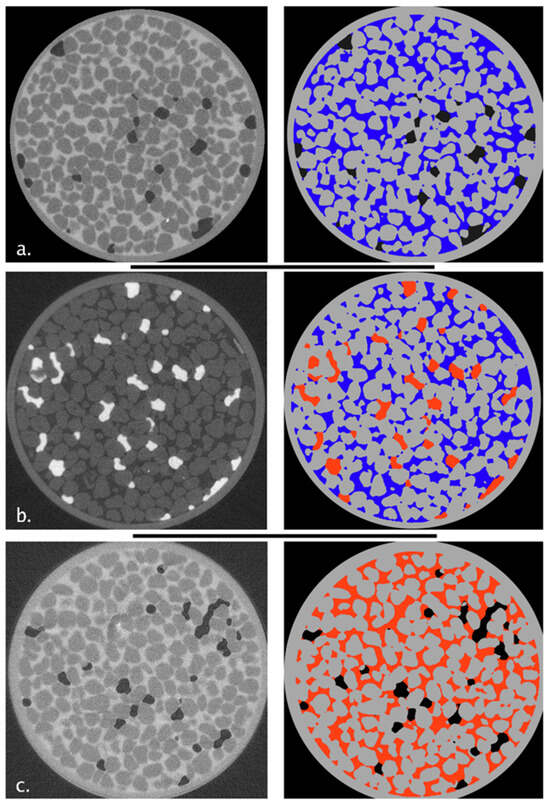
Figure 1.
Left-hand side: thin section images in the plane perpendicular to the longitudinal axis of the column for Accusand, with (a) air/water, (b) OIL/water, and (c) air/OIL, all under secondary wetting phase imbibition. Right-hand side: false-color overlays of the binary images obtained for each fluid are shown: air is black, organic liquid is red, and the aqueous phase is blue.
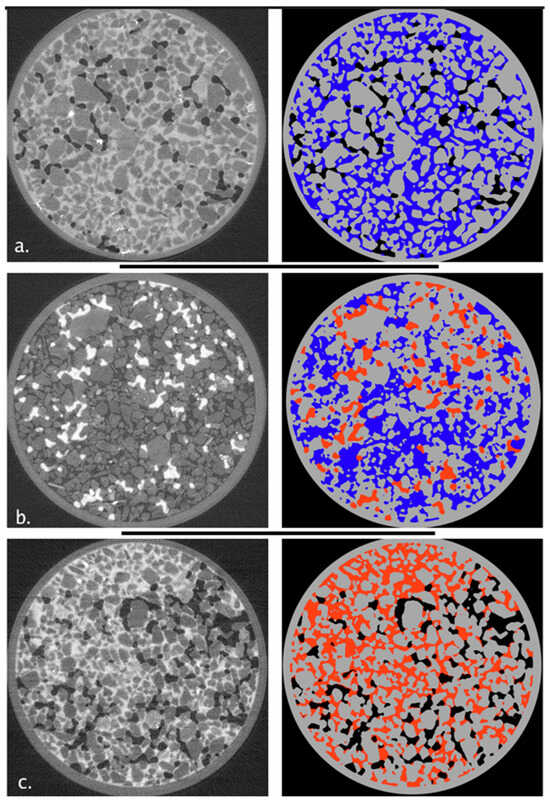
Figure 2.
Left-hand side: thin section images in the plane perpendicular to the longitudinal axis of the column for Vinton soil, with (a) air/water, (b) OIL/water, and (c) air/OIL, all under secondary wetting phase imbibition. Right-hand side: false-color overlays of the binary images obtained for each fluid are shown: air is black, organic liquid is red, and the aqueous phase is blue.
The images presented in Figure 1 and Figure 2 illustrate visually that the range of non-wetting phase blob sizes is greater for the porous medium with a broader grain size distribution (Vinton), regardless of the fluid pair present. The non-wetting phase blobs in the Vinton soil are clearly more ramified and interconnected. Additionally, the Vinton soil has a greater proportion of smaller blobs than does the Accusand. The configuration and size distribution of non-wetting phase blobs appears to be qualitatively similar for all fluid pairs for a given porous medium.
For each fluid pair of a given porous medium, the non-wetting phase is more interconnected under wetting phase drainage than imbibition, as would be expected (compare Figure 1 and Figure 3 for an example). In all cases, greater than ~90% of the total non-wetting phase volume comprises a single, interconnected body under drainage conditions. As a result, the number of individual non-wetting phase blobs is significantly greater for imbibition conditions.
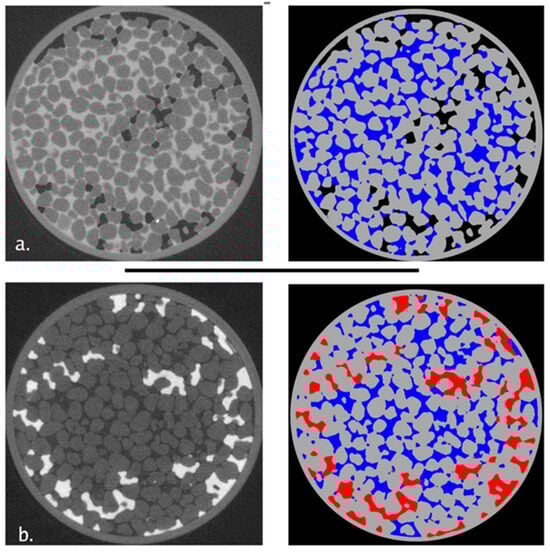
Figure 3.
Left-hand side: thin section images in the plane perpendicular to the longitudinal axis of the column for Accusand, with (a) air/water and (b) OIL/water, both under primary wetting phase drainage. Right-hand side: false-color overlays of the binary images obtained for each fluid are shown: air is black, organic liquid is red, and the aqueous phase is blue.
The morphology of the non-wetting phase blobs was quantified by plotting surface areas of each blob, normalized by individual blob volume (i.e., surface area-to-volume ratio), as a function of blob volume. An example of the resulting morphological profile is presented in Figure 4. The surface area-to-volume ratio of a perfect sphere is represented by the solid line in the figure.
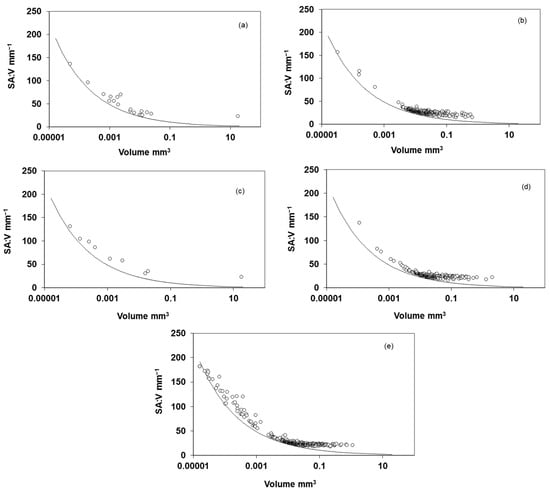
Figure 4.
Volume-normalized surface area versus volume for each individual non-wetting phase blob for Accusand: (a) air/water under water drainage; (b) air/water under water imbibition; (c) OIL/water under water drainage; (d) OIL/water under water imbibition; and (e) air/OIL under organic liquid imbibition.
Inspection of the figure reveals that the morphological profiles are similar for each of the fluid pairs for a given porous medium. In general, the blobs tend to be more spherical at smaller blob volumes (<10−3 mm3), and increasingly deviate from spherical morphology at larger volumes. This is consistent with previous studies of non-wetting phase size and morphology relationships (e.g., [8,9,10,17,19,23,27]). For each of the systems, the surface area-to-volume ratio of the blobs is relatively constant for blob volumes greater than 10−1 mm3. As blob volume increases, the blobs become increasingly ramified, which increases their surface area-to-volume ratios. However, this is offset by the decrease in surface area-to-volume ratio associated with the increased size.
The specific total fluid/fluid interfacial areas for each pair of non-wetting/wetting fluids for the four porous media are presented in Figure 5, Figure 6 and Figure 7. Interfacial area is observed to increase linearly with decreasing wetting phase saturation for each of the fluid pairs for all media. This is consistent with most prior microtomographic studies. While the Anw/Sw relationship is inherently nonlinear, linear behavior is often observed in microtomography studies for a number of reasons including the use of well-sorted media and limited ranges of saturation. As would be expected, the deviation from linearity was greater for soils with larger grain-size distributions, with the deviation apparent at comparatively high wetting phase saturations [4].
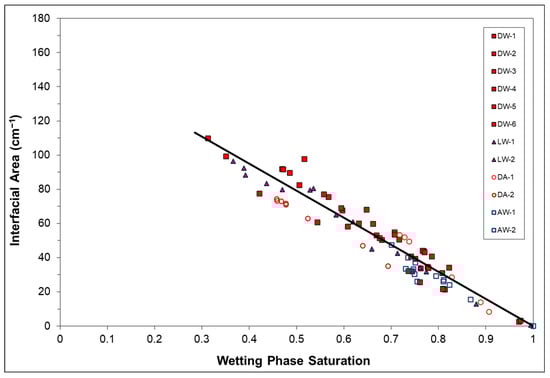
Figure 5.
Non-wetting/wetting fluid interfacial area as a function of wetting phase saturation for the Eustis soil. DW = dense OIL/water, LW = light OIL/water, DA = dense OIL/air, and AW = air/water. Data are for primary wetting phase drainage only.
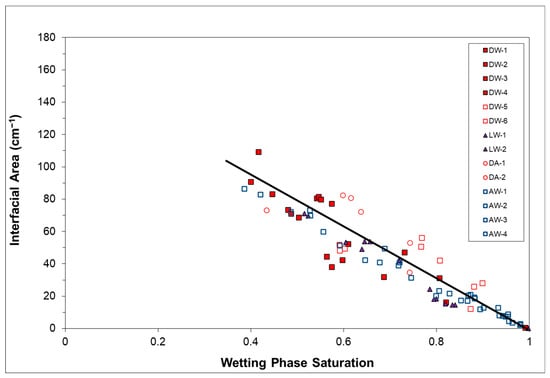
Figure 6.
Non-wetting/wetting fluid interfacial area as a function of wetting phase saturation for the Vinton soil. DW = dense OIL/water, LW = light OIL/water, DA = dense OIL/air, and AW = air/water. Data are for primary wetting phase drainage only.
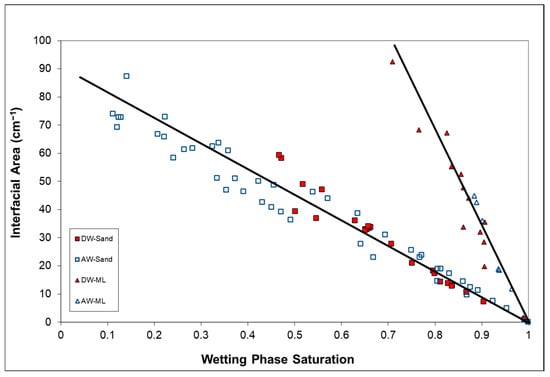
Figure 7.
Non-wetting/wetting fluid interfacial area as a function of wetting phase saturation for Accusand (Sand) and Mt. Lemmon (ML) soil. DW = dense OIL/water and AW = air/water. Data are for primary wetting phase drainage only. Data for individual columns are aggregated.
The greatest number of data sets was collected for the dense OIL/water systems for Eustis and Vinton media. These data can be used to evaluate the measurement variability of interfacial area. Inspection of Figure 5 and Figure 6 shows a relatively small degree of variability among the six individual data sets collected for the dense OIL/water systems. This variability appears in part to be related to variations in column packing and saturation.
The relationship between total specific interfacial area and saturation is similar for all four fluid pairs for a given porous medium (Figure 5, Figure 6 and Figure 7). This indicates that fluid type has no measurable impact on interfacial area for these systems. This is consistent with the similarity in morphological profiles observed for the various fluid pairs, as illustrated in Figure 4. As noted above, the porous media encompass a range of geochemical surface properties. Thus, it appears that the respective behaviors of the non-wetting and wetting fluids are similar under this range of geochemical variability regardless of the specific identity of the fluids.
The impact of wettability on fluid configuration is well recognized, as is the potential significance of fractional wettability systems. Of the porous media used in this study, Mt. Lemmon soil, with 10% organic carbon, is likely to have the greatest potential to have a significant fraction of non-water-wetting surfaces. Given the patchy spatial distribution of the soil organic matter, this soil may be roughly approximated as a 0.1 fractional non-water-wetting system. The results of prior research have shown that the presence of relatively small fractions of non-water-wetting surfaces does not greatly influence overall fluid configuration (e.g., [9], and references cited therein). The results observed herein are consistent with these prior observations.
Comparison of data collected under primary wetting phase drainage and secondary wetting phase imbibition conditions indicates no measurable differences in measured total interfacial areas for any of the porous media, as illustrated in Figure 8. Conversely, the non-wetting phase had significantly different configurations under wetting phase drainage and imbibition, as discussed above, wherein drainage consisted of a lower number of larger blobs and imbibition consisted of a larger number of smaller blobs. The similarity in interfacial areas despite differences in configuration is associated with the fact that the largest bodies occurring under drainage actually comprise a complex network of interconnected blobs whose combined total interfacial area is similar to the combined total under imbibition conditions (i.e., after a majority of the individual blobs have separated). It should be noted that the present analysis is focused on total interfacial area, whereas differences in capillary-associated interfacial areas under drainage vs. imbibition conditions have been observed (e.g., [3,6]).
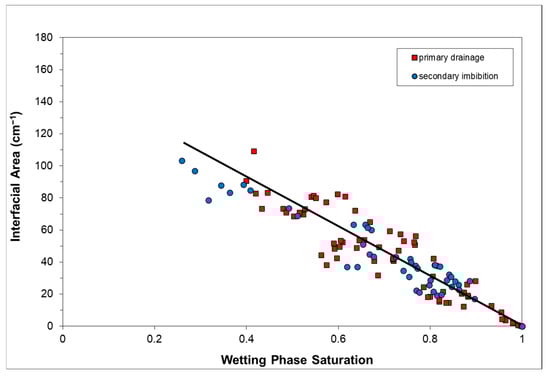
Figure 8.
Non-wetting/wetting fluid interfacial area as a function of wetting phase saturation for the Vinton soil. Comparison of data measured under primary wetting phase drainage and secondary wetting phase imbibition.
The influence of porous medium texture on fluid/fluid interfaces is one aspect of interest with respect to both phenomenological behavior and estimation efforts. The impact of porous medium grain size on interfacial area has been investigated in several studies. For example, Brusseau et al. [14] investigated the relationship between total OIL/water interfacial area and grain diameter for ten porous media comprising a range of median grain sizes, grain size distributions, and geochemical properties. A similar analysis was conducted in the present study, combining data sets for OIL/water and air/water systems.
A comparison of the data presented in Figure 5, Figure 6 and Figure 7 shows that, for a given wetting phase saturation, interfacial area is larger for the media with smaller median grain diameters. This relationship is further revealed in Figure 9, wherein maximum total specific interfacial areas (Am) are plotted against inverse median grain diameter. The first set of data was measured for OIL/water systems, and these data represent an expansion of the data presented by Brusseau et al. [14]. Inspection of Figure 9 shows that a strong correlation exists between Am and inverse grain diameter, consistent with the previous results. This behavior reflects the impact of grain size on pore size, which in turn mediates the size of non-wetting phase blobs [14].
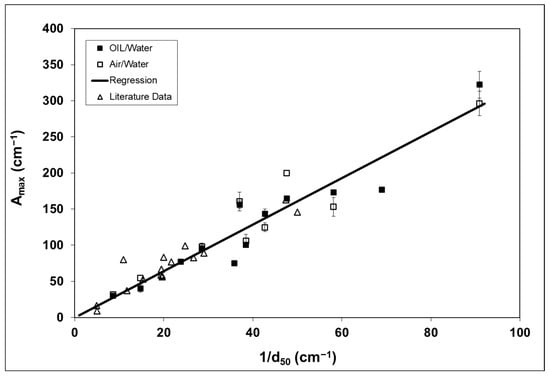
Figure 9.
Maximum total specific fluid/fluid interfacial area (Am) versus inverse median grain diameter (1/d50). “OIL” = organic immiscible liquid. Error bars represent 95% confidence intervals. Regression equation (excluding literature data): Am = 3.2/d50, r2 = 0.974. Sources of literature data are presented in Table 4.
The second set of data was newly measured for air/water systems. As shown in Figure 9, the data for the air/water systems are coincident with the OIL/water systems. Generally similar Am values were obtained for both fluid pairs for common media. These results indicate that the relationship is independent of the specific fluid pair involved. Fluid/fluid interfacial area data measured via microtomography were collected from the literature (see Table 4). These data fall within the range of the data measured herein. The similarity of values obtained by different investigators employing different analysis techniques, and in some cases different imaging methods, bolsters confidence in the robustness of these measurements.
4. Conclusions
This study examined the impact of fluid type and porous medium grain diameter on the interfacial area between different pairs of non-wetting and wetting fluids. Synchrotron X-ray microtomography was used to obtain high-resolution, three-dimensional images of multi-phase porous media systems. Multiple porous media, comprising a range of physical and geochemical properties, were used in this study.
The results of this study indicate that for the porous media examined, the non-wetting/wetting fluid configuration and interfacial areas are similar irrespective of the specific fluid pair. Interfacial areas were larger at a given saturation for media with smaller grain diameters. In addition, the maximum specific interfacial area was shown to correlate well with inverse median grain diameter. The properties of the porous medium thus appear to have a greater influence on the magnitude of specific total interfacial area for a given saturation than fluid properties for the dominantly water-wetting media employed. Such a condition enhances the translatability of observations and parameter measurements among systems comprising different fluid pairs, and for example, is anticipated to simplify mathematical modeling of fluid behavior.
Author Contributions
Methodology, M.L.B., M.E.N., G.S., J.A. and J.M.; Validation, M.E.N., G.S., J.A. and J.M.; Formal analysis, M.L.B., M.E.N., G.S., J.A. and J.M.; Investigation, M.L.B., M.E.N., G.S., J.A. and J.M.; Resources, M.L.B.; Writing—original draft, M.L.B.; Writing—review & editing, M.E.N., G.S., J.A. and J.M. All authors have read and agreed to the published version of the manuscript.
Funding
This research was supported in part by the National Institute of Environmental Health (NIEHS) Superfund Basic Research Program (#E504940).
Data Availability Statement
The original contributions presented in this study are included in the article. Further inquiries can be directed to the corresponding author.
Acknowledgments
We thank the reviewers for their constructive and supportive comments. Im-aging experiments were performed at GeoSoilEnviroCARS (Sector 13), Advanced Photon Source (APS), Argonne National Laboratory. GeoSoilEnviroCARS is supported by the National Science Foundation—Earth Sciences (EAR-0217473), Dept. of Energy Geosciences (DE-FG01-94ER14466), and the State of Illinois. Use of the APS was supported by the U.S. Department of Energy, Basic Energy Sciences, Office of Energy Research, under Contract No. W-31-109-Eng-38. The authors would like to thank the following UA students: Asami Murao, Erica DiFilippo, Hilary Janousek, Zack Ellett, Ann Russo, and Hazel Cox, and also Mark Rivers (APS) for their assistance.
Conflicts of Interest
The authors declare no conflict of interest.
References
- Araujo, J.B.; Brusseau, M.L. Assessing XMT-measurement variability of air-water interfacial areas in natural porous media. Water Resour. Res. 2020, 56, e2019WR025470. [Google Scholar]
- Brusseau, M.L.; Peng, S.; Schnaar, G.; Costanza-Robinson, M.S. Relationships among air-water interfacial area, capillary pressure, and water saturation for a sandy porous medium. Water Resour. Res. 2006, 42, W03501. [Google Scholar]
- Brusseau, M.L.; Peng, S.; Schnaar, G.; Murao, A. Measuring air-water interfacial areas with X-ray microtomography and interfacial partitioning tracer tests. Environ. Sci. Technol. 2007, 41, 1956–1961. [Google Scholar] [CrossRef]
- Brusseau, M.L.; Araujo, J.B.; Narter, M.; Marble, J.C.; Bigler, M. Microtomographic measurements of total air-water interfacial areas for soils. Water Resour. Res. 2024, 60, e2023WR036039. [Google Scholar]
- Costanza-Robinson, M.S.; Harrold, K.H.; Lieb-Lappen, R.M. X-ray microtomography determination of air-water interfacial area-water saturation relationships in sandy porous media. Environ. Sci. Technol. 2008, 42, 2949–2956. [Google Scholar]
- Culligan, K.A.; Wildenschild, D.; Christensen, B.S.B.; Gray, W.; Rivers, M.L.; Tompson, A.F.B. Interfacial area measurments for unsaturated flow through a porous medium. Water Resour. Res. 2004, 40, W12413. [Google Scholar] [CrossRef]
- Willson, C.S.; Lu, N.; Likos, W.J. Quantification of grain, pore, and fluid microstructure of unsaturated sand from X-ray computed tomography images. Geotech. Test. J. 2012, 35, 911–923. [Google Scholar] [CrossRef]
- Schnaar, G.; Brusseau, M.L. Pore-scale characterization of organic immiscible-liquid Morphology in natural porous media using synchrotron X-ray microtomography. Environ. Sci. Technol. 2005, 39, 8403–8410. [Google Scholar]
- Al-Raoush, R.I. Impact of wettability on pore-scale characteristics of residual nonaqueous phase liquids. Environ. Sci. Technol. 2009, 43, 4796–4801. [Google Scholar] [CrossRef] [PubMed]
- Al-Raoush, R.I. Experimental investigation of the influence of grain geometry on residual NAPL using synchrotron microtomography. J. Contam. Hydrol. 2014, 159, 1–10. [Google Scholar] [CrossRef] [PubMed]
- Al-Raoush, R.; Willson, C.S. A pore-scale investigation of a multiphase porous media system. J. Contam. Hydrol. 2005, 77, 67–89. [Google Scholar] [CrossRef] [PubMed]
- Booth, J.M.; Tick, G.R.; Akyol, N.H.; Greenberg, R.R.; Zhang, Y. Experimental comparison of agent-enhanced flushing for the recovery of crude oil from saturated porous media. J. Contam. Hydrol. 2019, 226, 103504. [Google Scholar] [CrossRef] [PubMed]
- Brusseau, M.L.; Janousek, H.; Murao, A.; Schnaar, G. Synchrotron X-ray microtomography and interfacial partitioning tracer test measurements of NAPL-water interfacial areas. Water Resour. Res. 2008, 44, W01411. [Google Scholar] [CrossRef] [PubMed]
- Brusseau, M.L.; Narter, M.; Schnaar, S.; Marble, J. Measurement and Estimation of Organic-liquid/Water Interfacial Areas for Several Natural Porous Media. Environ. Sci. Technol. 2009, 43, 3619–3625. [Google Scholar] [CrossRef]
- Culligan, K.A.; Wildenschild, D.; Christensen, B.S.B.; Gray, W.; Rivers, M.L. Pore-scale characteristics of multiphase flow in porous media: A comparison of air-water and oil-water experiments. Adv. Water. Resour. 2006, 29, 227–238. [Google Scholar] [CrossRef]
- Ghosh, J.; Tick, G.R. A pore scale investigation of crude oil distribution and removal from homogeneous porous media during surfactant-induced remediation. J. Contam. Hydrol. 2013, 155, 20–30. [Google Scholar] [CrossRef]
- Ghosh, J.; Tick, G.R.; Akyol, N.H.; Zhang, Y. A pore-scale investigation of heavy crude oil trapping and removal during surfactant-enhanced remediation. J. Contam. Hydrol. 2019, 223, 103471. [Google Scholar] [CrossRef]
- Hu, Y.; Zhang, C.; Patmonoaji, A.; Shea, Y.; Matsushita, S.; Suekane, T. Pore-scale investigation of wettability impact on residual Nonaqueous phase liquid dissolution in natural porous media. Sci. Total. Environ. 2021, 787, 147406. [Google Scholar] [CrossRef]
- Johns, M.L.; Gladden, L.F. Surface-to-volume ratio of gaglia trapped in small-pore systems determined by pulsed-field gradient nuclear magnetic resonance. J. Colloid Interface Sci. 2001, 238, 96–104. [Google Scholar] [CrossRef]
- McDonald, K.; Carroll, K.C.; Brusseau, M.L. Comparison of fluid-fluid interfacial areas measured with X-ray microtomography and interfacial partitioning tracer tests for the same samples. Water Resour. Res. 2016, 52, 5393–5399. [Google Scholar] [CrossRef]
- Narter, N.; Brusseau, M.L. Comparison of interfacial partitioning tracer test and high-resolution microtomography measurements of fluid-fluid interfacial areas for an ideal porous medium. Water Resour. Res. 2010, 46, W08602. [Google Scholar]
- Porter, M.L.; Wildenschild, D.; Grant, G.; Gerhard, J.I. Measurement and prediction of the relationship between capillary pressure, saturation, and interfacial area in a NAPL-water-glass bead system. Water Resour. Res. 2010, 46, W08512. [Google Scholar] [CrossRef]
- Schnaar, G.; Brusseau, M.L. Characterizing pore-scale dissolution of organic immiscible liquid in natural porous media using synchrotron X-ray microtomography. Environ. Sci. Technol. 2006, 40, 6622–6629. [Google Scholar] [CrossRef]
- Schnaar, G.; Brusseau, M.L. Characterizing pore-scale configuration of organic immiscible liquid in multi-phase systems with synchrotron X-ray microtomography. Vadose Zone J. 2006, 5, 641–648. [Google Scholar] [CrossRef]
- Carroll, K.C.; McDonald, K.; Marble, J.; Russo, A.E.; Brusseau, M.L. The impact of transitions between two-fluid and three-fluid phases on fluid configuration and fluid-fluid interfacial area in porous media. Water Resour. Res. 2015, 51, 7189–7201. [Google Scholar] [CrossRef]
- Zhang, C.Y.; Werth, C.J.; Webb, A.G. A magnetic resonance imaging study of dense nonaqueous phase liquid dissolution from angular porous media. Environ. Sci. Technol. 2002, 36, 3310–3317. [Google Scholar] [CrossRef]
- Fontenot, M.M.; Vigil, R.D. Pore-scale study of nonaqueous phase liquid dissolution in porous media using laser-induced fluroescence. J. Colloid Interface Sci. 2002, 247, 481–489. [Google Scholar] [CrossRef] [PubMed]
- Ovdat, H.; Berkowitz, B. Pore-scale study of drainage displacement under combined capillary and gravity effects in index-matched porous media. Wat. Resour. Res. 2006, 42, W06411. [Google Scholar] [CrossRef]
- Karpyn, Z.T.; Piri, M.; Singh, G. Experimental investigation of trapped oil clusters in a water-wet bead pack using X-ray microtomography. Wat. Resour. Res. 2010, 46, W04510. [Google Scholar] [CrossRef]
- Landry, C.J.; Karpyn, Z.T.; Piri, M. Pore-scale analysis of trapped immiscible fluid structures and fluid interfacial areas in oil-wet and water-wet bead packs. Geofluids 2011, 11, 209–227. [Google Scholar] [CrossRef]
- Rivers, M.L. GSECARS Tomography Software. 2008. Available online: http://cars9.uchicago.edu/software/index.html (accessed on 1 June 2008).
- Ketcham, R.A. Computational methods for quantitative analysis of three-dimensional features in geological systems. Geosphere 2005, 1, 32–41. [Google Scholar] [CrossRef]
Disclaimer/Publisher’s Note: The statements, opinions and data contained in all publications are solely those of the individual author(s) and contributor(s) and not of MDPI and/or the editor(s). MDPI and/or the editor(s) disclaim responsibility for any injury to people or property resulting from any ideas, methods, instructions or products referred to in the content. |
© 2025 by the authors. Licensee MDPI, Basel, Switzerland. This article is an open access article distributed under the terms and conditions of the Creative Commons Attribution (CC BY) license (https://creativecommons.org/licenses/by/4.0/).