Abstract
The Great Salt Lake has shrunk significantly in volume since non-native settlement started. Most of that shrinkage has occurred in recent years. There are many adverse consequences associated with the shrinking of the lake, so avoiding the lake drying completely is desirable. To prevent this from happening, the causes of the drying need to be determined. Previous studies suggest that drying is due to a combination of water diversion for agricultural and municipal use and a decades-long drought. While municipal water use has been mentioned in other studies, it has sometimes been presented as a solution to the drying of the lake. As agriculture uses more water per hectare than urban areas, a prevalent notion is that urban expansion results in water savings. This viewpoint assumes that urban areas are predominantly developed on agricultural land. In this paper we quantify land use change in the Great Salt Lake basin over the last ~40 years and associated likely water diversion quantities based on average irrigation needs for different crops and for urban areas. We determine whether recent urbanization has occurred on natural or agricultural lands and has therefore increased or decreased water demand. Our results show that the cultivated crop area in Salt Lake County decreased markedly in the 2002–2007 and 2018–2023 periods, while developed land increased far more than the decrease in agricultural land. For the 2008–2023 period, far more natural land uses have been converted to urban uses than conversions from agricultural land, meaning that water demand has increased with urbanization. Also, alfalfa has a high water demand and has increased in area. Nevertheless, the increased irrigation water use from the alfalfa area has been smaller than the increase in water use from urban development. Results show that for the four most populous counties, >75% of land use change from 2008 to 2023 has resulted in a net increase in water use. Even for the more agricultural Cache County, Utah, and Franklin County, Idaho, >50% of land use change resulted in a net increase in water use. The results of this study have important implications for the planning of future urban development if the Great Salt Lake is to be preserved.
1. Introduction
Lakes are known to be temporary features in geomorphic time scales, as they naturally fill with sediment, dry up, or drain. Yet in the 20th and 21st centuries, several significant lakes globally have greatly shrunk in size or have become wholly desiccated for other reasons. The Aral Sea was once the fourth largest lake in the world and is now a small fraction of its original size [1]. Similarly, Goudie [2] lists several lakes that have dried up significantly or completely and have contributed to dust storms: Owens Lake, Salton Sea, and Mono Lake in the USA; Old Wives Lake in Canada; Lake Urmia in Iran; the Aral Sea and Lake Ebinur in China [3,4,5,6,7,8,9,10,11]. Other major terminal and saline lakes that have decreased in size in recent years include the Dead Sea in Israel [12], Lake Poopó in Bolivia [13], and the Great Salt Lake in the western United States [14]. Climate change and associated local droughts have no doubt contributed to the reduction in the size of these lakes, such as the Dead Sea [12,15,16]. Also, Lake Poopó in Bolivia has been shown to fluctuate with precipitation rates; however, levels were still low in 2013–2015 despite average rainfall years [13], so there must be a combination of causes affecting water levels.
The decrease in the size or drying up of some major lakes has been attributed to water diversion for use in municipal areas and irrigated agriculture. A classic example is Owens Lake, California, which has been dry since 1920 after the Los Angeles Aqueduct was constructed and diverted water from the Owens River [17]. Also, diversions of water for irrigating crops from the Aral Sea [1] and brine extractions from the Dead Sea have significantly decreased their size [15,16]. Irrigation water has been extracted from the Aral Sea for centuries, but massive irrigation projects that began in 1958 led to a nearly five-fold decrease in the volume of water present [1,18]. The relative contributions of diversions for municipal and agricultural water use can be difficult to quantify against the backdrop of a warmer and drier climate, but investigating land use change and determining what land uses use the most water can inform agricultural policies and urban planning guidelines. This paper uses land use and land change analysis along with average water use rates for different land uses to investigate key influences on water levels in the Great Salt Lake, USA. For clarity, this study is not investigating consumptive use of water by each land use via evapotranspiration; rather, it is investigating the average volume of water withdrawn to irrigate particular crops and for urban land uses and how these water withdrawals from the system have likely increased or decreased flow into the Great Salt Lake.
The Great Salt Lake (GSL) is the eighth largest terminal lake in the world and the largest terminal lake in the western hemisphere [19]. The GSL basin is a large watershed in the intermountain west of the United States, with all water eventually flowing to the GSL [20]. The basin includes most of northern Utah and parts of Idaho, Wyoming, and Nevada [20]. The GSL is salty because there is no outlet for water other than evaporation; salt is left behind in the evaporation process, causing the concentration of salt in the lake to grow [21]. Salt concentrations in the GSL range from 5% to 29% [22] compared to an average of 3.5% in oceans [23]. The salt concentration is highest in the north arm of the lake due to the Lucin Cutoff, where the railroad crosses the lake on an earthen causeway [22]. Rain is scarce in the GSL basin; 90–95% of Utah’s water supply comes from mountain snowfall in the winter [24]. Snowmelt passes through a system of rivers, lakes, and manmade reservoirs before reaching the GSL. Much of the water is diverted for agriculture, municipal and industrial purposes, and never reaches the GSL. Municipal and agricultural water diversions are partially why the GSL has lost 73% of its water since 1850 [25].
Wurstbaugh and Sima [26] estimate that 75% of GSL water loss can be explained by human water uses, while 25% of the loss can be explained by a millennial drought. Recently, this millennial drought, occurring in the Southwest United States and Northern Mexico, has been classified as a megadrought [27]. Megadroughts last decades or even centuries [28]. Researchers have determined, utilizing tree ring reconstruction methods and hydrological modeling, that the megadrought began around 2000 and has been the driest period in the region since the late 1500s [29]. A combination of drought and high demands on the limited freshwater supply has accelerated the GSL’s decline.
While in the early years of settlement in the area, the GSL was not considered useful due to the salt content of the water, many adverse consequences of a drying GSL have been identified in recent years. These include loss of an ecosystem for migratory birds and brine shrimp, decreased snowfall due to loss of lake effect snows, and negative impacts on air quality as dried lakebed sediments are picked up in high winds [14]. Researchers believe that the consequences of a drying GSL have been severely underestimated [14]. Indeed, the combined value of earnings generated from economic activity surrounding the lake that could be lost and the savings that would result from reduced damage of a dry lakebed are estimated to reach USD 1.32 billion per year [30]. Potash (potassium salts) is a required ingredient in many fertilizers. These minerals also contribute to soap, glass, ceramics, and battery production. Utah, because of the GSL, is one of only three US states where potash production is feasible [31]. Additionally, 21 companies harvest brine shrimp from the lake. Their efforts bring anywhere from USD 10 to 60 million to Utah’s economy annually, depending on the quality of the harvest [32]. Brine shrimp also feed millions of migratory birds. The shrimp, in addition to the wetland habitat, makes the GSL extremely valuable to these animals and the local ecosystem [30,33,34]. Like the birds, human health is also negatively impacted by the drying lake. Lakebed dust potentially containing toxic levels of heavy metals affects air quality as it is picked up by the wind and blown into urban areas [35]. Some of the dust gets blown further into the mountains and settles on the snow, which accelerates snowmelt and increases pressure on downstream water systems [36], given that mountain snow provides 90–95% of Utah’s water supply [24].
The high cost of freshwater necessitates investigating its use, especially because current anthropogenic use/extraction rates are not sustainable. The lake normally fluctuates by 5 to 30% during prolonged wet or dry periods [37], but natural fluctuations are far less than the 73% overall decline since the arrival of non-native inhabitants in the area in the mid-1800s. Irrigated agriculture is often blamed for high water use due to being responsible for 75% of total freshwater usage in the basin [38,39]. This high proportion of water use comes while only making up between 2.1 and 2.8% of all land area in the GSL basin [40]. Of agricultural crops, alfalfa is prevalently grown in the GSL basin and requires significant irrigation. Consequently, alfalfa irrigation needs are a main driver of agriculture’s high water requirement. Experts estimate that alfalfa exports cost the basin an amount of water the size of Utah Lake each year [41], and popular sources blame alfalfa for using over half of Utah’s water supply [42]. Complexity in the issue arises because of water rights and economic benefits coming from the agricultural industry. Within crop production, consumptive use rates are higher outside of Utah but still affect GSL water levels, which further complicates the issue as interstate agreements are needed [43].
A growing body of research has concluded that as urban population grows, total water use will decrease [44]. This research is based on the logic that agriculture, particularly alfalfa growth, uses more water per hectare than urban land uses, so as urban land use replaces agricultural land use, water consumption will decrease. Other studies have found that although water consumption per capita has decreased because of the conversion of agricultural land to urban areas, the overall municipal water usage has still increased [30] because of high population growth rates within the GSL basin [45].
Utah was the fastest-growing state according to the 2020 census, with 35% of growth resulting from net migration [46] and 90% of expansion occurring in urban areas [47]. Urban development can only cause a reduction in water use if the previous land uses required extraction or diversion of more water than the urban development does or if the overall municipal water savings are greater than the additional water usage of new developments. Cities increase demand for water through residences having sinks, showers, and indoor plumbing, but also municipal parks, grounds of retail parks, and suburban residential lots all commonly have irrigated turfgrass in Utah [48]. Firefighting is an example of additional and heavy demands on water associated with urban development, a demand that could become even greater with climate change [38,49]. Certain industrial processes that tend to occur in urban areas, such as data centers for AI, can increase water consumption [50]. Also, the Kennecott Copper Mine, the deepest open-pit mine in the world, which is located in the Salt Lake Valley, uses large amounts of water to keep the slopes of the mine damp and reduce particulate matter air pollution [51].
Our research investigates land use change in the GSL basin between 1985 and 2024 as well as specific agricultural land uses and crops grown between 2008 and 2024. Our aim is to determine if conversion of various types of land to urban areas has had an overall negative or positive impact on water quantities reaching the GSL. We investigate for the overall time period and parts of the time period what types of land use were converted to urban development and the likely impacts of this on water use through calculations based on changes in area of different land uses or crops grown and the average irrigation/water use requirements per unit area per crop or land use. We also investigate temporal and spatial differences in what land uses were converted to urban developments in the GSL basin and the likely impact of these differences on water levels in the lake. Land classification groups were used to compare the amounts of agricultural land and natural land being converted to urban developments. Our aim is to use this detailed land use/land cover analysis to determine the major sources of decreases in the amount of water reaching the GSL and for the results to inform agricultural and urban planning policies that will ensure preservation of the lake within normal fluctuation levels of 5 to 30% during future prolonged wet or dry periods [37].
2. Materials and Methods
2.1. Climate Data
Climate normals for 1981–2010 and 1991–2020 of average, minimum, and maximum temperatures and precipitation for Salt Lake City International Airport were obtained from the National Oceanic and Atmospheric Administration [52]. Also obtained were historical values of average monthly minimum, maximum, and average temperatures and precipitation for the 1985–2025 period [52]. These data were processed and graphed to show changes in temperature and precipitation seasonal patterns in the GSL area over the study period of 1985–2023.
2.2. National Land Cover Dataset
The National Land Cover Dataset (NLCD) gives land use/land cover (LULC) classifications produced from Landsat imagery [53] and extensively maps 21 land classes, including developed land (open space, low intensity, medium intensity, and high intensity developed land). The annual NLCD land cover dataset uses land cover classes that have been derived from the 1976 Anderson land use and land cover classification system [54]. This system was designed to allow compatibility with existing classification systems across U.S. federal agencies and uses remotely sensed data. This dataset summarizes agricultural land uses into two categories of pasture/hay and cultivated crops and has a variety of wild/natural land classes. The NLCD includes historical classifications dating back to 1985.
A change detection study—a study aiming to quantify aerial changes in land classes from 1985 to 2023—was performed using ESRI’s ArcGIS pro version 3.5.2. [55]. LULC changes were also assessed for 5-year periods within the overall study period: 1985–1990, 2002–2007, and 2018–2023 to evaluate temporal patterns or differences in trends regarding LULC change. An accuracy study for the NLCD data when there was just temporal coverage for 2001–2016 showed that the level 1 overall classification accuracy was 79% for 2011 and 91% for 2016 [56]. This lower overall accuracy in 2011 could interfere slightly with the land use change analysis in this paper, as it suggests that classification accuracy improved over time. Nevertheless, as the vast majority of Utah’s territory includes vast areas with natural/wilderness land uses, the accuracy of the LULC classes is likely to be greater in Utah than in densely populated or agricultural states. The NLCD provides helpful insights into large-scale tendencies of land types in the GSL basin; however, the land classes lack sufficient precision for estimating irrigation water use within agriculture. Particularly, the land class “cultivated crops” represents many different crops needing varying amounts of irrigation water. To estimate irrigation water use in this study, the areas of specific crops were needed so that water estimates could be applied to each area, resulting in overall irrigation water use estimates for each crop.
2.3. Cropscape Dataset
Due to the need for greater precision in land classes, Cropscape, a land classification produced by George Mason University [57], was used for water consumption estimates. This classification includes NLCD-derived classes for wild/natural land uses and developed land [57] and replaces the two classes of pasture/hay and cultivated crops with numerous classifications for different crops. The area of land classes/crops for each year from 2008 to 2023 within the GSL basin was calculated from land use classifications of specific crops produced by Cropscape [36]. Cropscape has 30 m pixels and determines land use/crops grown per growing season based on the reflectance characteristics of different crops from time-series analysis of Landsat imagery. Cropscape produces a LULC classification map each year for the entire United States. They estimate that the classifications maintain 70% accuracy [57]. Given that in more recent years, e.g., 2016, the NLCD land cover data, which has far fewer categories for classification than the Cropscape dataset, had an overall accuracy of 91% [56], it can be assumed that classification inaccuracies in the Cropscape data are more likely to occur for particular, rarer crops rather than widespread categories of developed, wild/natural lands or agricultural lands. We used both the NLCD (1985–2023) and Cropscape classifications (2008–2023) in this study due to their commonality in wild/natural and developed land classes and to meet different objectives. The NLCD data has greater temporal coverage to investigate changes over time in more detail. The Cropscape data has more resolution in terms of crop types so that spatial differences in irrigation water use by different crops could be investigated.
We extracted the Cropscape LULC classifications for a shapefile of the outline of the GSL basin, our study area. After importing the data into ArcGIS Pro [55], annual changes in LULC across the basin were calculated with the change detection tool from 2008 to 2023. The LULC change for the whole study period from 2008 to 2023 was also calculated. Land conversions were analyzed by individual classes/crops and by class groupings (natural, agricultural, and urban development—hereafter referred to as development).
2.4. Water Use Data
Municipal water use data, provided by Utah’s Division of Natural Resources for 2015–2020 [37], was applied to developed areas. The total municipal water usage for Utah in those years was divided by the area of developed land classes in Utah over the corresponding years to calculate a general water requirement per hectare for developed land. This number came out to be 0.3876 m ha−1 annually. The water estimate was applied to high-, medium-, and low-intensity development as well as developed open space. High-intensity development likely uses more water than medium- and low-intensity, but we did not have different water use figures for different levels of urban development. Developed open space includes parks and golf courses, meaning that it may also contribute to greater water consumption. These limitations of the study should be investigated with more detailed municipal water use data in the future.
Utah State University provided irrigation water requirements for prominent crops in acre-inches, which were then converted to meters per hectare (m ha−1). Table 1 shows the amount of irrigation water that is recommended for application for the main crops grown in Utah for an average growing season. These water requirements represent best practice for cultivating a successful crop in Utah in an average season. While some farmers may water their crops more or less than these amounts, it is assumed that these water requirements reflect the average because farmers look to optimize water usage in a way that maximizes production with the minimum amount of water required. Therefore, it is likely that a high percentage of farms water their crops at or near these rates unless a year is particularly hot and dry. Water usage for natural land was determined to be zero. Although plants and trees use water, we consider this to be part of the natural water cycle that would be associated with the normal fluctuation of 5 to 30% in the lake levels during prolonged wet or dry periods [58]. This study is investigating irrigation and municipal water use, and as water is not directly applied or diverted to water natural vegetation, the water use for natural and wild vegetation in this study is considered as zero (Table 1).

Table 1.
Average annual irrigated water requirement (from Utah State University).
Fluctuations in irrigation and municipal water use due to land use change were calculated by multiplying the difference in water requirements between two land classes that changed by the number of hectares that were converted between the same land classes. For example, if 100 hectares of land class A were converted into land class B between 2008 and 2009, and the water requirement for land class A was 0.10 m ha−1 and the water requirement for land class B was 0.20 m ha−1, then 0.20 minus 0.10 equals an increase of 0.10 m ha−1 of water use. A difference of 0.10 m multiplied by 100 hectares equals an increase of 10 m ha−1, or 1000 m3 in water used from 2008 to 2009. We did not have irrigation water use estimates for all possible crop type changes, as water consumption guidelines from Utah State University were not available for all possible crops, just those that are most prevalently grown within Utah. The water use for minor crops is unknown; however, the area accounted for with water estimates for known and major crops for the area made up 98% of the GSL basin, suggesting that these minor crops had little influence on overall changes in water use in the GSL basin. The total change in water consumption was calculated for each land class in terms of water consumption change caused by land conversions from that class to a new class. These values were then summed up to give the net change in water consumption by land class. Calculating the net change in water consumption in terms of each land class provides insights into what land types are causing the greatest increases in water use.
2.5. Normalized Difference Vegetation Index Study to Infer Grassland Water Use
No data was provided by Utah State University regarding whether grassland and pasture tend to be irrigated in Utah. Grassland/pasture in the GSL basin largely refers to grazing land for livestock, which introduced some ambiguity into irrigation levels for that class. Consequently, we undertook a brief investigation of the August Normalized Difference Vegetation Index (NDVI) of areas designated as grassland/pasture using Landsat imagery from August 2023. August NDVI was chosen as August is towards the end of the peak summer irrigation period, and any differences in NDVI between irrigated and non-irrigated areas would be at a maximum. NDVI measures the “greenness” or health of vegetation [59], and its values range from 0 to 1, with 1 representing lush, healthy vegetation. It has been noted that high NDVI values of 0.6 to 0.9 indicate dense vegetation like rainforests or irrigated crops, moderate NDVI values of 0.2 to 0.5 indicate sparse vegetation like wild grasslands or senescing crops, and very low NDVI values of <0.1 indicate barren areas like rock, sand, or snow [60]. Based on these ranges of NDVI values, an August NDVI threshold of 0.4 was applied to areas classified as grassland to determine whether Utah grassland/pasture areas were generally irrigated. Nearly all areas classified as grassland/pasture had August 2023 NDVI values below 0.4, which indicates sparse or stressed vegetation; thus, we estimated that 98% of grassland/pasture areas receive little/no irrigation water.
3. Results and Discussion
3.1. Climate Trends for Salt Lake City 1985–2023
Figure 1 shows climate normal (30-year averages of weather) for 1981–2010 and for 1991–2020 for Salt Lake City airport, which is centrally located in the GSL basin. This shows that over the study period 1985–2023, there has been an increase in average minimum, average, and maximum temperatures in all months during the study period, with the temperature normal lines for 1991–2020 all being higher than those for 1981–2010 (Figure 1a). This shows the distinct warming trend in the GSL basin. Also, the gaps between the normals for the two time periods are greatest for minimum temperatures for all months, suggesting particularly that snow, the main source of freshwater in the area, is less likely to fall in all months given that minimum temperatures below 0 °C were rarer for 1991–2020 than 1981–2010. Along with this universal average warming trend for all months, precipitation normals for 1991–2020 are drier than those for 1981–2010 in most months (Figure 1b). This shows that along with hotter temperatures and greater evapotranspiration, early snowmelt and less snowfall, less precipitation was received during 1991–2020 compared to 1981–2010.
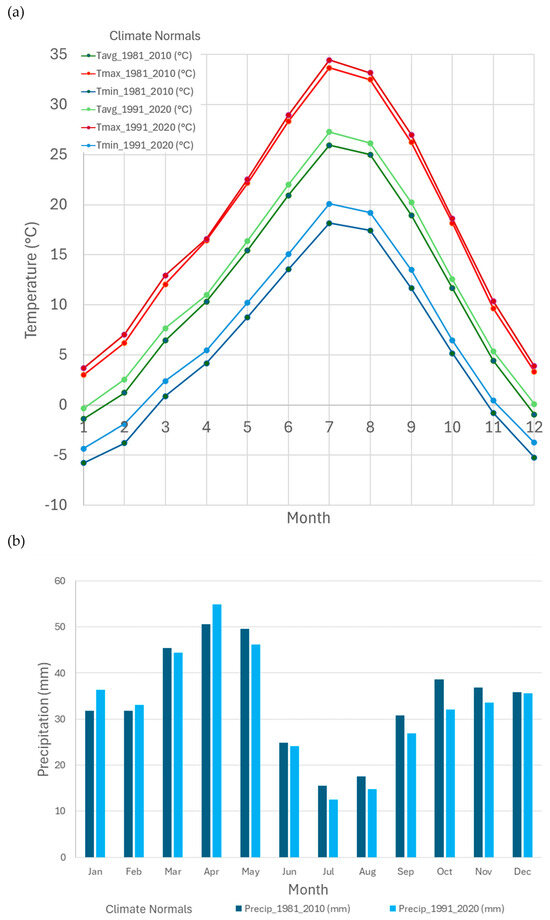
Figure 1.
(a) Average, maximum, and minimum monthly temperature 1981–2010 and 1990–2020 climate normals for Salt Lake City Airport and (b) average monthly precipitation 1981–2010 and 1990–2020 climate normals for Salt Lake City Airport.
The actual historic average minimum, average, and maximum monthly temperatures were also investigated. Table 2 summarizes any trends that were observed in the temperatures and precipitation for each month during the 1985–2025 period. These trends were derived from plots of temperatures and precipitation for a given month for 1985–2025. Some examples of these plots are shown in Figure S1 in Supplemental Information. Regression lines were fit to the plots (see Figure S1 Supplemental Information), and the change in temperature or precipitation between the beginning and end of the regression line was estimated and is shown in Table 2. This shows that for actual temperature data, there was an increase in maximum temperatures during the study period for all months apart from March–May, where the regression line was flat. This shows that most months were markedly warmer by 2025 than in 1985. Table 2 also shows that most months (April, May, June, July, September, October, and November) showed a decrease in precipitation between 1985 and 2025. This being said, Table 2 also shows that there was a trend for bigger increases in precipitation in March, August, and December. However, much of this extra precipitation is likely to evaporate given the increase in maximum, average, and minimum temperatures.

Table 2.
Summary of changes in climate for the Salt Lake City Airport between 1985 and 2025 shown by regression lines fitted to monthly average maximum temperatures and precipitation.
This brief analysis of climate data is consistent with the lake losing an estimated 25% of its water due to the millennial drought [26] over the study period 1985–2023, with lower precipitation levels in most months and higher temperatures increasing evaporation rates for all months. In the future, change in snowfall in the mountainous areas of the GSL basin should also be investigated, as this is where Utah gains 90–95% of its water supply [24].
3.2. Changes in Land Use Based on Landsat National Land Cover Dataset
The change detection analysis, spanning the period from 1985 to 2023, performed with Landsat National Land Cover Dataset LULC classifications [53] determined the greatest LULC conversion in terms of area changed from open water to barren land. The distribution of this LULC transformation is depicted in Figure 2a in pink along with the other most common LULC changes, which are shown by other colors. Where no color appears, the LULC did not change between 1985 and 2023. Most of the open water to barren changes form a ring around the GSL, reinforcing the degree to which the GSL has shrunk over the last 30–40 years. Shrubland frequently appears among the most prevalent LULC changes, with significant portions of the basin transitioning from grassland to shrubland and vice versa. Interestingly, shrubland replaced considerable amounts of evergreen forest, with deciduous forests also commonly taking the place of shrubland. These patterns both emerge in the Wasatch and Uinta Mountain ranges and are likely due to forests being burned by wildfires, with shrubland being a transitional stage as natural succession towards the original native vegetation occurs. Additionally, many cultivated fields near the Utah-Idaho border in existence in 1985 had become shrubland by 2023. This suggests a rural-urban migration over the study period with abandonment of farmland. It could also suggest an intensification of agriculture with similar volumes of crops being produced from less land [14,48]. The inferred resulting reduction in human activity could signal a decrease in water consumption in these areas, or more water may be applied to crops per hectare in recent years given the drought, but this is difficult to confirm without historical water use data rather than just irrigation recommendations and average municipal uses. Given the scale of Figure 2a, changes in developed land could not be clearly seen as they were far less common than other land class changes shown and were interspersed among and around the edges of existing developed areas. Therefore, they were not included in the map as they were not among the most prevalent land use changes for the whole study area.
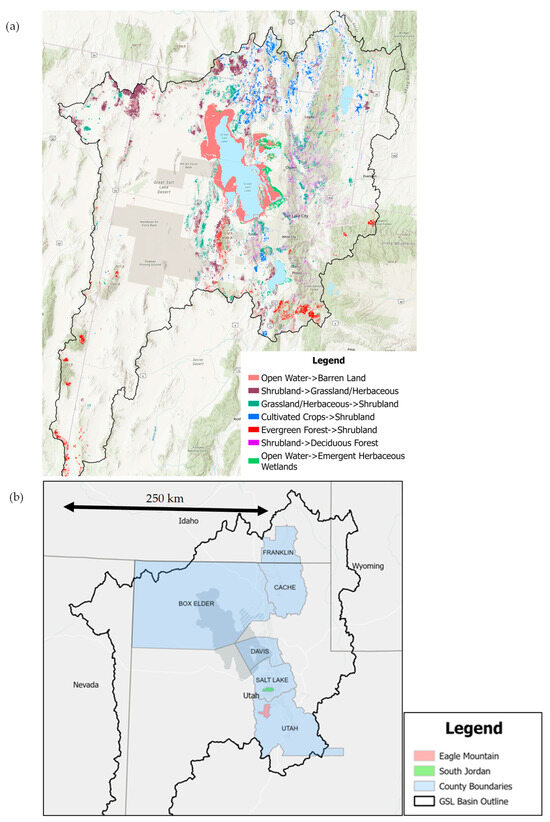
Figure 2.
(a) Distribution of most abundant land use land class (LULC) conversions from 1985 to 2023 based on Landsat National Land Cover Dataset (NLCD) for the Great Salt Lake Basin and (b) map showing locations of areas of interest within the GSL basin: six counties—Salt Lake, Utah, Davis, Box Elder, Cache, and Franklin—and two cities: Eagle Mountain and South Jordan.
Given that a large area that was open water in 1985 became barren land by 2023, it is not surprising that open water shows the largest net decrease and barren land the corresponding largest net increase between 1985 and 2023, as shown in Figure 3. Most of the reduction in open water took place before 2018. From 2018 to 2023, open water actually expanded by 3.2%. Over the 1985 to 2023 period, deciduous forests notably grew by 16.41%. Pasture/hay and cultivated crops both decreased in area, and all types of development increased, illustrating a gradual rural-to-urban shift. Figure 3a shows that the increases in barren land and associated decreases in open water from the shrinking of the GSL dominate the land use changes in terms of hectares. When comparing the number of hectares that have changed to developed land, this appears small (Figure 3a), but when this is looked at as a percentage change in area (Figure 3b), it is clear that the total developed area in the GSL basin has more than doubled. In terms of percentage gains, developed medium- and high-intensity areas both saw expansion of over 140%, each more than doubling in area.
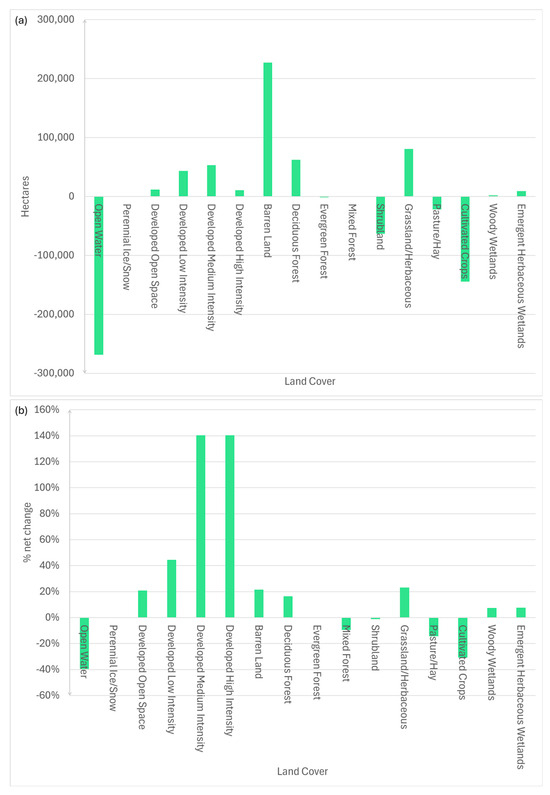
Figure 3.
(a) Net change in hectares and (b) percentage change in NLCD land classes in the Great Salt Lake Basin from 1985–2023.
When shorter time periods are examined within the whole study period (1985–2023), temporal patterns also emerge from the NLCD change detection analysis. Figure 4 is made up of bar charts showing the net change in area (hectares) for Salt Lake and Utah counties, the two most populous counties in the GSL basin, for three windows of time: 1985–1990, 2002–2007, and 2018–2023. Maps that show the spatial patterns that are summarized in the bar charts of Figure 4 are shown in Figure S2 in the Supplemental Information Appendix. The location of Utah County and Salt Lake County within the basin can be found in Figure 2b. Salt Lake and Utah counties experienced the most growth in urban development between 2002 and 2007, as shown in Figure 4 and Figure S2. Developed medium-intensity land, the land class related to suburban areas, repeatedly showed especially high growth in the 2000s. Open water follows an interesting pattern throughout the study period. From 1985 to 1990, water levels dropped significantly. Between 2002 and 2007, open water in Salt Lake County continued to decline but increased in Utah County and then increased in both counties from 2018 to 2023, possibly resulting from efforts to maintain water levels in Utah Lake and the GSL. Pasture/hay and cultivated crops lost area in each county during each period as farmland was developed or abandoned, becoming natural land, as depicted in Figure S2.
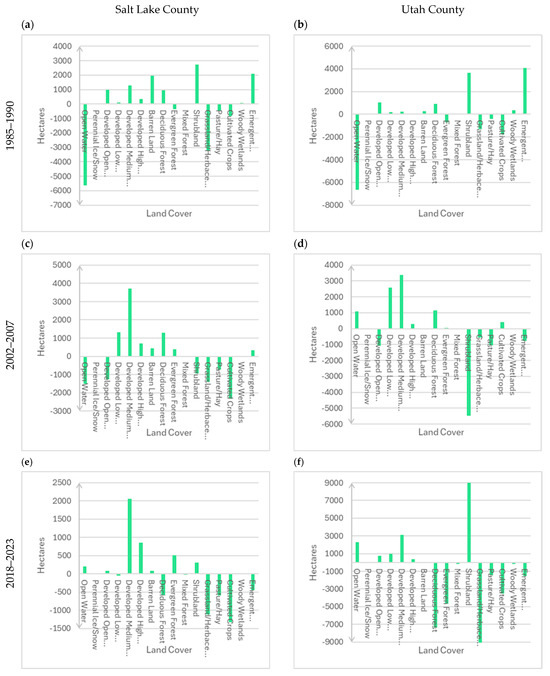
Figure 4.
Net change in area (hectares) from 1985 to 1990 in (a) Salt Lake County and (b) Utah County, 2002–2007 in (c) Salt Lake County and (d) Utah County, and 2018–2023 in (e) Salt Lake County and (f) Utah County.
The maps in Figure S2 in Supplemental Information each portray similar trends: a predominant increase in urban development areas resulting from the development of agricultural (blue) and natural land (orange), and some switching between agriculture and natural areas, particularly in the western half of Utah County. Urban expansion was most pronounced between 2002 and 2007, with significant development and rising intensity of development continuing through 2018–2023. Urban expansion post-2002 was facilitated by the expansion of the freeway system on the Wasatch Front for Salt Lake City to host the 2002 Winter Olympics. This major urban expansion also coincided with the approximate start of the drought in 2000 [29]. The 1985–1990 window experienced less urban development than the other two time periods but still showed considerable growth. Figure S2a shows that development of land in Salt Lake County for the 1985–1990 period was almost equally split between conversions from agriculture (blue) and natural land (yellow). In contrast, Figure S2b shows that in Utah County for 1985–1990 agricultural (blue) land conversions to urban development dominated. These patterns are confirmed by Figure 4a,b which show a far greater loss in grassland/herbaceous areas for Salt Lake County than Utah County for the 1985–1990 time period. These results suggest where the notion that ‘urban expansion reduces water use because mostly agricultural land, which uses more water, is converted to urban areas’ developed. The notion seems to have its origins in the 1985–1990 period when agricultural land was the dominant type of land being converted to urban developments. However, results show that this was not the case for later time periods in Salt Lake and Utah counties.
3.3. Changes in Municipal and Irrigation Water Use Resulting from Changes in Crops/Land Use
We estimated effects of LULC change on overall municipal and irrigation water use using the average annual water requirements shown in Table 1 and the average area of each land class. The average annual water use attributed to each land class was calculated for 2008–2023, the dates for which Cropscape data were available, as shown in Table 3. From 2008 to 2023, alfalfa contributed most to human water use in the GSL basin, exhausting over one million m3 of water annually. The second highest user of water during the same period was calculated as developed land at about 930,000 m3. Other hay/non-alfalfa was the third largest user of water in the basin, but the levels were calculated as being about one-third of the water that was used by developed areas. So alfalfa and developed areas are by far the biggest users of water in the GSL basin. When water consumption was translated into terms of the land class groups, agriculture was found to use 85% of water and developed land 15%. Within the GSL basin, the average agricultural area is about 4.4 times greater than the average area of developed land, so the disparity is partially caused by the much greater area and partially caused by higher water requirements of agriculture.

Table 3.
Average water consumption by land class in cubic meters.
The Cropscape LULC classifications for the whole GSL basin and the most populous area can be seen in Figure 5. Different types of forests have similar colors as they are considered similar land types. Also, different levels of development are all shown in gray to illustrate that we only have one figure for water use for developed areas. This is a limitation of the current study, which we can try to address in future studies as more data from municipal water authorities is gained. Figure 5 shows that most land in the GSL basin is natural; the land proportions in 2008 and 2023 and their change over time are shown in Figure 6. There is a narrow area along the east side of the GSL and Utah Lake called the Wasatch Front where most of the developed land is located. Agriculture is spread throughout the Wasatch Front, with the majority being found in the northern part of the basin (e.g., Cache County) and south of Utah Lake (Southern Utah County). The most noticeable difference between Figure 5b,c (portraying the Wasatch Front in 2008 and 2023) is the area covered by water from the GSL. This mirrors the change detection results found using the NLCD (Figure 2a). From 2008–2023, developed land increased by 59,000 hectares, and agricultural and natural land decreased by 29,000 and 30,000 hectares, respectively, as shown in Figure 6. However, this does not mean that 29,000 hectares of agriculture and 30,000 hectares of natural land were developed. A significant portion of agricultural land was converted to natural land. An example of this is the vast amounts of cultivated land becoming shrubland in Figure 2a. Another example can be seen in Figure 5b,c, where many winter wheat fields on the west side of Utah Lake in 2008 became unused, and natural growth of shrubland had ensued by 2023. This suggests that these areas may have been more marginal or less profitable farmland that was hard to irrigate during the ongoing drought. Nevertheless, while natural and cultivated land are both still much more abundant than developed land in 2008 and 2023, in Figure 5c a large increase in developed land is obvious, as is a decrease in both cultivated and natural land.
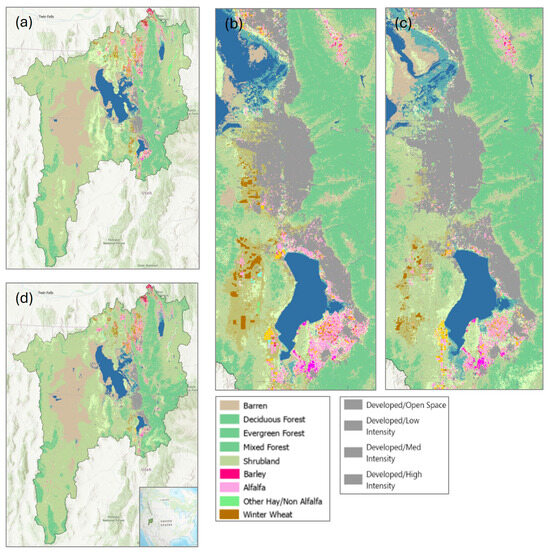
Figure 5.
Cropscape land use/land class classifications for (a) 2008 Great Salt Lake Basin, (b) 2008 Salt Lake and Utah County’s most populous areas, (c) 2023 Salt Lake and Utah County’s most populous areas, and (d) 2023 Great Salt Lake Basin with location in USA.
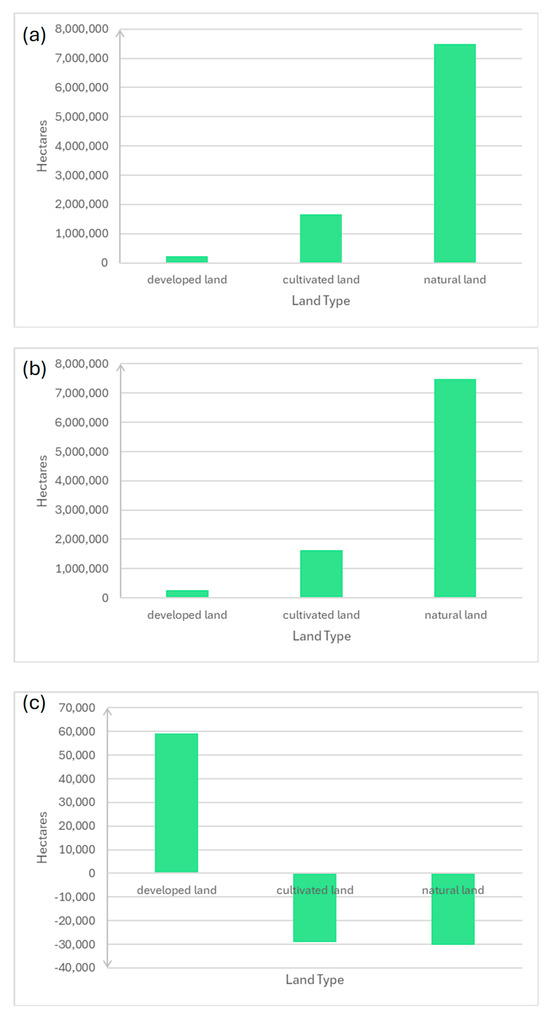
Figure 6.
Bar charts showing (a) area by land type in 2008, (b) area by land type in 2023, and (c) change in area by land type from 2008 to 2023 for the whole Great Salt Lake Basin.
Much more natural land than agricultural land was converted to developed areas, and Figure 7 shows a visualization of the most common land classes to be changed to urban developments. Out of the six most commonly developed land classes, only one (alfalfa) was irrigated farmland. Over 35,000 hectares of shrubland became urban development compared to about 11,000 hectares of alfalfa. Referring again to Table 1, alfalfa’s water requirement of 0.6636 m ha−1 is 0.2897 m ha−1 greater than developed land’s average water requirement (0.3876 m ha−1). This results in a savings of 0.2897 m ha−1 of water from converting alfalfa to developed land—the water savings comes out to 3293 m3. In comparison, shrubland uses no irrigation water, so developing shrubland increases water consumption by 0.3876 m ha−1, which resulted in an increase of 10,313 m3 of water use. This data shows that, on the whole, developing land has not led to saving water.
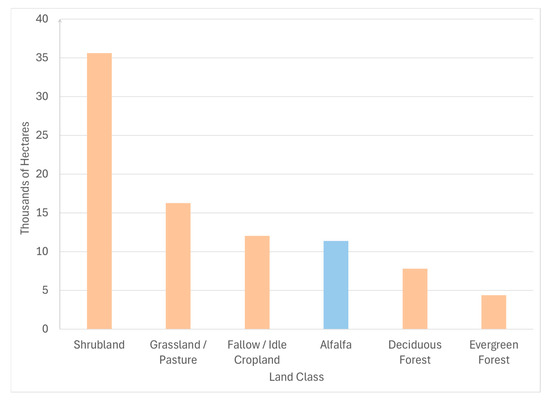
Figure 7.
Land classes most converted to developed land for the whole Great Salt Lake Basin (2008–2023), with the area of conversions shown in hectares. Beige bars show net increases in water consumption by conversion to developed urban land and Blue bars show net decreases in water consumption by conversion to developed urban land.
The role of urban development in rising water consumption is emphasized again in Figure 8, which presents two bar charts: (a) shows the net change in area by land class from 2008 to 2023, and (b) shows the resulting impact on irrigation and municipal water use in the GSL basin. Only the 17 most abundant land classes are included. It should be noted that shrubland increased by far more than any other land class, and grassland/pasture decreased more than any other land class. However, neither shrubland nor grassland/pasture are included in Figure 8 because they significantly affect the scale of the chart, and any change in water consumption will already be reflected in developed land or the crops included. Conversion to developed land directly caused greater increases in water consumption than any other human activity from 2008 to 2023. A slight rise in alfalfa production significantly increased water consumption as well. In Figure 9a,b, some natural land classes are shown to have also produced an increase in water use. This is because converting natural land uses, which use no municipal or irrigation water, to developed land results in an increase in water use. Thus, a decline in a natural land class results in an increase in overall water use because the land is now being developed or farmed. Almost all natural land classes decreased in area. Different crops may have increased, like alfalfa, or decreased, such as wheat. This likely depends on the productivity and profitability of the individual crop, but agriculture became less prevalent overall.
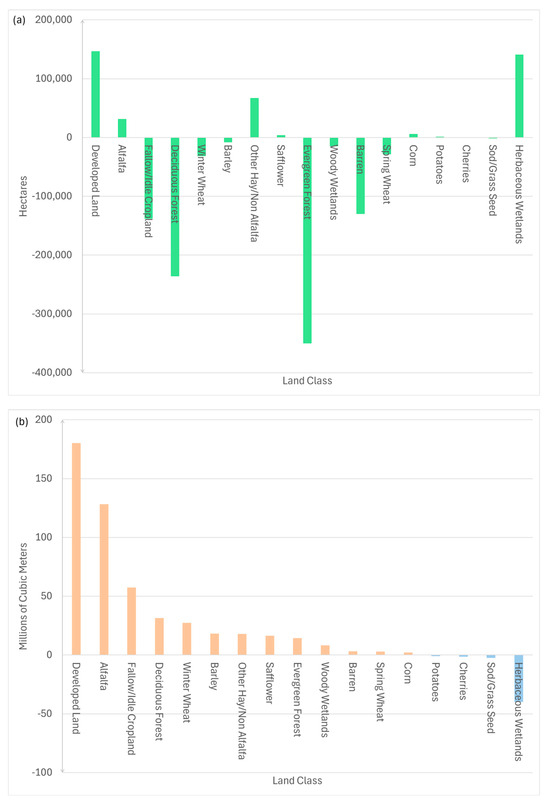
Figure 8.
Comparison of (a) changes in land class area (hectares) from 2008 to 2023 with (b) resulting increases or decreases in water consumption (cubic meters in millions) from 2008 to 2023 for the whole Great Salt Lake Basin. In (b) Beige bars show net increases in water consumption by conversion to developed urban land and Blue bars show net decreases in water consumption by conversion to developed urban land.
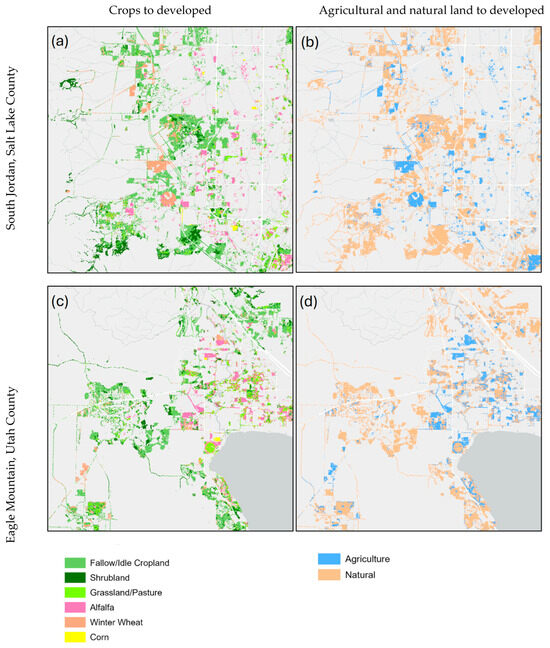
Figure 9.
Selected areas portraying most frequent types of land converted (2008–2023) to developed land in (a,b) South Jordan and (c,d) Eagle Mountain.
While agriculture, and alfalfa specifically, receives substantial criticism for its irrigation water use [25,41,42], this study found that urban development also needs to be recognized for its large contribution to water usage despite improving urban water efficiency [30,38]. The change detection analysis established that natural land was more commonly converted to developed land than agricultural land, causing urban development to be the greatest contributor to increases in human water use from 2008 to 2023. This is not to say that developed areas use more total water than agriculture or more water per hectare, because as with other studies, ours identified that agricultural practices require significantly more water per hectare. In fact, agriculture was found to make up 85% of water consumption within the GSL basin, compared to 75% reported by Utah’s Division of Natural Resources [39].
Alfalfa remains a concern for irrigation water use because its water requirement is so high. While it is true that converting alfalfa fields into suburban or urban areas does reduce water usage, these water savings are far outweighed by the additional strain placed on the water supply by the conversion of areas of natural land use to developed land classes. Also, there has been an overall increase in alfalfa production in the GSL basin. Whether this is a result of this irrigated crop performing better during drought conditions than other crops is not certain. However, if not, policies to restrict expansion of the alfalfa area in the GSL should be considered.
Since urban development of land is key to fluctuations in human water use, analyzing where land is being developed and what land use is being converted into developed land provides significant insight into understanding water use within the GSL basin. The cities of South Jordan and Eagle Mountain experienced major growth between 2008 and 2023. Figure 9 portrays these two areas and focuses on development. As seen in Figure 9, much more natural land was developed than agricultural land. Additionally, the developed winter wheat fields in South Jordan (Figure 9a,c) also likely represent a net increase in water use since the water requirement for winter wheat is slightly lower than that for developed areas (Table 1). There is no clear spatial pattern to the development for South Jordan and Eagle Mountain other than natural land being favored for conversion to developed land over agricultural land. It can be inferred, then, that market forces drove the development of these areas to a greater extent than planning. Strain on the human water supply was not likely accounted for in development plans if this is the case.
3.4. Spatial Differences in Land Use Land Class Changes
To examine spatial differences in LULC changes within the GSL basin, we calculated LULC changes for six counties within the basin: Salt Lake, Utah, Davis, Cache, and Box Elder counties in Utah, and Franklin County, Idaho. These counties are intended to cover the full range of urbanization levels within the basin, with Salt Lake County being the most urban and Franklin County being the most rural. The patterns observed in these results could help inform urban land use policies for different counties. The areas that were converted to urban development within each county for 2008–2023 are displayed in Figure 10. The associated effects on water use appear in Figure S3 in Supplemental Information. Throughout all six counties, the most common land classes converted to developed land were shrubland, fallow/idle cropland, and grassland/pasture, all of which use no water. For agricultural conversions to developed land, alfalfa was converted to developed land most often in Franklin County, Idaho; Cache County, and Utah County. The rural counties tended to develop more agricultural land, particularly in the highest traffic areas. This could be why the belief that ‘most land being developed is agricultural,’ is common—because that is often the case in rural towns. Most of the natural-to-developed land conversions occurred in less populated or unpopulated areas. Urban counties, including Utah County, despite its tendency to build on alfalfa fields, developed significantly more natural land than agricultural land. From these data, all counties consumed more water annually by 2023 than they did in 2008 due to urban development.
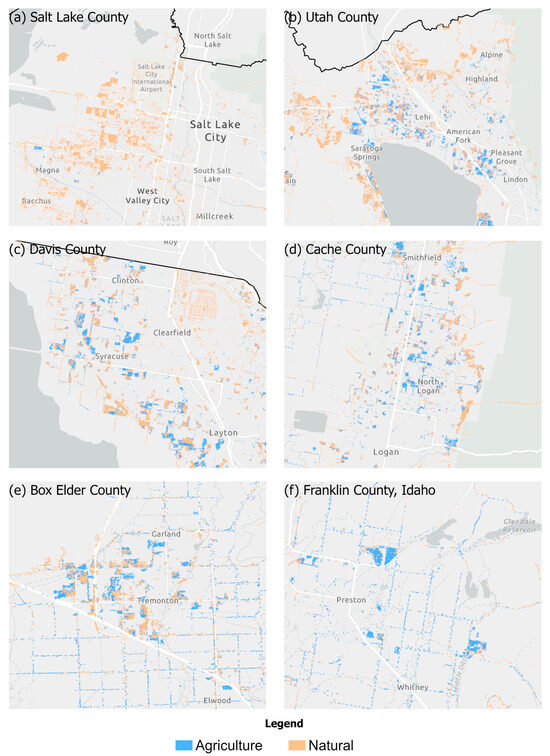
Figure 10.
Conversion to developed land from natural and agricultural land (2008–2023) in the most developed sections of (a) Salt Lake County, (b) Utah County, (c) Davis County, (d) Cache County, (e) Box Elder County, and (f) Franklin County, Idaho.
In terms of all LULC change, the water use shows proportionally greater increases for 2008–2023 than decreases. In Figure 11, pie charts depict the proportions of LULC changes causing an increase or decrease in water usage rates for this period. New agricultural land, in addition to new urban developments, is included in these statistics, and this results in a greater disparity between water-increasing and water-decreasing LULC conversions. LULC conversions that result in water savings mainly include agriculture to developed land conversions and agriculture to natural land conversions. Again, each county’s annual water consumption rates were much higher in 2023 than in 2008. Salt Lake County and Utah County had the greatest increase in developed area with an increase in water use (over 10,000 hectares each). Franklin County, Idaho had the least amount of increased water use in terms of actual area and relative increase (1584 hectares, 61.23%). There were many areas where significant portions of alfalfa were converted into developed land, like in Franklin and Cache counties, but if there are any areas where the resulting water savings from alfalfa reduction outweighed the additional water usage caused by natural-to-developed land conversions, they were rare. Accordingly, urban development of land should not be viewed as being a solution to water scarcity in the GSL basin, even for highly agricultural counties, because it is very likely that this is not the case. It is much more likely that urban development has resulted in falling water levels in the GSL.
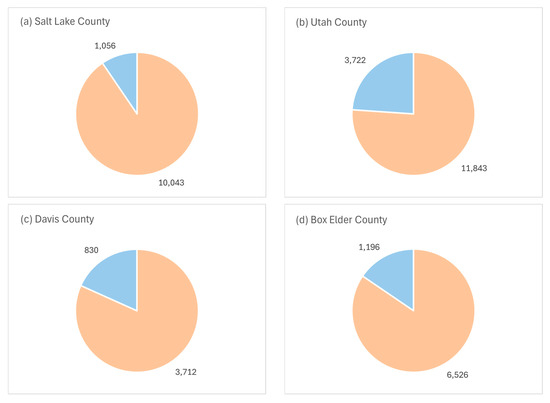
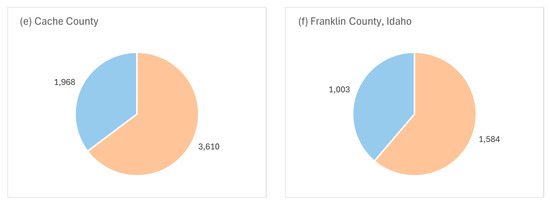
Figure 11.
Proportion of land class changes in hectares contributing to increases or decreases in total water consumption (2008–2023) by county for (a) Salt Lake, (b) Utah, (c) Davis, (d) Cache, (e) Box Elder, and (f) Franklin, Idaho. Beige sectors show net increases in water consumption by conversion to developed urban land and Blue sectors show net decreases in water consumption by conversion to developed urban land.
3.5. Study Limitations
Change detection can offer an efficient method for estimating water consumption generally. The water requirements for crops and average municipal water usage may poorly reflect actual water usage in small areas where industrial activities that use a lot of water are concentrated. In particular, the municipal water use data, provided by Utah’s Division of Natural Resources, was for 2015–2020 [37] and thus may have overestimated average municipal use, as expansion in the number of data centers in the region has occurred in recent years and the Bingham Copper Mine has also expanded in recent years. There are now two large data centers in Eagle Mountain, two in Ogden, two in Orem, and multiple in Salt Lake City, with one data center in each of Nephi, Santaquin, and Evanston, Wyoming [50]. To avoid this limitation in future work, we plan to explicitly investigate the large differences in water consumption associated with different urban activities and try to obtain water use figures for different degrees of urban development and urban open space. The latter, for example, includes parks and golf courses, which consume large amounts of irrigation water to sustain turfgrass in Utah.
The municipal water use analysis is likely most accurate for 2015–2020, and the agricultural irrigation water use data are also likely most accurate for more recent and average years, given that these calculations were performed using Utah State University’s current average irrigation recommendations. Despite the limitations with the water use calculations, we believe they become sufficiently accurate when generalized over a broad area such as the GSL basin, providing clear trends, actionable data, and general magnitudes of water consumed by different land uses. Also, comparing land types based on whether they on average use more or less water than urban development gives insight into whether conversion of certain land types into urban development has resulted in a net increase or decrease in water use and thus levels of water in the GSL. Applying water data to LULC areas derived from satellite imagery costs very little in comparison to surveying and metering actual water consumption. The accuracy of this study could be improved by a survey to further assess classification accuracy compared to previous studies [56,57], reclassifying roads and other developed areas that do not use water, and by further exploring municipal water data to differentiate between water consumption rates of high/medium/low intensity development as well as developed open space.
4. Conclusions
This study aimed to determine the major sources of decrease in water reaching the GSL. Other than drought, which was clearly illustrated with the climate data in lowering the amount of water reaching the GSL, urban development and alfalfa are the two main contributors to decreased water reaching the GSL. This study shows that urban development has contributed to the strain on water supply in the GSL basin while it has been experiencing increased temperatures and lower precipitation levels from 1985 to 2023. Enough new urban developments have been constructed on once natural or wild land to counteract any water savings that have resulted from converting farmland to urban land. Also, much low- and medium-density urban development has been intensified into high-density urban development, which we assume uses significantly more water. Future work investigating the water use for different densities of urban development will be crucial in guiding sustainable urban planning policies. This work should address questions such as, is water consumption per capita or per hectare greater for apartment complexes with many kitchens and bathrooms per square hectare or for standard suburban single-family dwellings with quarter-acre lots with irrigated turfgrass? Answering these questions could be key in determining the urban development policies for Utah and should determine whether certain types of further development in particular parts of the GSL basin should be restricted or which locations water-saving strategies should be enforced in urban areas.
Such future analysis should also be key in determining appropriate incentives and disincentives for various practices that reduce or increase household, commercial, and industrial water use. Incentives are already in place in several cities for installing low-flow toilets, smart sprinkler systems, xeriscaping parts of lots, and other water-saving practices, but investigation of water harvesting and reuse of gray water needs more attention, especially for urban green infrastructure that is irrigated by municipalities. Also requiring investigation is whether the water savings from changing turfgrass residential lots to xeriscaping would be substantial or whether such action would be counterproductive by increasing the urban heat island effect and evaporation rates and requiring increases in the cooling budget.
Our study is consistent with previous findings and shows that urban land still uses only a fraction, as little as 15%, of the water supply in the GSL basin, while agriculture consumes the majority (85%). Sizeable reductions in the area of agricultural land mean that most crops are produced less prevalently now than in the past. Safflower, corn, and alfalfa are exceptions to this. Expansions in the alfalfa land cover class mean that over 125 million m3 more water went towards alfalfa production in 2023 than in 2008. This suggests that if the GSL is to be preserved, agricultural policies regarding which crops are grown may need to be reviewed, or significant incentives need to be given to growers who use variable rate irrigation or reuse gray water where possible. The rise in water usage from the expansion of safflower, corn, and alfalfa areas was surpassed only by developed areas, which added over 170 million m3 of water to their annual demand. Changing land use has the potential to drastically impact water consumption and water levels. From 2008 to 2023, water consumption increased primarily when natural land was converted to urban development or farmland. Water consumption was reduced when areas classified as crops with high water requirements (alfalfa, orchard fruits, safflower, hay, and corn) were converted to urban areas or were abandoned as farmland. Out of land use changes that affected water supply, conversion of natural land to urban development was most prominent, as shrubland, fallow/idle cropland, and grassland were consistently being developed in each area we looked at.
Our study has shown that in spite of some limitations, land use/land change analysis associated with water use change calculations can be a cost-effective way to provide many insights into the main culprits other than climate change for decreasing water levels in major saline lakes around the world and to inform urban planning and agricultural policies that minimize impacts of human water use on these key natural resources. The suggestions for incentives and agricultural policies that we have made for the GSL basin could be relevant in increasing water flow to struggling major lakes in other locations, as could results from the future proposed work.
Supplementary Materials
The following supporting information can be downloaded at: https://www.mdpi.com/article/10.3390/environments12100381/s1.
Author Contributions
Conceptualization, R.K., T.H. and L.N.; methodology, R.K., T.H. and L.N.; software, R.K., T.H. and L.N.; validation, T.H. and L.N.; formal analysis, T.H. and L.N.; investigation, R.K., T.H. and L.N.; resources, R.K.; data curation, T.H. and L.N.; writing—original draft preparation, T.H. and R.K.; writing—review and editing, T.H., R.K. and L.N.; visualization, T.H. and L.N.; supervision, R.K.; funding acquisition, R.K. All authors have read and agreed to the published version of the manuscript.
Funding
This research received no external funding.
Data Availability Statement
The data presented in this study are available in from: https://earthexplorer.usgs.gov/ (accessed on 12 October 2025). The National Land Cover Dataset (NLCD) and from https://nassgeodata.gmu.edu/CropScape/ (accessed on 12 October 2025).
Acknowledgments
This research was made possible by a generous Andrus Family Experiential Learning Grant awarded through the College of Family, Home, and Social Sciences at Brigham Young University.
Conflicts of Interest
The authors declare no conflicts of interest.
References
- Rakhmanov, S.; Fayzullaeva, N. Aral Sea Crisis and Water Management in Central Asia. BRICS Law J. 2025, 12, 151–166. [Google Scholar]
- Goudie, A. Dust storms and ephemeral lakes. Desert 2018, 23, 153–164. [Google Scholar]
- Cahill, T.A.; Gill, T.E.; Reid, J.S.; Gearhart, E.A.; Gillette, D.A. Saltating particles, playa crusts and dust aerosols at Owens (dry) Lake, California. Earth Surf. Process. Landf. 1996, 21, 621–639. [Google Scholar] [CrossRef]
- Frie, A.L.; Dingle, J.H.; Ying, S.C.; Bahreini, R. The effect of a receding saline Lake (the Salton Sea) on airborne particulate matter composition. Environ. Sci. Technol. 2017, 51, 8283–8292. [Google Scholar] [CrossRef]
- Saint-Armand, P.; Mathews, L.A.; Gaines, C.; Roger, R. Dust Storms from Owens and Mono Valleys, California; Report No. NWC-TP-6731; Naval Weapons Center: China Lake, CA, USA, 1986. [Google Scholar]
- Ono, D.; Kiddoo, P.; Howard, C.; Davis, G.; Richmond, K. Application of a combined measurement and modeling method to quantify windblown dust emissions from the exposed playa at Mono Lake, California. J. Air Waste Manag. Assoc. 2011, 61, 1036–1045. [Google Scholar] [CrossRef] [PubMed][Green Version]
- Gill, T.E. Eolian sediments generated by anthropogenic disturbance of playas: Human impacts on the geomorphic system and geomorphic impacts on the human system. Geomorphology 1996, 17, 207–228. [Google Scholar] [CrossRef]
- AghaKouchak, A.; Norouzi, H.; Madani, K.; Mirchi, A.; Azarderakhsh, M.; Nazemi, A.; Nasrollahi, N.; Farahmand, A.; Mehran, A.; Hasanzadeh, E. Aral Sea syndrome desiccates Lake Urmia: Call for action. J. Great Lakes Res. 2015, 41, 307–311. [Google Scholar] [CrossRef]
- Indoitu, R.; Kozhoridze, G.; Batyrbaeva, M.; Vitkovskaya, I.; Orlovsky, N.; Blumberg, D.; Orlovsky, L. Dust emission and environmental changes in the dried bottom of the Aral Sea. Aeolian Res. 2015, 17, 101–115. [Google Scholar] [CrossRef]
- Karami, S.; Hamzeh, N.H.; Kaskaoutis, D.G.; Rashki, A.; Alam, K.; Ranjbar, A. Numerical simulations of dust storms originated from dried lakes in central and southwest Asia: The case of Aral Sea and Sistan Basin. Aeolian Res. 2021, 50, 100679. [Google Scholar] [CrossRef]
- Abuduwaili, J.; Gabchenko, M.V.; Xun, J. Eolian transport of salts-a case study in the area of Lake Ebinur (Xinjiang, Northwest China). J. Arid Environ. 2008, 72, 1843–1852. [Google Scholar] [CrossRef]
- Salameh, E.; El-Naser, H. Restoring the Shrinking Dead Sea—The Environmental Imperative—. In Climatic Changes and Water Resources in the Middle East and North Africa; Zereini, F., Hötzl, H., Eds.; Environmental Science and Engineering; Springer: Berlin/Heidelberg, Germany, 2008. [Google Scholar]
- Satgé, F.; Espinoza, R.; Zolá, R.P.; Roig, H.; Timouk, F.; Molina, J.; Garnier, J.; Calmant, S.; Seyler, F.; Bonnet, M.-P. Role of Climate Variability and Human Activity on Poopó Lake Droughts Between 1990 and 2015 Assessed Using Remote Sensing Data. Remote Sens. 2017, 9, 218. [Google Scholar] [CrossRef]
- Abbott, B.W.; Baxter, B.K.; Busche, K.; de Freitas, L.; Frei, R.; Gomez, T.; Karren, M.A.; Buck, R.L.; Price, J.; Frutos, S.; et al. Emergency Measures Needed to Rescue Great Salt Lake from Ongoing Collapse. 2023. Available online: https://pws.byu.edu/GSL%20report%202023 (accessed on 30 May 2024).
- Metzger, J.; Nied, M.; Corsmeir, U.; Kleffmann, J.; Kottmeier, C. Dead Sea evaporation, energy budget, Priestly-Taylor and penman estimates. Hydrol. Earth Sys. Sci. 2018, 22, 1135–1155. [Google Scholar] [CrossRef]
- Vey, S.; Al-Halbouni, D.; Haghighi, M.H.; Alshawaf, F.; Vüllers, J.; Güntner, A.; Dick, G.; Ramatschi, M.; Teatini, P.; Wickert, J.; et al. Delayed subsidence of the Dead Sea shore due to hydro-meteorological changes. Sci. Rep. 2021, 11, 13518. [Google Scholar] [CrossRef]
- Levy, D.B.; Schramke, J.A.; Esposito, K.J.; Erickson, T.A.; Moore, J.C. The shallow ground water chemistry of arsenic, fluorine, and major elements: Eastern Owens Lake, California. Appl. Geochem. 1999, 14, 53–65. [Google Scholar] [CrossRef]
- Wu, N.; Ge, Y.; Abuduwaili, J.; Issanova, G.; Saparov, G. Insights into variations and potential long-range transport of atmospheric aerosols from the Aral Sea basin in Central Asia. Remote Sens. Lett. 2022, 14, 3201. [Google Scholar] [CrossRef]
- Utah Division of Water Resources. 2025. Available online: https://water.utah.gov/great-salt-lake/#:~:text=Great%20Salt%20Lake%20is%20the,between%20North%20and%20South%20America (accessed on 1 October 2025).
- Rusnak, K.; Smith, P.; Moss, S.; Wester, M.; Grammar, A.; Hunt, H. Understanding the Great Salt Lake Shrinkage: Stakeholders, Current Efforts, and Research Gaps. 2024. Available online: https://ballardcenter.byu.edu/00000196-caec-dd5d-a7de-dfeeb5280000/the-current-state-of-great-salt-lake (accessed on 30 August 2025).
- Huggett, R.; Shuttleworth, E. Fundamentals of Geomorphology, 5th ed.; Routledge: London, UK, 2023; p. 624. [Google Scholar]
- Utah Geological Survey. Commonly Asked Questions About Utah’s Great Salt Lake & Lake Bonneville—Utah Geological Survey. 2023. Available online: https://geology.utah.gov/popular/great-salt-lake/commonly-asked-questions/#toggle-id-12 (accessed on 15 July 2025).
- NASA Salinity: Role of Salt. Available online: https://salinity.oceansciences.org/learn-salt.htm (accessed on 15 August 2025).
- Brooks, P.D.; Chorover, J.; Fan, Y.; Godsey, S.E.; Maxwell, R.M.; McNamara, J.P.; Tague, C. Hydrological partitioning in the critical zone: Recent advances and opportunities for developing transferable understanding of water cycle dynamics. Water Resour. Res. 2015, 51, 6973–6987. [Google Scholar] [CrossRef]
- Singh, M. Last nail in the coffin: Utah’s Great Salt Lake on verge of collapse. The Guardian, 10 January 2023. Available online: https://www.theguardian.com/environment/2023/jan/10/utah-great-salt-lake-collapse-imminent (accessed on 15 August 2025).
- Wurtsbaugh, W.A.; Sima, S. Contrasting Management and Fates of Two Sister Lakes: Great Salt Lake (USA) and Lake Urmia (Iran). Water 2022, 14, 3005. [Google Scholar] [CrossRef]
- Harvey, C. Climate Change Has Helped Fuel a Megadrought in the Southwest. E&E News, 17 April 2020. Available online: https://www.scientificamerican.com/article/climate-change-has-helped-fuel-a-megadrought-in-the-southwest/ (accessed on 15 August 2025).
- Coats, S.; Smerdon, J.E.; Cook, B.I.; Seager, R. Are Simulated Megadroughts in the North American Southwest Forced? J. Clim. 2015, 28, 124–142. [Google Scholar] [CrossRef]
- Williams, A.P.; Cook, E.R.; Smerdon, J.E.; Cook, B.I.; Abatzoglou, J.T.; Bolles, K.; Baek, S.H.; Badger, A.M.; Livne, B. Large contribution from anthropogenic warming to an emerging North American megadrought. Science 2020, 368, 314–318. [Google Scholar] [CrossRef]
- Wurstbaugh, W.; Miller, C.; Null, S.E.; Wilcock, P.R.; Hahnenberger, M.; Howe, F.P. Impacts of Water Development on Great Salt Lake and the Wasatch Front; Working Paper; Watershed Sciences Faculty Publications: Logan, UT, USA, 2016. [Google Scholar]
- Rupke, A. Utah’s Potash Resources and Activity. Utah Geological Survey. 2012. Available online: https://geology.utah.gov/map-pub/survey-notes/utahs-potash-resources-and-activity/ (accessed on 15 August 2025).
- Brine Shrimp Harvests. Utah Divison of Wildlife Resources. 2023. Available online: https://wildlife.utah.gov/gslep/harvests.html (accessed on 15 August 2025).
- Bioeconomics, Inc. Economic Significance of the Great Salt Lake to the State of Utah. Research Report Prepared for State of Utah Great Salt Lake Advisory Council. 2012. Available online: https://lf-public.deq.utah.gov/WebLink/ElectronicFile.aspx?docid=392799&eqdocs=DWQ-2012-006864&dbid=0&repo=Public (accessed on 15 August 2025).
- Baxter, B.K.; Butler, J.K. Great Salt Lake Biology: A Terminal Lake in a Time of Change; Springer: Berlin/Heidelberg, Germany, 2020; p. 947. [Google Scholar]
- Steenburgh, W.J.; Massey, J.D.; Painter, T.H. Episodic Dust Events of Utah’s Wasatch Front and Adjoining Region. J. Appl. Meteor. Climatol. 2012, 51, 1654–1669. [Google Scholar] [CrossRef]
- Lang, O.; Mallia, D.; Skiles, M. The Shrinking Great Salt Lake Contributes to Record High Dust-on-Snow Deposition in the Wasatch Mountains During the 2022 Snowmelt Season. Environ. Res. Lett. 2023, 18, 064045. [Google Scholar] [CrossRef]
- Brooks, P.D.; Gelderloos, A.; Wolf, M.A.; Jamison, L.R.; Strong, C.; Solomon, D.K.; Bowen, G.J.; Burian, S.; Tai, X.; Arens, S.; et al. Groundwater-mediated memory of past climate controls water yield in snowmelt-dominated catchments. Water Resour. Res 2021, 57, e2021WR030605. [Google Scholar] [CrossRef]
- Sowby, R.B. Terminus: A Hydrobiographic Journey of Water Management in the Great Salt Lake Basin; Twin Peaks Press: American Fork, UT, USA, 2025. [Google Scholar]
- Utah Division of Natural Resources, 2021 Water Resources Plan (Salt Lake City: Utah Department of Natural Resources). 2021. Available online: https://water.utah.gov/2021waterplan/ (accessed on 15 August 2025).
- Barker, B.; Yost, M.; Zesiger, C. Agricultural Irrigated Land and Irrigation Water Use in Utah; Utah State University Extension: Logan, UT, USA, 2022; Available online: https://extension.usu.edu/irrigation/research/agricultural-irrigated-land-and-water-use (accessed on 1 July 2024).
- Owen, D. Where the Water Goes: Life and Death Along the Colorado River; Riverhead: New York, NY, USA, 2017; p. 288. [Google Scholar]
- Maffly, B.; Eddington, M. One Crop Uses More Than Half of Utah’s Water, Here’s Why. Salt Lake Tribune, 13 March 2023. Available online: https://www.sltrib.com/news/environment/2022/11/24/one-crop-uses-more-than-half/ (accessed on 1 August 2025).
- Zesiger, C.; Barker, B.; Null, S.; Creech, E.; Yost, M.; Larsen, R.; Dallin, J. Agriculture Water Use and Economic Value in the Great Salt Lake Basin [Fact Sheet]; Utah State University Extension: Logan, UT, USA, 2023. [Google Scholar]
- Richter, B.; Kendall, B.; Dugan, J.; Getacho, G.; LaRoe, N.; Moro, B.; Rynne, T.; Tahamtani, M.; Townsend, A. Decoupling Urban Water use and Growth in Response to Water Scarcity. Water 2020, 12, 2868. [Google Scholar] [CrossRef]
- Perlich, P.S.; Hollingshaus, M.; Harris, E.R.; Tennert, J.; Hogue, M.T. Utah’s Long-Term Demographic and Economic Projections Summary; Kem C. Gardner Policy Institute, The University of Utah: Salt Lake City, UT, USA, 2017; Available online: https://gardner.utah.edu/wp-content/uploads/Projections-Brief-Final.pdf (accessed on 1 July 2024).
- Kem, C. Gardner Policy Institute, Utah Population Reaches Estimated 3,343,552 People, Net In-Migration Surges. In Census 2020: Utah Fastest Growing State in the US; Kem C. Gardner Policy Institute, The University of Utah: Salt Lake City, UT, USA, 2021; Available online: https://gardner.utah.edu/news/utah-population-reaches-estimated-3343552-people-net-in-migration-surges/#:~:text=Gardner%20Policy%20Institute%2C%20indicate%20the,is%20the%20highest%20since%202017 (accessed on 27 August 2025).
- Banta, M. Utah Cities Added Hundreds of Thousands of People in a Decade. Salt Lake Tribune, 4 August 2023. Available online: https://www.sltrib.com/news/2023/08/04/most-utahs-growth-happens-1-its/ (accessed on 13 April 2024).
- Kerry, R.; Ingram, B.; Sanders, K.; Henrie, A.; Hammond, K.; Hawks, D.; Hansen, N.; Jensen, R.; Hopkins, B. Precision Turfgrass Irrigation: Capturing Spatial Soil Moisture Patterns with ECa and Drone Data. Agronomy 2024, 14, 1238. [Google Scholar] [CrossRef]
- Gibson, J.; Bryan, K.; Guo, Y. Effects of Relaxed Minimum Pipe Diameters on Fire Flow, Cost, and Water Quality Indicators in Drinking Water Distribution Networks. J. Water Resour. Plann. Manag. 2020, 146, 8. [Google Scholar] [CrossRef]
- Yañez-Barnuevo, M. Data Centers and Water Consumption. 2025. Available online: https://www.eesi.org/articles/view/data-centers-and-water-consumption (accessed on 2 October 2025).
- Lee, L.Y.; Kerry, R.; Ingram, B.; Golden, C.S.; LeMonte, J.J. Investigating the Spatial Patterns of Heavy Metals in Topsoil and Asthma in theWestern Salt Lake Valley, Utah. Environments 2024, 11, 223. [Google Scholar] [CrossRef]
- NOAA. 2025. Available online: https://www.ncei.noaa.gov/ (accessed on 5 October 2025).
- U.S. Geological Survey (USGS). Annual NLCD Collection 1 Science Products: U.S. Geological Survey Data Release. 2024. Available online: https://www.usgs.gov/data/annual-national-land-cover-database-nlcd-collection-1-products (accessed on 12 October 2025).
- Anderson, J.R.; Hardy, E.E.; Roach, J.T.; Witmer, R.E. A Land Use and Land Cover Classification System for Use with Remote Sensor Data; Professional Paper 964; U.S. Geological Survey: Reston, VA, USA, 1976.
- ArcGIS Pro Overview. Esri. Available online: https://www.esri.com/en-us/arcgis/products/arcgis-pro/overview (accessed on 9 August 2025).
- Wickham, J.; Stehman, S.V.; Sorenson, D.G.; Gass, L.; Dewitz, J.A. Thematic accuracy assessment of the NLCD 2016 land cover for the conterminous United States. Remote Sens. Environ. 2021, 257, 112357. [Google Scholar] [CrossRef]
- Cropscape—Cropland Data Layer. Nassgeodata. Center for Spatial Science and Systems, George Mason University. 27 February 2025. Available online: https://nassgeodata.gmu.edu/CropScape/ (accessed on 1 July 2024).
- Download Municpal and Industrial Water Use Data. Utahdnr.Org. Utah Division of Natural Resources. Available online: https://dwre-utahdnr.opendata.arcgis.com/pages/municipal-and-industrial-data (accessed on 1 August 2024).
- Normalized Difference Vegetation Index. Earth Data; NASA: Washington, DC, USA, 2025. Available online: https://www.earthdata.nasa.gov/topics/land-surface/normalized-difference-vegetation-index-ndvi (accessed on 3 October 2025).
- Remote Sensing Phenology. NDVI, the Foundation for Remote Sensing Phenology. 2018. Available online: https://www.usgs.gov/special-topics/remote-sensing-phenology/science/ndvi-foundation-remote-sensing-phenology (accessed on 1 September 2025).
Disclaimer/Publisher’s Note: The statements, opinions and data contained in all publications are solely those of the individual author(s) and contributor(s) and not of MDPI and/or the editor(s). MDPI and/or the editor(s) disclaim responsibility for any injury to people or property resulting from any ideas, methods, instructions or products referred to in the content. |
© 2025 by the authors. Licensee MDPI, Basel, Switzerland. This article is an open access article distributed under the terms and conditions of the Creative Commons Attribution (CC BY) license (https://creativecommons.org/licenses/by/4.0/).